the spdep package - university of...
TRANSCRIPT
The spdep PackageAugust 19, 2006
Version 0.3-30
Date 2006-08-14
Title Spatial dependence: weighting schemes, statistics and models
Author Roger Bivand <[email protected]>, with contributions by Luc Anselin, Olaf Berke,Andrew Bernat, Marilia Carvalho, Yongwan Chun, Carsten Dormann, Stéphane Dray, ReinHalbersma, Nicholas Lewin-Koh, Hisaji Ono, Pedro Peres-Neto, Michael Tiefelsdorf, andDanlin Yu.
Maintainer Roger Bivand <[email protected]>
Depends R (>= 2.2.0), tripack, maptools (>= 0.5-4), SparseM (>= 0.54), boot
Description A collection of functions to create spatial weights matrix objects from polygoncontiguities, from point patterns by distance and tesselations, for summarising these objects, andfor permitting their use in spatial data analysis; a collection of tests for spatial autocorrelation,including global Moran’s I, Geary’s C, Hubert/Mantel general cross product statistic, EmpiricalBayes estimates and Assunção/Reis Index, Getis/Ord G and multicoloured join count statistics,local Moran’s I and Getis/Ord G, saddlepoint approximations for global and local Moran’s I; andfunctions for estimating spatial simultaneous autoregressive (SAR) lag and error models,weighted and unweighted SAR and CAR spatial regression models, semi-parametric and Moraneigenvector spatial filtering, GM SAR error models, and generalized spatial two stage leastsquares models.
License GPL version 2 or newer
R topics documented:oldcol . . . . . . . . . . . . . . . . . . . . . . . . . . . . . . . . . . . . . . . . . . . . 3EBImoran.mc . . . . . . . . . . . . . . . . . . . . . . . . . . . . . . . . . . . . . . . . 4EBest . . . . . . . . . . . . . . . . . . . . . . . . . . . . . . . . . . . . . . . . . . . . 6EBlocal . . . . . . . . . . . . . . . . . . . . . . . . . . . . . . . . . . . . . . . . . . . 7GMerrorsar . . . . . . . . . . . . . . . . . . . . . . . . . . . . . . . . . . . . . . . . . 9LR.sarlm . . . . . . . . . . . . . . . . . . . . . . . . . . . . . . . . . . . . . . . . . . 11ME . . . . . . . . . . . . . . . . . . . . . . . . . . . . . . . . . . . . . . . . . . . . . 12NY_data . . . . . . . . . . . . . . . . . . . . . . . . . . . . . . . . . . . . . . . . . . . 14SpatialFiltering . . . . . . . . . . . . . . . . . . . . . . . . . . . . . . . . . . . . . . . 15afcon . . . . . . . . . . . . . . . . . . . . . . . . . . . . . . . . . . . . . . . . . . . . 17airdist . . . . . . . . . . . . . . . . . . . . . . . . . . . . . . . . . . . . . . . . . . . . 18anova.sarlm . . . . . . . . . . . . . . . . . . . . . . . . . . . . . . . . . . . . . . . . . 19
1
2 R topics documented:
asMatrixCsrListw . . . . . . . . . . . . . . . . . . . . . . . . . . . . . . . . . . . . . . 20auckland . . . . . . . . . . . . . . . . . . . . . . . . . . . . . . . . . . . . . . . . . . . 21autocov_dist . . . . . . . . . . . . . . . . . . . . . . . . . . . . . . . . . . . . . . . . . 21baltimore . . . . . . . . . . . . . . . . . . . . . . . . . . . . . . . . . . . . . . . . . . 23boston . . . . . . . . . . . . . . . . . . . . . . . . . . . . . . . . . . . . . . . . . . . . 24bptest.sarlm . . . . . . . . . . . . . . . . . . . . . . . . . . . . . . . . . . . . . . . . . 26card . . . . . . . . . . . . . . . . . . . . . . . . . . . . . . . . . . . . . . . . . . . . . 27cell2nb . . . . . . . . . . . . . . . . . . . . . . . . . . . . . . . . . . . . . . . . . . . . 28choynowski . . . . . . . . . . . . . . . . . . . . . . . . . . . . . . . . . . . . . . . . . 29columbus . . . . . . . . . . . . . . . . . . . . . . . . . . . . . . . . . . . . . . . . . . 30Graph Components . . . . . . . . . . . . . . . . . . . . . . . . . . . . . . . . . . . . . 31diffnb . . . . . . . . . . . . . . . . . . . . . . . . . . . . . . . . . . . . . . . . . . . . 32dnearneigh . . . . . . . . . . . . . . . . . . . . . . . . . . . . . . . . . . . . . . . . . . 33droplinks . . . . . . . . . . . . . . . . . . . . . . . . . . . . . . . . . . . . . . . . . . 34edit.nb . . . . . . . . . . . . . . . . . . . . . . . . . . . . . . . . . . . . . . . . . . . . 35eigenw . . . . . . . . . . . . . . . . . . . . . . . . . . . . . . . . . . . . . . . . . . . . 36eire . . . . . . . . . . . . . . . . . . . . . . . . . . . . . . . . . . . . . . . . . . . . . 37errorsarlm . . . . . . . . . . . . . . . . . . . . . . . . . . . . . . . . . . . . . . . . . . 38geary . . . . . . . . . . . . . . . . . . . . . . . . . . . . . . . . . . . . . . . . . . . . 41geary.mc . . . . . . . . . . . . . . . . . . . . . . . . . . . . . . . . . . . . . . . . . . . 43geary.test . . . . . . . . . . . . . . . . . . . . . . . . . . . . . . . . . . . . . . . . . . 44getisord . . . . . . . . . . . . . . . . . . . . . . . . . . . . . . . . . . . . . . . . . . . 46globalG.test . . . . . . . . . . . . . . . . . . . . . . . . . . . . . . . . . . . . . . . . . 46graphneigh . . . . . . . . . . . . . . . . . . . . . . . . . . . . . . . . . . . . . . . . . 48hopkins . . . . . . . . . . . . . . . . . . . . . . . . . . . . . . . . . . . . . . . . . . . 50huddersfield . . . . . . . . . . . . . . . . . . . . . . . . . . . . . . . . . . . . . . . . . 50include.self . . . . . . . . . . . . . . . . . . . . . . . . . . . . . . . . . . . . . . . . . 51invIrM . . . . . . . . . . . . . . . . . . . . . . . . . . . . . . . . . . . . . . . . . . . . 52joincount.mc . . . . . . . . . . . . . . . . . . . . . . . . . . . . . . . . . . . . . . . . 53joincount.multi . . . . . . . . . . . . . . . . . . . . . . . . . . . . . . . . . . . . . . . 54joincount.test . . . . . . . . . . . . . . . . . . . . . . . . . . . . . . . . . . . . . . . . 56knearneigh . . . . . . . . . . . . . . . . . . . . . . . . . . . . . . . . . . . . . . . . . . 58knn2nb . . . . . . . . . . . . . . . . . . . . . . . . . . . . . . . . . . . . . . . . . . . 59lag.listw . . . . . . . . . . . . . . . . . . . . . . . . . . . . . . . . . . . . . . . . . . . 60lagsarlm . . . . . . . . . . . . . . . . . . . . . . . . . . . . . . . . . . . . . . . . . . . 61listw2sn . . . . . . . . . . . . . . . . . . . . . . . . . . . . . . . . . . . . . . . . . . . 64lm.LMtests . . . . . . . . . . . . . . . . . . . . . . . . . . . . . . . . . . . . . . . . . 65lm.morantest . . . . . . . . . . . . . . . . . . . . . . . . . . . . . . . . . . . . . . . . 67lm.morantest.sad . . . . . . . . . . . . . . . . . . . . . . . . . . . . . . . . . . . . . . 68localG . . . . . . . . . . . . . . . . . . . . . . . . . . . . . . . . . . . . . . . . . . . . 70localmoran . . . . . . . . . . . . . . . . . . . . . . . . . . . . . . . . . . . . . . . . . 72localmoran.sad . . . . . . . . . . . . . . . . . . . . . . . . . . . . . . . . . . . . . . . 73mat2listw . . . . . . . . . . . . . . . . . . . . . . . . . . . . . . . . . . . . . . . . . . 76moran . . . . . . . . . . . . . . . . . . . . . . . . . . . . . . . . . . . . . . . . . . . . 77moran.mc . . . . . . . . . . . . . . . . . . . . . . . . . . . . . . . . . . . . . . . . . . 78moran.plot . . . . . . . . . . . . . . . . . . . . . . . . . . . . . . . . . . . . . . . . . . 80moran.test . . . . . . . . . . . . . . . . . . . . . . . . . . . . . . . . . . . . . . . . . . 81nb2blocknb . . . . . . . . . . . . . . . . . . . . . . . . . . . . . . . . . . . . . . . . . 83nb2lines . . . . . . . . . . . . . . . . . . . . . . . . . . . . . . . . . . . . . . . . . . . 84nb2listw . . . . . . . . . . . . . . . . . . . . . . . . . . . . . . . . . . . . . . . . . . . 85nb2mat . . . . . . . . . . . . . . . . . . . . . . . . . . . . . . . . . . . . . . . . . . . 87nbdists . . . . . . . . . . . . . . . . . . . . . . . . . . . . . . . . . . . . . . . . . . . . 89

oldcol 3
nblag . . . . . . . . . . . . . . . . . . . . . . . . . . . . . . . . . . . . . . . . . . . . 89nb.set.operations . . . . . . . . . . . . . . . . . . . . . . . . . . . . . . . . . . . . . . 90nc.sids . . . . . . . . . . . . . . . . . . . . . . . . . . . . . . . . . . . . . . . . . . . . 91p.adjustSP . . . . . . . . . . . . . . . . . . . . . . . . . . . . . . . . . . . . . . . . . . 93plot.nb . . . . . . . . . . . . . . . . . . . . . . . . . . . . . . . . . . . . . . . . . . . . 94poly2nb . . . . . . . . . . . . . . . . . . . . . . . . . . . . . . . . . . . . . . . . . . . 95predict.sarlm . . . . . . . . . . . . . . . . . . . . . . . . . . . . . . . . . . . . . . . . 96probmap . . . . . . . . . . . . . . . . . . . . . . . . . . . . . . . . . . . . . . . . . . . 98read.gal . . . . . . . . . . . . . . . . . . . . . . . . . . . . . . . . . . . . . . . . . . . 99read.gwt2nb . . . . . . . . . . . . . . . . . . . . . . . . . . . . . . . . . . . . . . . . . 101residuals.sarlm . . . . . . . . . . . . . . . . . . . . . . . . . . . . . . . . . . . . . . . 102set.spChkOption . . . . . . . . . . . . . . . . . . . . . . . . . . . . . . . . . . . . . . . 103similar.listw . . . . . . . . . . . . . . . . . . . . . . . . . . . . . . . . . . . . . . . . . 104sp.correlogram . . . . . . . . . . . . . . . . . . . . . . . . . . . . . . . . . . . . . . . 105sp.mantel.mc . . . . . . . . . . . . . . . . . . . . . . . . . . . . . . . . . . . . . . . . 107spautolm . . . . . . . . . . . . . . . . . . . . . . . . . . . . . . . . . . . . . . . . . . . 108spdep . . . . . . . . . . . . . . . . . . . . . . . . . . . . . . . . . . . . . . . . . . . . 112spweights.constants . . . . . . . . . . . . . . . . . . . . . . . . . . . . . . . . . . . . . 112stsls . . . . . . . . . . . . . . . . . . . . . . . . . . . . . . . . . . . . . . . . . . . . . 113subset.listw . . . . . . . . . . . . . . . . . . . . . . . . . . . . . . . . . . . . . . . . . 115subset.nb . . . . . . . . . . . . . . . . . . . . . . . . . . . . . . . . . . . . . . . . . . 116summary.nb . . . . . . . . . . . . . . . . . . . . . . . . . . . . . . . . . . . . . . . . . 117summary.sarlm . . . . . . . . . . . . . . . . . . . . . . . . . . . . . . . . . . . . . . . 118is.symmetric.nb . . . . . . . . . . . . . . . . . . . . . . . . . . . . . . . . . . . . . . . 119tri2nb . . . . . . . . . . . . . . . . . . . . . . . . . . . . . . . . . . . . . . . . . . . . 120used.cars . . . . . . . . . . . . . . . . . . . . . . . . . . . . . . . . . . . . . . . . . . . 121write.nb.gal . . . . . . . . . . . . . . . . . . . . . . . . . . . . . . . . . . . . . . . . . 122
Index 124
oldcol Columbus OH spatial analysis data set - old numbering
Description
The COL.OLD data frame has 49 rows and 22 columns. The observations are ordered and num-bered as in the original analyses of the data set in the SpaceStat documentation and in Anselin,L. 1988 Spatial econometrics: methods and models, Dordrecht: Kluwer. Unit of analysis: 49neighbourhoods in Columbus, OH, 1980 data. In addition the data set includes a polylistobject polys.OLD with the boundaries of the neighbourhoods, a matrix of polygon centroidscoords.OLD, and COL.nb, the neighbours list as used in Anselin (1988).
Usage
data(oldcol)

4 oldcol
Format
This data frame contains the following columns:
AREA computed by ArcView
PERIMETER computed by ArcView
COLUMBUS. internal polygon ID (ignore)
COLUMBUS.I another internal polygon ID (ignore)
POLYID yet another polygon ID
NEIG neighborhood id value (1-49); conforms to id value used in Spatial Econometrics book.
HOVAL housing value (in $1,000)
INC household income (in $1,000)
CRIME residential burglaries and vehicle thefts per thousand households in the neighborhood
OPEN open space in neighborhood
PLUMB percentage housing units without plumbin
DISCBD distance to CBD
X x coordinate (in arbitrary digitizing units, not polygon coordinates)
Y y coordinate (in arbitrary digitizing units, not polygon coordinates)
AREA neighborhood area (computed by SpaceStat)
NSA north-south dummy (North=1)
NSB north-south dummy (North=1)
EW east-west dummy (East=1)
CP core-periphery dummy (Core=1)
THOUS constant=1,000
NEIGNO NEIG+1,000, alternative neighborhood id value
PERIM polygon perimeter (computed by SpaceStat)
Details
The row names of COL.OLD and the region.id attribute of COL.nb are set to columbus$NEIGNO.
Note
All source data files prepared by Luc Anselin, Spatial Analysis Laboratory, Department of Agri-cultural and Consumer Economics, University of Illinois, Urbana-Champaign, http://sal.agecon.uiuc.edu/datasets/columbus.zip.
Source
Anselin, Luc. 1988. Spatial econometrics: methods and models. Dordrecht: Kluwer Academic,Table 12.1 p. 189.
EBImoran.mc 5
EBImoran.mc Permutation test for empirical Bayes index
Description
An empirical Bayes index modification of Moran’s I for testing for spatial autocorrelation in a rate,typically the number of observed cases in a population at risk. The index value is tested by usingnsim random permutations of the index for the given spatial weighting scheme, to establish the rankof the observed statistic in relation to the nsim simulated values.
Usage
EBImoran.mc(n, x, listw, nsim, zero.policy = FALSE,alternative = "greater", spChk=NULL)
Arguments
n a numeric vector of counts of cases the same length as the neighbours list inlistw
x a numeric vector of populations at risk the same length as the neighbours list inlistw
listw a listw object created for example by nb2listwnsim number of permutationszero.policy if TRUE assign zero to the lagged value of zones without neighbours, if FALSE
assign NAalternative a character string specifying the alternative hypothesis, must be one of "greater"
(default), or "less"spChk should the data vector names be checked against the spatial objects for identity
integrity, TRUE, or FALSE, default NULL to use get.spChkOption()
Details
The statistic used is (m is the number of observations):
EBI =m∑m
i=1
∑mj=1 wij
∑mi=1
∑mj=1 wijzizj∑m
i=1(zi − z̄)2
where:zi =
pi − b√
vi
and:pi = ni/xi
vi = a + (b/xi)
b =m∑
i=1
ni/
m∑i=1
xi
a = s2 − b/(m∑
i=1
xi/m)
s2 =m∑
i=1
xi(pi − b)2/m∑
i=1
xi

6 EBest
Value
A list with class htest and mc.sim containing the following components:
statistic the value of the observed Moran’s I.
parameter the rank of the observed Moran’s I.
p.value the pseudo p-value of the test.
alternative a character string describing the alternative hypothesis.
method a character string giving the method used.
data.name a character string giving the name(s) of the data, and the number of simulations.
res nsim simulated values of statistic, final value is observed statistic
z a numerical vector of Empirical Bayes indices as z above
Author(s)
Roger Bivand 〈[email protected]〉
References
Assunção RM, Reis EA 1999 A new proposal to adjust Moran’s I for population density. Statisticsin Medicine 18, pp. 2147–2162
See Also
moran, moran.mc, EBest
Examples
data(nc.sids)EBImoran.mc(spNamedVec("SID74", nc.sids), spNamedVec("BIR74", nc.sids),nb2listw(ncCC89.nb, style="B", zero.policy=TRUE), nsim=999,zero.policy=TRUE)sids.p <- nc.sids$SID74 / nc.sids$BIR74names(sids.p) <- rownames(nc.sids)moran.mc(sids.p, nb2listw(ncCC89.nb, style="B", zero.policy=TRUE),nsim=999, zero.policy=TRUE)
EBest Global Empirical Bayes estimator
Description
The function computes global empirical Bayes estimates for rates "shrunk" to the overall mean.
Usage
EBest(n, x, family="poisson")
EBest 7
Arguments
n a numeric vector of counts of cases
x a numeric vector of populations at risk
family either "poisson" for rare conditions or "binomial" for non-rare conditions
Details
Details of the implementation for the "poisson" family are to be found in Marshall, p. 284–5, andBailey and Gatrell p. 303–306 and exercise 8.2, pp. 328–330. For the "binomial" family, seeMartuzzi and Elliott (implementation by Olaf Berke).
Value
A data frame with two columns:
raw a numerical vector of raw (crude) rates
estmm a numerical vector of empirical Bayes estimates
a global method of moments phi value
m global method of moments gamma value
Author(s)
Roger Bivand 〈[email protected]〉 and Olaf Berke, Population Medicine, OVC, University ofGuelph, CANADA
References
Marshall R M (1991) Mapping disease and mortality rates using Empirical Bayes Estimators, Ap-plied Statistics, 40, 283–294; Bailey T, Gatrell A (1995) Interactive Spatial Data Analysis, Harlow:Longman, pp. 303–306, Martuzzi M, Elliott P (1996) Empirical Bayes estimation of small areaprevalence of non-rare conditions, Statistics in Medicine 15, 1867–1873.
See Also
EBlocal, probmap, EBImoran.mc
Examples
data(auckland)res <- EBest(auckland$Deaths.1977.85, 9*auckland$Under.5.1981)attr(res, "parameters")cols <- grey(6:2/7)brks <- c(-Inf,2,2.5,3,3.5,Inf)library(maptools)plot(auckpolys, col=cols[findInterval(res$estmm*1000, brks)], forcefill=FALSE)legend(c(70,90), c(70,95), fill=cols, legend=leglabs(brks), bty="n")title(main="Global moment estimator of infant mortality per 1000 per year")data(huddersfield)res <- EBest(huddersfield$cases, huddersfield$total, family="binomial")round(res[,1:2],4)*100
8 EBlocal
EBlocal Local Empirical Bayes estimator
Description
The function computes local empirical Bayes estimates for rates "shrunk" to a neighbourhood meanfor neighbourhoods given by the nb neighbourhood list.
Usage
EBlocal(ri, ni, nb, zero.policy = FALSE, spChk = NULL, geoda=FALSE)
Arguments
ri a numeric vector of counts of cases the same length as the neighbours list in nb
ni a numeric vector of populations at risk the same length as the neighbours list innb
nb a nb object of neighbour relationships
zero.policy if TRUE assign zero to the lagged value of zones without neighbours, if FALSEassign NA
spChk should the data vector names be checked against the spatial objects for identityintegrity, TRUE, or FALSE, default NULL to use get.spChkOption()
geoda default=FALSE, following Marshall’s algorithm as interpreted by Bailey andGatrell, pp. 305-307, and exercise 8.2, pp. 328-330 for the definition of phi;TRUE for the definition of phi used in GeoDa (see discussion on OpenSpacemailing list June 2003: http://agec221.agecon.uiuc.edu/pipermail/openspace/2003-June/thread.html)
Details
Details of the implementation are to be found in Marshall, p. 286, and Bailey and Gatrell p. 307and exercise 8.2, pp. 328–330. The example results do not fully correspond to the sources becauseof slightly differing neighbourhoods, but are generally close.
Value
A data frame with two columns:
raw a numerical vector of raw (crude) rates
est a numerical vector of local empirical Bayes estimates
a a numerical vector of local phi values
m a numerical vector of local gamma values
Author(s)
Roger Bivand 〈[email protected]〉, based on contributions by Marilia Carvalho

GMerrorsar 9
References
Marshall R M (1991) Mapping disease and mortality rates using Empirical Bayes Estimators, Ap-plied Statistics, 40, 283–294; Bailey T, Gatrell A (1995) Interactive Spatial Data Analysis, Harlow:Longman, pp. 303–306.
See Also
EBest, probmap
Examples
data(auckland)res <- EBlocal(spNamedVec("Deaths.1977.85", auckland),9*spNamedVec("Under.5.1981", auckland), auckland.nb)brks <- c(-Inf,2,2.5,3,3.5,Inf)cols <- grey(6:2/7)library(maptools)plot(auckpolys, col=cols[findInterval(res$est*1000, brks)], forcefill=FALSE)legend(c(70,90), c(70,95), fill=cols, legend=leglabs(brks), bty="n")title(main="Local moment estimator of infant mortality per 1000 per year")
GMerrorsar Spatial simultaneous autoregressive error model estimation by GMM
Description
An implementation of Kelejian and Prucha’s generalised moments estimator for the autoregressiveparameter in a spatial model.
Usage
GMerrorsar(formula, data = list(), listw, na.action = na.fail, zero.policy = FALSE, return_LL = TRUE, control = list(), verbose=FALSE)
Arguments
formula a symbolic description of the model to be fit. The details of model specificationare given for lm()
data an optional data frame containing the variables in the model. By default thevariables are taken from the environment which the function is called.
listw a listw object created for example by nb2listwna.action a function (default na.fail), can also be na.omit or na.exclude with
consequences for residuals and fitted values - in these cases the weights list willbe subsetted to remove NAs in the data. It may be necessary to set zero.policy toTRUE because this subsetting may create no-neighbour observations. Note thatonly weights lists created without using the glist argument to nb2listw maybe subsetted.
zero.policy if TRUE assign zero to the lagged value of zones without neighbours, if FALSE(default) assign NA - causing GMerrorsar() to terminate with an error
control A list of control parameters. See details in optim.return_LL default TRUE, if FALSE, do not try to calculate the log likelihood of the function
for the fitted model values — see detailsverbose default=FALSE; if TRUE, reports function values during optimization.
10 GMerrorsar
Details
When the control list is set with care, the function will converge to values close to the ML estimatorwithout requiring computation of the Jacobian, the most resource-intensive part of ML estimation.For moderately sized data sets with hundreds of observations, but not many thousands, the Jacobianis computed once to give the likelihood of the fitted model, allowing a test against the model withno spatial dependence.
Note that the fitted() function for the output object assumes that the response variable may bereconstructed as the sum of the trend, the signal, and the noise (residuals). Since the values of theresponse variable are known, their spatial lags are used to calculate signal components (Cressie1993, p. 564). This differs from other software, including GeoDa, which does not use knowledgeof the response variable in making predictions for the fitting data.
Value
A list object of class gmsar
lambda simultaneous autoregressive error coefficient
coefficients GMM coefficient estimates
rest.se GMM coefficient standard errors
s2 GMM residual variance
SSE sum of squared GMM errors
parameters number of parameters estimated
lm.model the lm object returned when estimating for λ = 0
call the call used to create this object
residuals GMM residuals
lm.target the lm object returned for the GMM fitfitted.values
Difference between residuals and response variable
formula model formula
aliased if not NULL, details of aliased variables
zero.policy zero.policy for this model
LL log likelihood value at computed optimum
na.action (possibly) named vector of excluded or omitted observations if non-default na.actionargument used
Author(s)
Luc Anselin and Roger Bivand
References
Kelejian, H. H., and Prucha, I. R., 1999. A Generalized Moments Estimator for the AutoregressiveParameter in a Spatial Model. International Economic Review, 40, pp. 509–533; Cressie, N. A. C.1993 Statistics for spatial data, Wiley, New York.
See Also
optim, errorsarlm
LR.sarlm 11
Examples
data(oldcol)COL.errW.eig <- errorsarlm(CRIME ~ INC + HOVAL, data=COL.OLD, nb2listw(COL.nb, style="W"), method="eigen")summary(COL.errW.eig)COL.errW.GM <- GMerrorsar(CRIME ~ INC + HOVAL, data=COL.OLD, nb2listw(COL.nb, style="W"))summary(COL.errW.GM)data(NY_data)esar1f <- spautolm(Z ~ PEXPOSURE + PCTAGE65P + PCTOWNHOME, data=nydata, listw=listw_NY, family="SAR", method="full")summary(esar1f)esar1gm <- GMerrorsar(Z ~ PEXPOSURE + PCTAGE65P + PCTOWNHOME, data=nydata, listw=listw_NY)summary(esar1gm)
LR.sarlm Likelihood ratio test
Description
The LR.sarlm() function provides a likelihood ratio test for objects for which a logLik()function exists for their class, or for objects of class logLik. LR1.sarlm() and Wald1.sarlm()are used internally in summary.sarlm(), but may be accessed directly; they report the valuesrespectively of LR and Wald tests for the absence of spatial dependence in spatial lag or error mod-els.
Usage
LR.sarlm(x, y)logLik.sarlm(object, ...)LR1.sarlm(object)Wald1.sarlm(object)
Arguments
x a logLik object or an object for which a logLik() function exists
y a logLik object or an object for which a logLik() function exists
object a sarlm object from lagsarlm() or errorsarlm()
... other arguments to logLik()
Value
LR.sarlm() returns an object of class htest with:
statistic value of statistic
parameter degrees of freedom
p.value Probability value
estimate Log likelihood values of compared models
method "Likelihood ratio for spatial linear models"
logLik.sarlm() returns an object of class logLik LR1.sarlm and Wald1.sarlm returmobjects of class htest
12 ME
Note
The numbers of degrees of freedom returned by logLik.sarlm() include nuisance parameters,that is the number of regression coefficients, plus sigma, plus spatial parameter esitmate(s).
Author(s)
Roger Bivand 〈[email protected]〉
See Also
logLik.lm, anova.sarlm
Examples
data(columbus)mixed <- lagsarlm(CRIME ~ HOVAL + INC, data=columbus, nb2listw(col.gal.nb),type="mixed")
error <- errorsarlm(CRIME ~ HOVAL + INC, data=columbus, nb2listw(col.gal.nb))LR.sarlm(mixed, error)
ME Moran eigenvector GLM filtering
Description
The Moran eigenvector filtering function is intended to remove spatial autocorrelation from theresiduals of generalised linear models. It uses brute force eigenvector selection to reach a subset ofsuch vectors to be added to the RHS of the GLM model to reduce residual autocorrelation to belowthe specified alpha value.
Usage
ME(formula, data, family = gaussian, weights, offset, listw, alpha=0.05, nsim=99, verbose=TRUE, stdev=FALSE)
Arguments
formula a symbolic description of the model to be fit
data an optional data frame containing the variables in the model
family a description of the error distribution and link function to be used in the model
weights an optional vector of weights to be used in the fitting process
offset this can be used to specify an a priori known component to be included in thelinear predictor during fitting
listw a listw object created for example by nb2listw
alpha used as a stopping rule to choose all eigenvectors up to and including the onewith a p-value exceeding alpha
nsim number of permutations for permutation bootstrap for finding p-values
verbose if TRUE report eigenvectors selected
stdev if TRUE, p-value calculated from bootstrap permutation standard deviate usingpnorm with alternative="greater", if FALSE the Hope-type p-value
ME 13
Details
The eigenvectors for inclusion are chosen by calculating the empirical Moran’s I values for theinitial model plus each of the doubly centred symmetric spatial weights matrix eigenvectors inturn. Then the first eigenvector is chosen as that with the lowest Moran’s I value. The procedureis repeated until the lowest remaining Moran’s I value has a permutation-based probability valueabove alpha. The probability value is either Hope-type or based on using the mean and standarddeviation of the permutations to calculate ZI based on the stdev argument.
Value
An object of class ME_res:
selection a matrix summarising the selection of eigenvectors for inclusion, with columns:
Eigenvector number of selected eigenvectorZI permutation-based standardized deviate of Moran’s I if stdev=TRUEpr(ZI) probability value: if stdev=TRUE of the permutation-based standard-
ized deviate, if FALSE the Hope-type probability value, in both cases on-sided
The first row is the value at the start of the search
vectors a matrix of the selected eigenvectors in order of selection
Author(s)
Roger Bivand and Pedro Peres-Neto
References
Dray S, Legendre P and Peres-Neto PR (2005) Spatial modeling: a comprehensive framework forprinciple coordinate analysis of neigbbor matrices (PCNM), Ecological Modelling; Griffith DA andPeres-Neto PR (2006) Spatial modeling in ecology: the flexibility of eigenfunction spatial analyses.
See Also
SpatialFiltering, glm
Examples
data(columbus)lmbase <- lm(CRIME ~ INC + HOVAL, data=columbus)lagcol <- SpatialFiltering(CRIME ~ 1, ~ INC + HOVAL, data=columbus, nb=col.gal.nb, style="W", alpha=0.1, verbose=TRUE)lagcollmlag <- lm(CRIME ~ INC + HOVAL + fitted(lagcol), data=columbus)anova(lmlag)anova(lmbase, lmlag)set.seed(123)lagcol1 <- ME(CRIME ~ INC + HOVAL, data=columbus, family="gaussian", listw=nb2listw(col.gal.nb), alpha=0.1, verbose=TRUE)lagcol1lmlag1 <- lm(CRIME ~ INC + HOVAL + fitted(lagcol1), data=columbus)anova(lmlag1)anova(lmbase, lmlag1)set.seed(123)lagcol2 <- ME(CRIME ~ INC + HOVAL, data=columbus, family="gaussian", listw=nb2listw(col.gal.nb), alpha=0.1, stdev=TRUE, verbose=TRUE)lagcol2lmlag2 <- lm(CRIME ~ INC + HOVAL + fitted(lagcol2), data=columbus)

14 NY_data
anova(lmlag2)anova(lmbase, lmlag2)data(nc.sids)glmbase <- glm(SID74 ~ 1, data=nc.sids, offset=log(BIR74), family="poisson")set.seed(123)MEpois1 <- ME(SID74 ~ 1, data=nc.sids, offset=log(BIR74), family="poisson", listw=nb2listw(ncCR85.nb), alpha=0.2, verbose=TRUE)MEpois1glmME <- glm(SID74 ~ 1 + fitted(MEpois1), data=nc.sids, offset=log(BIR74), family="poisson")anova(glmME, test="Chisq")anova(glmbase, glmME, test="Chisq")data(hopkins)hopkins_part <- hopkins[21:36,36:21]hopkins_part[which(hopkins_part > 0, arr.ind=TRUE)] <- 1hopkins.rook.nb <- cell2nb(16, 16, type="rook")glmbase <- glm(c(hopkins_part) ~ 1, family="binomial")set.seed(123)MEbinom1 <- ME(c(hopkins_part) ~ 1, family="binomial", listw=nb2listw(hopkins.rook.nb), alpha=0.2, verbose=TRUE)glmME <- glm(c(hopkins_part) ~ 1 + fitted(MEbinom1), family="binomial")anova(glmME, test="Chisq")anova(glmbase, glmME, test="Chisq")
NY_data New York leukemia data
Description
New York leukemia data taken from the data sets supporting Waller and Gotway 2004.
Usage
data(NY_data)
Format
A data frame with 281 observations on the following 12 variables, and the binary coded spatialweights used in the source.
AREANAME name of census tract
AREAKEY unique FIPS code for each tract
X x-coordinate of tract centroid (in km)
Y y-coordinate of tract centroid (in km)
POP8 population size (1980 U.S. Census)
TRACTCAS number of cases 1978-1982
PROPCAS proportion of cases per tract
PCTOWNHOME percentage of people in each tract owning their own home
PCTAGE65P percentage of people in each tract aged 65 or more
Z ransformed propoprtions
AVGIDIST average distance between centroid and TCE sites
PEXPOSURE "exposure potential": inverse distance between each census tract centroid and thenearest TCE site, IDIST, transformed via log(100*IDIST)
SpatialFiltering 15
Details
The examples section shows how the DBF files from the book website for Chapter 9 were convertedinto the nydata data frame and the listw_NY spatial weights list.
Source
http://www.sph.emory.edu/~lwaller/ch9index.htm
References
Waller, L. and C. Gotway (2004) Applied Spatial Statistics for Public Health Data. New York: JohnWiley and Sons.
Examples
## Not run:## NY leukemiarequire(foreign)nydata <- read.dbf("nydata.dbf")nyadjmat <- as.matrix(read.dbf("nyadjwts.dbf")[-1])ID <- as.character(names(read.dbf("nyadjwts.dbf"))[-1])identical(substring(ID, 2, 10), substring(as.character(nydata$AREAKEY), 2, 10))nyadjlw <- mat2listw(nyadjmat, as.character(nydata$AREAKEY))listw_NY <- nb2listw(nyadjlw$neighbours, style="B")## End(Not run)
SpatialFiltering Semi-parametric spatial filtering
Description
The function selects eigenvectors in a semi-parametric spatial filtering approach to removing spa-tial dependence from linear models. Selection is by brute force by finding the single eigenvectorreducing the standard variate of Moran’s I for regression residuals most, and continuing until nocandidate eigenvector reduces the value by more than tol. It returns a summary table from theselection process and a matrix of selected eigenvectors for the specified model.
Usage
SpatialFiltering(formula, lagformula, data, nb, glist = NULL, style = "C", zero.policy = FALSE, tol = 0.1, zerovalue = 1e-04, ExactEV = FALSE, symmetric = TRUE, alpha=NULL, alternative="two.sided", verbose=TRUE)
Arguments
formula a symbolic description of the model to be fit, assuming a spatial error represen-tation; when lagformula is given, it should include only the response and theintercept term
lagformula An extra one-sided formula to be used when a spatial lag representation is de-sired; the intercept is excluded within the function if present because it is part ofthe formula argument, but excluding it explicitly in the lagformula argument inthe presence of factors generates a collinear model matrix
data an optional data frame containing the variables in the model

16 SpatialFiltering
nb an object of class nb
glist list of general weights corresponding to neighbours
style style can take values W, B, C, U, and S
zero.policy If FALSE stop with error for any empty neighbour sets, if TRUE permit theweights list to be formed with zero-length weights vectors
tol tolerance value for convergence of spatial filtering
zerovalue eigenvectors with eigenvalues of an absolute value smaller than zerovalue willbe excluded in eigenvector search
ExactEV Set ExactEV=TRUE to use exact expectations and variances rather than the ex-pectation and variance of Moran’s I from the previous iteration, default FALSE
symmetric Should the spatial weights matrix be forced to symmetry, default TRUE
alpha if not NULL, used instead of the tol= argument as a stopping rule to chooseall eigenvectors up to and including the one with a probability value exceedingalpha.
alternative a character string specifying the alternative hypothesis, must be one of greater,less or two.sided (default).
verbose if TRUE report eigenvectors selected
Details
Value
An SFResult object, with:
selection a matrix summarising the selection of eigenvectors for inclusion, with columns:
Step Step counter of the selection procedureSelEvec number of selected eigenvector (sorted descending)Eval its associated eigenvalueMinMi value Moran’s I for residual autocorrelationZMinMi standardized value of Moran’s I assuming a normal approximationpr(ZI) probability value of the permutation-based standardized deviate for the
given value of the alternative argumentR2 R2̂ of the model including exogenous variables and eigenvectorsgamma regression coefficient of selected eigenvector in fit
The first row is the value at the start of the search
dataset a matrix of the selected eigenvectors in order of selection
Author(s)
Yongwan Chun, Michael Tiefelsdorf, Roger Bivand
References
Tiefelsdorf M, Griffith DA. Semiparametric Filtering of Spatial Autocorrelation: The EigenvectorApproach. Environment and Planning A, forthcoming. http://geog-www.sbs.ohio-state.edu/faculty/Tiefelsdorf/SpatialFiltering.pdf

afcon 17
See Also
lm, eigen, nb2listw, listw2U
Examples
data(columbus)lmbase <- lm(CRIME ~ INC + HOVAL, data=columbus)sarcol <- SpatialFiltering(CRIME ~ INC + HOVAL, data=columbus, nb=col.gal.nb, style="W", ExactEV=TRUE)sarcollmsar <- lm(CRIME ~ INC + HOVAL + fitted(sarcol), data=columbus)lmsaranova(lmbase, lmsar)lm.morantest(lmsar, nb2listw(col.gal.nb))lagcol <- SpatialFiltering(CRIME ~ 1, ~ INC + HOVAL - 1, data=columbus, nb=col.gal.nb, style="W")lagcollmlag <- lm(CRIME ~ INC + HOVAL + fitted(lagcol), data=columbus)lmlaganova(lmbase, lmlag)lm.morantest(lmlag, nb2listw(col.gal.nb))
afcon Spatial patterns of conflict in Africa 1966-78
Description
The afcon data frame has 42 rows and 5 columns, for 42 African countries, exclusing then SouthWest Africa and Spanish Equatorial Africa and Spanish Sahara. The dataset is used in Anselin(1995), and downloaded from before adaptation. The neighbour list object africa.rook.nbis the SpaceStat ‘rook.GAL’, but is not the list used in Anselin (1995) - paper.nb reconstructsthe list used in the paper, with inserted links between Mauritania and Morocco, South Africa andAngola and Zambia, Tanzania and Zaire, and Botswana and Zambia. afxy is the coordinate matrixfor the centroids of the countries.
Usage
data(afcon)
Format
This data frame contains the following columns:
x an easting in decimal degrees (taken as centroid of shapefile polygon)
y an northing in decimal degrees (taken as centroid of shapefile polygon)
totcon index of total conflict 1966-78
name country name
id country id number as in paper
Note
All source data files prepared by Luc Anselin, Spatial Analysis Laboratory, Department of Agricul-tural and Consumer Economics, University of Illinois, Urbana-Champaign.
18 airdist
Source
Anselin, L. and John O’Loughlin. 1992. Geography of international conflict and cooperation:spatial dependence and regional context in Africa. In The New Geopolitics, ed. M. Ward, pp.39-75. Philadelphia, PA: Gordon and Breach. also: Anselin, L. 1995. Local indicators of spatialassociation, Geographical Analysis, 27, Table 1, p. 103.
Examples
data(afcon)plot(africa.rook.nb, afxy)plot(diffnb(paper.nb, africa.rook.nb), afxy, col="red", add=TRUE)text(afxy, labels=attr(africa.rook.nb, "region.id"), pos=4, offset=0.4)moran.test(spNamedVec("totcon", afcon), nb2listw(africa.rook.nb))moran.test(spNamedVec("totcon", afcon), nb2listw(paper.nb))geary.test(spNamedVec("totcon", afcon), nb2listw(paper.nb))
airdist Measure distance from plot
Description
Measure a distance between two points on a plot using locator; the function checks par("plt")and par("usr") to try to ensure that the aspect ratio y/x is 1, that is that the units of measurementin both x and y are equivalent.
Usage
airdist(ann=FALSE)
Arguments
ann annotate the plot with line measured and distance
Value
a list with members:
dist distance measured
coords coordinates between which distance is measured
Author(s)
Roger Bivand 〈[email protected]〉
See Also
locator

anova.sarlm 19
anova.sarlm Comparison of simultaneous autoregressive models
Description
One of a number of tools for comparing simultaneous autoregressive models, in particular nestedmodels. The function is based on anova.lme() for comparing linear mixed models, and followsthat function in using the "anova" generic name.
Usage
anova.sarlm(object, ...)
Arguments
object object is of class sarlm
... other objects of class sarlm or class lm
Details
If successive models have different numbers of degrees of freedom, a likelihood ratio test will beperformed between them. It is important to recall that tests apply to nested models, and this functionat least attempts to make sure that the response variable in the models being compared has the samename. Useless results can still be generated when incomparable models are compared, it being theresponsibility of the user to check.
Value
The function returns a data frame printed by default functions
Author(s)
Roger Bivand 〈[email protected]〉
See Also
LR.sarlm, AIC
Examples
data(columbus)lm.mod <- lm(CRIME ~ HOVAL + INC, data=columbus)lag <- lagsarlm(CRIME ~ HOVAL + INC, data=columbus, nb2listw(col.gal.nb))mixed <- lagsarlm(CRIME ~ HOVAL + INC, data=columbus, nb2listw(col.gal.nb),type="mixed")
error <- errorsarlm(CRIME ~ HOVAL + INC, data=columbus, nb2listw(col.gal.nb))LR.sarlm(mixed, error)anova(lag, lm.mod)anova(lag, error, mixed)AIC(lag, error, mixed)
20 asMatrixCsrListw
asMatrixCsrListw Convert spatial weights list to CSR matrix form
Description
asMatrixCsrListw creates a matrix.csr from a listw object, asMatrixCsrIrW is ahelper function used in fitting SAR models and elsewhere to make a (I - rho W) matrix.csrobject from W; asListwMatrixCsr performs the reverse conversion from matrix.csr tolistw object.
Usage
asMatrixCsrListw(listw, zero.policy=FALSE)asMatrixCsrIrW(W, rho)asMatrixCsrI(n)asListwMatrixCsr(mcsr)
Arguments
listw a listw object created for example by nb2listw
zero.policy if TRUE assign zero to the lagged value of zones without neighbours, if FALSE(default) assume no cases of no neighbours - if they are in fact present, asMatrixCsrListw()will terminate with an error
W a matrix.csr object created using asMatrixCsrListw from a listwobject
rho spatial regression coefficient
n length of diagonal for identity matrix
mcsr a matrix.csr object
Value
asMatrixCsrListw and asMatrixCsrIrW return matrix.csr objects; asListwMatrixCsrreturns a listw object
Author(s)
Roger Bivand 〈[email protected]〉
See Also
as.matrix.csr
Examples
data(oldcol)COL.W <- nb2listw(COL.nb, style="W")COL.Wimage(asMatrixCsrListw(COL.W))

auckland 21
auckland Marshall’s infant mortality in Auckland dataset
Description
The auckland data frame has 167 rows (census area units — CAU) and 4 columns. The datasetalso includes the "nb" object auckland.nb of neighbour relations based on contiguity, and the"polylist" object auckpolys of polygon boundaries for the CAU. The auckland data frameincludes the following columns:
Usage
data(auckland)
Format
This data frame contains the following columns:
Easting a numeric vector of x coordinates in an unknown spatial reference system
Northing a numeric vector of y coordinates in an unknown spatial reference system
Deaths.1977.85 a numeric vector of counts of infant (under 5 years of age) deaths in Auckland,1977-1985
Under.5.1981 a numeric vector of population under 5 years of age at the 1981 Census
Details
The contiguous neighbours object does not completely replicate results in the sources, and wasreconstructed from auckpolys; examination of figures in the sources suggests that there are dif-ferences in detail, although probably not in substance.
Source
Marshall R M (1991) Mapping disease and mortality rates using Empirical Bayes Estimators, Ap-plied Statistics, 40, 283–294; Bailey T, Gatrell A (1995) Interactive Spatial Data Analysis, Harlow:Longman — INFOMAP data set used with permission.
autocov_dist Distance-weighted autocovariate
Description
Calculates the autocovariate to be used in autonormal, autopoisson or autologistic regression. Threedistance-weighting schemes are available.
Usage
autocov_dist(z, xy, nbs = 1, type = "inverse", zero.policy = FALSE, style = "W", lonlat=FALSE)
22 autocov_dist
Arguments
z the response variable
xy the matrix of coordinates
nbs neighbourhood radius; default is 1
type the weighting scheme: "one" gives equal weight to all data points in the neigh-bourhood; "inverse" (the default) weights by inverse distance; "inverse.squared"weights by the square of "inverse"
zero.policy If FALSE stop with error for any empty neighbour sets, if TRUE permit theweights list to be formed with zero-length weights vectors
style style’ can take values W, B, C, U, and S; W gives mean values for neighbours
lonlat TRUE if point coordinates are longitude-latitude decimal, in which case dis-tances are measured in kilometers
Value
A numeric vector of autocovariate values
Author(s)
Carsten F. Dormann and Roger Bivand
References
Augustin N.H., Mugglestone M.A. and Buckland S.T. (1996) An autologistic model for the spatialdistribution of wildlife. Journal of Applied Ecology, 33, 339-347; Gumpertz M.L., Graham J.M. andRistaino J.B. (1997) Autologistic model of spatial pattern of Phytophthora epidemic in bell pepper:effects of soil variables on disease presence. Journal of Agricultural, Biological and EnvironmentalStatistics, 2, 131-156.
See Also
nb2listw
Examples
data(columbus)xy <- as.matrix(columbus[,13:14])ac1a <- autocov_dist(columbus$CRIME, xy, nbs=10, style="W", type="one")acinva <- autocov_dist(columbus$CRIME, xy, nbs=10, style="W", type="inverse")acinv2a <- autocov_dist(columbus$CRIME, xy, nbs=10, style="W", type="inverse.squared")
plot(ac1a ~ columbus$CRIME, pch=16, asp=1)points(acinva ~ columbus$CRIME, pch=16, col="red")points(acinv2a ~ columbus$CRIME, pch=16, col="blue")abline(0,1)
nb <- dnearneigh(xy, 0, 10)lw <- nb2listw(nb, style="W")ac1b <- lag(lw, columbus$CRIME)all.equal(ac1b, ac1a)
nbd <- nbdists(nb, xy)gl <- lapply(nbd, function(x) 1/x)
baltimore 23
lw <- nb2listw(nb, glist=gl)acinvb <- lag(lw, columbus$CRIME)all.equal(acinvb, acinva)
gl2 <- lapply(nbd, function(x) 1/(x^2))lw <- nb2listw(nb, glist=gl2)acinv2b <- lag(lw, columbus$CRIME)all.equal(acinv2b, acinv2a)
glm(CRIME ~ HOVAL + ac1b, data=columbus, family="gaussian")spautolm(columbus$CRIME ~ HOVAL, data=columbus, listw=nb2listw(nb, style="W"))
baltimore House sales prices, Baltimore, MD 1978
Description
House sales price and characteristics for a spatial hedonic regression, Baltimore, MD 1978. X,Y onMaryland grid, projection type unknown.
Usage
data(baltimore)
Format
A data frame with 211 observations on the following 17 variables.
STATION a numeric vector
PRICE a numeric vector
NROOM a numeric vector
DWELL a numeric vector
NBATH a numeric vector
PATIO a numeric vector
FIREPL a numeric vector
AC a numeric vector
BMENT a numeric vector
NSTOR a numeric vector
GAR a numeric vector
AGE a numeric vector
CITCOU a numeric vector
LOTSZ a numeric vector
SQFT a numeric vector
X a numeric vector
Y a numeric vector
24 boston
Source
Prepared by Luc Anselin. Original data made available by Robin Dubin, Weatherhead Schoolof Management, Case Western Research University, Cleveland, OH. http://sal.agecon.uiuc.edu/datasets/baltimore.zip
References
Dubin, Robin A. (1992). Spatial autocorrelation and neighborhood quality. Regional Science andUrban Economics 22(3), 433-452.
Examples
data(baltimore)## maybe str(baltimore) ; plot(baltimore) ...
boston Corrected Boston Housing Data
Description
The boston.c data frame has 506 rows and 20 columns. It contains the Harrison and Rubinfeld(1978) data corrected for a few minor errors and augmented with the latitude and longitude ofthe observations. Gilley and Pace also point out that MEDV is censored, in that median valuesat or over USD 50,000 are set to USD 50,000. The original data set without the corrections isalso included in package mlbench as BostonHousing. In addition, a matrix of tract pointcoordinates projected to UTM zone 19 is included as boston.utm, and a sphere of influenceneighbours list as boston.soi.
Usage
data(boston)
Format
This data frame contains the following columns:
TOWN a factor with levels given by town names
TOWNNO a numeric vector corresponding to TOWN
TRACT a numeric vector of tract ID numbers
LON a numeric vector of tract point longitudes in decimal degrees
LAT a numeric vector of tract point latitudes in decimal degrees
MEDV a numeric vector of median values of owner-occupied housing in USD 1000
CMEDV a numeric vector of corrected median values of owner-occupied housing in USD 1000
CRIM a numeric vector of per capita crime
ZN a numeric vector of proportions of residential land zoned for lots over 25000 sq. ft per town(constant for all Boston tracts)
INDUS a numeric vector of proportions of non-retail business acres per town (constant for allBoston tracts)
boston 25
CHAS a factor with levels 1 if tract borders Charles River; 0 otherwise
NOX a numeric vector of nitric oxides concentration (parts per 10 million) per town
RM a numeric vector of average numbers of rooms per dwelling
AGE a numeric vector of proportions of owner-occupied units built prior to 1940
DIS a numeric vector of weighted distances to five Boston employment centres
RAD a numeric vector of an index of accessibility to radial highways per town (constant for allBoston tracts)
TAX a numeric vector full-value property-tax rate per USD 10,000 per town (constant for allBoston tracts)
PTRATIO a numeric vector of pupil-teacher ratios per town (constant for all Boston tracts)
B a numeric vector of 1000*(Bk - 0.63)^2 where Bk is the proportion of blacks
LSTAT a numeric vector of percentage values of lower status population
Source
http://lib.stat.cmu.edu/datasets/boston_corrected.txt
References
Harrison, David, and Daniel L. Rubinfeld, Hedonic Housing Prices and the Demand for Clean Air,Journal of Environmental Economics and Management, Volume 5, (1978), 81-102. Original data.
Gilley, O.W., and R. Kelley Pace, On the Harrison and Rubinfeld Data, Journal of EnvironmentalEconomics and Management, 31 (1996), 403-405. Provided corrections and examined censoring.
Pace, R. Kelley, and O.W. Gilley, Using the Spatial Configuration of the Data to Improve Estima-tion, Journal of the Real Estate Finance and Economics, 14 (1997), 333-340.
Examples
data(boston)hr0 <- lm(log(MEDV) ~ CRIM + ZN + INDUS + CHAS + I(NOX^2) + I(RM^2) +AGE + log(DIS) + log(RAD) + TAX + PTRATIO + B + log(LSTAT), data=boston.c)summary(hr0)logLik(hr0)gp0 <- lm(log(CMEDV) ~ CRIM + ZN + INDUS + CHAS + I(NOX^2) + I(RM^2) +AGE + log(DIS) + log(RAD) + TAX + PTRATIO + B + log(LSTAT), data=boston.c)summary(gp0)logLik(gp0)lm.morantest(hr0, nb2listw(boston.soi))gp1 <- errorsarlm(log(CMEDV) ~ CRIM + ZN + INDUS + CHAS + I(NOX^2) + I(RM^2)+ AGE + log(DIS) + log(RAD) + TAX + PTRATIO + B + log(LSTAT),data=boston.c, nb2listw(boston.soi), method="SparseM",tol.opt = .Machine$double.eps^(1/4))summary(gp1)gp2 <- lagsarlm(log(CMEDV) ~ CRIM + ZN + INDUS + CHAS + I(NOX^2) + I(RM^2)+ AGE + log(DIS) + log(RAD) + TAX + PTRATIO + B + log(LSTAT),data=boston.c, nb2listw(boston.soi), method="SparseM")summary(gp2)

26 bptest.sarlm
bptest.sarlm Breusch-Pagan test for spatial models
Description
Performs the Breusch-Pagan test for heteroskedasticity on the least squares fit of the spatial modelstaking the spatial coefficients rho or lambda into account. This function is a copy of the bptestfunction in package "lmtest", modified to use objects returned by spatial simultaneous autoregres-sive models.
Usage
bptest.sarlm(object, varformula=NULL, studentize = TRUE, data=list())
Arguments
object An object of class "sarlm" from errorsarlm() or lagsarlm().varformula a formula describing only the potential explanatory variables for the variance
(no dependent variable needed). By default the same explanatory variables aretaken as in the main regression model
studentize logical. If set to TRUE Koenker’s studentized version of the test statistic will beused.
data an optional data frame containing the variables in the varformula
Details
Asymptotically this corresponds to the test given by Anselin (1988), but is not exactly the same.The studentized version is more conservative and perhaps to be prefered. The residuals, and forspatial error models the RHS variables, are adjusted for the spatial coefficient, as suggested bt LucAnselin (personal communication).
Value
A list with class "htest" containing the following components:
statistic the value of the test statistic.p.value the p-value of the test.parameter degrees of freedom.method a character string indicating what type of test was performed.
Author(s)
Torsten Hothorn 〈[email protected]〉 and Achim Zeileis 〈[email protected]〉,modified by Roger Bivand 〈[email protected]〉
References
T.S. Breusch & A.R. Pagan (1979), A Simple Test for Heteroscedasticity and Random CoefficientVariation. Econometrica 47, 1287–1294
W. Krämer & H. Sonnberger (1986), The Linear Regression Model under Test. Heidelberg: Physica.
L. Anselin (1988) Spatial econometrics: methods and models. Dordrecht: Kluwer, pp. 121–122.
card 27
See Also
errorsarlm, lagsarlm
Examples
data(columbus)error.col <- errorsarlm(CRIME ~ HOVAL + INC, data=columbus,nb2listw(col.gal.nb))bptest.sarlm(error.col)bptest.sarlm(error.col, studentize=FALSE)
card Cardinalities for neighbours lists
Description
The function tallies the numbers of neighbours of regions in the neighbours list.
Usage
card(nb)
Arguments
nb a neighbours list object of class nb
Value
An integer vector of the numbers of neighbours of regions in the neighbours list.
Author(s)
Roger Bivand 〈[email protected]〉
See Also
summary.nb
Examples
data(columbus)table(card(col.gal.nb))
28 cell2nb
cell2nb Generate neighbours list for grid cells
Description
The function generates a list of neighbours for a grid of cells. Helper functions are used to convertto and from the vector indices for row and column grid positions, and rook (shared edge) or queen(shared edge or vertex) neighbour definitions are applied by type. If torus is TRUE, the grid ismapped onto a torus, removing edge effects.
Usage
cell2nb(nrow, ncol, type="rook", torus=FALSE)mrc2vi(rowcol, nrow, ncol)rookcell(rowcol, nrow, ncol, torus=FALSE, rmin=1, cmin=1)queencell(rowcol, nrow, ncol, torus=FALSE, rmin=1, cmin=1)vi2mrc(i, nrow, ncol)
Arguments
nrow number of rows in the gridncol number of columns in the gridtype rook or queentorus map grid onto torusrowcol matrix with two columns of row, column indicesi vector of vector indices corresponding to rowcolrmin lowest row indexcmin lowset column index
Value
The function returns an object of class nb with a list of integer vectors containing neighbour regionnumber ids.
Author(s)
Roger Bivand 〈[email protected]〉
See Also
summary.nb
Examples
nb7rt <- cell2nb(7, 7)summary(nb7rt)xyc <- attr(nb7rt, "region.id")xy <- matrix(as.integer(unlist(strsplit(xyc, ":"))), ncol=2, byrow=TRUE)plot(nb7rt, xy)nb7rt <- cell2nb(7, 7, torus=TRUE)summary(nb7rt)
choynowski 29
choynowski Choynowski probability map values
Description
Calculates Choynowski probability map values.
Usage
choynowski(n, x, row.names=NULL, tol = .Machine$double.eps^0.5)
Arguments
n a numeric vector of counts of cases
x a numeric vector of populations at risk
row.names row names passed through to output data frame
tol accumulate values for observed counts >= expected until value less than tol
Value
A data frame with columns:
pmap Poisson probability map values: probablility of getting a more “extreme” countthan actually observed, one-tailed with less than expected and more than ex-pected folded together
type logical: TRUE if observed count less than expected
Author(s)
Roger Bivand 〈[email protected]〉
References
Choynowski, M (1959) Maps based on probabilities, Journal of the American Statistical Associ-ation, 54, 385–388; Cressie, N, Read, TRC (1985), Do sudden infant deaths come in clusters?Statistics and Decisions, Supplement Issue 2, 333–349; Bailey T, Gatrell A (1995) Interactive Spa-tial Data Analysis, Harlow: Longman, pp. 300–303.
See Also
probmap
Examples
data(auckland)res <- choynowski(auckland$Deaths.1977.85, 9*auckland$Under.5.1981)res1 <- probmap(auckland$Deaths.1977.85, 9*auckland$Under.5.1981)table(abs(res$pmap - res1$pmap) < 0.00001, res$type)plot(auckpolys, forcefill=FALSE)lt005 <- (res$pmap < 0.05) & (res$type)ge005 <- (res$pmap < 0.05) & (!res$type)plot(subset(auckpolys, lt005), add=TRUE, col=grey(2/7), forcefill=FALSE)

30 columbus
plot(subset(auckpolys, ge005), add=TRUE, col=grey(5/7), forcefill=FALSE)legend(c(70,90), c(70,95), fill=grey(c(2,5)/7),legend=c("low", "high"), bty="n")
columbus Columbus OH spatial analysis data set
Description
The columbus data frame has 49 rows and 22 columns. Unit of analysis: 49 neighbourhoods inColumbus, OH, 1980 data. In addition the data set includes a polylist object polys with theboundaries of the neighbourhoods, a matrix of polygon centroids coords, and col.gal.nb, theneighbours list from an original GAL-format file. The matrix bbs is DEPRECATED, but retainedfor other packages using this data set.
Usage
data(columbus)
Format
This data frame contains the following columns:
AREA computed by ArcView
PERIMETER computed by ArcView
COLUMBUS. internal polygon ID (ignore)
COLUMBUS.I another internal polygon ID (ignore)
POLYID yet another polygon ID
NEIG neighborhood id value (1-49); conforms to id value used in Spatial Econometrics book.
HOVAL housing value (in $1,000)
INC household income (in $1,000)
CRIME residential burglaries and vehicle thefts per thousand households in the neighborhood
OPEN open space in neighborhood
PLUMB percentage housing units without plumbin
DISCBD distance to CBD
X x coordinate (in arbitrary digitizing units, not polygon coordinates)
Y y coordinate (in arbitrary digitizing units, not polygon coordinates)
AREA neighborhood area (computed by SpaceStat)
NSA north-south dummy (North=1)
NSB north-south dummy (North=1)
EW east-west dummy (East=1)
CP core-periphery dummy (Core=1)
THOUS constant=1,000
NEIGNO NEIG+1,000, alternative neighborhood id value
PERIM polygon perimeter (computed by SpaceStat)

Graph Components 31
Details
The row names of columbus and the region.id attribute of polys are set to columbus$NEIGNO.
Note
All source data files prepared by Luc Anselin, Spatial Analysis Laboratory, Department of Agri-cultural and Consumer Economics, University of Illinois, Urbana-Champaign, http://sal.agecon.uiuc.edu/datasets/columbus.zip.
Source
Anselin, Luc. 1988. Spatial econometrics: methods and models. Dordrecht: Kluwer Academic,Table 12.1 p. 189.
Examples
data(columbus)summary(columbus)
Graph Components Depth First Search on Neighbor Lists
Description
n.comp.nb() finds the number of disjoint connected subgraphs in the graph depicted by nb.obj- a spatial neighbours list object.
Usage
n.comp.nb(nb.obj)
Arguments
nb.obj a neighbours list object of class nb
Value
A list of:
nc number of disjoint connected subgraphs
comp.id vector with the indices of the disjoint connected subgraphs that the nodes innb.obj belong to
Author(s)
Nicholas Lewin-Koh 〈[email protected]〉
See Also
plot.nb
32 diffnb
Examples
data(columbus)plot(col.gal.nb, coords, col="grey")col2 <- droplinks(col.gal.nb, 21)plot(col2, coords, add=TRUE)res <- n.comp.nb(col2)table(res$comp.id)points(coords, col=res$comp.id, pch=16)
diffnb Differences between neighbours lists
Description
The function finds differences between lists of neighbours, returning a nb neighbour list of thosefound
Usage
diffnb(x, y, verbose=TRUE)
Arguments
x an object of class nb
y an object of class nb
verbose report regions ids taken from object attribute "region.id" with differences
Value
A neighbours list with class nb
Author(s)
Roger Bivand 〈[email protected]〉
Examples
data(columbus)knn1 <- knearneigh(coords, 1)knn2 <- knearneigh(coords, 2)nb1 <- knn2nb(knn1, row.names=rownames(columbus))nb2 <- knn2nb(knn2, row.names=rownames(columbus))diffs <- diffnb(nb2, nb1)library(maptools)plot(polys, border="grey", forcefill=FALSE)plot(nb1, coords, add=TRUE)plot(diffs, coords, add=TRUE, col="red", lty=2)title(main="Plot of first (black) and second (red)\nnearest neighbours")
dnearneigh 33
dnearneigh Neighbourhood contiguity by distance
Description
The function identifies neighbours of region points by Euclidean distance between lower (greaterthan) and upper (less than or equal to) bounds, or with lonlat = TRUE, by Great Circle distance inkilometers.
Usage
dnearneigh(x, d1, d2, row.names = NULL, lonlat = FALSE)
Arguments
x matrix of point coordinates
d1 lower distance bound
d2 upper distance bound
row.names character vector of region ids to be added to the neighbours list as attributeregion.id, default seq(1, nrow(x))
lonlat TRUE if point coordinates are longitude-latitude decimal degrees, in which casedistances are measured in kilometers
Value
The function returns a list of integer vectors giving the region id numbers for neighbours satisfyingthe distance criteria.
Author(s)
Roger Bivand 〈[email protected]〉
See Also
knearneigh
Examples
data(columbus)k1 <- knn2nb(knearneigh(coords))all.linked <- max(unlist(nbdists(k1, coords)))col.nb.0.all <- dnearneigh(coords, 0, all.linked, row.names=rownames(columbus))summary(col.nb.0.all, coords)library(maptools)plot(polys, border="grey", forcefill=FALSE)plot(col.nb.0.all, coords, add=TRUE)title(main=paste("Distance based neighbours 0-", format(all.linked)," distance units", sep=""))data(state)us48.fipsno <- read.geoda(system.file("etc/weights/us48.txt",package="spdep")[1])if (as.numeric(paste(version$major, version$minor, sep="")) < 19) {
34 droplinks
m50.48 <- match(us48.fipsno$"State.name", state.name)} else {m50.48 <- match(us48.fipsno$"State_name", state.name)}xy <- as.matrix(as.data.frame(state.center))[m50.48,]llk1 <- knn2nb(knearneigh(xy, k=1, lonlat=FALSE))all.linked <- max(unlist(nbdists(llk1, xy, lonlat=FALSE)))ll.nb <- dnearneigh(xy, 0, all.linked, lonlat=FALSE)summary(ll.nb, xy, lonlat=TRUE, scale=0.5)gck1 <- knn2nb(knearneigh(xy, k=1, lonlat=TRUE))all.linked <- max(unlist(nbdists(gck1, xy, lonlat=TRUE)))gc.nb <- dnearneigh(xy, 0, all.linked, lonlat=TRUE)summary(gc.nb, xy, lonlat=TRUE, scale=0.5)plot(ll.nb, xy)plot(diffnb(ll.nb, gc.nb), xy, add=TRUE, col="red", lty=2)title(main="Differences between Euclidean and Great Circle neighbours")
droplinks Drop links in a neighbours list
Description
Drops links to and from or just to a region from a neighbours list. The example corresponds toFingleton’s Table 1, p. 6, for lattices 5 to 19.
Usage
droplinks(nb, drop, sym=TRUE)
Arguments
nb a neighbours list object of class nb
drop either a logical vector the length of nb, or a character vector of named regionscorresponding to nb’s region.id attribute, or an integer vector of region numbers
sym TRUE for removal of both "row" and "column" links, FALSE for only "row"links
Value
The function returns an object of class nb with a list of integer vectors containing neighbour regionnumber ids.
Author(s)
Roger Bivand 〈[email protected]〉
References
B. Fingleton (1999) Spurious spatial regression: some Monte Carlo results with a spatial unit rootand spatial cointegration, Journal of Regional Science 39, pp. 1–19.
edit.nb 35
See Also
is.symmetric.nb
Examples
rho <- c(0.2, 0.5, 0.95, 0.999, 1.0)ns <- c(5, 7, 9, 11, 13, 15, 17, 19)mns <- matrix(0, nrow=length(ns), ncol=length(rho))rownames(mns) <- nscolnames(mns) <- rhomxs <- matrix(0, nrow=length(ns), ncol=length(rho))rownames(mxs) <- nscolnames(mxs) <- rhofor (i in 1:length(ns)) {nblist <- cell2nb(ns[i], ns[i])nbdropped <- droplinks(nblist, ((ns[i]*ns[i])+1)/2, sym=FALSE)listw <- nb2listw(nbdropped, style="W", zero.policy=TRUE)wmat <- listw2mat(listw)for (j in 1:length(rho)) {mat <- diag(ns[i]*ns[i]) - rho[j] * wmatres <- diag(solve(t(mat) %*% mat))mns[i,j] <- mean(res)mxs[i,j] <- max(res)
}}print(mns)print(mxs)
edit.nb Interactive editing of neighbours lists
Description
The function provides simple interactive editing of neighbours lists to allow unneeded links to bedeleted, and missing links to be inserted. It uses identify to pick the endpoints of the link to bedeleted or added, and asks for confirmation before committing. If the result is not assigned to a newobject, the editing will be lost - as in edit.
Usage
edit.nb(name, coords, polys=NULL, ...)
Arguments
name an object of class nb
coords matrix of region point coordinates
polys if polygon boundaries supplied, will be used as background
... further arguments passed to or from other methods

36 eigenw
Value
The function returns an object of class nbwith the edited list of integer vectors containing neighbourregion number ids, with added attributes tallying the added and deleted links.
Author(s)
Roger Bivand 〈[email protected]〉
See Also
summary.nb, plot.nb
eigenw Spatial weights matrix eigenvalues
Description
The function returns a numeric vector of eigenvalues of the weights matrix generated from thespatial weights object listw. The eigenvalues are used to speed the computation of the Jacobianin spatial SAR model estimation:
log(det[I − ρW ]) = logn∏
i=1
(1− ρλi)
where W is the n by n spatial weights matrix, and λi are the eigenvalues of W .
Usage
eigenw(listw, quiet=TRUE)
Arguments
listw a listw object created for example by nb2listw
quiet set to FALSE for short summary
Value
a numeric vector of eigenvalues of the weights matrix generated from the spatial weights objectlistw.
Author(s)
Roger Bivand 〈[email protected]〉
References
Cliff, A. D., Ord, J. K. 1981 Spatial processes, Pion, p. 155; Ord, J. K. 1975 Estimation methodsfor models of spatial interaction, Journal of the American Statistical Association, 70, 120-126.
See Also
eigen,

eire 37
Examples
data(oldcol)W.eig <- eigenw(nb2listw(COL.nb, style="W"))1/range(W.eig)S.eig <- eigenw(nb2listw(COL.nb, style="S"))1/range(S.eig)B.eig <- eigenw(nb2listw(COL.nb, style="B"))1/range(B.eig)
eire Eire data sets
Description
The eire.df data frame has 26 rows and 9 columns. In addition, polygons of the 26 countiesare provided as a multipart polylist in eire.polys.utm (coordinates in km, projection UTM zone 30).Their centroids are in eire.coords.utm. The original Cliff and Ord binary contiguities are in eire.nb.
Usage
data(eire)
Format
This data frame contains the following columns:
A Percentage of sample with blood group A
towns Towns/unit area
pale Beyond the Pale 0, within the Pale 1
size number of blood type samples
ROADACC arterial road network accessibility in 1961
OWNCONS percentage in value terms of gross agricultural output of each county consumed byitself
POPCHG 1961 population as percentage of 1926
RETSALE value of retail sales £000
INCOME total personal income £000
Source
Upton and Fingleton 1985, - Bailey and Gatrell 1995, ch. 1 for blood group data, Cliff and Ord(1973), p. 107 for remaining variables (also after O’Sullivan, 1968). Polygon borders and Irishdata sourced from Michael Tiefelsdorf’s SPSS Saddlepoint bundle: http://geog-www.sbs.ohio-state.edu/faculty/tiefelsdorf/GeoStat.htm.
38 errorsarlm
Examples
data(eire)summary(eire.df$A)brks <- round(fivenum(eire.df$A), digits=2)cols <- rev(heat.colors(4))library(maptools)plot(eire.polys.utm,col=cols[findInterval(eire.df$A, brks)], forcefill=FALSE)title(main="Percentage with blood group A in Eire")legend(x=c(-50, 70), y=c(6120, 6050), leglabs(brks), fill=cols, bty="n")plot(eire.polys.utm, forcefill=FALSE)plot(eire.nb, eire.coords.utm, add=TRUE)lA <- lag.listw(nb2listw(eire.nb), eire.df$A)summary(lA)moran.test(spNamedVec("A", eire.df), nb2listw(eire.nb))geary.test(spNamedVec("A", eire.df), nb2listw(eire.nb))cor(lA, eire.df$A)moran.plot(spNamedVec("A", eire.df), nb2listw(eire.nb),labels=rownames(eire.df))A.lm <- lm(A ~ towns + pale, data=eire.df)summary(A.lm)res <- residuals(A.lm)brks <- c(min(res),-2,-1,0,1,2,max(res))cols <- rev(cm.colors(6))plot(eire.polys.utm, col=cols[findInterval(res, brks)], forcefill=FALSE)title(main="Regression residuals")legend(x=c(-50, 70), y=c(6120, 6050), legend=leglabs(brks), fill=cols,bty="n")
lm.morantest(A.lm, nb2listw(eire.nb))lm.morantest.sad(A.lm, nb2listw(eire.nb))lm.LMtests(A.lm, nb2listw(eire.nb), test="LMerr")brks <- round(fivenum(eire.df$OWNCONS), digits=2)cols <- grey(4:1/5)plot(eire.polys.utm,col=cols[findInterval(eire.df$OWNCONS, brks)], forcefill=FALSE)title(main="Percentage own consumption of agricultural produce")legend(x=c(-50, 70), y=c(6120, 6050), legend=leglabs(brks),fill=cols, bty="n")
moran.plot(spNamedVec("OWNCONS", eire.df), nb2listw(eire.nb))moran.test(spNamedVec("OWNCONS", eire.df), nb2listw(eire.nb))e.lm <- lm(OWNCONS ~ ROADACC, data=eire.df)res <- residuals(e.lm)brks <- c(min(res),-2,-1,0,1,2,max(res))cols <- rev(cm.colors(6))plot(eire.polys.utm, col=cols[findInterval(res, brks)], forcefill=FALSE)title(main="Regression residuals")legend(x=c(-50, 70), y=c(6120, 6050), legend=leglabs(brks), fill=cm.colors(6),bty="n")
lm.morantest(e.lm, nb2listw(eire.nb))lm.morantest.sad(e.lm, nb2listw(eire.nb))lm.LMtests(e.lm, nb2listw(eire.nb), test="LMerr")print(localmoran.sad(e.lm, eire.nb, select=1:nrow(eire.df)))
errorsarlm Spatial simultaneous autoregressive error model estimation

errorsarlm 39
Description
Maximum likelihood estimation of spatial simultaneous autoregressive error models of the form:
y = Xβ + u, u = λWu + ε
where λ is found by optimize() (prefered), or by optim() using method "L-BFGS-B" ifargument optim=TRUE, first, and β and other parameters by generalized least squares subsequently(one-dimensional search using optim performs badly on some platforms).
Usage
errorsarlm(formula, data=list(), listw, na.action=na.fail, method="eigen",quiet=TRUE, zero.policy=FALSE, interval = c(-1, 0.999), tol.solve=1.0e-10,tol.opt=.Machine$double.eps^0.5, control, optim=FALSE, cholAlloc=NULL)
Arguments
formula a symbolic description of the model to be fit. The details of model specificationare given for lm()
data an optional data frame containing the variables in the model. By default thevariables are taken from the environment which the function is called.
listw a listw object created for example by nb2listw
na.action a function (default na.fail), can also be na.omit or na.exclude withconsequences for residuals and fitted values - in these cases the weights list willbe subsetted to remove NAs in the data. It may be necessary to set zero.policy toTRUE because this subsetting may create no-neighbour observations. Note thatonly weights lists created without using the glist argument to nb2listw maybe subsetted.
method "eigen" (default) - the Jacobian is computed as the product of (1 - rho*eigenvalue)using eigenw, and "SparseM" for strictly symmetric weights lists of styles "B","C" and "U", or made symmetric by similarity (Ord, 1975, Appendix C) if pos-sible for styles "W" and "S", using code from the SparseM package to calculatethe determinant.
quiet default=TRUE; if FALSE, reports function values during optimization.
zero.policy if TRUE assign zero to the lagged value of zones without neighbours, if FALSE(default) assign NA - causing errorsarlm() to terminate with an error
interval search interval for autoregressive parameter when not using method="eigen";default is c(-1,1)
tol.solve the tolerance for detecting linear dependencies in the columns of matrices to beinverted - passed to solve() (default=1.0e-10). This may be used if neces-sary to extract coefficient standard errors (for instance lowering to 1e-12), buterrors in solve() may constitute indications of poorly scaled variables: if thevariables have scales differing much from the autoregressive coefficient, the val-ues in this matrix may be very different in scale, and inverting such a matrix isanalytically possible by definition, but numerically unstable; rescaling the RHSvariables alleviates this better than setting tol.solve to a very small value
tol.opt the desired accuracy of the optimization - passed to optim() (default=squareroot of double precision machine tolerance, a larger root may be used if thewarning: ERROR: ABNORMAL_TERMINATION_IN_LNSRCH is seen, seehelp(boston) for an example)
40 errorsarlm
control A list of control parameters passed to optim, se details in optim
optim If TRUE use experimental optim branch and control argument
cholAlloc control arguments for memory allocation in chol for sparse matrices in method="SparseM":if NULL, default values are used (larger than SparseM defaults), otherwisea list with elements: nsubmax, nnzlmax, and tmpmax, for example cholAl-loc=list(nsubmax=25000, nnzlmax=100000, tmpmax=25000)
Details
The asymptotic standard error of λ is only computed when method=eigen, because the full matrixoperations involved would be costly for large n typically associated with the choice of method="SparseM".The same applies to the coefficient covariance matrix. Taken as the asymptotic matrix from the lit-erature, it is typically badly scaled, being block-diagonal, and with the elements involving lambdabeing very small, while other parts of the matrix can be very large (often many orders of magnitudein difference). It often happens that the tol.solve argument needs to be set to a smaller valuethan the default, or the RHS variables can be centred or reduced in range.
Note that the fitted() function for the output object assumes that the response variable may bereconstructed as the sum of the trend, the signal, and the noise (residuals). Since the values of theresponse variable are known, their spatial lags are used to calculate signal components (Cressie1993, p. 564). This differs from other software, including GeoDa, which does not use knowledgeof the response variable in making predictions for the fitting data.
Value
A list object of class sarlm
type "error"
lambda simultaneous autoregressive error coefficient
coefficients GLS coefficient estimates
rest.se GLS coefficient standard errors (are equal to asymptotic standard errors)
LL log likelihood value at computed optimum
s2 GLS residual variance
SSE sum of squared GLS errors
parameters number of parameters estimated
lm.model the lm object returned when estimating for λ = 0
method the method used to calculate the Jacobian
call the call used to create this object
residuals GLS residuals
lm.target the lm object returned for the GLS fitfitted.values
Difference between residuals and response variable
ase TRUE if method=eigen
formula model formula
se.fit Not used yet
lambda.se if ase=TRUE, the asymptotic standard error of λ
LMtest NULL for this model
zero.policy zero.policy for this model
geary 41
na.action (possibly) named vector of excluded or omitted observations if non-default na.actionargument used
aliased if not NULL, details of aliased variables
The internal sar.error.* functions return the value of the log likelihood function at λ.
Author(s)
Roger Bivand 〈[email protected]〉
References
Cliff, A. D., Ord, J. K. 1981 Spatial processes, Pion; Ord, J. K. 1975 Estimation methods for modelsof spatial interaction, Journal of the American Statistical Association, 70, 120-126; Anselin, L. 1988Spatial econometrics: methods and models. (Dordrecht: Kluwer); Anselin, L. 1995 SpaceStat, asoftware program for the analysis of spatial data, version 1.80. Regional Research Institute, WestVirginia University, Morgantown, WV (www.spacestat.com); Anselin L, Bera AK (1998)Spatial dependence in linear regression models with an introduction to spatial econometrics. In:Ullah A, Giles DEA (eds) Handbook of applied economic statistics. Marcel Dekker, New York, pp.237-289; Cressie, N. A. C. 1993 Statistics for spatial data, Wiley, New York.
See Also
lm, lagsarlm, eigenw, asMatrixCsrListw, similar.listw, predict.sarlm, residuals.sarlm
Examples
data(oldcol)COL.errW.eig <- errorsarlm(CRIME ~ INC + HOVAL, data=COL.OLD,nb2listw(COL.nb, style="W"), method="eigen", quiet=FALSE)COL.errW.eig <- errorsarlm(CRIME ~ INC + HOVAL, data=COL.OLD,nb2listw(COL.nb, style="W"), method="eigen", quiet=FALSE)COL.errB.eig <- errorsarlm(CRIME ~ INC + HOVAL, data=COL.OLD,nb2listw(COL.nb, style="B"), method="eigen", quiet=FALSE)COL.errW.SM <- errorsarlm(CRIME ~ INC + HOVAL, data=COL.OLD,nb2listw(COL.nb, style="W"), method="SparseM", quiet=FALSE)summary(COL.errW.eig, correlation=TRUE)summary(COL.errB.eig, correlation=TRUE)summary(COL.errW.SM, correlation=TRUE)NA.COL.OLD <- COL.OLDNA.COL.OLD$CRIME[20:25] <- NACOL.err.NA <- errorsarlm(CRIME ~ INC + HOVAL, data=NA.COL.OLD,nb2listw(COL.nb), na.action=na.exclude)COL.err.NA$na.actionCOL.err.NAresid(COL.err.NA)
geary Compute Geary’s C
42 geary
Description
A simple function to compute Geary’s C, called by geary.test and geary.mc;
C =(n− 1)
2∑n
i=1
∑nj=1 wij
∑ni=1
∑nj=1 wij(xi − xj)2∑n
i=1(xi − x̄)2
geary.intern is an internal function used to vary the similarity criterion.
Usage
geary(x, listw, n, n1, S0, zero.policy=FALSE)
Arguments
x a numeric vector the same length as the neighbours list in listw
listw a listw object created for example by nb2listw
n number of zones
n1 n - 1
S0 global sum of weights
zero.policy if TRUE assign zero to the lagged value of zones without neighbours, if FALSEassign NA
Value
a list with
C Geary’s C
K sample kurtosis of x
Author(s)
Roger Bivand 〈[email protected]〉
References
Cliff, A. D., Ord, J. K. 1981 Spatial processes, Pion, p. 17.
See Also
geary.test, geary.mc, sp.mantel.mc
Examples
data(oldcol)col.W <- nb2listw(COL.nb, style="W")str(geary(COL.OLD$CRIME, col.W, length(COL.nb), length(COL.nb)-1,Szero(col.W)))

geary.mc 43
geary.mc Permutation test for Geary’s C statistic
Description
A permutation test for Geary’s C statistic calculated by using nsim random permutations of x forthe given spatial weighting scheme, to establish the rank of the observed statistic in relation to thensim simulated values.
Usage
geary.mc(x, listw, nsim, zero.policy=FALSE, alternative="less", spChk=NULL)
Arguments
x a numeric vector the same length as the neighbours list in listw
listw a listw object created for example by nb2listw
nsim number of permutations
zero.policy if TRUE assign zero to the lagged value of zones without neighbours, if FALSEassign NA
alternative a character string specifying the alternative hypothesis, must be one of "less"(default), or "greater".
spChk should the data vector names be checked against the spatial objects for identityintegrity, TRUE, or FALSE, default NULL to use get.spChkOption()
Value
A list with class htest and mc.sim containing the following components:
statistic the value of the observed Geary’s C.
parameter the rank of the observed Geary’s C.
p.value the pseudo p-value of the test.
alternative a character string describing the alternative hypothesis.
method a character string giving the method used.
data.name a character string giving the name(s) of the data, and the number of simulations.
res nsim simulated values of statistic, final value is observed statistic
Author(s)
Roger Bivand 〈[email protected]〉
References
Cliff, A. D., Ord, J. K. 1981 Spatial processes, Pion, p. 63-5.
See Also
geary, geary.test
44 geary.test
Examples
data(oldcol)sim1 <- geary.mc(spNamedVec("CRIME", COL.OLD), nb2listw(COL.nb, style="W"),nsim=99, alternative="less")sim1mean(sim1$res)var(sim1$res)summary(sim1$res)colold.lags <- nblag(COL.nb, 3)sim2 <- geary.mc(spNamedVec("CRIME", COL.OLD), nb2listw(colold.lags[[2]],style="W"), nsim=99)sim2summary(sim2$res)sim3 <- geary.mc(spNamedVec("CRIME", COL.OLD), nb2listw(colold.lags[[3]],style="W"), nsim=99)sim3summary(sim3$res)
geary.test Geary’s C test for spatial autocorrelation
Description
Geary’s test for spatial autocorrelation using a spatial weights matrix in weights list form. Theassumptions underlying the test are sensitive to the form of the graph of neighbour relationshipsand other factors, and results may be checked against those of geary.mc permutations.
Usage
geary.test(x, listw, randomisation=TRUE, zero.policy=FALSE,alternative="less", spChk=NULL)
Arguments
x a numeric vector the same length as the neighbours list in listw
listw a listw object created for example by nb2listw
randomisationvariance of I calculated under the assumption of randomisation, if FALSE nor-mality
zero.policy if TRUE assign zero to the lagged value of zones without neighbours, if FALSEassign NA
alternative a character string specifying the alternative hypothesis, must be one of "less"(default), "greater" or "two.sided".
spChk should the data vector names be checked against the spatial objects for identityintegrity, TRUE, or FALSE, default NULL to use get.spChkOption()

geary.test 45
Value
A list with class htest containing the following components:
statistic the value of the standard deviate of Geary’s C.p.value the p-value of the test.estimate the value of the observed Geary’s C, its expectation and variance under the
method assumption.alternative a character string describing the alternative hypothesis.method a character string giving the assumption used for calculating the standard devi-
ate.data.name a character string giving the name(s) of the data.
Note
The derivation of the test (Cliff and Ord, 1981, p. 18) assumes that the weights matrix is symmetric.For inherently non-symmetric matrices, such as k-nearest neighbour matrices, listw2U() can beused to make the matrix symmetric. In non-symmetric weights matrix cases, the variance of the teststatistic may be negative (thanks to Franz Munoz I for a well documented bug report). Geary’s C isaffected by non-symmetric weights under normality much more than Moran’s I.
Author(s)
Roger Bivand 〈[email protected]〉
References
Cliff, A. D., Ord, J. K. 1981 Spatial processes, Pion, p. 21.
See Also
geary, geary.mc, listw2U
Examples
data(oldcol)geary.test(spNamedVec("CRIME", COL.OLD), nb2listw(COL.nb, style="W"))geary.test(spNamedVec("CRIME", COL.OLD), nb2listw(COL.nb, style="W"),randomisation=FALSE)colold.lags <- nblag(COL.nb, 3)geary.test(spNamedVec("CRIME", COL.OLD), nb2listw(colold.lags[[2]],style="W"))geary.test(spNamedVec("CRIME", COL.OLD), nb2listw(colold.lags[[3]],style="W"), alternative="greater")print(is.symmetric.nb(COL.nb))COL.k4.nb <- knn2nb(knearneigh(coords.OLD, 4))print(is.symmetric.nb(COL.k4.nb))geary.test(spNamedVec("CRIME", COL.OLD), nb2listw(COL.k4.nb, style="W"))geary.test(spNamedVec("CRIME", COL.OLD), nb2listw(COL.k4.nb, style="W"),randomisation=FALSE)cat("Note non-symmetric weights matrix - use listw2U()\n")geary.test(spNamedVec("CRIME", COL.OLD), listw2U(nb2listw(COL.k4.nb,style="W")))geary.test(spNamedVec("CRIME", COL.OLD), listw2U(nb2listw(COL.k4.nb,style="W")), randomisation=FALSE)
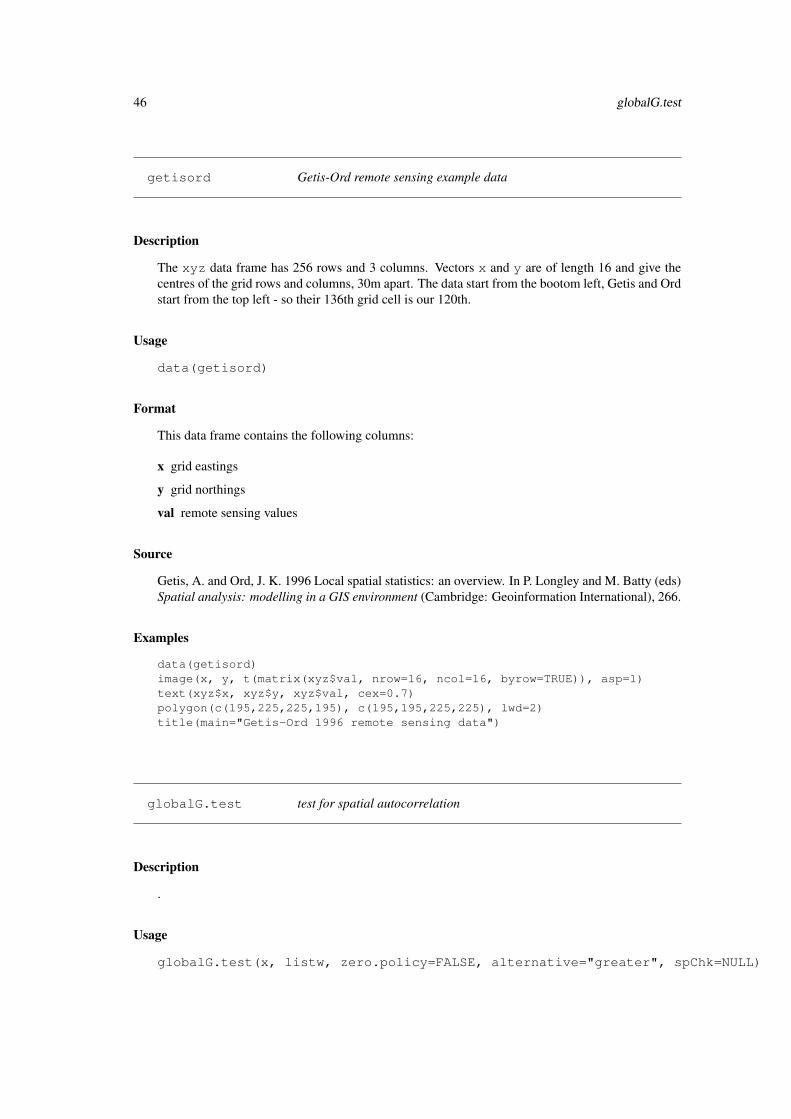
46 globalG.test
getisord Getis-Ord remote sensing example data
Description
The xyz data frame has 256 rows and 3 columns. Vectors x and y are of length 16 and give thecentres of the grid rows and columns, 30m apart. The data start from the bootom left, Getis and Ordstart from the top left - so their 136th grid cell is our 120th.
Usage
data(getisord)
Format
This data frame contains the following columns:
x grid eastings
y grid northings
val remote sensing values
Source
Getis, A. and Ord, J. K. 1996 Local spatial statistics: an overview. In P. Longley and M. Batty (eds)Spatial analysis: modelling in a GIS environment (Cambridge: Geoinformation International), 266.
Examples
data(getisord)image(x, y, t(matrix(xyz$val, nrow=16, ncol=16, byrow=TRUE)), asp=1)text(xyz$x, xyz$y, xyz$val, cex=0.7)polygon(c(195,225,225,195), c(195,195,225,225), lwd=2)title(main="Getis-Ord 1996 remote sensing data")
globalG.test test for spatial autocorrelation
Description
.
Usage
globalG.test(x, listw, zero.policy=FALSE, alternative="greater", spChk=NULL)
globalG.test 47
Arguments
x a numeric vector the same length as the neighbours list in listw
listw a listw object created for example by nb2listw
zero.policy if TRUE assign zero to the lagged value of zones without neighbours, if FALSEassign NA
alternative a character string specifying the alternative hypothesis, must be one of "greater"(default), "less" or "two.sided".
spChk should the data vector names be checked against the spatial objects for identityintegrity, TRUE, or FALSE, default NULL to use get.spChkOption()
Value
A list with class htest containing the following components:
statistic the value of the standard deviate of Moran’s I.
p.value the p-value of the test.
estimate the value of the observed statistic, its expectation and variance.
alternative a character string describing the alternative hypothesis.
data.name a character string giving the name(s) of the data.
Author(s)
Hisaji ONO 〈[email protected]〉 and Roger Bivand 〈[email protected]〉
References
Getis. A, Ord, J. K. 1992 The analysis of spatial association by use of distance statistics, Geograph-ical Analysis, 24, p. 195.
See Also
localG
Examples
data(nc.sids)sidsrate79 <- (1000*nc.sids$SID79)/nc.sids$BIR79names(sidsrate79) <- rownames(nc.sids)dists <- c(10, 20, 30, 33, 40, 50, 60, 70, 80, 90, 100)ndists <- length(dists)ZG <- numeric(length=ndists)milesxy <- cbind(nc.sids$east, nc.sids$north)for (i in 1:ndists) {thisnb <- dnearneigh(milesxy, 0, dists[i], row.names=rownames(nc.sids))thislw <- nb2listw(thisnb, style="B", zero.policy=TRUE)ZG[i] <- globalG.test(sidsrate79, thislw, zero.policy=TRUE)$statistic
}cbind(dists, ZG)

48 graphneigh
graphneigh Graph based spatial weights
Description
Functions return a graph object containing a list with the vertex coordinates and the to and fromindices defining the edges. The helper function graph2nb converts a graph object into a neighbourlist. The plot functions plot the graph objects.
Usage
gabrielneigh(coords)relativeneigh(coords)soi.graph(tri.nb, coords)graph2nb(gob, row.names=NULL,sym=FALSE)plot.Gabriel(x, show.points=FALSE, add=FALSE, linecol=par(col), ...)plot.relative(x, show.points=FALSE, add=FALSE, linecol=par(col),...)
Arguments
coords matrix of region point coordinates
tri.nb a neighbor list created from tri2nb
gob a graph object created from any of the graph funtions
row.names character vector of region ids to be added to the neighbours list as attributeregion.id, default seq(1, nrow(x))
sym a logical argument indicating whether or not neighbors should be symetric (ifi->j then j->i)
x object to be plotted
show.points (logical) add points to plot
add (logical) add to existing plot
linecol edge plotting colour
... further graphical parameters as in par(..)
Details
The graph functions produce graphs on a 2d point set that are all subgraphs of the Delaunay trian-gulation. The relative neighbor graph is defined by the relation, x and y are neighbors if
d(x, y) ≤ min(max(d(x, z), d(y, z))|z ∈ S)
where d() is the distance, S is the set of points and z is an arbitrary point in S. The Gabriel graphis a subgraph of the delaunay triangulation and has the relative neighbor graph as a sub-graph. Therelative neighbor graph is defined by the relation x and y are Gabriel neighbors if
d(x, y) ≤ min((d(x, z)2 + d(y, z)2)1/2|z ∈ S)
where x,y,z and S are as before. The sphere of influence graph is defined for a finite point set S, letrx be the distance from point x to its nearest neighbor in S, and Cx is the circle centered on x. Thenx and y are SOI neigbors iff Cx and Cy intersect in at least 2 places.
graphneigh 49
Value
A list of class Graph withte following elements
np number of input points
from array of origin ids
to array of destination ids
nedges number of edges in graph
x input x coordinates
y input y coordinates
The helper functions return an nb object with a list of integer vectors containing neighbour regionnumber ids.
Author(s)
Nicholas Lewin-Koh 〈[email protected]〉
References
Matula, D. W. and Sokal R. R. 1980, Properties of Gabriel graphs relevant to geographic variationresearch and the clustering of points in the plane, Geographic Analysis, 12(3), pp. 205-222.
Toussaint, G. T. 1980, The relative neighborhood graph of a finite planar set, Pattern Recognition,12(4), pp. 261-268.
Kirkpatrick, D. G. and Radke, J. D. 1985, A framework for computational morphology. In Compu-tational Geometry, Ed. G. T. Toussaint, North Holland.
See Also
knearneigh, dnearneigh, knn2nb
Examples
data(columbus)par(mfrow=c(2,2))col.tri.nb<-tri2nb(coords)col.gab.nb<-graph2nb(gabrielneigh(coords), sym=TRUE)col.rel.nb<- graph2nb(relativeneigh(coords), sym=TRUE)col.soi.nb<- graph2nb(soi.graph(col.tri.nb,coords), sym=TRUE)library(maptools)plot(polys, border="grey", forcefill=FALSE)plot(col.tri.nb,coords,add=TRUE)title(main="Delaunay Triangulation")plot(polys, border="grey", forcefill=FALSE)plot(col.gab.nb, coords, add=TRUE)title(main="Gabriel Graph")plot(polys, border="grey", forcefill=FALSE)plot(col.rel.nb, coords, add=TRUE)title(main="Relative Neighbor Graph")plot(polys, border="grey", forcefill=FALSE)plot(col.soi.nb, coords, add=TRUE)title(main="Sphere of Influence Graph")par(mfrow=c(1,1))
50 huddersfield
hopkins Hopkins burnt savanna herb remains
Description
A 20m square is divided into 40 by 40 0.5m quadrats. Observations are in tens of grams of herbremains, 0 being from 0g to less than 10g, and so on. Analysis was mostly conducted using theinterior 32 by 32 grid.
Usage
data(hopkins)
Format
The format is: num [1:40, 1:40] 0 0 0 0 0 0 0 0 0 1 ...
Source
Upton, G., Fingleton, B. 1985 Spatial data analysis by example: point pattern and quatitative data,Wiley, pp. 38–39.
References
Hopkins, B., 1965 Observations on savanna burning in the Olokemeji Forest Reserve, Nigeria.Journal of Applied Ecology, 2, 367–381.
Examples
data(hopkins)image(1:32, 1:32, hopkins[5:36,36:5], breaks=c(-0.5, 3.5, 20),col=c("white", "black"))box()
huddersfield Prevalence of respiratory symptoms
Description
Prevalence of respiratory symptoms in 71 school catchment areas in Huddersfield, Northern Eng-land
Usage
data(huddersfield)
Format
A data frame with 71 observations on the following 2 variables.
cases Prevalence of at least mild conditionstotal Number of questionnaires returned
include.self 51
Source
Martuzzi M, Elliott P (1996) Empirical Bayes estimation of small area prevalence of non-rare con-ditions, Statistics in Medicine 15, 1867–1873, pp. 1870–1871.
Examples
data(huddersfield)str(huddersfield)
include.self Include self in neighbours list
Description
The function includes the region itself in its own list of neighbours, and sets attribute "self.included"to TRUE.
Usage
include.self(nb)
Arguments
nb input neighbours list of class nb
Value
The function returns an object of class nb with a list of integer vectors containing neighbour regionnumber ids; attribute "self.included" is set to TRUE.
Author(s)
Roger Bivand 〈[email protected]〉
See Also
summary.nb
Examples
data(columbus)summary(col.gal.nb, coords)summary(include.self(col.gal.nb), coords)
52 invIrM
invIrM Compute SAR generating operator
Description
Computes the matrix used for generating simultaneous autoregressive random variables, for a givenvalue of rho, a neighbours list object, a chosen coding scheme style, and optionally a list of generalweights corresponding to neighbours.
Usage
invIrM(neighbours, rho, glist=NULL, style="W")invIrW(listw, rho)
Arguments
neighbours an object of class nb
rho autoregressive parameter
glist list of general weights corresponding to neighbours
style style can take values W, B, C, and S
listw a listw object from for example nb2listw
Details
The function generates the full weights matrix V, checks that rho lies in its feasible range between1/min(eigen(V)) and 1/max(eigen(V)), and returns the nxn inverted matrix
(I − ρV )−1
Value
An nxn matrix with a "call" attribute.
Author(s)
Roger Bivand 〈[email protected]〉
References
Tiefelsdorf, M., Griffith, D. A., Boots, B. 1999 A variance-stabilizing coding scheme for spatial linkmatrices, Environment and Planning A, 31, pp. 165-180; Tiefelsdorf, M. 2000 Modelling spatialprocesses, Lecture notes in earth sciences, Springer, p. 76; Haining, R. 1990 Spatial data analysisin the social and environmental sciences, Cambridge University Press, p. 117; Cliff, A. D., Ord, J.K. 1981 Spatial processes, Pion, p. 152.
See Also
nb2listw
joincount.mc 53
Examples
nb7rt <- cell2nb(7, 7, torus=TRUE)x <- matrix(rnorm(500*length(nb7rt)), nrow=length(nb7rt))res0 <- apply(invIrM(nb7rt, rho=0.0) %*% x, 2, function(x) var(x)/length(x))res2 <- apply(invIrM(nb7rt, rho=0.2) %*% x, 2, function(x) var(x)/length(x))res4 <- apply(invIrM(nb7rt, rho=0.4) %*% x, 2, function(x) var(x)/length(x))res6 <- apply(invIrM(nb7rt, rho=0.6) %*% x, 2, function(x) var(x)/length(x))res8 <- apply(invIrM(nb7rt, rho=0.8) %*% x, 2, function(x) var(x)/length(x))res9 <- apply(invIrM(nb7rt, rho=0.9) %*% x, 2, function(x) var(x)/length(x))plot(density(res9), col="red", xlim=c(-0.01, max(density(res9)$x)),ylim=range(density(res0)$y),xlab="estimated variance of the mean",main=expression(paste("Effects of spatial autocorrelation for different ",rho, " values")))
lines(density(res0), col="black")lines(density(res2), col="brown")lines(density(res4), col="green")lines(density(res6), col="orange")lines(density(res8), col="pink")legend(c(-0.02, 0.01), c(7, 25), legend=c("0.0", "0.2", "0.4", "0.6", "0.8", "0.9"), col=c("black", "brown", "green", "orange", "pink", "red"), lty=1, bty="n")
joincount.mc Permutation test for same colour join count statistics
Description
A permutation test for same colour join count statistics calculated by using nsim random permuta-tions of fx for the given spatial weighting scheme, to establish the ranks of the observed statistics(for each colour) in relation to the nsim simulated values.
Usage
joincount.mc(fx, listw, nsim, zero.policy=FALSE, alternative="greater", spChk=NULL)
Arguments
fx a factor of the same length as the neighbours and weights objects in listw
listw a listw object created for example by nb2listw
nsim number of permutations
zero.policy if TRUE assign zero to the lagged value of zones without neighbours, if FALSEassign NA
alternative a character string specifying the alternative hypothesis, must be one of "greater"(default), or "less".
spChk should the data vector names be checked against the spatial objects for identityintegrity, TRUE, or FALSE, default NULL to use get.spChkOption()
54 joincount.multi
Value
A list with class jclist of lists with class htest and mc.sim for each of the k colours contain-ing the following components:
statistic the value of the observed statistic.
parameter the rank of the observed statistic.
method a character string giving the method used.
data.name a character string giving the name(s) of the data.
p.value the pseudo p-value of the test.
alternative a character string describing the alternative hypothesis.
estimate the mean and variance of the simulated distribution.
res nsim simulated values of statistic, the final element is the observed statistic
Author(s)
Roger Bivand 〈[email protected]〉
References
Cliff, A. D., Ord, J. K. 1981 Spatial processes, Pion, p. 63-5.
See Also
joincount.test
Examples
data(oldcol)HICRIME <- cut(COL.OLD$CRIME, breaks=c(0,35,80), labels=c("low","high"))names(HICRIME) <- rownames(COL.OLD)joincount.mc(HICRIME, nb2listw(COL.nb, style="B"), nsim=99)joincount.test(HICRIME, nb2listw(COL.nb, style="B"))
joincount.multi BB, BW and Jtot join count statistic for k-coloured factors
Description
A function for tallying join counts between same-colour and different colour spatial objects, whereneighbour relations are defined by a weights list. Given the global counts in each colour, expectedcounts and variances are calculated under non-free sampling, and a z-value reported. Since multipletests are reported, no p-values are given, allowing the user to adjust the significance level applied.Jtot is the count of all different-colour joins.
Usage
joincount.multi(fx, listw, zero.policy = FALSE, adjust.n=TRUE, spChk = NULL)print.jcmulti(x, ...)

joincount.multi 55
Arguments
fx a factor of the same length as the neighbours and weights objects in listw
listw a listw object created for example by nb2listw
zero.policy if TRUE assign zero to the lagged value of zones without neighbours, if FALSEassign NA
adjust.n default TRUE, if FALSE the number of observations is not adjusted for no-neighbour observations, if TRUE, the number of observations is adjusted con-sistently (up to and including spdep 0.3-28 the adjustment was inconsistent -thanks to Tomoki NAKAYA for a careful bug report)
spChk should the data vector names be checked against the spatial objects for identityintegrity, TRUE, or FALSE, default NULL to use get.spChkOption()
x object to be printed
... arguments to be passed through for printing
Value
A matrix with class jcmulti with row and column names for observed and expected counts,variance, and z-value.
Note
The derivation of the test (Cliff and Ord, 1981, p. 18) assumes that the weights matrix is symmetric.For inherently non-symmetric matrices, such as k-nearest neighbour matrices, listw2U() can beused to make the matrix symmetric. In non-symmetric weights matrix cases, the variance of the teststatistic may be negative.
Author(s)
Roger Bivand 〈[email protected]〉
References
Cliff, A. D., Ord, J. K. 1981 Spatial processes, Pion, p. 20; Upton, G., Fingleton, B. 1985 Spatialdata analysis by example: point pattern and quatitative data, Wiley, pp. 158–170.
See Also
joincount.test
Examples
data(oldcol)HICRIME <- cut(COL.OLD$CRIME, breaks=c(0,35,80), labels=c("low","high"))names(HICRIME) <- rownames(COL.OLD)joincount.multi(HICRIME, nb2listw(COL.nb, style="B"))data(hopkins)image(1:32, 1:32, hopkins[5:36,36:5], breaks=c(-0.5, 3.5, 20),col=c("white", "black"))box()hopkins.rook.nb <- cell2nb(32, 32, type="rook")unlist(spweights.constants(nb2listw(hopkins.rook.nb, style="B")))hopkins.queen.nb <- cell2nb(32, 32, type="queen")
56 joincount.test
hopkins.bishop.nb <- diffnb(hopkins.rook.nb, hopkins.queen.nb, verbose=FALSE)hopkins4 <- hopkins[5:36,36:5]hopkins4[which(hopkins4 > 3, arr.ind=TRUE)] <- 4hopkins4.f <- factor(hopkins4)table(hopkins4.f)joincount.multi(hopkins4.f, nb2listw(hopkins.rook.nb, style="B"))cat("replicates Upton & Fingleton table 3.4 (p. 166)\n")joincount.multi(hopkins4.f, nb2listw(hopkins.bishop.nb, style="B"))cat("replicates Upton & Fingleton table 3.6 (p. 168)\n")joincount.multi(hopkins4.f, nb2listw(hopkins.queen.nb, style="B"))cat("replicates Upton & Fingleton table 3.7 (p. 169)\n")
joincount.test BB join count statistic for k-coloured factors
Description
The BB join count test for spatial autocorrelation using a spatial weights matrix in weights list formfor testing whether same-colour joins occur more frequently than would be expected if the zoneswere labelled in a spatially random way. The assumptions underlying the test are sensitive to theform of the graph of neighbour relationships and other factors, and results may be checked againstthose of geary.mc permutations.
Usage
joincount.test(fx, listw, zero.policy=FALSE, alternative="greater", adjust.n=TRUE, spChk=NULL)print.jclist(x, ...)
Arguments
fx a factor of the same length as the neighbours and weights objects in listw
listw a listw object created for example by nb2listw
zero.policy if TRUE assign zero to the lagged value of zones without neighbours, if FALSEassign NA
alternative a character string specifying the alternative hypothesis, must be one of "greater"(default), "less" or "two.sided".
adjust.n default TRUE, if FALSE the number of observations is not adjusted for no-neighbour observations, if TRUE, the number of observations is adjusted con-sistently (up to and including spdep 0.3-28 the adjustment was inconsistent -thanks to Tomoki NAKAYA for a careful bug report)
spChk should the data vector names be checked against the spatial objects for identityintegrity, TRUE, or FALSE, default NULL to use get.spChkOption()
x object to be printed
... arguments to be passed through for printing
joincount.test 57
Value
A list with class jclist of lists with class htest for each of the k colours containing the follow-ing components:
statistic the value of the standard deviate of the join count statistic.
p.value the p-value of the test.
estimate the value of the observed statistic, its expectation and variance.
alternative a character string describing the alternative hypothesis.
method a character string giving the method used.
data.name a character string giving the name(s) of the data.
Note
The derivation of the test (Cliff and Ord, 1981, p. 18) assumes that the weights matrix is symmetric.For inherently non-symmetric matrices, such as k-nearest neighbour matrices, listw2U() can beused to make the matrix symmetric. In non-symmetric weights matrix cases, the variance of the teststatistic may be negative.
Author(s)
Roger Bivand 〈[email protected]〉
References
Cliff, A. D., Ord, J. K. 1981 Spatial processes, Pion, p. 20.
See Also
joincount.mc, joincount.multi, listw2U
Examples
data(oldcol)HICRIME <- cut(COL.OLD$CRIME, breaks=c(0,35,80), labels=c("low","high"))names(HICRIME) <- rownames(COL.OLD)joincount.test(HICRIME, nb2listw(COL.nb, style="B"))joincount.test(HICRIME, nb2listw(COL.nb, style="C"))joincount.test(HICRIME, nb2listw(COL.nb, style="S"))joincount.test(HICRIME, nb2listw(COL.nb, style="W"))by(card(COL.nb), HICRIME, summary)print(is.symmetric.nb(COL.nb))COL.k4.nb <- knn2nb(knearneigh(coords.OLD, 4))print(is.symmetric.nb(COL.k4.nb))joincount.test(HICRIME, nb2listw(COL.k4.nb, style="B"))cat("Note non-symmetric weights matrix - use listw2U()\n")joincount.test(HICRIME, listw2U(nb2listw(COL.k4.nb, style="B")))

58 knearneigh
knearneigh K nearest neighbours for spatial weights
Description
The function returns a matrix with the indices of regions belonging to the set of the k nearestneighbours of each other. If lonlat = TRUE, Great Circle distances are used.
Usage
knearneigh(x, k=1, lonlat = FALSE)
Arguments
x matrix of region point coordinates
k number of nearest neighbours to be returned
lonlat TRUE if point coordinates are longitude-latitude decimal degrees, in which casedistances are measured in kilometers
Details
The underlying C code is based on the knn function in the class package in the VR bundle.
Value
A list of class knn
nn integer matrix of region number ids
np number of input points
k input required k
dimension number of columns of x
x input coordinates
Author(s)
Roger Bivand 〈[email protected]〉
See Also
knn, dnearneigh, knn2nb
Examples
data(columbus)col.knn <- knearneigh(coords, k=4)library(maptools)plot(polys, border="grey", forcefill=FALSE)plot(knn2nb(col.knn), coords, add=TRUE)title(main="K nearest neighbours, k = 4")data(state)us48.fipsno <- read.geoda(system.file("etc/weights/us48.txt",
knn2nb 59
package="spdep")[1])if (as.numeric(paste(version$major, version$minor, sep="")) < 19) {m50.48 <- match(us48.fipsno$"State.name", state.name)} else {m50.48 <- match(us48.fipsno$"State_name", state.name)}xy <- as.matrix(as.data.frame(state.center))[m50.48,]llk4.nb <- knn2nb(knearneigh(xy, k=4, lonlat=FALSE))gck4.nb <- knn2nb(knearneigh(xy, k=4, lonlat=TRUE))plot(llk4.nb, xy)plot(diffnb(llk4.nb, gck4.nb), xy, add=TRUE, col="red", lty=2)title(main="Differences between Euclidean and Great Circle k=4 neighbours")summary(llk4.nb, xy, lonlat=TRUE)summary(gck4.nb, xy, lonlat=TRUE)
knn2nb Neighbours list from knn object
Description
The function converts a knn object returned by knearneigh into a neighbours list of class nbwith a list of integer vectors containing neighbour region number ids.
Usage
knn2nb(knn, row.names = NULL, sym = FALSE)
Arguments
knn A knn object returned by knearneigh
row.names character vector of region ids to be added to the neighbours list as attributeregion.id, default seq(1, nrow(x))
sym force the output neighbours list to symmetry
Value
The function returns an object of class nb with a list of integer vectors containing neighbour regionnumber ids.
Author(s)
Roger Bivand 〈[email protected]〉
See Also
knearneigh
60 lag.listw
Examples
data(columbus)col.knn <- knearneigh(coords, k=4)library(maptools)plot(polys, border="grey", forcefill=FALSE)plot(knn2nb(col.knn), coords, add=TRUE)title(main="K nearest neighbours, k = 4")
lag.listw Spatial lag of a numeric vector
Description
Using a listw sparse representation of a spatial weights matrix, compute the lag vector V x
Usage
lag.listw(x, var, zero.policy=FALSE, NAOK=FALSE, ...)
Arguments
x a listw object created for example by nb2listw
var a numeric vector the same length as the neighbours list in listw
zero.policy if TRUE assign zero to the lagged value of zones without neighbours, if FALSEassign NA
NAOK if ’TRUE’ then any ’NA’ or ’NaN’ or ’Inf’ values in var are passed on to theforeign function. If ’FALSE’, the presence of ’NA’ or ’NaN’ or ’Inf’ values isregarded as an error.
... additional arguments
Value
a numeric vector the same length as var
Author(s)
Roger Bivand 〈[email protected]〉
See Also
nb2listw
Examples
data(oldcol)Vx <- lag.listw(nb2listw(COL.nb, style="W"), COL.OLD$CRIME)plot(Vx, COL.OLD$CRIME)plot(ecdf(COL.OLD$CRIME))plot(ecdf(Vx), add=TRUE, col.points="red", col.hor="red")

lagsarlm 61
lagsarlm Spatial simultaneous autoregressive lag model estimation
Description
Maximum likelihood estimation of spatial simultaneous autoregressive lag and mixed models of theform:
y = ρWy + Xβ + ε
where ρ is found by optimize() (prefered), or optim() using method "L-BFGS-B" if argu-ment optim=TRUE, first, and β and other parameters by generalized least squares subsequently(one-dimensional search using optim performs badly on some platforms). In the mixed model, thespatially lagged independent variables are added to X.
Usage
lagsarlm(formula, data=list(), listw, na.action=na.fail,type="lag", method="eigen", quiet=TRUE,zero.policy=FALSE, interval = c(-1, 0.999), tol.solve=1.0e-10,tol.opt=.Machine$double.eps^0.5, control, optim=FALSE, cholAlloc=NULL)
Arguments
formula a symbolic description of the model to be fit. The details of model specificationare given for lm()
data an optional data frame containing the variables in the model. By default thevariables are taken from the environment which the function is called.
listw a listw object created for example by nb2listw
na.action a function (default na.fail), can also be na.omit or na.exclude withconsequences for residuals and fitted values - in these cases the weights list willbe subsetted to remove NAs in the data. It may be necessary to set zero.policy toTRUE because this subsetting may create no-neighbour observations. Note thatonly weights lists created without using the glist argument to nb2listw maybe subsetted.
type default "lag", may be set to "mixed"; when "mixed", the lagged intercept isdropped for spatial weights style "W", that is row-standardised weights, but oth-erwise included
method "eigen" (default) - the Jacobian is computed as the product of (1 - rho*eigenvalue)using eigenw, and "SparseM" for strictly symmetric weights lists of styles "B","C" and "U", or made symmetric by similarity (Ord, 1975, Appendix C) if pos-sible for styles "W" and "S", using code from the SparseM package to calculatethe determinant.
quiet default=TRUE; if FALSE, reports function values during optimization.
zero.policy if TRUE assign zero to the lagged value of zones without neighbours, if FALSE(default) assign NA - causing lagsarlm() to terminate with an error
interval search interval for autoregressive parameter when not using method="eigen";default is c(-1,1)
62 lagsarlm
tol.solve the tolerance for detecting linear dependencies in the columns of matrices to beinverted - passed to solve() (default=1.0e-10). This may be used if neces-sary to extract coefficient standard errors (for instance lowering to 1e-12), buterrors in solve() may constitute indications of poorly scaled variables: if thevariables have scales differing much from the autoregressive coefficient, the val-ues in this matrix may be very different in scale, and inverting such a matrix isanalytically possible by definition, but numerically unstable; rescaling the RHSvariables alleviates this better than setting tol.solve to a very small value
tol.opt the desired accuracy of the optimization - passed to optimize() (default=squareroot of double precision machine tolerance)
control A list of control parameters passed to optim, se details in optim
optim If TRUE use experimental optim branch and control argument
cholAlloc control arguments for memory allocation in chol for sparse matrices in method="SparseM":if NULL, default values are used (larger than SparseM defaults), otherwisea list with elements: nsubmax, nnzlmax, and tmpmax, for example cholAl-loc=list(nsubmax=25000, nnzlmax=100000, tmpmax=25000)
Details
The asymptotic standard error of ρ is only computed when method=eigen, because the full matrixoperations involved would be costly for large n typically associated with the choice of method="SparseM".The same applies to the coefficient covariance matrix. Taken as the asymptotic matrix from the lit-erature, it is typically badly scaled, and with the elements involving rho being very small, whileother parts of the matrix can be very large (often many orders of magnitude in difference). It oftenhappens that the tol.solve argument needs to be set to a smaller value than the default, or theRHS variables can be centred or reduced in range.
Note that the fitted() function for the output object assumes that the response variable may bereconstructed as the sum of the trend, the signal, and the noise (residuals). Since the values of theresponse variable are known, their spatial lags are used to calculate signal components (Cressie1993, p. 564). This differs from other software, including GeoDa, which does not use knowledgeof the response variable in making predictions for the fitting data.
Value
A list object of class sarlm
type "lag" or "mixed"
rho simultaneous autoregressive lag coefficient
coefficients GLS coefficient estimates
rest.se asymptotic standard errors if ase=TRUE
LL log likelihood value at computed optimum
s2 GLS residual variance
SSE sum of squared GLS errors
parameters number of parameters estimated
lm.model the lm object returned when estimating for ρ = 0
method the method used to calculate the Jacobian
call the call used to create this object
residuals GLS residuals

lagsarlm 63
lm.target the lm object returned for the GLS fitfitted.values
Difference between residuals and response variable
se.fit Not used yet
formula model formula
ase TRUE if method=eigen
LLs if ase=FALSE (for method="SparseM"), the log likelihood values of models es-timated dropping each of the independent variables in turn, used in the summaryfunction as a substitute for variable coefficient significance tests
rho.se if ase=TRUE, the asymptotic standard error of ρ
LMtest if ase=TRUE, the Lagrange Multiplier test for the absence of spatial autocorre-lation in the lag model residuals
zero.policy zero.policy for this model
na.action (possibly) named vector of excluded or omitted observations if non-default na.actionargument used
The internal sar.lag.mixed.* functions return the value of the log likelihood function at ρ.
Author(s)
Roger Bivand 〈[email protected]〉, with thanks to Andrew Bernat for contributions to theasymptotic standard error code.
References
Cliff, A. D., Ord, J. K. 1981 Spatial processes, Pion; Ord, J. K. 1975 Estimation methods for modelsof spatial interaction, Journal of the American Statistical Association, 70, 120-126; Anselin, L. 1988Spatial econometrics: methods and models. (Dordrecht: Kluwer); Anselin, L. 1995 SpaceStat, asoftware program for the analysis of spatial data, version 1.80. Regional Research Institute, WestVirginia University, Morgantown, WV (www.spacestat.com); Anselin L, Bera AK (1998)Spatial dependence in linear regression models with an introduction to spatial econometrics. In:Ullah A, Giles DEA (eds) Handbook of applied economic statistics. Marcel Dekker, New York, pp.237-289; Cressie, N. A. C. 1993 Statistics for spatial data, Wiley, New York.
See Also
lm, errorsarlm, eigenw, asMatrixCsrListw, predict.sarlm, residuals.sarlm
Examples
data(oldcol)COL.lag.eig <- lagsarlm(CRIME ~ INC + HOVAL, data=COL.OLD,nb2listw(COL.nb), method="eigen", quiet=FALSE)COL.lag.eig <- errorsarlm(CRIME ~ INC + HOVAL, data=COL.OLD,nb2listw(COL.nb, style="W"), method="eigen", quiet=FALSE)COL.lag.SM <- lagsarlm(CRIME ~ INC + HOVAL, data=COL.OLD,nb2listw(COL.nb), method="SparseM", quiet=FALSE)summary(COL.lag.eig, correlation=TRUE)summary(COL.lag.SM, correlation=TRUE)COL.lag.B <- lagsarlm(CRIME ~ INC + HOVAL, data=COL.OLD,nb2listw(COL.nb, style="B"))summary(COL.lag.B, correlation=TRUE)

64 listw2sn
COL.mixed.B <- lagsarlm(CRIME ~ INC + HOVAL, data=COL.OLD,nb2listw(COL.nb, style="B"), type="mixed", tol.solve=1e-9)summary(COL.mixed.B, correlation=TRUE)COL.mixed.W <- lagsarlm(CRIME ~ INC + HOVAL, data=COL.OLD,nb2listw(COL.nb, style="W"), type="mixed")summary(COL.mixed.W, correlation=TRUE)NA.COL.OLD <- COL.OLDNA.COL.OLD$CRIME[20:25] <- NACOL.lag.NA <- lagsarlm(CRIME ~ INC + HOVAL, data=NA.COL.OLD,nb2listw(COL.nb), na.action=na.exclude, tol.opt=.Machine$double.eps^0.4)COL.lag.NA$na.actionCOL.lag.NAresid(COL.lag.NA)
listw2sn Spatial neighbour sparse representation
Description
The function makes a "spatial neighbour" object representation (similar to the S-PLUSspatial statististics module representation of a "listw" spatial weights object. sn2listw() isthe inverse function to listw2sn(), creating a "listw" object from a "spatial neighbour"object
Usage
listw2sn(listw)sn2listw(sn)
Arguments
listw a listw object from for example nb2listw
sn a spatial.neighbour object
Value
A data frame with three columns, and with class spatial.neighbour:
from region number id for the start of the link (S-PLUS row.id)
to region number id for the end of the link (S-PLUS col.id)
weights weight for this link
logSpwdet returns log det(I - rho * W).
Author(s)
Roger Bivand 〈[email protected]〉
See Also
nb2listw, errorsarlm, lagsarlm
lm.LMtests 65
Examples
data(columbus)col.listw <- nb2listw(col.gal.nb)col.listw$neighbours[[1]]col.listw$weights[[1]]col.sn <- listw2sn(col.listw)str(col.sn)W <- asMatrixCsrListw(similar.listw(col.listw))str(W)rho <- seq(-0.8, 0.9, 0.1)for (i in rho) print(paste("rho:", i, "log(det(I - rho*W))",log(det(asMatrixCsrIrW(W, i)))), quote=TRUE)
lm.LMtests Lagrange Multiplier diagnostics for spatial dependence in linear mod-els
Description
The function reports the estimates of tests chosen among five statistics for testing for spatial de-pendence in linear models. The statistics are the simple LM test for error dependence (LMerr), thesimple LM test for a missing spatially lagged dependent variable (LMlag), variants of these robustto the presence of the other (RLMerr, RLMlag - RLMerr tests for error dependence in the possiblepresence of a missing lagged dependent variable, RLMlag the other way round), and a portmanteautest (SARMA, in fact LMerr + RLMlag).
Usage
lm.LMtests(model, listw, zero.policy=FALSE, test="LMerr", spChk=NULL)print.LMtestlist(x, ...)
Arguments
model an object of class lm returned by lm or optionally a vector of externally calcu-lated residuals for use when only "LMerr" is chosen; weights and offsets shouldnot be used in the lm object
listw a listw object created for example by nb2listw, expected to be row-standardised(W-style)
zero.policy if TRUE assign zero to the lagged value of zones without neighbours, if FALSEassign NA
test a character vector of tests requested chosen from LMerr, LMlag, RLMerr, RLM-lag, SARMA; test="all" computes all the tests.
spChk should the data vector names be checked against the spatial objects for identityintegrity, TRUE, or FALSE, default NULL to use get.spChkOption()
x object to be printed
... printing arguments to be passed through
66 lm.LMtests
Details
The two types of dependence are for spatial lag ρ and spatial error λ:
y = Xβ + ρW(1)y + u,
u = λW(2)u + e
where e is a well-behaved, uncorrelated error term. Tests for a missing spatially lagged dependentvariable test that ρ = 0, tests for spatial autocorrelation of the error u test whether λ = 0. W is aspatial weights matrix; for the tests used here they are identical.
Value
A list of class LMtestlist of htest objects, each with:
statistic the value of the Lagrange Multiplier test.
parameter number of degrees of freedom
p.value the p-value of the test.
method a character string giving the method used.
data.name a character string giving the name(s) of the data.
Author(s)
Roger Bivand 〈[email protected]〉 and Andrew Bernat
References
Anselin, L. 1988 Spatial econometrics: methods and models. (Dordrecht: Kluwer); Anselin, L.,Bera, A. K., Florax, R. and Yoon, M. J. 1996 Simple diagnostic tests for spatial dependence. Re-gional Science and Urban Economics, 26, 77–104.
See Also
lm
Examples
data(oldcol)oldcrime.lm <- lm(CRIME ~ HOVAL + INC, data = COL.OLD)summary(oldcrime.lm)lm.LMtests(oldcrime.lm, nb2listw(COL.nb), test=c("LMerr", "LMlag", "RLMerr","RLMlag", "SARMA"))
lm.LMtests(oldcrime.lm, nb2listw(COL.nb))lm.LMtests(residuals(oldcrime.lm), nb2listw(COL.nb))
lm.morantest 67
lm.morantest Moran’s I test for residual spatial autocorrelation
Description
Moran’s I test for spatial autocorrelation in residuals from an estimated linear model (lm()). Thehelper function listw2U() constructs a weights list object corresponding to the sparse matrix12 (W + W′
Usage
lm.morantest(model, listw, zero.policy=FALSE,alternative = "greater", spChk=NULL, resfun=weighted.residuals)
listw2U(listw)
Arguments
model an object of class lm returned by lm; weights may be specified in the lm fit, butoffsets should not be used
listw a listw object created for example by nb2listw
zero.policy if TRUE assign zero to the lagged value of zones without neighbours, if FALSEassign NA
alternative a character string specifying the alternative hypothesis, must be one of "greater"(default), "less" or "two.sided".
spChk should the data vector names be checked against the spatial objects for identityintegrity, TRUE, or FALSE, default NULL to use get.spChkOption()
resfun default: weighted.residuals; the function to be used to extract residuals from thelm object, may be residuals, weighted.residuals, rstandard, orrstudent
Value
A list with class htest containing the following components:
statistic the value of the standard deviate of Moran’s I.
p.value the p-value of the test.
estimate the value of the observed Moran’s I, its expectation and variance under themethod assumption.
alternative a character string describing the alternative hypothesis.
method a character string giving the method used.
data.name a character string giving the name(s) of the data.
Note
The examples also show how to use permutation bootstrap if desired.
Author(s)
Roger Bivand 〈[email protected]〉
68 lm.morantest.sad
References
Cliff, A. D., Ord, J. K. 1981 Spatial processes, Pion, p. 203,
See Also
lm.LMtests, lm
Examples
data(oldcol)oldcrime1.lm <- lm(CRIME ~ 1, data = COL.OLD)oldcrime.lm <- lm(CRIME ~ HOVAL + INC, data = COL.OLD)lm.morantest(oldcrime.lm, nb2listw(COL.nb, style="W"))lm.LMtests(oldcrime.lm, nb2listw(COL.nb, style="W"))lm.morantest(oldcrime.lm, nb2listw(COL.nb, style="S"))lm.morantest(oldcrime1.lm, nb2listw(COL.nb, style="W"))moran.test(spNamedVec("CRIME", COL.OLD), nb2listw(COL.nb, style="W"),randomisation=FALSE)oldcrime.wlm <- lm(CRIME ~ HOVAL + INC, data = COL.OLD, weights = I(1/AREA))lm.morantest(oldcrime.wlm, nb2listw(COL.nb, style="W"), resfun=weighted.residuals)lm.morantest(oldcrime.wlm, nb2listw(COL.nb, style="W"), resfun=rstudent)if (require(boot)) {oldcrime.lmx <- lm(CRIME ~ HOVAL + INC, data = COL.OLD, x=TRUE)listw <- nb2listw(COL.nb, style="W")MoraneI.boot <- function(var, i, ...) {var <- var[i]lmres <- lm(var ~ oldcrime.lmx$x - 1)return(moran(x=residuals(lmres), ...)$I)
}boot1 <- boot(residuals(oldcrime.lmx), statistic=MoraneI.boot, R=499,sim="permutation", listw=listw, n=length(listw$neighbours), S0=Szero(listw))
zi <- (boot1$t0 - mean(boot1$t))/sqrt(var(boot1$t))boot1plot(boot1)cat("Bootstrap permutation standard deviate:", zi, "\n\n")lm.morantest(oldcrime.lm, nb2listw(COL.nb, style="W"))
}
lm.morantest.sad Saddlepoint approximation of global Moran’s I test
Description
The function implements Tiefelsdorf’s application of the Saddlepoint approximation to global Moran’sI’s reference distribution.
Usage
lm.morantest.sad(model, listw, zero.policy=FALSE, alternative="greater",spChk=NULL, resfun=weighted.residuals, tol=.Machine$double.eps^0.5, maxiter=1000, tol.bounds=0.0001)
print.moransad(x, ...)summary.moransad(object, ...)print.summary.moransad(x, ...)
lm.morantest.sad 69
Arguments
model an object of class lm returned by lm; weights may be specified in the lm fit, butoffsets should not be used
listw a listw object created for example by nb2listw
zero.policy if TRUE assign zero to the lagged value of zones without neighbours, if FALSEassign NA
alternative a character string specifying the alternative hypothesis, must be one of greater(default), less or two.sided.
spChk should the data vector names be checked against the spatial objects for identityintegrity, TRUE, or FALSE, default NULL to use get.spChkOption()
resfun default: weighted.residuals; the function to be used to extract residuals from thelm object, may be residuals, weighted.residuals, rstandard, orrstudent
tol the desired accuracy (convergence tolerance) for uniroot
maxiter the maximum number of iterations for uniroot
tol.bounds offset from bounds for uniroot
x object to be printed
object object to be summarised
... arguments to be passed through
Details
The function involves finding the eigenvalues of an n by n matrix, and numerically finding the rootfor the Saddlepoint approximation, and should therefore only be used with care when n is large.
Value
A list of class moransad with the following components:
statistic the value of the saddlepoint approximation of the standard deviate of globalMoran’s I.
p.value the p-value of the test.
estimate the value of the observed global Moran’s I.
alternative a character string describing the alternative hypothesis.
method a character string giving the method used.
data.name a character string giving the name(s) of the data.
internal1 Saddlepoint omega, r and u
internal2 f.root, iter and estim.prec from uniroot
df degrees of freedom
tau eigenvalues (excluding zero values)
Author(s)
Roger Bivand 〈[email protected]〉

70 localG
References
Tiefelsdorf, M. 2002 The Saddlepoint approximation of Moran’s I and local Moran’s Ii referencedistributions and their numerical evaluation. Geographical Analysis, forthcoming; see also Tiefels-dorf’s SPSS code: http://geog-www.sbs.ohio-state.edu/faculty/tiefelsdorf/GeoStat.htm.
See Also
lm.morantest
Examples
data(eire)e.lm <- lm(OWNCONS ~ ROADACC, data=eire.df)lm.morantest(e.lm, nb2listw(eire.nb))lm.morantest.sad(e.lm, nb2listw(eire.nb))summary(lm.morantest.sad(e.lm, nb2listw(eire.nb)))e.wlm <- lm(OWNCONS ~ ROADACC, data=eire.df, weights=RETSALE)lm.morantest(e.wlm, nb2listw(eire.nb), resfun=rstudent)lm.morantest.sad(e.wlm, nb2listw(eire.nb), resfun=rstudent)
localG G and Gstar local spatial statistics
Description
The local spatial statistic G is calculated for each zone based on the spatial weights object used. Thevalue returned is a Z-value, and may be used as a diagnostic tool. High positive values indicate theposibility of a local cluster of high values of the variable being analysed, very low relative valuesa similar cluster of low values. For inference, a Bonferroni-type test is suggested in the references,where tables of critical values may be found (see also details below).
Usage
localG(x, listw, zero.policy=FALSE, spChk=NULL)
Arguments
x a numeric vector the same length as the neighbours list in listw
listw a listw object created for example by nb2listw
zero.policy if TRUE assign zero to the lagged value of zones without neighbours, if FALSEassign NA
spChk should the data vector names be checked against the spatial objects for identityintegrity, TRUE, or FALSE, default NULL to use get.spChkOption()

localG 71
Details
If the neighbours member of listw has a "self.included" attribute set to TRUE, the Gstar variant, in-cluding the self-weight wii > 0, is calculated and returned. The returned vector will have a "gstari"attribute set to TRUE. Self-weights can be included by using the include.self function in thespweights package before converting the neighbour list to a spatial weights list with nb2listw asshown below in the example.
The critical values of the statistic under assumptions given in the references for the 95th percentileare for n=1: 1.645, n=50: 3.083, n=100: 3.289, n=1000: 3.886.
Value
A vector of G or Gstar values, with attributes "gstari" set to TRUE or FALSE, "call" set to thefunction call, and class "localG".
Author(s)
Roger Bivand 〈[email protected]〉
References
Ord, J. K. and Getis, A. 1995 Local spatial autocorrelation statistics: distributional issues and anapplication. Geographical Analysis, 27, 286–306; Getis, A. and Ord, J. K. 1996 Local spatialstatistics: an overview. In P. Longley and M. Batty (eds) Spatial analysis: modelling in a GISenvironment (Cambridge: Geoinformation International), 261–277.
Examples
data(getisord)xycoords <- cbind(xyz$x, xyz$y)nb30 <- dnearneigh(xycoords, 0, 30)G30 <- localG(spNamedVec("val", xyz), nb2listw(nb30, style="B"))G30[length(xyz$val)-136]nb60 <- dnearneigh(xycoords, 0, 60)G60 <- localG(spNamedVec("val", xyz), nb2listw(nb60, style="B"))G60[length(xyz$val)-136]nb90 <- dnearneigh(xycoords, 0, 90)G90 <- localG(spNamedVec("val", xyz), nb2listw(nb90, style="B"))G90[length(xyz$val)-136]nb120 <- dnearneigh(xycoords, 0, 120)G120 <- localG(spNamedVec("val", xyz), nb2listw(nb120, style="B"))G120[length(xyz$val)-136]nb150 <- dnearneigh(xycoords, 0, 150)G150 <- localG(spNamedVec("val", xyz), nb2listw(nb150, style="B"))G150[length(xyz$val)-136]brks <- seq(-5,5,1)cm.col <- cm.colors(length(brks)-1)image(x, y, t(matrix(G30, nrow=16, ncol=16, byrow=TRUE)),breaks=brks, col=cm.col, asp=1)
text(xyz$x, xyz$y, round(G30, digits=1), cex=0.7)polygon(c(195,225,225,195), c(195,195,225,225), lwd=2)title(main=expression(paste("Values of the ", G[i], " statistic")))G30s <- localG(spNamedVec("val", xyz), nb2listw(include.self(nb30),style="B"))cat("value according to Getis and Ord's eq. 14.2, p. 263 (1996)\n")G30s[length(xyz$val)-136]
72 localmoran
cat(paste("value given by Getis and Ord (1996), p. 267","(division by n-1 rather than n \n in variance)\n"))
G30s[length(xyz$val)-136] *(sqrt(sum(scale(xyz$val, scale=FALSE)^2)/length(xyz$val)) /sqrt(var(xyz$val)))
image(x, y, t(matrix(G30s, nrow=16, ncol=16, byrow=TRUE)),breaks=brks, col=cm.col, asp=1)
text(xyz$x, xyz$y, round(G30s, digits=1), cex=0.7)polygon(c(195,225,225,195), c(195,195,225,225), lwd=2)title(main=expression(paste("Values of the ", G[i]^"*", " statistic")))
localmoran Local Moran’s I statistic
Description
The local spatial statistic Moran’s I is calculated for each zone based on the spatial weights objectused. The values returned include a Z-value, and may be used as a diagnostic tool. The statistic is:
Ii =(xi − x̄)∑n
k=1(xk − x̄)2/n
n∑j=1
wij(xj − x̄)
, and its expectation and variance are given in Anselin (1995).
Usage
localmoran(x, listw, zero.policy=FALSE, na.action=na.fail,alternative = "greater", p.adjust.method="none", spChk=NULL)
Arguments
x a numeric vector the same length as the neighbours list in listwlistw a listw object created for example by nb2listwzero.policy if TRUE assign zero to the lagged value of zones without neighbours, if FALSE
assign NAna.action a function (default na.fail), can also be na.omit or na.exclude - in
these cases the weights list will be subsetted to remove NAs in the data. It maybe necessary to set zero.policy to TRUE because this subsetting may create no-neighbour observations. Note that only weights lists created without using theglist argument to nb2listw may be subsetted. If na.pass is used, zero issubstituted for NA values in calculating the spatial lag. (Note that na.excludewill only work properly starting from R 1.9.0, na.omit and na.exclude assign thewrong classes in 1.8.*)
alternative a character string specifying the alternative hypothesis, must be one of greater(default), less or two.sided.
p.adjust.methoda character string specifying the probability value adjustment for multiple tests,default "none"; see p.adjustSP. Note that the number of multiple tests foreach region is only taken as the number of neighbours + 1 for each region, ratherthan the total number of regions.
spChk should the data vector names be checked against the spatial objects for identityintegrity, TRUE, or FALSE, default NULL to use get.spChkOption()
localmoran.sad 73
Value
Ii local moran statistic
E.Ii expectation of local moran statistic
Var.Ii variance of local moran statistic
Z.Ii standard deviate of local moran statistic
Pr() p-value of local moran statistic
Author(s)
Roger Bivand 〈[email protected]〉
References
Anselin, L. 1995. Local indicators of spatial association, Geographical Analysis, 27, 93–115; Getis,A. and Ord, J. K. 1996 Local spatial statistics: an overview. In P. Longley and M. Batty (eds) Spatialanalysis: modelling in a GIS environment (Cambridge: Geoinformation International), 261–277.
See Also
localG
Examples
data(afcon)oid <- order(afcon$id)resI <- localmoran(spNamedVec("totcon", afcon), nb2listw(paper.nb))printCoefmat(data.frame(resI[oid,], row.names=afcon$name[oid]), check.names=FALSE)hist(resI[,5])resI <- localmoran(spNamedVec("totcon", afcon), nb2listw(paper.nb), p.adjust.method="bonferroni")printCoefmat(data.frame(resI[oid,], row.names=afcon$name[oid]), check.names=FALSE)hist(resI[,5])totcon <- spNamedVec("totcon", afcon)is.na(totcon) <- sample(1:length(totcon), 5)totconresI.na <- localmoran(totcon, nb2listw(paper.nb), na.action=na.exclude,zero.policy=TRUE)if (class(attr(resI.na, "na.action")) == "exclude") {print(data.frame(resI.na[oid,], row.names=afcon$name[oid]), digits=2)} else print(resI.na, digits=2)resG <- localG(spNamedVec("totcon", afcon), nb2listw(include.self(paper.nb)))print(data.frame(resG[oid], row.names=afcon$name[oid]), digits=2)
localmoran.sad Saddlepoint approximation of local Moran’s Ii tests
74 localmoran.sad
Description
The function implements Tiefelsdorf’s application of the Saddlepoint approximation to local Moran’sIi’s reference distribution. If the model object is of class "lm", global independence is assumed;if of class "sarlm", global dependence is assumed to be represented by the spatial parameter ofthat model. Tests are reported separately for each zone selected, and may be summarised usingsummary.localmoransad. Values of local Moran’s Ii agree with those from localmoran(),but in that function, the standard deviate - here the Saddlepoint approximation - is based on the ran-domisation assumption.
Usage
localmoran.sad(model, select, nb, glist=NULL, style="W", zero.policy=FALSE,alternative="greater", spChk=NULL, resfun=weighted.residuals, save.Vi=FALSE,tol = .Machine$double.eps^0.5, maxiter = 1000, tol.bounds=0.0001)
print.localmoransad(x, ...)summary.localmoransad(object, ...)print.summary.localmoransad(x, ...)listw2star(listw, ireg, style, n, D, a, zero.policy=FALSE)
Arguments
model an object of class lm returned by lm (assuming no global spatial autocorrela-tion), or an object of class sarlm returned by a spatial simultaneous autoregres-sive model fit (assuming global spatial autocorrelation represented by the modelspatial coefficient); weights may be specified in the lm fit, but offsets should notbe used
select an integer vector of the id. numbers of zones to be tested
nb a list of neighbours of class nb
glist a list of general weights corresponding to neighbours
style can take values W, B, C, and S
zero.policy if TRUE assign zero to the lagged value of zones without neighbours, if FALSEassign NA
alternative a character string specifying the alternative hypothesis, must be one of greater(default), less or two.sided.
spChk should the data vector names be checked against the spatial objects for identityintegrity, TRUE, or FALSE, default NULL to use get.spChkOption()
resfun default: weighted.residuals; the function to be used to extract residuals from thelm object, may be residuals, weighted.residuals, rstandard, orrstudent
save.Vi if TRUE, return the star-shaped weights lists for each zone tested
tol the desired accuracy (convergence tolerance) for uniroot
maxiter the maximum number of iterations for uniroot
tol.bounds offset from bounds for uniroot
x object to be printed
object object to be summarised
... arguments to be passed through
listw a listw object created for example by nb2listw

localmoran.sad 75
ireg a zone number
n internal value depending on listw and style
D internal value depending on listw and style
a internal value depending on listw and style
Details
The function implements the analytical eigenvalue calculation together with trace shortcuts given orsuggested in Tiefelsdorf (2002), partly following remarks by J. Keith Ord, and uses the Saddlepointanalytical solution from Tiefelsdorf’s SPSS code.
If a histogram of the probability values of the saddlepoint estimate for the assumption of globalindependence is not approximately flat, the assumption is probably unjustified, and re-estimationwith global dependence is recommended.
No n by n matrices are needed at any point for the test assuming no global dependence, the star-shaped weights matrices being handled as listw lists. When the test is made on residuals from aspatial regression, taking a global process into account. n by n matrices are necessary, and memoryconstraints may be reached for large lattices.
Value
A list with class localmoransad containing "select" lists, each with class moransad with thefollowing components:
statistic the value of the saddlepoint approximation of the standard deviate of local Moran’sIi.
p.value the p-value of the test.
estimate the value of the observed local Moran’s Ii.
alternative a character string describing the alternative hypothesis.
method a character string giving the method used.
data.name a character string giving the name(s) of the data.
internal1 Saddlepoint omega, r and u
df degrees of freedom
tau maximum and minimum analytical eigenvalues
i zone tested
Author(s)
Roger Bivand 〈[email protected]〉
References
Tiefelsdorf, M. 2002 The Saddlepoint approximation of Moran’s I and local Moran’s Ii referencedistributions and their numerical evaluation. Geographical Analysis, 34, pp. 187–206; see alsoTiefelsdorf’s SPSS code: http://geog-www.sbs.ohio-state.edu/faculty/tiefelsdorf/GeoStat.htm.
See Also
localmoran, lm.morantest, lm.morantest.sad, errorsarlm
76 mat2listw
Examples
data(eire)e.lm <- lm(OWNCONS ~ ROADACC, data=eire.df)e.locmor <- summary(localmoran.sad(e.lm, eire.nb, select=1:nrow(eire.df)))e.locmormean(e.locmor[,1])lm.morantest(e.lm, nb2listw(eire.nb))hist(e.locmor[,"Pr. (Sad)"])e.wlm <- lm(OWNCONS ~ ROADACC, data=eire.df, weights=RETSALE)e.locmorw1 <- summary(localmoran.sad(e.wlm, eire.nb, select=1:nrow(eire.df), resfun=weighted.residuals))e.locmorw1e.locmorw2 <- summary(localmoran.sad(e.wlm, eire.nb, select=1:nrow(eire.df), resfun=rstudent))e.locmorw2e.errorsar <- errorsarlm(OWNCONS ~ ROADACC, data=eire.df,listw=nb2listw(eire.nb))e.errorsare.clocmor <- summary(localmoran.sad(e.errorsar, eire.nb, select=1:nrow(eire.df)))e.clocmorhist(e.clocmor[,"Pr. (Sad)"])
mat2listw Convert a square spatial weights matrix to a weights list object
Description
The function converts a square spatial weights matrix to a weights list object, optionally addingregion IDs from the row names of the matrix, as a sequence of numbers 1:nrow(x), or as given asan argument.
Usage
mat2listw(x, row.names = NULL)
Arguments
x A square non-negative matrix with no NAs representing spatial weights
row.names row names to use for region IDs
Value
A listw object with the following members:
style "M", meaning matrix style, underlying style unknown
neighbours the derived neighbours list
weights the weights for the neighbours derived from the matrix
Author(s)
Roger Bivand 〈[email protected]〉
See Also
nb2listw, nb2mat
moran 77
Examples
data(columbus)col005 <- dnearneigh(coords, 0, 0.5, attr(col.gal.nb, "region.id"))summary(col005)col005.w.mat <- nb2mat(col005, zero.policy=TRUE)col005.w.b <- mat2listw(col005.w.mat)summary(col005.w.b$neighbours)diffnb(col005, col005.w.b$neighbours)
moran Compute Moran’s I
Description
A simple function to compute Moran’s I, called by moran.test and moran.mc;
I =n∑n
i=1
∑nj=1 wij
∑ni=1
∑nj=1 wij(xi − x̄)(xj − x̄)∑n
i=1(xi − x̄)2
Usage
moran(x, listw, n, S0, zero.policy=FALSE, NAOK=FALSE)
Arguments
x a numeric vector the same length as the neighbours list in listw
listw a listw object created for example by nb2listw
n number of zones
S0 global sum of weights
zero.policy if TRUE assign zero to the lagged value of zones without neighbours, if FALSEassign NA
NAOK if ’TRUE’ then any ’NA’ or ’NaN’ or ’Inf’ values in x are passed on to theforeign function. If ’FALSE’, the presence of ’NA’ or ’NaN’ or ’Inf’ values isregarded as an error.
Value
a list of
I Moran’s I
K sample kurtosis of x
Author(s)
Roger Bivand 〈[email protected]〉
References
Cliff, A. D., Ord, J. K. 1981 Spatial processes, Pion, p. 17.
78 moran.mc
See Also
moran.test, moran.mc
Examples
data(oldcol)col.W <- nb2listw(COL.nb, style="W")crime <- spNamedVec("CRIME", COL.OLD)str(moran(crime, col.W, length(COL.nb), Szero(col.W)))is.na(crime) <- sample(1:length(crime), 10)str(moran(crime, col.W, length(COL.nb), Szero(col.W), NAOK=TRUE))
moran.mc Permutation test for Moran’s I statistic
Description
A permutation test for Moran’s I statistic calculated by using nsim random permutations of x forthe given spatial weighting scheme, to establish the rank of the observed statistic in relation to thensim simulated values. The examples show how boot(sim="permutation") can replicatethis function (thanks to Virgilio Gómez Rubio and the DCluster package).
Usage
moran.mc(x, listw, nsim, zero.policy=FALSE, alternative="greater", na.action=na.fail, spChk=NULL)
Arguments
x a numeric vector the same length as the neighbours list in listw
listw a listw object created for example by nb2listw
nsim number of permutations
zero.policy if TRUE assign zero to the lagged value of zones without neighbours, if FALSEassign NA
alternative a character string specifying the alternative hypothesis, must be one of "greater"(default), or "less".
na.action a function (default na.fail), can also be na.omit or na.exclude - inthese cases the weights list will be subsetted to remove NAs in the data. Itmay be necessary to set zero.policy to TRUE because this subsetting may createno-neighbour observations. Note that only weights lists created without usingthe glist argument to nb2listw may be subsetted. na.pass is not permittedbecause it is meaningless in a permutation test.
spChk should the data vector names be checked against the spatial objects for identityintegrity, TRUE, or FALSE, default NULL to use get.spChkOption()
moran.mc 79
Value
A list with class htest and mc.sim containing the following components:
statistic the value of the observed Moran’s I.parameter the rank of the observed Moran’s I.p.value the pseudo p-value of the test.alternative a character string describing the alternative hypothesis.method a character string giving the method used.data.name a character string giving the name(s) of the data, and the number of simulations.res nsim simulated values of statistic, final value is observed statistic
Author(s)
Roger Bivand 〈[email protected]〉
References
Cliff, A. D., Ord, J. K. 1981 Spatial processes, Pion, p. 63-5.
See Also
moran, moran.test
Examples
data(oldcol)colw <- nb2listw(COL.nb, style="W")nsim <- 99set.seed(1234)sim1 <- moran.mc(spNamedVec("CRIME", COL.OLD), listw=colw, nsim=nsim)sim1mean(sim1$res[1:nsim])var(sim1$res[1:nsim])summary(sim1$res[1:nsim])MoranI.boot <- function(var, i, ...) {var <- var[i]return(moran(x=var, ...)$I)}set.seed(1234)library(boot)boot1 <- boot(spNamedVec("CRIME", COL.OLD), statistic=MoranI.boot, R=nsim, sim="permutation", listw=colw, n=nrow(COL.OLD), S0=Szero(colw))boot1plot(boot1)mean(boot1$t)var(boot1$t)summary(boot1$t)colold.lags <- nblag(COL.nb, 3)set.seed(1234)sim2 <- moran.mc(spNamedVec("CRIME", COL.OLD), nb2listw(colold.lags[[2]],style="W"), nsim=nsim)summary(sim2$res[1:nsim])sim3 <- moran.mc(spNamedVec("CRIME", COL.OLD), nb2listw(colold.lags[[3]],style="W"), nsim=nsim)summary(sim3$res[1:nsim])
80 moran.plot
moran.plot Moran scatterplot
Description
A plot of spatial data against its spatially lagged values, augmented by reporting the summary ofinfluence measures for the linear relationship between the data and the lag. If zero policy is TRUE,such observations are also marked if they occur.
Usage
moran.plot(x, listw, zero.policy=FALSE, spChk=NULL, labels=NULL,xlab=NULL, ylab=NULL, quiet=FALSE, ...)
Arguments
x a numeric vector the same length as the neighbours list in listw
listw a listw object created for example by nb2listw
zero.policy if TRUE assign zero to the lagged value of zones without neighbours, if FALSEassign NA
spChk should the data vector names be checked against the spatial objects for identityintegrity, TRUE, or FALSE, default NULL to use get.spChkOption()
labels character labels for points with high influence measures, if set to FALSE, nolabels are plotted for points with large influence
xlab label for x axis
ylab label for x axis
quiet if TRUE, output of summary of influence object suppressed
... further graphical parameters as in par(..)
Value
The function returns an influence object from influence.measures.
Author(s)
Roger Bivand 〈[email protected]〉
References
Anselin, L. 1996. The Moran scatterplot as an ESDA tool to assess local instability in spatialassociation. pp. 111–125 in M. M. Fischer, H. J. Scholten and D. Unwin (eds) Spatial analyticalperspectives on GIS, London, Taylor and Francis; Anselin, L. 1995. Local indicators of spatialassociation, Geographical Analysis, 27, 93–115
See Also
localmoran, summary.infl
moran.test 81
Examples
data(afcon)moran.plot(spNamedVec("totcon", afcon), nb2listw(paper.nb),labels=as.character(afcon$name), pch=19)moran.plot(scale(spNamedVec("totcon", afcon)), nb2listw(paper.nb),labels=as.character(afcon$name), xlim=c(-2, 4), ylim=c(-2,4), pch=19)
moran.test Moran’s I test for spatial autocorrelation
Description
Moran’s test for spatial autocorrelation using a spatial weights matrix in weights list form. Theassumptions underlying the test are sensitive to the form of the graph of neighbour relationshipsand other factors, and results may be checked against those of moran.mc permutations.
Usage
moran.test(x, listw, randomisation=TRUE, zero.policy=FALSE,alternative="greater", rank = FALSE, na.action=na.fail, spChk=NULL)
Arguments
x a numeric vector the same length as the neighbours list in listw
listw a listw object created for example by nb2listwrandomisation
variance of I calculated under the assumption of randomisation, if FALSE nor-mality
zero.policy if TRUE assign zero to the lagged value of zones without neighbours, if FALSEassign NA
alternative a character string specifying the alternative hypothesis, must be one of greater(default), less or two.sided.
rank logical value - default FALSE for continuous variables, if TRUE, uses the adap-tation of Moran’s I for ranks suggested by Cliff and Ord (1981, p. 46)
na.action a function (default na.fail), can also be na.omit or na.exclude - inthese cases the weights list will be subsetted to remove NAs in the data. It maybe necessary to set zero.policy to TRUE because this subsetting may create no-neighbour observations. Note that only weights lists created without using theglist argument to nb2listw may be subsetted. If na.pass is used, zero issubstituted for NA values in calculating the spatial lag
spChk should the data vector names be checked against the spatial objects for identityintegrity, TRUE, or FALSE, default NULL to use get.spChkOption()
Value
A list with class htest containing the following components:
statistic the value of the standard deviate of Moran’s I.
p.value the p-value of the test.

82 moran.test
estimate the value of the observed Moran’s I, its expectation and variance under themethod assumption.
alternative a character string describing the alternative hypothesis.
method a character string giving the assumption used for calculating the standard devi-ate.
data.name a character string giving the name(s) of the data.
Note
Var(I) is taken from Goodchild’s CATMOG 47, see also Upton & Fingleton (1985) p. 171; itagrees with SpaceStat, see Tutorial workbook Chapter 22; VI is as given by Cliff and Ord minusthe square of EI. The derivation of the test (Cliff and Ord, 1981, p. 18) assumes that the weightsmatrix is symmetric. For inherently non-symmetric matrices, such as k-nearest neighbour matrices,listw2U() can be used to make the matrix symmetric.
Author(s)
Roger Bivand 〈[email protected]〉
References
Cliff, A. D., Ord, J. K. 1981 Spatial processes, Pion, p. 21.
See Also
moran, moran.mc, listw2U
Examples
data(oldcol)moran.test(spNamedVec("CRIME", COL.OLD), nb2listw(COL.nb, style="W"))moran.test(spNamedVec("CRIME", COL.OLD), nb2listw(COL.nb, style="B"))moran.test(spNamedVec("CRIME", COL.OLD), nb2listw(COL.nb, style="C"))moran.test(spNamedVec("CRIME", COL.OLD), nb2listw(COL.nb, style="S"))moran.test(spNamedVec("CRIME", COL.OLD), nb2listw(COL.nb, style="W"),randomisation=FALSE)colold.lags <- nblag(COL.nb, 3)moran.test(spNamedVec("CRIME", COL.OLD), nb2listw(colold.lags[[2]],style="W"))moran.test(spNamedVec("CRIME", COL.OLD), nb2listw(colold.lags[[3]],style="W"))print(is.symmetric.nb(COL.nb))COL.k4.nb <- knn2nb(knearneigh(coords.OLD, 4))print(is.symmetric.nb(COL.k4.nb))moran.test(spNamedVec("CRIME", COL.OLD), nb2listw(COL.k4.nb, style="W"))moran.test(spNamedVec("CRIME", COL.OLD), nb2listw(COL.k4.nb, style="W"),randomisation=FALSE)cat("Note: non-symmetric weights matrix, use listw2U()")moran.test(spNamedVec("CRIME", COL.OLD), listw2U(nb2listw(COL.k4.nb,style="W")))moran.test(spNamedVec("CRIME", COL.OLD), listw2U(nb2listw(COL.k4.nb,style="W")), randomisation=FALSE)ranks <- rank(COL.OLD$CRIME)names(ranks) <- rownames(COL.OLD)moran.test(ranks, nb2listw(COL.nb, style="W"), rank=TRUE)
nb2blocknb 83
crime <- spNamedVec("CRIME", COL.OLD)is.na(crime) <- sample(1:length(crime), 10)res <- try(moran.test(crime, nb2listw(COL.nb, style="W"), na.action=na.fail))resmoran.test(crime, nb2listw(COL.nb, style="W"), zero.policy=TRUE,na.action=na.omit)moran.test(crime, nb2listw(COL.nb, style="W"), zero.policy=TRUE,na.action=na.exclude)moran.test(crime, nb2listw(COL.nb, style="W"), na.action=na.pass)
nb2blocknb Block up neighbour list for location-less observations
Description
The function blocks up a neighbour list for know spatial locations to create a new neighbour list formultiple location-less observations know to belong to the spatial locations, using the identificationtags of the locations as the key.
Usage
nb2blocknb(nb, ID, row.names = NULL)
Arguments
nb an object of class nb with a list of integer vectors containing neighbour regionnumber ids
ID identification tags of the locations for the location-less observations; sort(unique(as.character(ID)))must be identical to sort(as.character(attr(nb, "region.id")));same length as row.names if provided.
row.names character vector of observation ids to be added to the neighbours list as attributeregion.id, default seq(1, nrow(x)); same length as ID if provided.
Details
Assume that there is a list of unique locations, then a neighbour list can build for that, to create aninput neighbour list. This needs to be "unfolded", so that observations belonging to each uniquelocation are observation neighbours, and observations belonging to the location neighbours of theunique location in question are also observation neighbours, finally removing the observation itself(because it should not be its own neighbour). This scenario also arises when say only post codesare available, and some post codes contain multiple observations, where all that is known is thatthey belong to a specific post code, not where they are located within it (given that the post codelocations are known).
Value
The function returns an object of class nb with a list of integer vectors containing neighbour obser-vation number ids.
Author(s)
Roger Bivand 〈[email protected]〉
84 nb2lines
See Also
knn2nb, dnearneigh, cell2nb, tri2nb, poly2nb
Examples
data(boston)summary(as.vector(table(boston.c$TOWN)))townaggr <- aggregate(boston.utm, list(town=boston.c$TOWN), mean)block.rel <- graph2nb(relativeneigh(as.matrix(townaggr[,2:3])), as.character(townaggr[,1]), sym=TRUE)block.relprint(is.symmetric.nb(block.rel))plot(block.rel, as.matrix(townaggr[,2:3]))points(boston.utm, pch=18, col="lightgreen")block.nb <- nb2blocknb(block.rel, as.character(boston.c$TOWN))block.nbprint(is.symmetric.nb(block.nb))plot(block.nb, boston.utm)points(boston.utm, pch=18, col="lightgreen")moran.test(boston.c$CMEDV, nb2listw(boston.soi))moran.test(boston.c$CMEDV, nb2listw(block.nb))
nb2lines Use arc-type shapefiles for import and export of weights
Description
Use arc-type shapefiles for import and export of weights, storing spatial entity coordinates in thearcs, and the entity indices in the data frame.
Usage
nb2lines(nb, wts, coords)listw2lines(listw, coords)df2sn(df, i="i", i_ID="i_ID", j="j", wt="wt")
Arguments
nb a neighbour object of class nb
wts list of general weights corresponding to neighbours
coords matrix of region point coordinates
listw a listw object of spatial weights
df a data frame read from a shapefile, derived from the output of nb2lines
i character name of column in df with from entity index
i_ID character name of column in df with from entity region ID
j character name of column in df with to entity index
wt character name of column in df with weights
nb2listw 85
Details
The maptools package function write.linelistShape is used to transport out the list of linesmade by nb2lines or listw2lines, which is a simple wrapper function. The neighbour andweights objects may be retrieved by converting the specified columns of the attribute data of theMap object into a spatial.neighbour object, which is then converted into a weights list object.
Value
nb2lines and listw2lines return a list of two objects, ll is a list of lines, and df is a dataframe with the from and to indices of the neighbour links and their weights. df2sn converts thedata retrieved from reading the data from df back into a spatial.neighbour object.
Note
Original idea due to Gidske Leknes Andersen, Department of Biology, University of Bergen, Nor-way
Author(s)
Roger Bivand 〈[email protected]〉
See Also
sn2listw, write.linelistShape
Examples
data(columbus)res <- listw2lines(nb2listw(col.gal.nb), coords)str(res$df)fn <- paste(tempdir(), "nbshape", sep="/")write.linelistShape(res$ll, res$df, file=fn)inMap <- read.shape(fn)str(inMap$att.data)diffnb(sn2listw(df2sn(inMap$att.data))$neighbours, col.gal.nb)identical(coords, unique(t(sapply(Map2lines(inMap), function(x) x[1,]))))
nb2listw Spatial weights for neighbours lists
Description
The function supplements a neighbours list with spatial weights for the chosen coding scheme.
Usage
nb2listw(neighbours, glist=NULL, style="W", zero.policy=FALSE)

86 nb2listw
Arguments
neighbours an object of class nb
glist list of general weights corresponding to neighbours
style style can take values W, B, C, U, and S
zero.policy If FALSE stop with error for any empty neighbour sets, if TRUE permit theweights list to be formed with zero-length weights vectors
Details
Starting from a binary neighbours list, in which regions are either listed as neighbours or are absent(thus not in the set of neighbours for some definition), the function adds a weights list with valuesgiven by the coding scheme style chosen. B is the basic binary coding, W is row standardised (sumsover all links to n), C is globally standardised (sums over all links to n), U is equal to C divided bythe number of neighbours (sums over all links to unity), while S is the variance-stabilizing codingscheme proposed by Tiefelsdorf et al. 1999, p. 167-168 (sums over all links to n).
If zero policy is set to TRUE, weights vectors of zero length are inserted for regions without neigh-bour in the neighbours list. These will in turn generate lag values of zero, equivalent to the sumof products of the zero row t(rep(0, length=length(neighbours))) %*% x, for ar-bitraty numerical vector x of length length(neighbours). The spatially lagged value of x forthe zero-neighbour region will then be zero, which may (or may not) be a sensible choice.
If the sum of the glist vector for one or more observations is zero, a warning message is issued. Theconsequence for later operations will be the same as if no-neighbour observations were present andthe zero.policy argument set to true.
Value
A listw object with the following members:
style one of W, B, C, U, S as above
neighbours the input neighbours list
weights the weights for the neighbours and chosen style, with attributes set to report thetype of relationships (binary or general, if general the form of the glist argu-ment), and style as above
Author(s)
Roger Bivand 〈[email protected]〉
References
Tiefelsdorf, M., Griffith, D. A., Boots, B. 1999 A variance-stabilizing coding scheme for spatiallink matrices, Environment and Planning A, 31, pp. 165-180.
See Also
summary.nb, read.gal

nb2mat 87
Examples
data(columbus)cards <- card(col.gal.nb)col.w <- nb2listw(col.gal.nb)plot(cards, unlist(lapply(col.w$weights, sum)),xlim=c(0,10),ylim=c(0,10), xlab="number of links", ylab="row sums of weights")col.b <- nb2listw(col.gal.nb, style="B")points(cards, unlist(lapply(col.b$weights, sum)), col="red")col.c <- nb2listw(col.gal.nb, style="C")points(cards, unlist(lapply(col.c$weights, sum)), col="green")col.u <- nb2listw(col.gal.nb, style="U")points(cards, unlist(lapply(col.u$weights, sum)), col="orange")col.s <- nb2listw(col.gal.nb, style="S")points(cards, unlist(lapply(col.s$weights, sum)), col="blue")legend(x=c(0, 1), y=c(7, 9), legend=c("W", "B", "C", "U", "S"),col=c("black", "red", "green", "orange", "blue"), pch=rep(1,5))dlist <- nbdists(col.gal.nb, coords)dlist <- lapply(dlist, function(x) 1/x)col.w.d <- nb2listw(col.gal.nb, glist=dlist)summary(unlist(col.w$weights))summary(unlist(col.w.d$weights))# introducing other conditions into weights - only earlier sales count# see http://sal.uiuc.edu/pipermail/openspace/2005-October/000610.htmldata(baltimore)set.seed(211)dates <- sample(1:500, nrow(baltimore), replace=TRUE)nb_15nn <- knn2nb(knearneigh(cbind(baltimore$X, baltimore$Y), k=15))glist <- vector(mode="list", length=length(nb_15nn))for (i in seq(along=nb_15nn))glist[[i]] <- ifelse(dates[i] > dates[nb_15nn[[i]]], 1, 0)
listw_15nn_dates <- nb2listw(nb_15nn, glist=glist, style="B")which(lag(listw_15nn_dates, baltimore$PRICE) == 0.0)which(sapply(glist, sum) == 0)ex <- which(sapply(glist, sum) == 0)[1]dates[ex]dates[nb_15nn[[ex]]]
nb2mat Spatial weights matrices for neighbours lists
Description
The function generates a weights matrix for a neighbours list with spatial weights for the chosencoding scheme.
Usage
nb2mat(neighbours, glist=NULL, style="W", zero.policy=FALSE)listw2mat(listw)
Arguments
neighbours an object of class nb
88 nb2mat
glist list of general weights corresponding to neighbours
style style can take values W, B, C, and S
zero.policy If FALSE stop with error for any empty neighbour sets, if TRUE permit theweights list to be formed with zero-length weights vectors
listw a listw object from for example nb2listw
Details
Starting from a binary neighbours list, in which regions are either listed as neighbours or are absent(thus not in the set of neighbours for some definition), the function creates an n by n weightsmatrix with values given by the coding scheme style chosen. B is the basic binary coding, W is rowstandardised, C is globally standardised, while S is the variance-stabilizing coding scheme proposedby Tiefelsdorf et al. 1999, p. 167-168.
The function leaves matrix rows as zero for any regions with zero neighbours fore zero.policyTRUE. These will in turn generate lag values of zero, equivalent to the sum of products of the zerorow t(rep(0, length=length(neighbours))) %*% x, for arbitraty numerical vectorx of length length(neighbours). The spatially lagged value of x for the zero-neighbourregion will then be zero, which may (or may not) be a sensible choice.
Value
An n by n matrix, where n=length(neighbours)
Author(s)
Roger Bivand 〈[email protected]〉
References
Tiefelsdorf, M., Griffith, D. A., Boots, B. 1999 A variance-stabilizing coding scheme for spatiallink matrices, Environment and Planning A, 31, pp. 165-180.
See Also
nb2listw
Examples
data(columbus)col005 <- dnearneigh(coords, 0, 0.5, attr(col.gal.nb, "region.id"))summary(col005)col005.w.mat <- nb2mat(col005, zero.policy=TRUE)table(round(apply(col005.w.mat, 1, sum)))
nbdists 89
nbdists Spatial link distance measures
Description
Given a list of spatial neighbour links (a neighbours list of object type nb), the function returnsthe Euclidean distances along the links in a list of the same form as the neighbours list. If lonlat =TRUE, Great Circle distances are used.
Usage
nbdists(nb, coords, lonlat = FALSE)
Arguments
nb an object of class nb
coords matrix of point coordinates
lonlat TRUE if point coordinates are longitude-latitude decimal degrees, in which casedistances are measured in kilometers
Value
A list with class nbdist
Author(s)
Roger Bivand 〈[email protected]〉
See Also
summary.nb, nb2listw
Examples
data(columbus)dlist <- nbdists(col.gal.nb, coords)dlist <- lapply(dlist, function(x) 1/x)stem(unlist(dlist))
nblag Higher order neighbours lists
Description
The function creates higher order neighbour lists, where higher order neighbours are only lagslinks from each other on the graph described by the input neighbours list. It will refuse to lagneighbours lists with the attribute self.included set to TRUE.
90 nb.set.operations
Usage
nblag(neighbours, maxlag)
Arguments
neighbours input neighbours list of class nb
maxlag the maximum lag to be constructed
Value
returns a list of lagged neighbours lists each with class nb
Author(s)
Roger Bivand 〈[email protected]〉
See Also
summary.nb
Examples
data(columbus)summary(col.gal.nb, coords)library(maptools)plot(polys, border="grey", forcefill=FALSE)plot(col.gal.nb, coords, add=TRUE)title(main="GAL order 1 (black) and 2 (red) links")col.lags <- nblag(col.gal.nb, 2)summary(col.lags[[2]], coords)plot(col.lags[[2]], coords, add=TRUE, col="red", lty=2)
nb.set.operations Set operations on neighborhood objects
Description
Set operations on neighbors list objects
Usage
intersect.nb(nb.obj1,nb.obj2)union.nb(nb.obj1,nb.obj2)setdiff.nb(nb.obj1,nb.obj2)complement.nb(nb.obj)
Arguments
nb.obj a neighbor list created from any of the neighborhood list funtions
nb.obj1 a neighbor list created from any of the neighborhood list funtions
nb.obj2 a neighbor list created from any of the neighborhood list funtions
nc.sids 91
Details
These functions perform set operations on each element of a neighborlist. The arguments must beneighbor lists created from the same coordinates, and the region.id attributes must be identical.
Value
nb.obj A new neighborlist created from the set operations on the input neighbor list(s)
Author(s)
Nicholas Lewin-Koh 〈[email protected]〉
See Also
intersect.nb, union.nb, setdiff.nb
Examples
data(columbus)col.tri.nb <- tri2nb(coords)oldpar <- par(mfrow=c(1,2))col.soi.nb <- graph2nb(soi.graph(col.tri.nb, coords))library(maptools)plot(polys, border="grey", forcefill=FALSE)plot(col.soi.nb, coords, add=TRUE)title(main="Sphere of Influence Graph")plot(polys, border="grey", forcefill=FALSE)plot(complement.nb(col.soi.nb), coords, add=TRUE)title(main="Complement of Sphere of Influence Graph")par(mfrow=c(2,2))col2 <- droplinks(col.gal.nb, 21)plot(intersect.nb(col.gal.nb, col2), coords)title(main="Intersect")plot(union.nb(col.gal.nb, col2), coords)title(main="Union")plot(setdiff.nb(col.gal.nb, col2), coords)title(main="Set diff")par(oldpar)
nc.sids North Carolina SIDS data
Description
The nc.sids data frame has 100 rows and 9 columns. It contains data given in Cressie (1991,pp. 386-9), Cressie and Read (1985) and Cressie and Chan (1989) on sudden infant deaths in NorthCarolina for 1974-78 and 1979-84. The data set also contains the neighbour list given by Cressieand Chan (1989) omitting self-neighbours (ncCC89.nb), and the neighbour list given by Cressieand Read (1985) for contiguities (ncCR85.nb). The data are ordered by county ID number, notalphabetically as in the source tables sidspolys is a "polylist" object of polygon boundaries, andsidscents is a matrix of their centroids.
92 nc.sids
Usage
data(nc.sids)
Format
This data frame contains the following columns:
CNTY.ID county ID
BIR74 births, 1974-78
SID74 SID deaths, 1974-78
NWBIR74 non-white births, 1974-78
BIR79 births, 1979-84
SID79 SID deaths, 1979-84
NWBIR79 non-white births, 1979-84
east eastings, county seat, miles, local projection
north northings, county seat, miles, local projection
x easting, county seats approximately reprojected to UTM zone 18
y northings, county seats approximately reprojected to UTM zone 18
lon easting, county seats in long-lat
lat northings, county seats in long-lat
L.id Cressie and Read (1985) L index
M.id Cressie and Read (1985) M index
Source
Cressie, N (1991), Statistics for spatial data. New York: Wiley, pp. 386–389; Cressie, N, ChanNH (1989) Spatial modelling of regional variables. Journal of the American Statistical Associ-ation, 84, 393–401; Cressie, N, Read, TRC (1985) Do sudden infant deaths come in clusters?Statistics and Decisions Supplement Issue 2, 333–349; http://sal.agecon.uiuc.edu/datasets/sids.zip.
Examples
library(maptools)data(nc.sids)plot(sidspolys, border="grey", forcefill=FALSE)plot(ncCR85.nb, sidscents, add=TRUE, col="blue")plot(sidspolys, border="grey", forcefill=FALSE)plot(ncCC89.nb, cbind(nc.sids$lon, nc.sids$lat),add=TRUE, col="blue")
p.adjustSP 93
p.adjustSP Adjust local association measures’ p-values
Description
Make an adjustment to local association measures’ p-values based on the number of neighbours(+1) of each region, rather than the total number of regions.
Usage
p.adjustSP(p, nb, method = "none")
Arguments
p vector of p-values
nb a list of neighbours of class nb
method correction method as defined in p.adjust: "The adjustment methods includethe Bonferroni correction (’"bonferroni"’) in which the p-values are multipliedby the number of comparisons. Four less conservative corrections are also in-cluded by Holm (1979) (’"holm"’), Hochberg (1988) (’"hochberg"’), Hommel(1988) (’"hommel"’) and Benjamini & Hochberg (1995) (’"fdr"’), respectively.A pass-through option (’"none"’) is also included."
Value
A vector of corrected p-values using only the number of neighbours + 1.
Author(s)
Danlin Yu and Roger Bivand 〈[email protected]〉
See Also
p.adjust, localG, localmoran
Examples
data(afcon)oid <- order(afcon$id)resG <- as.vector(localG(spNamedVec("totcon", afcon), nb2listw(include.self(paper.nb))))non <- format.pval(pnorm(2*(abs(resG)), lower.tail=FALSE), 2)bon <- format.pval(p.adjustSP(pnorm(2*(abs(resG)), lower.tail=FALSE), paper.nb, "bonferroni"), 2)tot <- format.pval(p.adjust(pnorm(2*(abs(resG)), lower.tail=FALSE), "bonferroni", n=length(resG)), 2)data.frame(resG, non, bon, tot, row.names=afcon$name)[oid,]
94 plot.nb
plot.nb Plot a neighbours list
Description
A function to plot a neighbours list given point coordinates to represent the region in two dimen-sions; plot.listw is a wrapper that passes its neighbours component to plot.nb.
Usage
plot.nb(x, coords, col="black", points=TRUE, add=FALSE, arrows=FALSE, length=0.1, ...)plot.listw(x, coords, col="black", points=TRUE, add=FALSE, arrows=FALSE, length=0.1, ...)
Arguments
x an object of class nb or (for plot.listw) class listw
coords matrix of region point coordinates
col plotting colour
points (logical) add points to plot
add (logical) add to existing plot
arrows (logical) draw arrowheads for asymmetric neighbours
length length in plot inches of arrow heads drawn for asymmetric neighbours lists
... further graphical parameters as in par(..)
Author(s)
Roger Bivand 〈[email protected]〉
See Also
summary.nb
Examples
data(columbus)plot(col.gal.nb, coords)title(main="GAL order 1 links with first nearest neighbours in red")col.knn <- knearneigh(coords, k=1)plot(knn2nb(col.knn), coords, add=TRUE, col="red", length=0.08)
poly2nb 95
poly2nb Construct neighbours list from polygon list
Description
The function builds a neighbours list based on regions with contiguous boundaries, that is sharingone or more boundary point. The current function is in part interpreted and may run slowly formany regions or detailed boundaries, but from 0.2-16 should not fail because of lack of memorywhen single polygons are built of very many border coordinates.
Usage
poly2nb(pl, row.names = NULL, snap=sqrt(.Machine$double.eps), queen=TRUE)
Arguments
pl list of polygons of class polylist, or an object of class SpatialPolygons
row.names character vector of region ids to be added to the neighbours list as attributeregion.id, default seq(1, nrow(x)); if polys has a region.id at-tribute, it is copied to the neighbours list.
snap boundary points less than snap distance apart are considered to indicate conti-guity
queen if TRUE, a single shared boundary point meets the contiguity condition, ifFALSE, more than one shared point is required
Value
A neighbours list with class nb
Author(s)
Roger Bivand 〈[email protected]〉
See Also
summary.nb, plot.polylist
Examples
data(columbus)xx <- poly2nb(polys)dxx <- diffnb(xx, col.gal.nb)library(maptools)plot(polys, border="grey", forcefill=FALSE)plot(col.gal.nb, coords, add=TRUE)plot(dxx, coords, add=TRUE, col="red")title(main="Differences (red) in Columbus GAL weights (black)\nand polygon generated queen weights")xxx <- poly2nb(polys, queen=FALSE)dxxx <- diffnb(xxx, col.gal.nb)plot(polys, border = "grey", forcefill=FALSE)plot(col.gal.nb, coords, add = TRUE)plot(dxxx, coords, add = TRUE, col = "red")
96 predict.sarlm
title(main="Differences (red) in Columbus GAL weights (black)\nand polygon generated rook weights")cards <- card(xx)maxconts <- which(cards == max(cards))if(length(maxconts) > 1) maxconts <- maxconts[1]fg <- rep("grey", length(polys))fg[maxconts] <- "red"fg[xx[[maxconts]]] <- "green"plot(polys, col=fg, forcefill=FALSE)title(main="Region with largest number of contiguities")xx <- readShapePoly(system.file("shapes/sids.shp", package="maptools")[1], IDvar="FIPSNO", proj4string=CRS("+proj=longlat +ellps=clrk66"))xxnb <- poly2nb(as(xx, "SpatialPolygons"))plot(xx)plot(xxnb, coordinates(xx), add=TRUE, col="blue")
predict.sarlm Prediction for spatial simultaneous autoregressive linear model ob-jects
Description
predict.sarlm() calculates predictions as far as is at present possible for for spatial simul-taneous autoregressive linear model objects, using Haining’s terminology for decomposition intotrend, signal, and noise — see reference.
Usage
predict.sarlm(object, newdata = NULL, listw = NULL, zero.policy = FALSE, ...)print.sarlm.pred(x, ...)
Arguments
object sarlm object returned by lagsarlm or errorsarlm
newdata Data frame in which to predict — if NULL, predictions are for the data on whichthe model was fitted
listw a listw object created for example by nb2listw
zero.policy if TRUE assign zero to the lagged value of zones without neighbours, if FALSE(default) assign NA - causing lagsarlm() to terminate with an error
x the object to be printed
... further arguments passed through
Details
In the following, the trend is the non-spatial smooth, the signal is the spatial smooth, and the noiseis the residual. The fit returned is the sum of the trend and the signal.
The function approaches prediction first by dividing invocations between those with or withoutnewdata. When no newdata is present, the response variable may be reconstructed as the sum ofthe trend, the signal, and the noise (residuals). Since the values of the response variable are known,their spatial lags are used to calculate signal components (Cressie 1993, p. 564). For the errormodel, trend = Xβ, and signal = λWy − λWXβ. For the lag and mixed models, trend = Xβ, andsignal = ρWy.
predict.sarlm 97
This approach differs from the design choices made in other software, for example GeoDa, whichdoes not use observations of the response variable, and corresponds to the newdata situation de-scribed below.
When however newdata is used for prediction, no observations of the response variable being pre-dicted are available. Consequently, while the trend components are the same, the signal cannot takefull account of the spatial smooth. In the error model, the signal is set to zero, since the spatialsmooth is expressed in terms of the error: (I − λW )−1ε.
In the lag model, the signal can be expressed in the following way:
(I − ρW )y = Xβ + ε
,y = (I − ρW )−1Xβ + (I − ρW )−1ε
giving a feasible signal component of:
ρWy = ρW (I − ρW )−1Xβ
setting the error term to zero. This also means that predictions of the signal component for lag andmixed models require the inversion of an n-by-n matrix.
Because the outcomes of the spatial smooth on the error term are unobservable, this means that thesignal values for newdata are incomplete. In the mixed model, the spatially lagged RHS variablesinfluence both the trend and the signal, so that the root mean square prediction error in the examplesbelow for this case with newdata is smallest, although the model was not the best fit
Value
predict.sarlm() returns a vector of predictions with two attribute vectors of trend and signalvalues with class sarlm.pred. print.sarlm.pred is a print function for this class, printingand returning a data frame with columns: "fit", "trend" and "signal".
Author(s)
Roger Bivand 〈[email protected]〉
References
Haining, R. 1990 Spatial data analysis in the social and environmental sciences, Cambridge: Cam-bridge University Press, p. 258; Cressie, N. A. C. 1993 Statistics for spatial data, Wiley, NewYork.
See Also
errorsarlm, lagsarlm
Examples
data(oldcol)COL.lag.eig <- lagsarlm(CRIME ~ INC + HOVAL, data=COL.OLD, nb2listw(COL.nb))COL.mix.eig <- lagsarlm(CRIME ~ INC + HOVAL, data=COL.OLD, nb2listw(COL.nb),type="mixed")
COL.err.eig <- errorsarlm(CRIME ~ INC + HOVAL, data=COL.OLD, nb2listw(COL.nb))print(p1 <- predict(COL.mix.eig))
98 probmap
print(p2 <- predict(COL.mix.eig, newdata=COL.OLD, listw=nb2listw(COL.nb)))AIC(COL.mix.eig)sqrt(deviance(COL.mix.eig)/length(COL.nb))sqrt(sum((COL.OLD$CRIME - as.vector(p1))^2)/length(COL.nb))sqrt(sum((COL.OLD$CRIME - as.vector(p2))^2)/length(COL.nb))AIC(COL.err.eig)sqrt(deviance(COL.err.eig)/length(COL.nb))sqrt(sum((COL.OLD$CRIME - as.vector(predict(COL.err.eig)))^2)/length(COL.nb))sqrt(sum((COL.OLD$CRIME - as.vector(predict(COL.err.eig, newdata=COL.OLD,listw=nb2listw(COL.nb))))^2)/length(COL.nb))
AIC(COL.lag.eig)sqrt(deviance(COL.lag.eig)/length(COL.nb))sqrt(sum((COL.OLD$CRIME - as.vector(predict(COL.lag.eig)))^2)/length(COL.nb))sqrt(sum((COL.OLD$CRIME - as.vector(predict(COL.lag.eig, newdata=COL.OLD,listw=nb2listw(COL.nb))))^2)/length(COL.nb))
probmap Probability mapping for rates
Description
The function returns a data frame of rates for counts in populations at risk with crude rates, expectedcounts of cases, relative risks, and Poisson probabilities.
Usage
probmap(n, x, row.names=NULL)
Arguments
n a numeric vector of counts of cases
x a numeric vector of populations at risk
row.names row names passed through to output data frame
Details
The function returns a data frame, from which rates may be mapped after class intervals have beenchosen. The class intervals used in the examples are mostly taken from the referenced source.
Value
raw raw (crude) rates
expCount expected counts of cases assuming global rate
relRisk relative risks: ratio of observed and expected counts of cases multiplied by 100
pmap Poisson probability map values: probablility of getting a more “extreme” countthan actually observed - here two-tailed, with extreme tails indicating “unusual”values
Author(s)
Roger Bivand 〈[email protected]〉
read.gal 99
References
Bailey T, Gatrell A (1995) Interactive Spatial Data Analysis, Harlow: Longman, pp. 300–303.
See Also
EBest, EBlocal, ppois
Examples
data(auckland)res <- probmap(auckland$Deaths.1977.85, 9*auckland$Under.5.1981)brks <- c(-Inf,2,2.5,3,3.5,Inf)cols <- grey(6:2/7)library(maptools)plot(auckpolys, col=cols[findInterval(res$raw*1000, brks)], forcefill=FALSE)legend(c(70,90), c(70,95), fill=cols, legend=leglabs(brks), bty="n")title(main="Crude (raw) estimates of infant mortality per 1000 per year")brks <- c(-Inf,47,83,118,154,190,Inf)cols <- cm.colors(6)plot(auckpolys, col=cols[findInterval(res$relRisk, brks)], forcefill=FALSE)legend(c(70,90), c(70,95), fill=cols, legend=leglabs(brks), bty="n")title(main="Standardised mortality ratios for Auckland child deaths")brks <- c(0,0.05,0.1,0.2,0.8,0.9,0.95,1)cols <- cm.colors(7)plot(auckpolys, col=cols[findInterval(res$pmap, brks)], forcefill=FALSE)legend(c(70,90), c(70,95), fill=cols, legend=leglabs(brks), bty="n")title(main="Poisson probabilities for Auckland child mortality")
read.gal Read a GAL lattice file into a neighbours list
Description
The function read.gal() reads a GAL lattice file into a neighbours list for spatial analysis. Itwill read old and new style (GeoDa) GAL files. The function read.geoda is a helper file forreading comma separated value data files, calling read.csv().
Usage
read.gal(file, region.id=NULL, override.id=FALSE)read.geoda(file, row.names=NULL, skip=0)
Arguments
file name of file with GAL lattice data
region.id region IDs in specified order to coerse neighbours list order and numbering tothat of the region.id
override.id override any given (or NULL) region.id, collecting region.id numbering andorder from the GAL file.
row.names as in row.names in read.csv(), typically a character string naming the col-umn of the file to be used
skip skip number of lines, as in read.csv()

100 read.gal
Details
Luc Anselin (2003): Spatial Analysis Laboratory, Department of Agricultural and Consumer Eco-nomics, University of Illinois, Urbana-Champaign, http://sal.agecon.uiuc.edu/weights/howto.html; Luc Anselin (2003) GeoDa 0.9 User’s Guide, pp. 80–81, Spatial Analysis Lab-oratory, Department of Agricultural and Consumer Economics, University of Illinois, Urbana-Champaign, http://agec221.agecon.uiuc.edu/csiss/pdf/geoda093.pdf; GAL- Geographical Algorithms Library, University of Newcastle
Value
The function read.gal() returns an object of class nb with a list of integer vectors contain-ing neighbour region number ids. The function read.geoda returns a data frame, and issues awarning if the returned object has only one column.
Note
Example data downloaded from: http://sal.agecon.uiuc.edu/weights/zips/us48.zip
Author(s)
Roger Bivand 〈[email protected]〉
See Also
summary.nb
Examples
us48.fipsno <- read.geoda(system.file("etc/weights/us48.txt",package="spdep")[1])us48.q <- read.gal(system.file("etc/weights/us48_q.GAL", package="spdep")[1],us48.fipsno$Fipsno)us48.r <- read.gal(system.file("etc/weights/us48_rk.GAL", package="spdep")[1],us48.fipsno$Fipsno)data(state)if (as.numeric(paste(version$major, version$minor, sep="")) < 19) {m50.48 <- match(us48.fipsno$"State.name", state.name)} else {m50.48 <- match(us48.fipsno$"State_name", state.name)}plot(us48.q, as.matrix(as.data.frame(state.center))[m50.48,])plot(diffnb(us48.r, us48.q),as.matrix(as.data.frame(state.center))[m50.48,], add=TRUE, col="red")title(main="Differences between rook and queen criteria imported neighbours lists")

read.gwt2nb 101
read.gwt2nb Read and write spatial neighbour files
Description
The "gwt" functions read and write GeoDa GWT files (the example file baltk4.GWT was down-loaded from the site given in the reference), and the "dat" functions read and write Matlab sparsematrix files as used by James LeSage’s Spatial Econometrics Toolbox (the example file wmat.datwas downloaded from the site given in the reference).
Usage
read.gwt2nb(file, region.id=NULL)write.sn2gwt(sn, file, shpfile=NULL, ind=NULL)read.dat2listw(file)write.sn2dat(sn, file)
Arguments
file name of file with weights data
region.id region IDs
sn a spatial.neighbour object
shpfile Shapefile name taken from GWT file for this dataset
ind region id indicator variable name
Details
Now attempts to honour the region.id argument given when reading GWT files.
Value
read.gwt2nb returns a neighbour "nb" object with the generalised weights stored as a list ele-ment called "dlist" of the "GeoDa" attribute.
Author(s)
Roger Bivand 〈[email protected]〉
References
Luc Anselin (2003) GeoDa 0.9 User’s Guide, pp. 80–81, Spatial Analysis Laboratory, Departmentof Agricultural and Consumer Economics, University of Illinois, Urbana-Champaign, http://agec221.agecon.uiuc.edu/csiss/pdf/geoda093.pdf; also http://spatial-econometrics.com/data/contents.html
See Also
read.gal
102 residuals.sarlm
Examples
data(baltimore)STATION <- baltimore$STATIONgwt1 <- read.gwt2nb(system.file("etc/weights/baltk4.GWT", package="spdep")[1],STATION)cat(paste("Neighbours list symmetry;", is.symmetric.nb(gwt1, FALSE, TRUE),"\n"))listw1 <- nb2listw(gwt1, style="B", glist=attr(gwt1, "GeoDa")$dist)tmpGWT <- tempfile()write.sn2gwt(listw2sn(listw1), tmpGWT)gwt2 <- read.gwt2nb(tmpGWT, STATION)cat(paste("Neighbours list symmetry;", is.symmetric.nb(gwt2, FALSE, TRUE),"\n"))data(oldcol)diffnb(gwt1, gwt2)tmpMAT <- tempfile()COL.W <- nb2listw(COL.nb)write.sn2dat(listw2sn(COL.W), tmpMAT)listwmat1 <- read.dat2listw(tmpMAT)diffnb(listwmat1$neighbours, COL.nb, verbose=TRUE)listwmat2 <- read.dat2listw(system.file("etc/weights/wmat.dat",package="spdep")[1])diffnb(listwmat1$neighbours, listwmat2$neighbours, verbose=TRUE)
residuals.sarlm Access functions for spatial simultaneous autoregressive linear modelobjects
Description
Access functions for residuals, deviance, coefficients and fitted values from spatial simultaneousautoregressive linear model objects
Usage
residuals.sarlm(object, ...)deviance.sarlm(object, ...)coef.sarlm(object, ...)fitted.sarlm(object, ...)
Arguments
object sarlm object returned by lagsarlm or errorsarlm
... further arguments passed through
Value
Revelant vectors of numerical values.
Note
fitted.sarlm() returns the difference between residuals() for the same object and theresponse variable; predict.sarlm() returns a decomposition into trend and signal for the fit.

set.spChkOption 103
Author(s)
Roger Bivand, 〈[email protected]〉
See Also
errorsarlm, lagsarlm, predict.sarlm
set.spChkOption Control checking of spatial object IDs
Description
Provides support for checking the mutual integrity of spatial neighbour weights and spatial data.
Usage
set.spChkOption(check)get.spChkOption()chkIDs(x, listw)spNamedVec(var, data)
Arguments
check a logical value, TRUE or FALSEx a vector the same length, or a two-dimensional array, or data frame with the
same number of rows as the neighbours list in listwlistw a listw object or nb object inheriting from "nb"var a character string or integer value for the column to be selecteddata a two-dimensional array or data frame containing var
Details
Analysis functions will have an spChk argument by default set to NULL, and will call get.spChkOption()to get the global spatial option for whether to check or not — this is initialised to FALSE, and conse-quently should not break anything. It can be changed to TRUE using set.spChkOption(TRUE),or the spChk argument can be assigned in analysis functions. spNamedVec() is provided to en-sure that rownames are passed on to single columns taken from two-dimensional arrays and dataframes.
Value
set.spChkOption() returns the old logical value, get.spChkOption() returns the currentlogical value, and chkIDs() returns a logical value for the test lack of difference. spNamedVec()returns the selected column with the names set to the row names of the object from which it hasbeen extracted.
Note
The motivation for this mechanism is provided by the observation that spatial objects on a mapand their attribute data values need to be linked uniquely, to avoid spurious results. The reorderingbetween the legacy Columbus data set used the earlier publications and that available for downloadfrom the Spacestat website is just one example of a common problem.
104 similar.listw
Author(s)
Roger Bivand 〈[email protected]〉
Examples
data(oldcol)rownames(COL.OLD)data(columbus)rownames(columbus)get.spChkOption()oldChk <- set.spChkOption(TRUE)get.spChkOption()chkIDs(COL.OLD, nb2listw(COL.nb))chkIDs(columbus, nb2listw(col.gal.nb))chkIDs(columbus, nb2listw(COL.nb))tmp <- try(moran.test(spNamedVec("CRIME", COL.OLD), nb2listw(COL.nb)))print(tmp)tmp <- try(moran.test(spNamedVec("CRIME", columbus), nb2listw(col.gal.nb)))print(tmp)tmp <- try(moran.test(spNamedVec("CRIME", columbus), nb2listw(COL.nb)))print(tmp)set.spChkOption(FALSE)get.spChkOption()moran.test(spNamedVec("CRIME", columbus), nb2listw(COL.nb))tmp <- try(moran.test(spNamedVec("CRIME", columbus), nb2listw(COL.nb),spChk=TRUE))print(tmp)set.spChkOption(oldChk)get.spChkOption()
similar.listw Create symmetric similar weights lists
Description
From Ord’s 1975 paper, it is known that the Jacobian for SAR models may be found by "sym-metrizing" by similarity (the eigenvalues of similar matrices are identical, so the Jacobian is too).This applies only to styles "W" and "S" with underlying symmetric binary neighbour relations orsymmetric general neighbour relations (so no k-nearest neighbour relations). The function is in-voked automatically within the SAR fitting functions, to call eigen on a symmetric matrix for thedefault eigen method, or to make it possible to use the SparseM method on weights that can be"symmetrized" in this way.
Usage
similar.listw(listw)
Arguments
listw a listw object created for example by nb2listw
Value
a listw object

sp.correlogram 105
Author(s)
Roger Bivand 〈[email protected]〉
References
Ord, J. K. 1975 Estimation methods for models of spatial interaction, Journal of the AmericanStatistical Association, 70, 120-126
See Also
asMatrixCsrListw, lagsarlm, errorsarlm
Examples
data(oldcol)COL.W <- nb2listw(COL.nb, style="W")COL.S <- nb2listw(COL.nb, style="S")log(prod(1 - 0.5 * eigenw(COL.W)))log(prod(1 - 0.5 * eigenw(similar.listw(COL.W))))Det <- getMethod("det", "matrix.csr")log(Det(asMatrixCsrIrW(asMatrixCsrListw(similar.listw(COL.W)), 0.5)))log(prod(1 - 0.5 * eigenw(COL.S)))log(prod(1 - 0.5 * eigenw(similar.listw(COL.S))))log(Det(asMatrixCsrIrW(asMatrixCsrListw(similar.listw(COL.S)), 0.5)))
sp.correlogram Spatial correlogram
Description
Spatial correlograms for Moran’s I and the autocorrelation coefficient, with print and plot helperfunctions.
Usage
sp.correlogram(neighbours, var, order = 1, method = "corr", style = "W",randomisation = TRUE, zero.policy = FALSE, spChk=NULL)
plot.spcor(x, main, ylab, ylim, ...)print.spcor(x, p.adj.method="none", ...)
Arguments
neighbours an object of class nb
var a numeric vector
order maximum lag order
method "corr" for correlation, "I" for Moran’s I
style style can take values W, B, C, and Srandomisation
variance of I calculated under the assumption of randomisation, if FALSE nor-mality

106 sp.correlogram
zero.policy If FALSE stop with error for any empty neighbour sets, if TRUE permit theweights list to be formed with zero-length weights vectors
spChk should the data vector names be checked against the spatial objects for identityintegrity, TRUE, or FALSE, default NULL to use get.spChkOption()
x an object from sp.correlogram() of class spcor
p.adj.method correction method as in p.adjust
main an overall title for the plot
ylab a title for the y axis
ylim the y limits of the plot
... further arguments passed through
Details
The print function also calculates the standard deviates of Moran’s I and a two-sided probabilityvalue, optionally using p.adjust to correct by the nymber of lags. The plot function plots a barfrom the estimated Moran’s I value to +/- twice the square root of its variance (in previous releasesonly once, not twice).
Value
returns a list of class spcor:
res for "corr" a vector of values; for "I", a matrix of estimates of "I", expectations,and variances
method "I" or "corr"
cardnos list of tables of neighbour cardinalities for the lag orders used
var variable name
Author(s)
Roger Bivand, 〈[email protected]〉
References
Cliff, A. D., Ord, J. K. 1981 Spatial processes, Pion, pp. 118–122, Martin, R. L., Oeppen, J.E. 1975 The identification of regional forecasting models using space-time correlation functions,Transactions of the Institute of British Geographers, 66, 95–118.
See Also
nblag, moran, p.adjust
Examples
data(nc.sids)ft.SID74 <- sqrt(1000)*(sqrt(nc.sids$SID74/nc.sids$BIR74) +sqrt((nc.sids$SID74+1)/nc.sids$BIR74))
tr.SIDS74 <- ft.SID74*sqrt(nc.sids$BIR74)names(tr.SIDS74) <- rownames(nc.sids)cspc <- sp.correlogram(ncCC89.nb, tr.SIDS74, order=8, method="corr",zero.policy=TRUE)print(cspc)
sp.mantel.mc 107
plot(cspc)Ispc <- sp.correlogram(ncCC89.nb, tr.SIDS74, order=8, method="I",zero.policy=TRUE)print(Ispc)print(Ispc, "bonferroni")plot(Ispc)drop.no.neighs <- !(1:length(ncCC89.nb) %in% which(card(ncCC89.nb) == 0))sub.ncCC89.nb <- subset(ncCC89.nb, drop.no.neighs)plot(sp.correlogram(sub.ncCC89.nb, subset(tr.SIDS74, drop.no.neighs),order=8, method="corr"))
sp.mantel.mc Mantel-Hubert spatial general cross product statistic
Description
A permutation test for the spatial general cross product statistic with Moran (Cij = zizj), Geary(Cij = (zi − zj)2), and Sokal (Cij = |zi − zj |) criteria, for zi = (xi − x̄)/σx. plot.mc.sim isa helper function to plot the outcomes of the permutation test.
Usage
sp.mantel.mc(var, listw, nsim, type = "moran", zero.policy = FALSE,alternative = "greater", spChk=NULL)
plot.mc.sim(x, ...)
Arguments
var a numeric vector the same length as the neighbours list in listw
listw a listw object created for example by nb2listw
nsim number of permutations
type "moran", "geary" or "sokal" criteria for similarity
zero.policy if TRUE assign zero to the lagged value of zones without neighbours, if FALSEassign NA
alternative a character string specifying the alternative hypothesis, must be one of "greater"(default), or "less".
spChk should the data vector names be checked against the spatial objects for identityintegrity, TRUE, or FALSE, default NULL to use get.spChkOption()
x the object to be plotted
... further arguments passed through
Value
A list with class htest and mc.sim containing the following components:
statistic the value of the observed Geary’s C.
parameter the rank of the observed Geary’s C.
alternative a character string describing the alternative hypothesis.
method a character string giving the method used.
108 spautolm
data.name a character string giving the name(s) of the data, and the number of simulations.
p.value the pseudo p-value of the test.
res nsim simulated values of statistic, final value is observed statistic
estimate the mean and variance of the simulated distribution.
Author(s)
Roger Bivand 〈[email protected]〉
References
Cliff, A. D., Ord, J. K. 1981 Spatial processes, Pion, p. 22-24, Haining, R. 1990 Spatial dataanalysis in the social and environmental sciences, Cambridge: Cambridge University Press, p.230–1. The function has been checked against general matrix code posted to the r-help list by BenBolker on 1 May 2001; another mantel() function is in the vegan package.
See Also
moran.mc, joincount.mc, geary.mc
Examples
data(oldcol)sim1 <- sp.mantel.mc(spNamedVec("CRIME", COL.OLD), nb2listw(COL.nb),nsim=99, type="geary", alternative="less")sim1plot(sim1)sp.mantel.mc(spNamedVec("CRIME", COL.OLD), nb2listw(COL.nb), nsim=99,type="sokal", alternative="less")sp.mantel.mc(spNamedVec("CRIME", COL.OLD), nb2listw(COL.nb), nsim=99,type="moran")
spautolm Spatial conditional and simultaneous autoregression model estimation
Description
Function taking family and weights arguments for spatial autoregression model estimation by Max-imum Likelihood, using full matrix methods, not suited to large data sets with thousands of obser-vations. The implementation is GLS using the single spatial coefficient value, here termed lambda,found by line search using optimize to maximise the log likelihood.
Usage
spautolm(formula, data = list(), listw, weights = NULL, na.action=na.fail, verbose = FALSE, tol.opt = .Machine$double.eps^(2/3), family = "SAR", method="full", interval=c(-1,0.999), zero.policy = FALSE, cholAlloc=NULL, tol.solve=.Machine$double.eps)

spautolm 109
Arguments
formula a symbolic description of the model to be fit. The details of model specificationare given for lm()
data an optional data frame containing the variables in the model. By default thevariables are taken from the environment which the function is called.
listw a listw object created for example by nb2listw
na.action a function (default na.fail), can also be na.omit or na.exclude withconsequences for residuals and fitted values - in these cases the weights list willbe subsetted to remove NAs in the data. Note that only weights lists createdwithout using the glist argument to nb2listw may be subsetted.
weights an optional vector of weights to be used in the fitting process
verbose default=FALSE; if TRUE, reports function values during optimization.
tol.opt the desired accuracy of the optimization - passed to optimize()
family character string: either "SAR" or "CAR" for simultaneous or conditional au-toregressions
method character string: default "full" for use of full matrices, "SparseM" for sparsematrices (restricted to spatial weights symmetric or similar to symmetric)
interval search interval for autoregressive parameter when not using method="eigen";default is c(-1,0.999), optimize will reset NA/NaN to a bound and gives awarning when the interval is poorly set
zero.policy Include list of no-neighbour observations in output if TRUE — otherwise zero.policyis handled within the listw argument
cholAlloc control arguments for memory allocation in chol for sparse matrices in method="SparseM":if NULL, default values are used (larger than SparseM defaults), otherwisea list with elements: nsubmax, nnzlmax, and tmpmax, for example cholAl-loc=list(nsubmax=25000, nnzlmax=100000, tmpmax=25000)
tol.solve the tolerance for detecting linear dependencies in the columns of matrices to beinverted - passed to solve() (default=double precision machine tolerance).Errors in solve() may constitute indications of poorly scaled variables: ifthe variables have scales differing much from the autoregressive coefficient, thevalues in this matrix may be very different in scale, and inverting such a matrix isanalytically possible by definition, but numerically unstable; rescaling the RHSvariables alleviates this better than setting tol.solve to a very small value
Details
This implementation is based on lm.gls and errorsarlm, and should be treated as preliminary.In particular, the function does not (yet) prevent asymmetric spatial weights being used with "CAR"family models. It appears that both numerical issues (convergence in particular) and uncertaintiesabout the exact spatial weights matrix used make it difficult to reproduce Cressie and Chan’s 1989results, also given in Cressie 1993.
Note that the fitted() function for the output object assumes that the response variable may bereconstructed as the sum of the trend, the signal, and the noise (residuals). Since the values of theresponse variable are known, their spatial lags are used to calculate signal components (Cressie1993, p. 564). This differs from other software, including GeoDa, which does not use knowledgeof the response variable in making predictions for the fitting data.
110 spautolm
Value
A list object of class spautolm:
fit a list, with items:
coefficients ML coefficient estimates
SSE ML sum of squared errors
s2 ML residual variance
imat ML coefficient covariance matrix
signal_trend non-spatial component of fitted.values
signal_stochastic spatial component of fitted.values
fitted.values sum of non-spatial and spatial components of fitted.values
residuals difference between observed and fitted values
lambda ML autoregressive coefficient
LL log likelihood for fitted model
LL0 log likelihood for model with lambda=0
call the call used to create this object
parameters number of parameters estimated
aliased if not NULL, details of aliased variables
na.action (possibly) named vector of excluded or omitted observations if non-default na.actionargument used
Note
The standard errors given in Waller and Gotway (2004) are adjusted for the numbers of param-eters estimated, and may be reproduced by using the additional argument adj.se=TRUE in thesummary method. In addition, the function returns fitted values and residuals as given by Cressie(1993) p. 564.
Author(s)
Roger Bivand 〈[email protected]〉
References
Cliff, A. D., Ord, J. K. 1981 Spatial processes, Pion; Ord, J. K. 1975 Estimation methods for modelsof spatial interaction, Journal of the American Statistical Association, 70, 120-126; Waller, L. A.,Gotway, C. A. 2004 Applied spatial statistics for public health, Wiley, Hoboken, NJ, 325-380;Cressie, N. A. C. 1993 Statistics for spatial data, Wiley, New York, 548-568; Ripley, B. D. 1981Spatial statistics, Wiley, New York, 88-95.
See Also
optimize, errorsarlm
spautolm 111
Examples
## Not run:esarI <- errorsarlm(ft.SID74 ~ 1, data=mdata, listw=sids.nhbr.listw, zero.policy=TRUE)summary(esarI)esarIa <- spautolm(ft.SID74 ~ 1, data=mdata, listw=sids.nhbr.listw, family="SAR")summary(esarIa)esarIV <- errorsarlm(ft.SID74 ~ ft.NWBIR74, data=mdata, listw=sids.nhbr.listw, zero.policy=TRUE)summary(esarIV)esarIVa <- spautolm(ft.SID74 ~ ft.NWBIR74, data=mdata, listw=sids.nhbr.listw, family="SAR")summary(esarIVa)esarIaw <- spautolm(ft.SID74 ~ 1, data=mdata, listw=sids.nhbr.listw, weights=mdata$BIR74, family="SAR")summary(esarIaw)esarIIaw <- spautolm(ft.SID74 ~ both - 1, data=mdata, listw=sids.nhbr.listw, weights=mdata$BIR74, family="SAR")summary(esarIIaw)esarIVaw <- spautolm(ft.SID74 ~ ft.NWBIR74, data=mdata, listw=sids.nhbr.listw, weights=mdata$BIR74, family="SAR")summary(esarIVaw)ecarIaw <- spautolm(ft.SID74 ~ 1, data=mdata.4, listw=sids.nhbr.listw.4, weights=mdata.4$BIR74, family="CAR")summary(ecarIaw)ecarIIaw <- spautolm(ft.SID74 ~ both - 1, data=mdata.4, listw=sids.nhbr.listw.4, weights=mdata.4$BIR74, family="CAR")summary(ecarIIaw)ecarIVaw <- spautolm(ft.SID74 ~ ft.NWBIR74, data=mdata.4, listw=sids.nhbr.listw.4, weights=mdata.4$BIR74, family="CAR")summary(ecarIVaw)nc_LL$fitIV <- append(fitted.values(ecarIVaw), NA, outl-1)spplot(nc_LL, c("fitIV"), cuts=12) # Cressie 1993, p. 565## End(Not run)data(NY_data)lm0 <- lm(Z ~ PEXPOSURE + PCTAGE65P + PCTOWNHOME, data=nydata)summary(lm0)lm0w <- lm(Z ~ PEXPOSURE + PCTAGE65P + PCTOWNHOME, data=nydata, weights=POP8)summary(lm0w)esar0 <- errorsarlm(Z ~ PEXPOSURE + PCTAGE65P + PCTOWNHOME, data=nydata, listw=listw_NY)summary(esar0)esar1f <- spautolm(Z ~ PEXPOSURE + PCTAGE65P + PCTOWNHOME, data=nydata, listw=listw_NY, family="SAR", method="full")summary(esar1f)esar1s <- spautolm(Z ~ PEXPOSURE + PCTAGE65P + PCTOWNHOME, data=nydata, listw=listw_NY, family="SAR", method="SparseM")summary(esar1s)esar1wf <- spautolm(Z ~ PEXPOSURE + PCTAGE65P + PCTOWNHOME, data=nydata, listw=listw_NY, weights=nydata$POP8, family="SAR", method="full")summary(esar1wf)esar1ws <- spautolm(Z ~ PEXPOSURE + PCTAGE65P + PCTOWNHOME, data=nydata, listw=listw_NY, weights=nydata$POP8, family="SAR", method="SparseM")summary(esar1ws)ecar1f <- spautolm(Z ~ PEXPOSURE + PCTAGE65P + PCTOWNHOME, data=nydata, listw=listw_NY, family="CAR", method="full")summary(ecar1f)ecar1s <- spautolm(Z ~ PEXPOSURE + PCTAGE65P + PCTOWNHOME, data=nydata, listw=listw_NY, family="CAR", method="SparseM")summary(ecar1s)ecar1wf <- spautolm(Z ~ PEXPOSURE + PCTAGE65P + PCTOWNHOME, data=nydata, listw=listw_NY, weights=nydata$POP8, family="CAR", method="full")summary(ecar1wf)ecar1ws <- spautolm(Z ~ PEXPOSURE + PCTAGE65P + PCTOWNHOME, data=nydata, listw=listw_NY, weights=nydata$POP8, family="CAR", method="SparseM")summary(ecar1ws)data(oldcol)COL.errW.eig <- errorsarlm(CRIME ~ INC + HOVAL, data=COL.OLD, nb2listw(COL.nb, style="W"))summary(COL.errW.eig)COL.errW.sar <- spautolm(CRIME ~ INC + HOVAL, data=COL.OLD, nb2listw(COL.nb, style="W"))summary(COL.errW.sar)

112 spweights.constants
spdep Return package version number
Description
The function retreives package version and build information
Usage
spdep(build = FALSE)
Arguments
build if TRUE, also returns build information
Value
a character vector with one or two elements
Author(s)
Roger Bivand 〈[email protected]〉
spweights.constantsProvides constants for spatial weights matrices
Description
The function calculates the constants needed for tests of spatial autocorrelation for general weightsmatrices represented as listw objects
Usage
spweights.constants(listw, zero.policy=FALSE)Szero(listw)
Arguments
listw a listw object from for example nb2listw
zero.policy if TRUE ignore zones without neighbours, if FALSE fail when encountered
stsls 113
Value
n number of zones
n1 n - 1
n2 n - 2
n3 n - 3
nn n * n
S0 global sum of weights
S1 S1 sum of weights
S2 S2 sum of weights
Author(s)
Roger Bivand 〈[email protected]〉
References
Haining, R. 1990 Spatial data analysis in the social and environmental sciences, Cambridge Uni-versity Press, p. 233; Cliff, A. D., Ord, J. K. 1981 Spatial processes, Pion, p. 19, 21.
See Also
nb2listw
Examples
data(oldcol)B <- spweights.constants(nb2listw(COL.nb, style="B"))W <- spweights.constants(nb2listw(COL.nb, style="W"))C <- spweights.constants(nb2listw(COL.nb, style="C"))S <- spweights.constants(nb2listw(COL.nb, style="S"))U <- spweights.constants(nb2listw(COL.nb, style="U"))print(data.frame(rbind(unlist(B), unlist(W), unlist(C), unlist(S), unlist(U)),row.names=c("B", "W", "C", "S", "U")))
stsls Generalized spatial two stage least squares
Description
The function fits a spatial lag model by two stage least squares, with the option of adjusting theresults for heteroskedasticity.
Usage
stsls(formula, data = list(), listw, zero.policy = FALSE, na.action = na.fail, robust = FALSE)
114 stsls
Arguments
formula a symbolic description of the model to be fit. The details of model specificationare given for lm()
data an optional data frame containing the variables in the model. By default thevariables are taken from the environment which the function is called.
listw a listw object created for example by nb2listw
zero.policy if TRUE assign zero to the lagged value of zones without neighbours, if FALSE(default) assign NA - causing lagsarlm() to terminate with an error
na.action a function (default na.fail), can also be na.omit or na.exclude withconsequences for residuals and fitted values - in these cases the weights list willbe subsetted to remove NAs in the data. It may be necessary to set zero.policy toTRUE because this subsetting may create no-neighbour observations. Note thatonly weights lists created without using the glist argument to nb2listw maybe subsetted.
robust default FALSE, if TRUE, apply a heteroskedasticity correction to the coefficientestimatess and their covariances
Details
The fitting implementation fits a spatial lag model:
y = ρWy + Xβ + ε
by using spatially lagged X variables as instruments for the spatially lagged dependent variable.
Value
an object of class "stsls" containing:
coefficients coefficient estimates
var coefficient covariance matrix
sse sum of squared errors
residuals model residuals
df degrees of freedom
Author(s)
Luc Anselin and Roger Bivand
References
Kelejian, H.H. and I.R. Prucha (1998). A generalized spatial two stage least squares procedure forestimating a spatial autoregressive model with autoregressive disturbances. Journal of Real EstateFinance and Economics 17, 99-121.
See Also
lagsarlm

subset.listw 115
Examples
data(oldcol)COL.lag.eig <- lagsarlm(CRIME ~ INC + HOVAL, data=COL.OLD, nb2listw(COL.nb))summary(COL.lag.eig, correlation=TRUE)COL.lag.stsls <- stsls(CRIME ~ INC + HOVAL, data=COL.OLD, nb2listw(COL.nb))summary(COL.lag.stsls, correlation=TRUE)COL.lag.stslsR <- stsls(CRIME ~ INC + HOVAL, data=COL.OLD, nb2listw(COL.nb),robust=TRUE)summary(COL.lag.stslsR, correlation=TRUE)data(boston)gp2a <- stsls(log(CMEDV) ~ CRIM + ZN + INDUS + CHAS + I(NOX^2) + I(RM^2) + AGE + log(DIS) + log(RAD) + TAX + PTRATIO + B + log(LSTAT), data=boston.c, nb2listw(boston.soi))summary(gp2a)
subset.listw Subset a spatial weights list
Description
The function subsets a spatial weights list, retaining objects for which the subset argument vector isTRUE. At present it will only subset non-general weights lists (that is those created by nb2listwwith glist=NULL).
Usage
subset.listw(x, subset, zero.policy = FALSE, ...)
Arguments
x an object of class listw
subset logical expression
zero.policy If FALSE stop with error for any empty neighbour sets, if TRUE permit theweights list to be formed with zero-length weights vectors - passed through tonb2listw
... generic function pass-through
Value
The function returns an object of class listw with component style the same as the input ob-ject, component neighbours a list of integer vectors containing neighbour region number ids(compacted to run from 1:number of regions in subset), and component weights as the weightscomputed for neighbours using style.
Author(s)
Roger Bivand 〈[email protected]〉
See Also
nb2listw, subset.nb
116 subset.nb
Examples
data(columbus)to.be.dropped <- c(31, 34, 36, 39, 42, 46)pre <- nb2listw(col.gal.nb)print(pre)post <- subset(pre, !(1:length(col.gal.nb) %in% to.be.dropped))print(post)
subset.nb Subset a neighbours list
Description
The function subsets a neighbors list, retaining objects for which the subset argument vector isTRUE.
Usage
subset.nb(x, subset, ...)
Arguments
x an object of class nb
subset logical expression
... generic function pass-through
Value
The function returns an object of class nb with a list of integer vectors containing neighbour regionnumber ids (compacted to run from 1:number of regions in subset).
Author(s)
Roger Bivand 〈[email protected]〉
See Also
nb2listw
Examples
data(columbus)plot(col.gal.nb, coords)to.be.dropped <- c(31, 34, 36, 39, 42, 46)text(coords[to.be.dropped,1], coords[to.be.dropped,2], labels=to.be.dropped,pos=2, offset=0.3)
sub.col.gal.nb <- subset(col.gal.nb,!(1:length(col.gal.nb) %in% to.be.dropped))
plot(sub.col.gal.nb, coords[-to.be.dropped,], col="red", add=TRUE)which(!(attr(col.gal.nb, "region.id") %in%attr(sub.col.gal.nb, "region.id")))
summary.nb 117
summary.nb Print and summary function for neighbours and weights lists
Description
The function prints summary measures for links in a neighbours list. If a matrix of coordinatesis given as well, summary descriptive measures for the link lengths are also printed. Print andsummary functions are also available for "listw" weights list objects.
Usage
summary.nb(object, coords=NULL, lonlat = FALSE, scale = 1, ...)print.nb(x, ...)summary.listw(object, coords, lonlat, zero.policy = FALSE, scale = 1, ...)print.listw(x, zero.policy = FALSE, ...)
Arguments
object an object of class nb
coords matrix of region point coordinates
lonlat TRUE if point coordinates are longitude-latitude decimal degrees, in which casedistances are measured in kilometers
... additional arguments affecting the output produced
x an object of class nb
zero.policy If FALSE stop with error for any empty neighbour sets
scale passed through to stem() for control of plot length
Author(s)
Roger Bivand 〈[email protected]〉
See Also
plot.nb
Examples
data(columbus)col.gal.nbsummary(col.gal.nb, coords)col.listw <- nb2listw(col.gal.nb, style="W")col.listwsummary(col.listw)

118 summary.sarlm
summary.sarlm summary method for class sarlm
Description
Methods used for presenting the results of estimating spatial SAR models.
Usage
summary.sarlm(object, correlation = FALSE, ...)print.sarlm(x, ...)print.summary.sarlm(x, digits = max(5, .Options$digits - 3),
signif.stars = FALSE, ...)
Arguments
object sarlm object from lagsarlm or errorsarlm
correlation logical; if ’TRUE’, the correlation matrix of the estimated parameters includingsigma is returned and printed (default=FALSE)
x sarlm object from lagsarlm or errorsarlm in print.sarlm, sum-mary object from summary.sarlm for print.summary.sarlm
digits the number of significant digits to use when printing
signif.stars logical. If TRUE, "significance stars" are printed for each coefficient.
... further arguments passed to or from other methods
Value
The summary function summary.sarlm returns the sarlm object augmented with a coefficientmatrix with probability values for coefficient asymptotic standard errors for type="error" and fortype="lag" or "mixed" when object$ase=TRUE, or a coefficient matrix with probability values forlikelihood ratio tests between the model as reported and models with independent variables droppedin turn.
Author(s)
Roger Bivand 〈[email protected]〉
References
Cliff, A. D., Ord, J. K. 1981 Spatial processes, Pion; Ord, J. K. 1975 Estimation methods for modelsof spatial interaction, Journal of the American Statistical Association, 70, 120-126; Anselin, L. 1988Spatial econometrics: methods and models. (Dordrecht: Kluwer); Anselin, L. 1995 SpaceStat, asoftware program for the analysis of spatial data, version 1.80. Regional Research Institute, WestVirginia University, Morgantown, WV (www.spacestat.com); Anselin L, Bera AK (1998)Spatial dependence in linear regression models with an introduction to spatial econometrics. In:Ullah A, Giles DEA (eds) Handbook of applied economic statistics. Marcel Dekker, New York, pp.237-289.
See Also
errorsarlm, lagsarlm, summary.lm
is.symmetric.nb 119
Examples
data(oldcol)COL.mix.eig <- lagsarlm(CRIME ~ INC + HOVAL, data=COL.OLD,nb2listw(COL.nb), type="mixed", method="eigen", quiet=FALSE)summary(COL.mix.eig, correlation=TRUE)
is.symmetric.nb Test a neighbours list for symmetry
Description
Checks a neighbours list for symmetry/transitivity (if i is a neighbour of j, then j is a neigh-bour of i). This holds for distance and contiguity based neighbours, but not for k-nearest neigh-bours. The helper function sym.attr.nb() calls is.symmetric.nb() to set the sym at-tribute if needed, and make.sym.nb makes a non-symmetric list symmetric by adding neighbors.is.symmetric.glist checks a list of general weights corresponding to neighbours for sym-metry for symmetric neighbours.
Usage
is.symmetric.nb(nb, verbose = TRUE, force = FALSE)sym.attr.nb(nb)make.sym.nb(nb)is.symmetric.glist(nb, glist)
Arguments
nb an object of class nb with a list of integer vectors containing neighbour regionnumber ids.
verbose if TRUE prints non-matching pairs
force do not respect a neighbours list sym attribute and test anyway
glist list of general weights corresponding to neighbours
Value
TRUE if symmetric, FALSE if not
Author(s)
Roger Bivand 〈[email protected]〉
See Also
read.gal

120 tri2nb
Examples
data(columbus)print(is.symmetric.nb(col.gal.nb, verbose=TRUE, force=TRUE))k4 <- knn2nb(knearneigh(coords, k=4), row.names=rownames(columbus))k4 <- sym.attr.nb(k4)print(is.symmetric.nb(k4))k4.sym <- make.sym.nb(k4)print(is.symmetric.nb(k4.sym))
tri2nb Neighbours list from tri object
Description
The function uses the tripack package to convert a matrix of two-dimensional coordinates intoa neighbours list of class nb with a list of integer vectors containing neighbour region number ids.
Usage
tri2nb(coords, row.names = NULL)
Arguments
coords matrix of point coordinates with two columns
row.names character vector of region ids to be added to the neighbours list as attributeregion.id, default seq(1, nrow(x))
Details
If the coordinates are from a grid, then they need to be ordered such that the first three are notcollinear, so that the first triangle can be constructed. This can be achieved by randomising the orderof the coordinates (possibly several times), and then re-ordering the order of the data to match thenew order of the neighbour list - if this fix is used, remember to re-order the row.names argument aswell as the coordinates! Please also note that triangulation of grid points will give arbitrary diagonalneighbours, which may not be a sensible outcome, and dnearneigh() may serve better wheretri2nb() cannot be used.
Value
The function returns an object of class nb with a list of integer vectors containing neighbour regionnumber ids.
Author(s)
Roger Bivand 〈[email protected]〉
See Also
knn2nb, dnearneigh, cell2nb

used.cars 121
Examples
require(tripack)data(columbus)col.tri.nb <- tri2nb(coords, row.names=rownames(columbus))library(maptools)plot(polys, border="grey", forcefill=FALSE)plot(col.tri.nb, coords, add=TRUE)title(main="Raw triangulation links")x <- seq(0,1,0.1)y <- seq(0,2,0.2)xy <- expand.grid(x, y)try(xy.nb <- tri2nb(xy))seed <- 1234xid <- sample(1:nrow(xy))xy.nb <- tri2nb(xy[xid,])plot(xy.nb, xy[xid,])
used.cars US 1960 used car prices
Description
The used.cars data frame has 48 rows and 2 columns. The data set includes a neighbours listfor the 48 states excluding DC from poly2nb().
Usage
data(used.cars)
Format
This data frame contains the following columns:
tax.charges taxes and delivery charges for 1955-9 new cars
price.1960 1960 used car prices by state
Source
Hanna, F. A. 1966 Effects of regional differences in taxes and transport charges on automobile con-sumption, in Ostry, S., Rhymes, J. K. (eds) Papers on regional statistical studies, Toronto: TorontoUniversity Press, pp. 199-223.
References
Hepple, L. W. 1976 A maximum likelihood model for econometric estimation with spatial series,in Masser, I (ed) Theory and practice in regional science, London: Pion, pp. 90-104.
122 write.nb.gal
Examples
data(used.cars)moran.test(spNamedVec("price.1960", used.cars), nb2listw(usa48.nb))moran.plot(spNamedVec("price.1960", used.cars), nb2listw(usa48.nb),labels=rownames(used.cars))
uc.lm <- lm(price.1960 ~ tax.charges, data=used.cars)summary(uc.lm)lm.morantest(uc.lm, nb2listw(usa48.nb))lm.morantest.sad(uc.lm, nb2listw(usa48.nb))lm.LMtests(uc.lm, nb2listw(usa48.nb))uc.err <- errorsarlm(price.1960 ~ tax.charges, data=used.cars,nb2listw(usa48.nb), tol.solve=1.0e-13, tol.opt=.Machine$double.eps^0.3)
summary(uc.err)uc.lag <- lagsarlm(price.1960 ~ tax.charges, data=used.cars,nb2listw(usa48.nb), tol.solve=1.0e-13, tol.opt=.Machine$double.eps^0.3)
summary(uc.lag)uc.lag1 <- lagsarlm(price.1960 ~ 1, data=used.cars,nb2listw(usa48.nb), tol.solve=1.0e-13, tol.opt=.Machine$double.eps^0.3)
summary(uc.lag1)uc.err1 <- errorsarlm(price.1960 ~ 1, data=used.cars,nb2listw(usa48.nb), tol.solve=1.0e-13, tol.opt=.Machine$double.eps^0.3)
summary(uc.err1)
write.nb.gal Write a neighbours list as a GAL lattice file
Description
Write a neighbours list as a GAL lattice file, may also use newer GeoDa header format
Usage
write.nb.gal(nb, file, oldstyle=TRUE, shpfile=NULL, ind=NULL)
Arguments
nb an object of class nb with a list of integer vectors containing neighbour regionnumber ids.
file name of file with GAL lattice data
oldstyle if TRUE, first line of file contains only number of spatial units, if FALSE, usesnewer GeoDa style
shpfile Shapefile name taken from GAL file for this dataset
ind region id indicator variable name
Author(s)
Roger Bivand 〈[email protected]〉
See Also
read.gal

write.nb.gal 123
Examples
data(columbus)ind <- rownames(columbus)GALfile <- tempfile("GAL")write.nb.gal(col.gal.nb, GALfile, oldstyle=FALSE, ind="ind")col.queen <- read.gal(GALfile, region.id=ind)unlink(GALfile)summary(diffnb(col.queen, col.gal.nb))
Index
∗Topic datasetsafcon, 15auckland, 19baltimore, 21boston, 22columbus, 28eire, 35getisord, 44hopkins, 48huddersfield, 48nc.sids, 89NY_data, 12oldcol, 1used.cars, 119
∗Topic spatialairdist, 16anova.sarlm, 17asMatrixCsrListw, 18autocov_dist, 19bptest.sarlm, 24card, 25cell2nb, 26choynowski, 27diffnb, 30dnearneigh, 31droplinks, 32EBest, 4EBImoran.mc, 3EBlocal, 6edit.nb, 33eigenw, 34errorsarlm, 36geary, 39geary.mc, 41geary.test, 42globalG.test, 44GMerrorsar, 7Graph Components, 29graphneigh, 46include.self, 49invIrM, 50is.symmetric.nb, 117joincount.mc, 51
joincount.multi, 52joincount.test, 54knearneigh, 56knn2nb, 57lag.listw, 58lagsarlm, 59listw2sn, 62lm.LMtests, 63lm.morantest, 65lm.morantest.sad, 66localG, 68localmoran, 70localmoran.sad, 71LR.sarlm, 9mat2listw, 74ME, 10moran, 75moran.mc, 76moran.plot, 78moran.test, 79nb.set.operations, 88nb2blocknb, 81nb2lines, 82nb2listw, 83nb2mat, 85nbdists, 87nblag, 87p.adjustSP, 91plot.nb, 92poly2nb, 93predict.sarlm, 94probmap, 96read.gal, 97read.gwt2nb, 99residuals.sarlm, 100set.spChkOption, 101similar.listw, 102sp.correlogram, 103sp.mantel.mc, 105SpatialFiltering, 13spautolm, 106spdep, 110spweights.constants, 110
124
INDEX 125
stsls, 111subset.listw, 113subset.nb, 114summary.nb, 115summary.sarlm, 116tri2nb, 118write.nb.gal, 120
afcon, 15africa.rook.nb (afcon), 15afxy (afcon), 15AIC, 17airdist, 16anova.sarlm, 10, 17as.data.frame.localmoransad
(localmoran.sad), 71as.matrix.csr, 18asListwMatrixCsr
(asMatrixCsrListw), 18asMatrixCsrI (asMatrixCsrListw),
18asMatrixCsrIrW
(asMatrixCsrListw), 18asMatrixCsrListw, 18, 39, 61, 103auckland, 19auckpolys (auckland), 19autocov_dist, 19
baltimore, 21bbs (columbus), 28boston, 22bptest.sarlm, 24
card, 25cell2nb, 26, 82, 118chkIDs (set.spChkOption), 101choynowski, 27coef.gmsar (GMerrorsar), 7coef.sarlm (residuals.sarlm), 100coef.spautolm (spautolm), 106coef.stsls (stsls), 111col.gal.nb (columbus), 28COL.nb (oldcol), 1COL.OLD (oldcol), 1columbus, 28complement.nb
(nb.set.operations), 88coords (columbus), 28coords.OLD (oldcol), 1
deviance.gmsar (GMerrorsar), 7deviance.sarlm (residuals.sarlm),
100
deviance.spautolm (spautolm), 106deviance.stsls (stsls), 111df2sn (nb2lines), 82diffnb, 30dnearneigh, 31, 47, 56, 82, 118droplinks, 32
EBest, 4, 4, 7, 97EBImoran (EBImoran.mc), 3EBImoran.mc, 3, 5EBlocal, 5, 6, 97edit.nb, 33eigen, 15, 34eigenw, 34, 39, 61eire, 35eire.coords.utm (eire), 35eire.df (eire), 35eire.nb (eire), 35eire.polys.utm (eire), 35errorsarlm, 8, 25, 36, 61, 62, 73, 95, 101,
103, 107, 108, 116
fitted.gmsar (GMerrorsar), 7fitted.ME_res (ME), 10fitted.sarlm (residuals.sarlm),
100fitted.SFResult
(SpatialFiltering), 13fitted.spautolm (spautolm), 106
gabrielneigh (graphneigh), 46geary, 39, 41, 43geary.mc, 40, 41, 43, 106geary.test, 40, 41, 42get.spChkOption
(set.spChkOption), 101getisord, 44glm, 11globalG.test, 44GMerrorsar, 7Graph Components, 29graph2nb (graphneigh), 46graphneigh, 46
hopkins, 48huddersfield, 48
include.self, 49intersect.nb, 89intersect.nb (nb.set.operations),
88invIrM, 50invIrW (invIrM), 50
126 INDEX
is.symmetric.glist(is.symmetric.nb), 117
is.symmetric.nb, 33, 117
joincount.mc, 51, 55, 106joincount.multi, 52, 55joincount.test, 52, 53, 54
knearneigh, 31, 47, 56, 57knn, 56knn2nb, 47, 56, 57, 82, 118
lag.listw, 58lagsarlm, 25, 39, 59, 62, 95, 101, 103, 112,
116listw2lines (nb2lines), 82listw2mat (nb2mat), 85listw2sn, 62listw2star (localmoran.sad), 71listw2U, 15, 43, 55, 80listw2U (lm.morantest), 65listw_NY (NY_data), 12lm, 15, 39, 61, 64, 66lm.gls, 107lm.LMtests, 63, 66lm.morantest, 65, 68, 73lm.morantest.sad, 66, 73localG, 45, 68, 71, 91localmoran, 70, 73, 78, 91localmoran.sad, 71locator, 16logLik.gmsar (GMerrorsar), 7logLik.lm, 10logLik.sarlm (LR.sarlm), 9logLik.spautolm (spautolm), 106LR.sarlm, 9, 17LR1.gmsar (GMerrorsar), 7LR1.sarlm (LR.sarlm), 9LR1.spautolm (spautolm), 106
make.sym.nb (is.symmetric.nb), 117mat2listw, 74ME, 10moran, 4, 75, 77, 80, 104moran.mc, 4, 76, 76, 80, 106moran.plot, 78moran.test, 76, 77, 79mrc2vi (cell2nb), 26
n.comp.nb (Graph Components), 29nb.set.operations, 88nb2blocknb, 81nb2lines, 82
nb2listw, 15, 20, 50, 58, 62, 74, 83, 86, 87,111, 113, 114
nb2mat, 74, 85nbdists, 87nblag, 87, 104nc.sids, 89ncCC89.nb (nc.sids), 89ncCR85.nb (nc.sids), 89NY_data, 12nydata (NY_data), 12
oldcol, 1optim, 7, 8, 38, 60optimize, 108
p.adjust, 91, 104p.adjustSP, 70, 91paper.nb (afcon), 15plot.Gabriel (graphneigh), 46plot.listw (plot.nb), 92plot.mc.sim (sp.mantel.mc), 105plot.nb, 29, 34, 92, 115plot.polylist, 93plot.relative (graphneigh), 46plot.spcor (sp.correlogram), 103poly2nb, 82, 93polys (columbus), 28polys.OLD (oldcol), 1ppois, 97predict.sarlm, 39, 61, 94, 101print.gmsar (GMerrorsar), 7print.jclist (joincount.test), 54print.jcmulti (joincount.multi),
52print.listw (summary.nb), 115print.LMtestlist (lm.LMtests), 63print.localmoransad
(localmoran.sad), 71print.ME_res (ME), 10print.moransad
(lm.morantest.sad), 66print.nb (summary.nb), 115print.sarlm (summary.sarlm), 116print.sarlm.pred (predict.sarlm),
94print.SFResult
(SpatialFiltering), 13print.spautolm (spautolm), 106print.spcor (sp.correlogram), 103print.stsls (stsls), 111print.summary.gmsar (GMerrorsar),
7
INDEX 127
print.summary.localmoransad(localmoran.sad), 71
print.summary.moransad(lm.morantest.sad), 66
print.summary.sarlm(summary.sarlm), 116
print.summary.spautolm(spautolm), 106
print.summary.stsls (stsls), 111probmap, 5, 7, 27, 96
queencell (cell2nb), 26
read.dat2listw (read.gwt2nb), 99read.gal, 84, 97, 99, 117, 120read.geoda (read.gal), 97read.gwt2nb, 99relativeneigh (graphneigh), 46residuals.gmsar (GMerrorsar), 7residuals.sarlm, 39, 61, 100residuals.spautolm (spautolm), 106residuals.stsls (stsls), 111rookcell (cell2nb), 26
set.spChkOption, 101setdiff.nb, 89setdiff.nb (nb.set.operations), 88sidscents (nc.sids), 89sidspolys (nc.sids), 89similar.listw, 39, 102sn2listw, 83sn2listw (listw2sn), 62soi.graph (graphneigh), 46sp.correlogram, 103sp.mantel.mc, 40, 105SpatialFiltering, 11, 13spautolm, 106spdep, 110spNamedVec (set.spChkOption), 101spweights.constants, 110stsls, 111subset.listw, 113subset.nb, 113, 114summary.gmsar (GMerrorsar), 7summary.infl, 78summary.listw (summary.nb), 115summary.lm, 116summary.localmoransad
(localmoran.sad), 71summary.moransad
(lm.morantest.sad), 66summary.nb, 25, 26, 34, 49, 84, 87, 88, 92,
93, 98, 115
summary.sarlm, 116summary.spautolm (spautolm), 106summary.stsls (stsls), 111sym.attr.nb (is.symmetric.nb), 117Szero (spweights.constants), 110
tri2nb, 82, 118
union.nb, 89union.nb (nb.set.operations), 88usa48.nb (used.cars), 119used.cars, 119
vi2mrc (cell2nb), 26
Wald1.sarlm (LR.sarlm), 9write.linelistShape, 83write.nb.gal, 120write.sn2dat (read.gwt2nb), 99write.sn2gwt (read.gwt2nb), 99
x (getisord), 44xyz (getisord), 44
y (getisord), 44