the somatosensory cortex receives information about motor ...the somatosensory cortex receives...
TRANSCRIPT

SC I ENCE ADVANCES | R E S EARCH ART I C L E
NEUROSC I ENCE
1Department of Neurophysiology, National Institute of Neuroscience, NationalCenter of Neurology and Psychiatry, Kodaira, Tokyo 187-8502, Japan. 2Departmentof Developmental Physiology, National Institute for Physiological Sciences, NationalInstitute of Natural Sciences, Okazaki, Aichi 444-8585, Japan. 3Department of Neu-roscience, Graduate School of Medicine, Kyoto University, Kyoto 606-8501, Japan.4Human Brain Research Center, Graduate School of Medicine, Kyoto University, Kyoto606-8507, Japan. 5Institute for the Advanced Study of Human Biology (WPI-ASHBi),Kyoto University, Kyoto 606-8501, Japan. 6School of Life Science, The Graduate Universityfor Advanced Studies (SOKENDAI), Hayama, Kanagawa 240-0193, Japan. 7Neural ProsthesisProject, Department of Dementia and Higher Brain Function, Tokyo Metropolitan Insti-tute of Medical Science, Setagaya, Tokyo 156-8506, Japan. 8PRESTO, Japan Scienceand Technology Agency (JST), Kawaguchi, Saitama 332-0012, Japan.*Corresponding author. Email: [email protected] (T.U.); [email protected] (Y.N.)
Umeda et al., Sci. Adv. 2019;5 : eaaw5388 10 July 2019
Copyright © 2019
The Authors, some
rights reserved;
exclusive licensee
American Association
for the Advancement
of Science. No claim to
originalU.S. Government
Works. Distributed
under a Creative
Commons Attribution
NonCommercial
License 4.0 (CC BY-NC).
D
The somatosensory cortex receives information aboutmotor outputTatsuya Umeda1,2*, Tadashi Isa2,3,4,5,6, Yukio Nishimura2,6,7,8*
During voluntary movement, the somatosensory system not only passively receives signals from the externalworld but also actively processes them via interactions with the motor system. However, it is still unclear how andwhat information the somatosensory system receives during movement. Using simultaneous recordings of activ-ities of the primary somatosensory cortex (S1), the motor cortex (MCx), and an ensemble of afferent neurons inbehaving monkeys combined with a decoding algorithm, we reveal the temporal profiles of signal integration inS1. While S1 activity beforemovement initiation is accounted for byMCx activity alone, activity duringmovementis accounted for by both MCx and afferent activities. Furthermore, premovement S1 activity encodes informationabout imminent activity of forelimb muscles slightly after MCx does. Thus, S1 receives information about motoroutput before the arrival of sensory feedback signals, suggesting that S1 executes online processing of somato-sensory signals via interactions with the anticipatory information.
ow
on January 24, 2020http://advances.sciencemag.org/
nloaded from
INTRODUCTIONTactile sensory information from the world is gained through active ex-ploration with the hand. During voluntary limb movement, the centralnervous system is continuously inundated with both somatosensorysignals arising from changes in the external world (exafference) andthose from our actions (reafference). Theoretically, the forward modelproposes that the sensory system receives a copy ofmotor commands toextract exafference from sensory inputs (1). Human psychophysicalexperiments showed that voluntary limb movement decreases sensitiv-ity to tactile stimulation on the moving limb (2, 3). Electrophysiologicalexperiments in animals demonstrated that somatosensory-evoked po-tentials in the primary somatosensory cortex (S1) attenuate during vol-untary limbmovement more than during passive movement (4–6) andduring the movement preparation period as well (4, 6). These resultsimply that the movement-generating neural circuitry may affect so-matosensory processing. Thus, the central nervous systemnot only pas-sively receives somatosensory inputs but also actively processes theseinputs during voluntary limb movement.
To understand how the central nervous system extracts importantinformation for the agent during voluntary limbmovement, it is criticalto consider the interactions between the somatosensory and motorsystems (7). Neuronal activity in S1 during voluntarymovement is quitedifferent in firing pattern from passive movement (8–10). A functionalimaging study has shown that S1 activity observed during voluntarylimb movement but not during passive movement correlates with theactivity of motor-related areas (11). Artificial excitation of the primarymotor cortex (M1) in rodents induces excitatory or inhibitory effects onresponses to tactile stimuli (12–14) or whisker stimulation (15–17) at
multiple levels of the somatosensory system. These findings imply thatinputs from motor-related areas might modulate the flow of somato-sensory signals from the periphery to S1. However, sensorimotor inter-actions have been examined only by comparing somatosensoryprocesses under different conditions (e.g., voluntary versus passivemovements or artificial excitation of motor-related areas versus no ex-citation) such that inputs frommotor-related areas have not been clear-ly dissociated from somatosensory signals that are ascending fromperipheral afferents to reveal online sensorimotor interactions duringvoluntary limb movement. Thus, how and what information the so-matosensory system receives from the motor system during voluntarylimb movement have yet to be elucidated.
Here, we simultaneously recorded activities of motor and somato-sensory cortices and activities of an ensemble of afferent neurons in thedorsal root ganglion (DRG) of monkeys during reach and graspingmovements. Using a decoding algorithm, we clarified the temporaland spatial contributions of activities of the motor cortex (MCx) andperipheral afferents to S1 activity. Before movement initiation, S1 wasfound to encode imminent muscle activity similar to M1, while duringmovement, S1 activity reflected an integration of information fromMCx and peripheral afferents. These results suggest that S1 receivesinformation about motor output from the motor system to predictthe consequence of the action.
RESULTSSimultaneous recording of central and peripheralneural signalsWe trained two monkeys to perform a reaching and grasping task inwhich they held a button downwith the right hand for a predeterminedtime and subsequently moved it to a target lever (fig. S1A). We simul-taneously recorded multiregional physiological signals as described be-low (Fig. 1 and fig. S1C). Electrocorticography (ECoG) signals in S1 andMCx, including dorsal (PMd) and ventral (PMv) aspects of the premo-tor cortex andM1, were recorded using a surface electrode array with32 electrodes (fig. S1B). Electromyography (EMG) signals were ob-tained with pairs of wire electrodes in 12 and 10 forelimb muscles ofMonkeys T and C, respectively. Activities of an ensemble of sensoryafferent neurons (25 to 39 units in Monkey T and 11 to 15 units inMonkey C) that innervate the forelimb were recorded with two
1 of 14

SC I ENCE ADVANCES | R E S EARCH ART I C L E
on January 24, 2020http://advances.sciencem
ag.org/D
ownloaded from
48-channel electrode arrays that were implanted into twoDRGs in cer-vical segments C7 and C8 in Monkey T and C6 and C7 in Monkey C.An ensemble of afferent neurons included muscle spindles, tendonorgans, and cutaneous receptors. Forelimb joint kinematics (shoulder,elbow, and wrist joints) were recorded with an optical motion cap-ture system.
Umeda et al., Sci. Adv. 2019;5 : eaaw5388 10 July 2019
The simultaneous recordings enabled us to directly compare thetemporal profiles of movement-related modulations of multiregionalphysiological signals (Fig. 1B and fig. S1C). It is generally accepted thatcortical high-g activity represents activity of the neuronal populationbeneath the electrode (18). High-g activity (60 to 180 Hz) in M1 andS1 encoded the kinematic variables of movements (fig. S2). When we
0 4 128
Time (s)
A
S1
0
100
200(Hz)
Joint angle60°
Afferent
0
10
20
30
0
500(Hz)
Muscle
0
0.1
0.2
0.3(mV)
M1
0
100
200(Hz)
–7
7(AU)
–7
7(AU)
Norm
alized power
Norm
alized power
0 500 1000
Time (ms)
1
2
3
4
(AU)
60°
0°
0
200
400
(Hz)
0.05
0.1
0
(mV)
1
2
3(AU)
S1
Afferent
Muscle
M1
Nor
mal
ized
pow
erN
orm
aliz
ed p
ower
B
Joint angle
Fig. 1. Simultaneous recording of cortical and peripheral activities showed movement-related modulation of these activities. (A) An example of simultaneousrecording of three trials by Monkey T. Top row and second row: Power spectrograms of the respective electrodes in M1 and S1. Third row: EMG signal from the shouldermuscle. Fourth row: The instantaneous firing rate of an ensemble of peripheral afferents. Bottom row: Three forelimb joint angles along the extension-flexion axis(shoulder, solid line; elbow, dashed line; wrist, dotted line). (B) Modulations of cortical and peripheral activity in Monkey T aligned to movement onset. Top and second:Modulations of high-g activity in M1 and S1. Third: EMG signals of 12 forelimb muscles. Fourth: Instantaneous firing rate of a neural ensemble of peripheral afferents.Bottom: Six forelimb joint angles (shoulder, solid lines; elbow, dashed lines; wrist, dotted lines). Thin lines represent the activity in each electrode (M1 and S1), units(afferent), and muscles, and thick lines represent their respective averages. The vertical solid, dotted, and dashed lines represent times of the onset of movement,pulling the lever, and the end of the movement, respectively. Arrowheads represent the peak times of respective activities. AU, arbitrary units.
2 of 14

SC I ENCE ADVANCES | R E S EARCH ART I C L E
on January 24, 2020http://advances.sciencem
ag.org/D
ownloaded from
aligned multiregional physiological signals to the timing of movementonset, cortical high-g activity, activity of forelimbmuscles, and neuronalfiring of peripheral afferents each exhibited their own respective tem-poral patterns (Fig. 1B and fig. S1C). High-g activity in S1 showed threepeaks (Fig. 1B, second row): the first peak around movement onset(arrowhead), the second peak around lever pulling (double arrowhead),and the third peak around the end of themovement (triple arrowhead).Most of the peripheral afferents exhibited a large peak of activity aroundlever pulling (Fig. 1B, double arrowhead in the fourth row). This peakoccurred slightly earlier than the second peak of S1 activity, suggestingthat activity in peripheral afferents might be transmitted to S1 aroundthe time of pulling the lever. On the other hand, all three peaks of high-gM1 activity occurred earlier than the corresponding S1 activity peak(Fig. 1B, first row). M1 activity also increased before the onset of S1 ac-tivity, as well as that of PMd and PMv (Fig. 1B and fig. S1, C and D),implying that MCx activity might be transmitted to S1.
Decoding of S1 activityIn the above analyses, only the temporal patterns of averaged movement-related modulations were compared between different physiologicalsignals. By a simple comparison of the temporal patterns among differ-ent regions (Fig. 1B and fig. S1, C and D), it is not possible to elucidatethe temporal and spatial profiles of signal integration. To investigatehow preceding activity in MCx, including M1 and premotor cortices,and that in an ensemble of peripheral afferents account for S1 activity,we decoded S1 activity from combined activities inMCx and peripheralafferents using a sparse linear regression (SLiR) algorithm. We built alinear model using combined activities inMCx and peripheral afferentsto account for subsequent S1 activity. Themodel accurately reconstructedthe overall temporal pattern of activity in S1 better than a model builtfrom surrogate shuffled control data [Monkey T (mean, n = 16 signals):correlation coefficientRdata = 0.61,Rshuffled = 0.02;MonkeyC (mean,n=12 signals):Rdata = 0.53,Rshuffled = 0.00; Fig. 2, A andB]. The reconstruc-tion accuracy of models built from combined activities in MCx and pe-ripheral afferents was superior to that of models built from activity inMCx alone or from activity in peripheral afferents alone (fig. S3). Theseresults indicate that both MCx and peripheral afferent activities werenecessary information for the reconstruction of S1 activity.
We then aligned reconstructedwaveforms to the point ofmovementonset to examine whether the model from the combined activities re-constructed movement-related modulation of activity in S1 (Fig. 2, Cand D). The average high-g activity recorded in S1 increased beforemovement onset (premovement activity; Fig. 1B and fig. S1D), whichis consistent with those obtained in single-cell recordings of S1 neuronsduring self-generating movements (8, 9, 19). The model from the com-bined activities accurately reconstructed premovement activity in S1.The decoding model further reconstructed the peaks of S1 activity dur-ing movement. The model from combined activities in MCx andperipheral afferents reconstructed movement-related modulation ofS1 activity throughout the duration of S1 modulation better thanmodels from MCx activity alone or peripheral afferent activity alone(−100 to 1400 ms around movement onset for Monkey T, −100 to1500 ms for Monkey C; fig. S4, A and C). These results suggest thatS1 integrates information from both MCx and peripheral afferents.
Decomposition of S1 activityTo elucidate the contributions ofMCx and peripheral afferent activitiesto the reconstructed S1 activity, we calculated each component of thereconstructed activity from either MCx or peripheral afferent activity
Umeda et al., Sci. Adv. 2019;5 : eaaw5388 10 July 2019
A Observed Reconstructed
R = 0.67
0
4
0 5Time (s)
(AU)
7.52.5
C
1
2
3
(AU)
Time (ms)0 500–250 1000
Observed S1From MCx + Afferent
1500
2
n = 6 models
S1MCx + Afferent
Monkey T
0
Cor
rela
tion
coef
ficie
nt
0.2
0.4
0.6
DataShuffled
Monkey C
B0.8
**
Monkey T
0
VA
F
0.2
0.4
0.6
Monkey C
D0.8
**
DataShuffled
Fig. 2. Combined activities in MCx and afferents account for S1 activity. (A) Re-construction of S1 activity using combined activities inMCx and peripheral afferents ofMonkey T. Examples of two successive movements. Black line, the observed activity inS1; red line, the reconstructed activity; R, correlation coefficient between the observedand reconstructed activities; vertical solid lines, movement onset; vertical dashed lines,end of movement. (B) Mean decoding accuracy pooled across ECoG electrodes in S1.The correlation coefficient between the observed and reconstructed traces from therecorded data compared with the correlation coefficient between the observed tracesand the traces reconstructed from random shuffling of activity (Monkey T: mean, n =16 signals; Monkey C: mean, n = 12 signals; *P < 0.001). Superimposed bars,mean. (C) Average modulation of the observed S1 activity in Monkey T (S1, gray)and the reconstruction using combined activities in MCx and peripheral afferents(MCx + Afferent, purple) aligned to movement onset. Vertical solid lines, movementonset; vertical dashed lines, average time of end of movement; solid lines, means;shading, SD. (D) Variance accounted for (VAF) between the observed and recon-structed traces throughout the duration of S1 modulation (−100 to 1400 ms aroundmovement onset for Monkey T, −100 to 1500 ms for Monkey C).
3 of 14

SC I ENCE ADVANCES | R E S EARCH ART I C L E
on January 24, 2020http://advances.sciencem
ag.org/D
ownloaded from
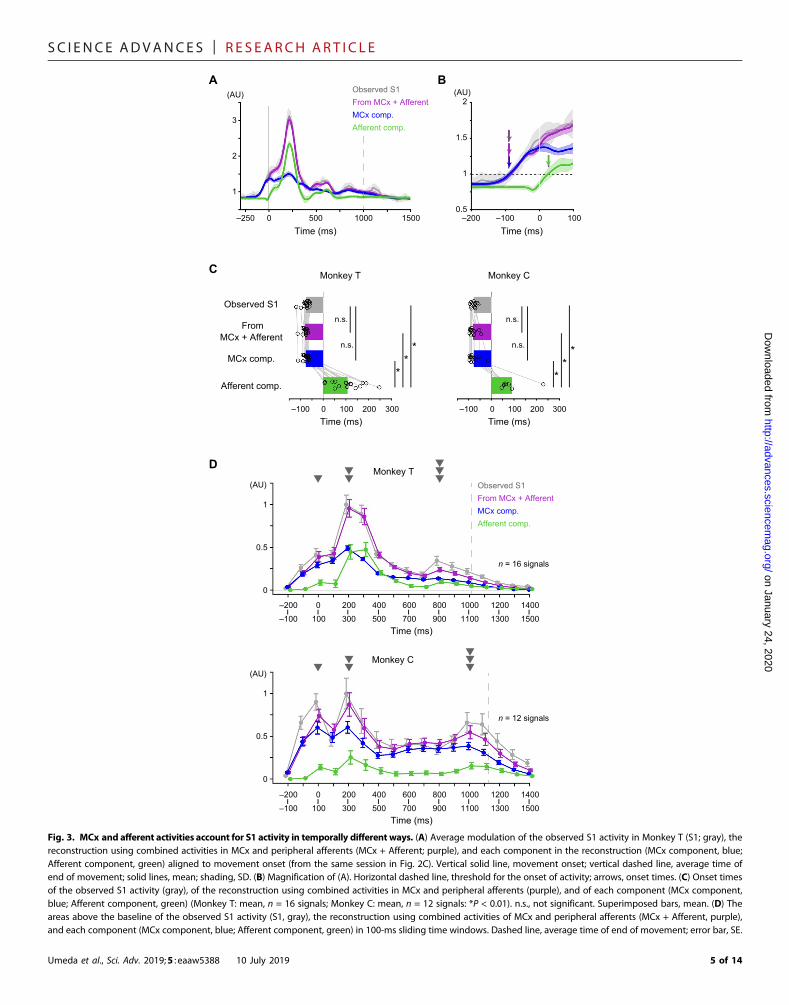
and respective weight values in a decoding model that was built fromthe combined activities (Fig. 3, A and B). Like the observed activity inS1, the MCx component rose before movement onset [Monkey T(mean, n = 16 signals): latency of activity TS1 = −75.8 ms, TMCx + Afferent =−79.9 ms, TMCx comp. = −76.3 ms; Monkey C (mean, n = 12 signals):TS1 = −76.7 ms, TMCx + Afferent = −79.8 ms, TMCx comp. = −77.1 ms]. Onthe other hand, the Afferent component increased only aftermovementonset (Monkey T: TAfferent comp. = 106.3 ms; Monkey C: TAfferent comp. =89.5 ms). The Afferent component increased later than the observedactivity in S1, the reconstructed activity from combined activities inMCx and peripheral afferents, or the MCx component (Fig. 3C). Thearea of the Afferent component above the baseline during the premove-ment period (−100 to 0ms aroundmovement onset) wasmuch smallerthan that of theMCx component (Fig. 3D). Furthermore, whenwe builta decoding model that reconstructed activity in S1 from activity inperipheral afferents alone, themodel also failed to reconstruct premove-ment activity in S1 (fig. S4, A, B, E, and F). These results indicate thatpremovement activity in S1 was decoded from activity in MCx but notfrom those in peripheral afferents.
On the other hand, activities in both MCx and peripheral affer-ents could account for activity in S1 during movement. Both activ-ities contributed to decoding the second (200 to 300 ms) and third(800 to 900 ms for Monkey T, 1000 to 1100 ms for Monkey C) peaksof S1 activity (Fig. 3D). The areas of the MCx and Afferent compo-nents were above the baseline until the end of S1 modulation (1400 msafter movement onset in Monkey T, 1500 ms in Monkey C) (Fig. 3D;see Materials and Methods). In some time windows, the areas of theAfferent component were as much as those of the MCx componentin Monkey T [PMCx comp. vs Afferent comp. = 0.55 (t15 = 0.61, time = 200to 300 ms), 0.14 (t15 = −1.54, time = 300 to 400 ms), 0.74 (t15 = −0.34,time = 400 to 500ms), Student’s paired t test; Fig. 3D]. Furthermore, themodels from combined activities in MCx and peripheral afferents re-constructed S1 activity during movement (0 to 1000 ms around move-ment onset) better than models from activity in MCx alone or fromactivity in peripheral afferents alone (fig. S4D). Thus, the activities inboth MCx and peripheral afferents contributed to the reconstructionof S1 activity during movement.
We next examined how the MCx and Afferent components inter-mingled in the reconstructed activity in individual S1 electrodes. Figure 4Ashows S1 activity and the MCx and Afferent components in eightelectrodes over S1 ofMonkey T. The first principal component couldexplain 90% of the total variance of the MCx component, suggestingthat theMCx component had a similar temporal profile among all S1electrodes (Fig. 4B). On the other hand, the temporal profile of theAfferent component among the electrodes was more varied than theMCx component. In addition, the variance of the Afferent compo-nent size among different S1 electrodes was much larger than that oftheMCx component size (Fig. 4C). Thus, while theMCx componentwas evenly distributed over the S1 electrodes, the Afferent compo-nent was distributed in spatially varied patterns. These results sug-gest that most of the variability in activity in different S1 electrodesafter movement initiation was likely caused by differences in the Af-ferent component.
We then asked to what extent activities in the separate regions ofMCx (i.e., M1, PMd, and PMv) contributed to the reconstruction (fig.S5). Weight values given to M1 activity in the model were significantlylarger than those given to PMd or PMv activity in our model (fig. S5C).In addition, the area of theM1 component above the baseline was subs-tantially larger than that of the PMdor PMv component throughout the
Umeda et al., Sci. Adv. 2019;5 : eaaw5388 10 July 2019
duration of S1 modulation [Monkey T (mean, n = 16 signals): areanormalized by S1,AMCx comp. = 53.1%,AM1 comp. = 52.0%,APMd comp. =0.3%,APMv comp. = 3.8%;MonkeyC (mean,n= 12 signals):AMCx comp. =75.1%, AM1 comp. = 60.1%, APMd comp. = 16.3%, APMv comp. = 6.4%; fig.S5D]. Furthermore, M1 also contributed more to the decoding of S1 ac-tivity during the premovement period thandidPMdandPMv (MonkeyT:AMCx comp. = 77.8%,AM1 comp. = 76.4%,APMd comp. = 0.3%,APMv comp. =5.1%; Monkey C: AMCx comp. = 68.5%, AM1 comp. = 56.0%, APMd comp. =18.2%, APMv comp. = 5.0%; figs. S5E and S6, A to C). Thus, the M1component contributed to most of the MCx component, while the PMdor PMv component contributed little.We further examinedM1 electrodesthat predominantly contributed to the decoding output by analyzing aweight value given to each M1 electrode. Electrodes with the highestweight value were located just anterior to the S1 electrode whose activitywas decoded [one-way analysis of variance (ANOVA), P < 0.001 for allS1 electrodes of both monkeys; fig. S6D]. Thus, activity in S1 beforemovement onset could not be explained by ongoing activities in thepremotor cortex and peripheral afferents but could be at least partiallyaccounted for by activity in a subset ofM1 regions. These results suggestthat S1 receives inputs from M1 or inputs from a common drivingsource with M1 before movement onset.
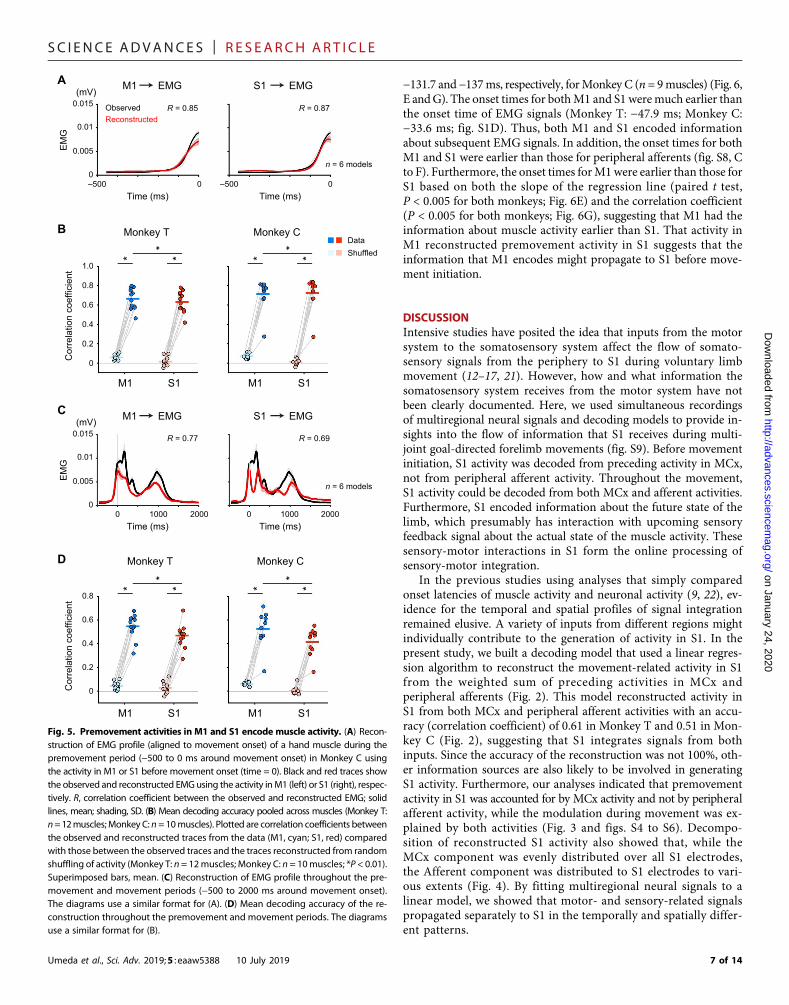
Encoding muscle activity by premovement activity of S1Our data suggest that before movement onset, S1 potentially encodesthe same information as M1 does. In a previous study, we showed thata linear regression model built from high-g activity in M1 could recon-struct imminent muscle activity (20). In the present study, muscle ac-tivity began to rise immediately beforemovement onset and reached aninitial peak at movement onset (Fig. 1B, third row).We built amodel toreconstruct muscle activity from preceding activity in M1 during thepremovement period (−500 to 0 ms around movement onset).Consistent with the previous report (20), themodel succeeded in recon-structing the initial increase in the EMGprofile (Fig. 5A, left).When webuilt amodel fromS1 activity during the premovement period to recon-struct imminentmuscle activity, themodel also reconstructed the initialrise in muscle activity (Fig. 5A, right). Furthermore, both models suc-ceeded in the reconstruction of muscle activity during movement (Fig.5C). The reconstruction accuracies from both M1 and S1 were statisti-callymore significant than that of amodel built from time-shuffled con-trol data (Fig. 5, B and D), thus indicating that S1 activity beforemovement initiation encoded temporal changes in muscle activity aswell as M1 activity did.
We next examined how premovement activity in each M1 and S1electrode contributed to the decoding of muscle activity. Most of theinput signals in M1 and S1 were selected by the SLiR algorithm forbuilding the decoding model (fig. S7A). However, high weight valueswere assigned to a small number of adjacent M1 and S1 electrodesacross the central sulcus in the decoding of both proximal and distalforelimb muscles (one-way ANOVA, P < 0.001 for all the muscles ofboth monkeys; fig. S7B). The result indicates that premovement ac-tivity in a core region encoded imminent muscle activity.
Information flow from M1 to S1We then asked the question: When does M1 or S1 start to encodeinformation about muscle activity? All recorded muscles exhibitedan initial EMG burst at the point of movement initiation. The am-plitude of the EMG burst varied from trial to trial. If activity inM1 orS1 in the premovement period predicts trial-by-trial variability of theamplitude of the EMG burst, then we could examine the point when
4 of 14
SC I ENCE ADVANCES | R E S EARCH ART I C L E
on January 24, 2020http://advances.sciencem
ag.org/D
ownloaded from
1
2
3
(AU)
1
2(AU)
A B
Time (ms)0–100 100–200
Time (ms)0 500–250 1000
Observed S1From MCx + AfferentMCx comp.Afferent comp.
D
Time (ms)
–200
–100
0
100
200
300
400
500
600
700
800
900
1000
1100
1200
1300
1400
1500
1
0
0.5
Monkey C(AU)
1.5
0.5
C
Observed S1
FromMCx + Afferent
MCx comp.
Afferent comp.
Monkey T Monkey C
Time (ms)0–100
Time (ms)0 100–100
*
100
*
200 300 200 300
n.s.n.s.
1
0
0.5
Monkey T(AU) Observed S1
From MCx + AfferentMCx comp.Afferent comp.
Time (ms)
–200
–100
0
100
200
300
400
500
600
700
800
900
1000
1100
1200
1300
1400
1500
1500
n = 16 signals
n = 12 signals
n.s.n.s.
****
Fig. 3. MCx and afferent activities account for S1 activity in temporally different ways. (A) Average modulation of the observed S1 activity in Monkey T (S1; gray), thereconstruction using combined activities in MCx and peripheral afferents (MCx + Afferent; purple), and each component in the reconstruction (MCx component, blue;
Afferent component, green) aligned to movement onset (from the same session in Fig. 2C). Vertical solid line, movement onset; vertical dashed line, average time ofend of movement; solid lines, mean; shading, SD. (B) Magnification of (A). Horizontal dashed line, threshold for the onset of activity; arrows, onset times. (C) Onset timesof the observed S1 activity (gray), of the reconstruction using combined activities in MCx and peripheral afferents (purple), and of each component (MCx component,blue; Afferent component, green) (Monkey T: mean, n = 16 signals; Monkey C: mean, n = 12 signals: *P < 0.01). n.s., not significant. Superimposed bars, mean. (D) Theareas above the baseline of the observed S1 activity (S1, gray), the reconstruction using combined activities of MCx and peripheral afferents (MCx + Afferent, purple),and each component (MCx component, blue; Afferent component, green) in 100-ms sliding time windows. Dashed line, average time of end of movement; error bar, SE.Umeda et al., Sci. Adv. 2019;5 : eaaw5388 10 July 2019 5 of 14

SC I ENCE ADVANCES | R E S EARCH ART I C L E
Do
M1 or S1 started to encode it. We first tested whether premovementactivity in M1 or S1 encoded the EMG burst amplitude by buildingan encoding model from activity in M1 or S1 before movement ini-tiation that accounted for the variability of the EMG burst amplitudeon a trial-by-trial basis. Figure 6A shows scatterplots in which eachdot represents the observed EMG burst amplitude versus that recon-structed in a single trial. We then assessed the model using two in-dices, the slope of the regression line and the correlation coefficientbetween the observed and reconstructed EMGburst amplitude.Modelsderived from either premovement activity in M1 or S1 predicted EMGburst amplitude in each trial [slope: Monkey T (n = 12 muscles):SM1 data = 0.16, SM1 shuffled = 0.00, SS1 data = 0.16, SS1 shuffled =0.00; Monkey C (n = 9 muscles): SM1 data = 0.08, SM1 shuffled = 0.00,SS1 data = 0.13, SS1 shuffled = 0.00; correlation coefficient: Monkey T:RM1 data = 0.40, RM1 shuffled = 0.07, RS1 data = 0.40, RS1 shuffled = 0.06;MonkeyC;RM1 data = 0.28,RM1 shuffled = 0.11,RS1 data = 0.35,RS1 shuffled =0.09; Fig. 6, B and C, and fig. S8, A and B]. For both M1 and S1 activ-ities, both the slope and correlation coefficient were significantly
Umeda et al., Sci. Adv. 2019;5 : eaaw5388 10 July 2019
larger than those derived from trial-shuffled datasets (Fig. 6, B andC). Together, these results indicate that, similar toM1, premovementactivity in S1 encodes EMG burst amplitude.
We then examined the point at which M1 or S1 started to encodeEMG burst amplitude.We built models that reconstructed trial-by-trialvariability of EMG burst amplitude from activity in M1 or S1 withinoverlapping, sliding time windows of 50 ms and calculated the slopeof the regression line and the correlation coefficient as above. Weplotted two indices against the end of the 50-ms sliding window(Fig. 6, D and F). For encoding models of activity inM1, both indicesincreased before movement initiation. Onset times of the slope of theregression line and the correlation coefficient were −175.0 and−170.1 ms, respectively, for Monkey T (n = 12 muscles) and −171.7and −172.0 ms, respectively, for Monkey C (n = 9 muscles) (Fig. 6, Eand G). For encoding models of activity in S1, both indices alsoincreased before movement initiation (Fig. 6, D and F). Onset timesof the slope of the regression line and the correlation coefficient were−146.7 and −139.2ms, respectively, forMonkey T (n = 12muscles) and
on January 24, 2020http://advances.sciencem
ag.org/w
nloaded from
A
Medial
Anterior
S11234
5678
1 s
1 AU
B
70
80
90
100
Var
ianc
e ex
plai
ned
(%)
No. of features No. of features2 4 6 8 2 4 6
Monkey T Monkey C
MCx comp.Afferent comp.
C
Monkey T Monkey C0
1
1.5
CV
of a
rea
MCx comp. Afferent comp.*
1
2 6
3 7
4 8
5
*
0.5
S1 MCx comp. Afferent comp.
n = 21 sessions n = 7 sessions
Fig. 4. MCx and afferent activities account for S1 activity in spatially different ways. (A) Average modulation of the observed activity in S1 electrodes of Monkey T(gray) and respective MCx (blue) and Afferent (green) components aligned to movement onset. Vertical lines, movement onset; solid lines, mean. (B) Principalcomponent analysis (PCA) of the MCx and Afferent components in all S1 electrodes. Cumulative variance explained by the PCA components plotted against the numberof feature dimensions used. Error bars, SE. (C) Coefficient of variation (CV) of areas above the baseline of the MCx and Afferent components in all S1 electrodesthroughout the duration of S1 modulation (Monkey T: n = 21 sessions; Monkey C: n = 6 sessions; *P < 0.05). A pair including an outlier (CV of the Afferent component,5.56; CV of the MCx component, 0.37 in Monkey C) is not used in the analysis. Superimposed bars, mean.
6 of 14
SC I ENCE ADVANCES | R E S EARCH ART I C L E
Umeda et al., Sci. Adv. 2019;5 : eaaw5388 10 July 2019
−131.7 and−137ms, respectively, forMonkey C (n = 9muscles) (Fig. 6,E andG). The onset times for bothM1 and S1 weremuch earlier thanthe onset time of EMG signals (Monkey T: −47.9 ms; Monkey C:−33.6 ms; fig. S1D). Thus, both M1 and S1 encoded informationabout subsequent EMG signals. In addition, the onset times for bothM1 and S1 were earlier than those for peripheral afferents (fig. S8, Cto F). Furthermore, the onset times forM1were earlier than those forS1 based on both the slope of the regression line (paired t test,P < 0.005 for both monkeys; Fig. 6E) and the correlation coefficient(P < 0.005 for both monkeys; Fig. 6G), suggesting that M1 had theinformation about muscle activity earlier than S1. That activity inM1 reconstructed premovement activity in S1 suggests that theinformation that M1 encodes might propagate to S1 before move-ment initiation.
on January 24, 2020http://advances.sciencem
ag.org/D
ownloaded from
DISCUSSIONIntensive studies have posited the idea that inputs from the motorsystem to the somatosensory system affect the flow of somato-sensory signals from the periphery to S1 during voluntary limbmovement (12–17, 21). However, how and what information thesomatosensory system receives from the motor system have notbeen clearly documented. Here, we used simultaneous recordingsof multiregional neural signals and decoding models to provide in-sights into the flow of information that S1 receives during multi-joint goal-directed forelimb movements (fig. S9). Before movementinitiation, S1 activity was decoded from preceding activity in MCx,not from peripheral afferent activity. Throughout the movement,S1 activity could be decoded from both MCx and afferent activities.Furthermore, S1 encoded information about the future state of thelimb, which presumably has interaction with upcoming sensoryfeedback signal about the actual state of the muscle activity. Thesesensory-motor interactions in S1 form the online processing ofsensory-motor integration.
In the previous studies using analyses that simply comparedonset latencies of muscle activity and neuronal activity (9, 22), ev-idence for the temporal and spatial profiles of signal integrationremained elusive. A variety of inputs from different regions mightindividually contribute to the generation of activity in S1. In thepresent study, we built a decoding model that used a linear regres-sion algorithm to reconstruct the movement-related activity in S1from the weighted sum of preceding activities in MCx andperipheral afferents (Fig. 2). This model reconstructed activity inS1 from both MCx and peripheral afferent activities with an accu-racy (correlation coefficient) of 0.61 in Monkey T and 0.51 in Mon-key C (Fig. 2), suggesting that S1 integrates signals from bothinputs. Since the accuracy of the reconstruction was not 100%, oth-er information sources are also likely to be involved in generatingS1 activity. Furthermore, our analyses indicated that premovementactivity in S1 was accounted for by MCx activity and not by peripheralafferent activity, while the modulation during movement was ex-plained by both activities (Fig. 3 and figs. S4 to S6). Decompo-sition of reconstructed S1 activity also showed that, while theMCx component was evenly distributed over all S1 electrodes,the Afferent component was distributed to S1 electrodes to vari-ous extents (Fig. 4). By fitting multiregional neural signals to alinear model, we showed that motor- and sensory-related signalspropagated separately to S1 in the temporally and spatially differ-ent patterns.
A
Time (ms)0–500
Time (ms)
00–500
(mV)ObservedReconstructed
R = 0.85 R = 0.87
B
ShuffledData
Monkey T
M1 S1
0Cor
rela
tion
coef
ficie
nt
0.2
0.4
0.6
* *
Monkey C
M1 S1
* *
0.8
0.01
EM
G
**0.005
0.015
n = 6 models
C
Time (ms)0 2000
Time (ms)
00 2000
(mV)
R = 0.77 R = 0.69
D Monkey T
M1 S1
0Cor
rela
tion
coef
ficie
nt
0.2
0.4
0.6
* *
Monkey C
M1 S1
* *
0.8
0.01
EM
G
10001000
**
0.005
0.015
n = 6 models
1.0
M1 EMG S1 EMG
M1 EMG S1 EMG
Fig. 5. Premovement activities in M1 and S1 encode muscle activity. (A) Recon-struction of EMG profile (aligned to movement onset) of a hand muscle during thepremovement period (−500 to 0 ms around movement onset) in Monkey C usingthe activity in M1 or S1 before movement onset (time = 0). Black and red traces showthe observed and reconstructed EMGusing the activity inM1 (left) or S1 (right), respec-tively. R, correlation coefficient between the observed and reconstructed EMG; solidlines, mean; shading, SD. (B) Mean decoding accuracy pooled across muscles (Monkey T:n=12muscles;Monkey C: n=10muscles). Plotted are correlation coefficients betweenthe observed and reconstructed traces from the data (M1, cyan; S1, red) comparedwith those between the observed traces and the traces reconstructed from randomshuffling of activity (Monkey T: n = 12muscles; Monkey C: n = 10muscles; *P < 0.01).Superimposed bars, mean. (C) Reconstruction of EMG profile throughout the pre-movement and movement periods (−500 to 2000 ms around movement onset).The diagrams use a similar format for (A). (D) Mean decoding accuracy of the re-construction throughout the premovement and movement periods. The diagramsuse a similar format for (B).
7 of 14

SC I ENCE ADVANCES | R E S EARCH ART I C L E
on January 24, 2020http://advances.sciencem
ag.org/D
ownloaded from
0
0.4
0.2
D EShuffledData
A
0
0.06
0 0.09
M1
Observed EMG (mV)R
econ
stru
cted
EM
G (m
V)
R = 0.53 (P = 0.00)Y = 0.25X + 0.022
0
0.06
0.090
S1
Observed EMG (mV)
Rec
onst
ruct
ed E
MG
(mV
)
R = 0.49 (P = 0.00)Y = 0.24X + 0.022
B
M1 S1 M1 S1
0
0.2
0.1
Monkey T Monkey C
Slo
pe
0.3 ****
C
M1 S1 M1 S1
0
0.6
0.4
0.2
Cor
rela
tion
coef
ficie
nt ****
Slo
pe
0.3
0
0.2
0.1
M1
Time (ms)0–200–300
0.3
0
0.2
0.1Slo
pe
S1
M1
S1
0–100–200Time (ms)
M1
S1
Monkey T
Monkey C
**
**
*
*
*
*
ShuffledData
F
Cor
rela
tion
coef
ficie
nt
M1
0
0.4
0.2
S1
G
M1
S1
*
*
M1
S1
**
*
*
Time (ms)0–200–300 0–100–200
Time (ms)
Monkey T
Monkey C
**
0.6
0.6
**
n = 6 models
n = 6 models
–100
–100
–0.2
–0.2
Cor
rela
tion
coef
ficie
nt
Fig. 6. Premovement activity in S1 encodes the initial burst ofmuscle activity slightly afterM1does. (A) Scatterplots of observed peak EMG amplitude of the handmuscleversus reconstructed EMG amplitude using the premovement activity in M1 (cyan) or S1 (red) of Monkey T. Dot, a single trial. Equation of the fitting is shown in the lower rightcorner. R, correlation coefficient between the observed and reconstructed EMG. (B and C) Average slopes of regression lines (B) and correlation coefficients (C) pooled acrossmuscles (Monkey T: n=12muscles;Monkey C: n=10muscles; *P<0.05). Superimposedbars,mean. (D and F) Average slopes of regression lines (D) and correlation coefficients (F)were plotted against the end of 50-ms slidingwindows. Solid lines,means; shading, SD; dashed black line, threshold for onset of activity; arrows, onset. (E andG) Onset times ofM1(cyan) and S1 (red) activities that encode peak EMG amplitude pooled across electrodes were less than the onset time of EMG (E, slopes; G, correlation coefficients; Monkey T:n = 12 muscles; Monkey C: n = 9 muscles; *P < 0.01). Onset time of the activity in M1 was earlier than that in S1 (Monkey T: n = 12 muscles; Monkey C: n = 9 muscles; **P < 0.01).Superimposed bar graphs, mean.
Umeda et al., Sci. Adv. 2019;5 : eaaw5388 10 July 2019 8 of 14

SC I ENCE ADVANCES | R E S EARCH ART I C L E
on January 24, 2020http://advances.sciencem
ag.org/D
ownloaded from
Single neuronal activity in S1 during active movement of the fore-limb has a different firing pattern from that during passive movement(8, 9, 19). These neurons are characterized by tuning properties relatedto the direction of voluntary movement of the hand and arm (23).Unique activities that are detected only during active movement havebeen considered to be a putative efference copy signal. However, thesestudies analyzed neuronal activities during movement so that these ac-tivities contained information frombothmotor-related areas and periph-eral afferents. To clarify what information S1 receives from MCx, it iscrucial to dissociate the effect of MCx from that of peripheral afferents.The present study showed that premovement activity in S1 could be ex-plained, at least in part, by activity inM1 and was independent of activityin peripheral afferents. This result suggests that the premovement activityis isolated from the effect fromperipheral afferents. In addition, premove-ment activity in S1 encoded imminent muscle activity slightly after M1did. These results suggest that S1 receives information about motoroutput before receiving sensory feedback signals.
One functional imaging study of blood oxygen level dependent(BOLD) signals in human subjects has examined activity in S1 duringvoluntary movement without proprioceptive signals with ischemicnerve block (24). Their correlation analysis showed that activity in S1was linked to that in the premotor cortex. However, the low temporalresolution of human imaging studies cannot dissociate motor com-mands from sensory signals in M1. Furthermore, anatomical evidencedocumented that long-range cortico-cortical connections from the pre-motor cortex to S1 are much sparse (25). Our results using electrophys-iological recording with millisecond accuracy show that activity in M1rather than that in premotor cortices accounted for activity in S1 notonly before movement onset but also during movement (figs. S5 andS6). In addition, a linear regression analysis that accommodates timedirection (seeMaterials andMethods) is able to reveal the signal transferfromM1 to S1. Thus, it is reliable to consider that S1 receives informationregarding descending motor commands from M1 rather than from thepremotor cortex. This ideawas also proposed byWitham et al. (26), usingdirected coherence analysis, in which a b-band oscillation propagatedfrom M1 to S1 in monkeys during a finger flexion task. The directedcoherence phase from M1 to S1 documented a delay of 40 ms, whichwas very similar to the delay (35ms) we observed betweenM1 and S1 forencoding the initial EMG burst in this study (Fig. 6, E and G).
Although most of the peripheral afferents exhibited an increase inactivity after movement onset, we also found a small number ofperipheral afferents that exhibited an increase in neuronal firing beforemovement initiation (Fig. 1B). The source of these impulses might bemuscle spindles elicited by gmotor commands (27). Alternatively, pre-paratory postural movements might evoke discharges of peripheral af-ferents before limb movement. However, our present decoding resultsindicated that these discharges have only a very small impact on thedecoding of premovement S1 activity (Fig. 3).
Premovement activity in S1 encodes imminent muscle activity aseffectively as premovement activity in M1 (Figs. 5 and 6 and figs. S7and S8). On the analogy of the role of M1 in the control of movement,it could be considered that S1 might have the ability to control the limbmovement directly. The barrel cortex, S1 in rodents, controls whiskermovements and innervates whisker motor neurons via the spinal tri-geminal nuclei (28). However, we consider that this notion is not thecase with S1 in the monkey according to the following evidence. First,the thresholds of intracortical microstimulation of S1 to evoke the limbmovement are much greater than those of M1 (29). Second, the corti-cospinal fibers from S1 project to the dorsal horn of the spinal cord but
Umeda et al., Sci. Adv. 2019;5 : eaaw5388 10 July 2019
are absent in the ventral horn where motoneurons are located (30).Third, spike- or stimulus-triggered averaging of EMG activity fromS1 neurons showed that the excitatory output effects on muscle activityfrom S1 are almost absent, and the effects are predominantly inhibitoryeven if there are (31). Thus, it is more natural to consider that informa-tion aboutmotor output is used for sensory processing in S1 rather thandirect control of limb movements.
Multiple studies have shown that both somatosensation andsomatosensory-evoked potentials in S1 are attenuated during vol-untary movement (2–6). This means that the effect of M1 inputs onS1 activity could be suppressive. However, our decoding analysisshowed that most of the M1 component has a positive value (fig.S5, A and B), suggesting that S1 receives excitatory effects from M1.Explanations of this incongruence are that suppressive inputs fromM1 would have minimal effects on S1 neurons with low spontaneousactivity and/or that inputs from other cortical areas such as the pre-frontal cortex to subcortical structures might be involved in the gatingof somatosensory information. On the other hand, optogenetic activa-tion of vibrissal M1 has been reported to enhance neuronal responsesin the barrel cortex to mechanical stimulation (15, 16). These neuronalresponses were enhanced only when M1 neurons were activatedbefore vibrissae stimulation, not after the stimulation (15). These find-ings support our demonstration that, during voluntary movement, S1activity was decoded from M1 before the arrival of inputs from pe-ripheral afferents. Thus, M1 inputs might have an excitatory influenceon neuronal responsiveness to upcoming somatosensory inputs.Together, these results suggest that the central nervous system imple-ments online processing of somatosensory signals under the influenceof motor contexts during voluntary movement.
How is information about motor output transmitted to S1? Severalpathways might transmit information about motor output fromM1 toS1. In the present study, M1 encoded information related to futuremuscle activity 35 ms earlier than S1 (Fig. 6, E and G). This time lagis longer than a delay attributed to a monosynaptic connection; hence,a direct connection fromM1 is not the primary pathway conveying theinformation to S1. On the basis of the conduction time of the signal, thepolysynaptic cortico-cortical connection is more reasonable. Pyramidalneurons in vibrissal M1 provide strong excitatory effects to pyramidalneurons in the barrel cortex via an intracortical disinhibition circuit(32). Although it has not been shown that M1-S1 connectivity in theforelimb area in primates is the same as the rodent vibrissal system,the cortico-cortical pathway is a strong candidate. Another possiblepolysynaptic cortico-cortical pathway fromM1 to S1 is via the posteriorparietal cortex. M1 sends densely cortico-cortical projections to area 5,which interconnects with areas 1 and 2 (33).
Other possible pathways that might convey information about mo-tor output to S1 are through subcortical structures. M1 neurons projectmany axonal fibers to subcortical structures, including the thalamicnuclei and dorsal column nucleus (34, 35). Electrical stimulation ofmo-tor cortex evoked unit activity in short (less than 7ms) and long latencyranges (about 20 ms) in the thalamic somatosensory relay nuclei in therat (14). The conduction time of the longer latency response is in thesame ballpark as the difference in times for M1 and S1 to encode the in-formation about EMGactivity in our results. Thus, it is quite possible thatthe information is relayed through the thalamic somatosensory relaynuclei. However, as the thalamic somatosensory relay nuclei are devoidof corticothalamic fibers from M1 (35), another multisynaptic routemight be responsible for activating neurons in the thalamic somato-sensory relay nuclei.
9 of 14

SC I ENCE ADVANCES | R E S EARCH ART I C L E
on Januarhttp://advances.sciencem
ag.org/D
ownloaded from
M1 generally inhibits neurons that project to the medial lemniscusin the main cuneate nucleus of cats and rats (13, 36). The inhibitoryeffect is presumably via cuneate inhibitory interneurons that receive ex-citatory inputs fromM1 and send inhibitory outputs to projection neu-rons (37). However, electrical stimulation of M1 activates cuneateneurons only when the joint controlled by a cortical site in M1 topo-graphically corresponds to the receptive field of the cuneate neurons(38). The result implies that information about the motor map of M1might transfer to the cuneate nucleus. Thus, the pathway through thecuneate nucleus is also likely to be a pathway conveying the excitatoryeffects of M1 on S1 in the present study.
While the timing of activity between M1 and S1 suggests that in-formation is conveyed through polysynaptic connections between M1and S1, the monosynaptic connection is likely to remain disputable. Ifmonosynaptic inputs from M1 to S1 are not strong enough to imme-diately activate S1 neurons, then the delay betweenM1 and S1 activities(Fig. 6, E and G) might be explained by the time required for M1 sub-threshold inputs to change the state of S1 neurons. After this lag, S1activity begins to reflect monosynaptic inputs from M1.
Another possible mechanism underlying the decoding of S1 fromM1 is that S1 receives inputs from a common source after M1 receivesthem. Previous literature has shown that area 5 and the secondary so-matosensory cortex send projections to both M1 and S1 (25). Since S1activity was accounted for by the adjacent M1 region, it seems to bereasonable to consider that both M1 and S1 receive common inputsvia these cortico-cortical pathways at a similar timing, which, however,is not consistent with the delay betweenM1 and S1 for encodingmuscleactivity (Fig. 6, E and G). Alternatively, a co-modulator might sendinformation directly to M1 and the same information indirectly to S1with a delay.Whether S1 receives information aboutmotor output fromM1 or a common driving source should be examined by the circuit ma-nipulation experiment, which is left for future research.
In conclusion, multiregional recording of a sensory-motor closed-loop system revealed that S1 receives information about motor outputbefore the arrival of sensory feedback signals. This result providesinsight into the online processing of somatosensory information undervoluntary movement.
y 24, 2020
MATERIALS AND METHODSExperimental designWe hypothesized that S1 integrates information from both MCx andperipheral afferents because there are anatomical pathways betweenthem. To test this hypothesis, we conducted simultaneous recordingsof the activities in S1, MCx, and an ensemble of afferent neurons intwo behaving monkeys. We stopped the recording when we couldnot detect any spiking activity from peripheral afferent recording. Weused data for the analysis when the number of unit activity of peripheralafferentswasmore than 20 and 10 inMonkeys T andC, respectively. Allquantified data were included, and no outliers were excluded other thanthose mentioned.
AnimalsWeused one adultmalemonkey (MonkeyT:weight, 6 to 7 kg) (Macacafuscata) and one adult female monkey (Monkey C: weight, 5 to 6 kg)(Macacamulatta). The animalswere housed individually in temperature-controlled environments on a 12-hour light/12-hour dark cycle. Theexperiments were approved by the experimental animal committee ofthe National Institute of Natural Sciences and animals were cared for
Umeda et al., Sci. Adv. 2019;5 : eaaw5388 10 July 2019
and treated humanely in accordance with National Institutes ofHealth guidelines.
Behavioral taskOur basic methods for the behavioral task, surgery, and recording ofneuronal and kinematics signals have been described previously(20, 39). Two monkeys were operantly conditioned to perform areach-to-grasp task with the right hand (fig. S1A). Eachmonkey starteda trial by putting its hand on a home button for a predetermined time(2 to 2.5 s). After receiving the cue, they reached for a joystick leverand pulled it to get a reward [time frommovement onset: Monkey T,342 ± 39 ms (mean ± SD, n = 3317 trials); Monkey C, 375 ± 47 ms(n = 934 trials)]. The targets were placed 25 and 20 cm apart from thestarting point for Monkeys T and C, respectively. We recorded timesfor releasing the home button, pulling the lever, and pushing the homebutton.Monkey T performed the task for 24 sessions of 10min each, inwhich they conducted 142.4 ± 7.4 (mean ± SD) trials per session.Among the 24 sessions, we recorded the neuronal activity in peripheralafferents, ECoG, EMG, and kinematics in 21 sessions and ECoG, EMG,and kinematics in 3 sessions. Monkey C performed the task for 40sessions of 10 min each, in which 127.1 ± 15.9 (mean ± SD) trials wereconducted per session. Among the 40 sessions, we recorded the neuro-nal activity in peripheral afferents, ECoG, EMG, and kinematics in7 sessions.We recorded ECoG, EMG, and kinematics in 33 sessions butdid not record times for pulling the lever in these sessions.
Monkey Tmade reachingmovements to one of two target locations18 cm apart from one another along the right-left axis of the body andgrasped one of the objects, with three different shapes, in each session.Monkey C made reaching movements to one target location andgrasped one object in each session during which we recorded the neu-ronal activity in peripheral afferents. In sessions where we recordedECoG,EMG, andkinematics only,MonkeyCmade reachingmovementsto one target location (22 sessions), one of three locations (6 sessions),one of four locations (1 session), one of six locations (1 session), andvariable locations (3 sessions) on the coronal plane in each trial.
SurgeryWe used a mixture of xylazine (0.4 mg/kg) and ketamine (5 mg/kg) toinduce anesthesia, and then isoflurane (exhaled level, 1 to 2%) and ni-trous oxide gas (1 to 2%) to maintain anesthesia. During the implanta-tion of electrode arrays into DRGs, the monkeys were paralyzed usingpancuronium bromide (0.2 mg/kg per hour; Mioblock). ExpiratoryCO2 levels were continuously maintained within the physiological range(3.3 to 4.2%), and the depth of anesthesia was checked by monitoringexpiratory CO2 levels and heart rate. Dexamethasone, ketoprofen, andampicillin were postoperatively administered.
ForEMGrecording, pairs ofTeflon-insulatedwire electrodes (AS631,Cooner Wire) were secured into the forelimb muscles on the right sideusing silk suture. The wire electrodes were implanted in the deltoideusposterior, triceps, biceps, brachioradialis, extensor carpi radialis, exten-sor digitorum communis, palmaris longus, flexor digitorum profundus,flexor digitorum superficialis, flexor carpi ulnaris, extensor digitorum 2and 3, and adductor pollicis of Monkey T and the pectoralis major, del-toideus posterior, triceps brachii longus, triceps lateralis, biceps, brach-ioradialis, extensor carpi radialis, extensor digitorum communis, flexordigitorum profundus, flexor carpi ulnaris, abductor pollicis longus, andadductor pollicis of Monkey C. Since we observed the electrocar-diogram mixed with activities in the pectoralis major and biceps inMonkey C, we did not use these data in analyses.
10 of 14

SC I ENCE ADVANCES | R E S EARCH ART I C L E
on January 24, 2020http://advances.sciencem
ag.org/D
ownloaded from
To implant a grid electrode array on the cortical surface, we made acraniotomy to expose the premotor cortex, M1, and S1 on the left side.We implanted a 32-channel grid electrode array, in which the diameterof each electrode was 1 mm and the interelectrode distance was 3 mm(Unique Medical), beneath the dura mater (fig. S1B). We placed theground and reference electrodes over the ECoG electrode so that theycontacted the dura. After implanting the array, we fixed a connector onthe skull via dental acrylic.
To implant electrode arrays into DRGs, we bilaterally exposed theC3 through the Th2 vertebrae and inserted stainless screws into the lat-eral mass of each vertebra on both sides. After we dissected a lateralmass of C5-Th1 segments on the right side, we implanted two multi-electrode arrays, consisting of 48 platinized-tip silicon electrodes with0.1 to 1 megohm at 1 kHz, 1 mm in length, 400 mm in interelectrodedistance, and in a 5 × 10 configuration (Blackrock Microsystems), intotwo cervical DRGs (Monkey T: C7 and C8; Monkey C: C6 and C7) onthe right side using a high-velocity inserter. We placed reference wiresover the dura of the spinal cord. After implanting the arrays, weattached a connector to the spine using dental acrylic.
Movement recordingsForelimb movements were recorded using an optical motion capturesystem that used 12 infrared cameras (Eagle-4Digital RealTime System,Motion Analysis). The spatial positions of the reflective markers (4- or6-mm-diameter spheroids) were sampled at 200 Hz. Ten markers wereattached to the surface of the forelimb using mild adhesive. Positions ofthe 10 markers were as follows: the left shoulder (marker 1; m1), thecenter of the chest (m2), the right shoulder (m3), the biceps (m4), thetriceps (m5), the lateral epicondyle (m6), medial to m6 (m7), the radialstyloid process (m8), the ulnar styloid process (m9), and the metacar-pophalangeal joint of digit 2 (m10). We calculated flexion/extension(FE) of the shoulder, adduction/abduction (AA) of the shoulder, FEof the elbow, pronation/supination (PS), FE of the wrist, and radial/ulnar (RU) of the wrist (table S1). To reduce noise from various sources,we applied a low-pass filter with a cutoff frequency of 5 Hz to temporalchanges in the joint angles.
Neural recordings and spike detectionEMGsignalswere amplified using amplifiers (AB-611J,NihonKohden)with a gain of ×1000 to 2000 and were sampled at 2000Hz inMonkeyT and1000Hz inMonkeyC.Temporal filtering of the signalswas carriedout with a second-order Butterworth band-pass filter (1.5 to 60 Hz). Thesignals were rectified and computed in 5-ms bins corresponding tothe sampling rates of the motion capture system. A smoothed curve ofthe signals was then calculated using a moving window process with awindow length of 11 bins.
ECoG signalswere amplified using amultichannel amplifier (PlexonMAP system, Plexon) with a gain of ×1000 and sampled from eachelectrode at 2000Hz inMonkeyT and 1000Hz inMonkeyC. Temporalfiltering of the signals was carried out with a second-Butterworth band-pass filter (1.5 to 240 Hz). We computed short-time fast Fourier trans-form onmoving 100-ms windows of the preprocessed signals.We useda 200-Hz frequency step size to match the sampling rate to that of themotion capture system. We computed power normalized to the aver-aged power in each session and calculated an averaged power in high-gbands (high-g 1, 60 to 120 Hz; high-g 2, 120 to 180 Hz). SLiR analysisshowed that high-g power of ECoG signals inM1 encoded the kinemat-ic variables (fig. S2). Moreover, the same analysis indicated that high-gpower of ECoG signals in S1 encoded the kinematic variables immedi-
Umeda et al., Sci. Adv. 2019;5 : eaaw5388 10 July 2019
ately before cortical activity (fig. S2). As a neuronal ensemble activity ofM1 neurons encoded the kinematic variables (40), we used the high-gpower of ECoG signals as representative of neural activity in corticalareas in the analyses. Data from one electrode of Monkey C were notused for the analysis because of high noise (black circle in fig. S1B).
Neuronal signals of peripheral afferents were initially amplifiedusing the same multichannel amplifier with a gain of ×20,000 andsampled from each electrode at 40 kHz. We extracted filtered waves(150 to 8000 Hz) above an amplitude threshold that was determinedby the “auto-threshold algorithm” of the software.We sorted the thresh-olded waves using semiautomatic sorting methods (Offline Sorter,Plexon), followedbymanual verification and correctionof these clustersif needed. When the interval of the consecutive spikes was less than1 ms, the second spikes were removed. To obtain the instantaneousfiring rate, we convolved the inversion of the interspike interval withan exponential decay function whose time constant was 50 ms. Wecomputed the firing rate in 5-ms bins, corresponding to the samplingrates of themotion capture system.When we examined themodality ofrecorded units, we identified some units as muscle spindles, tendonorgans, and cutaneous receptors by moving the forelimb, tapping overthe muscle belly, and brushing the skin (39).
Sparse linear regressionWe applied aBayesian SLiR algorithm that introduces sparse conditionsfor the unit/channel dimension only and not for the temporal dimen-sion of themodel. High-g power recorded in S1 electrodes wasmodeledas a weighted linear combination of the neuronal activity of peripheralafferents and high-g activity in MCx using multidimensional linear re-gression as follows
yj;TðtÞ ¼ ∑k;lwj;k;l � xk;Tðt þ ldÞ þ bj ð1Þ
where yj,T(t) is a vector of activity of an S1 electrode j (two frequencybands of eight and six electrodes in Monkeys T and C, respectively) attime index t in a trial T, xk,T(t + ld) is an input vector of a peripheralafferent or a cortical electrode k at time index t and time lag ld (d = 5ms)in a trial T, wj,k,l is a vector of weights on a peripheral afferent or a cor-tical electrode k at time lag ld, and bj is a vector of bias terms to yj,T.Because we examined how combined activities in MCx and peripheralafferents influenced activity in S1, time lag ld (Eq. 1) was set to negativevalues. We used a time window of 100 ms because the prediction accu-racy reached a plateau at 100 ms.
To compute the contribution of each cortical area or peripheral af-ferents to the reconstruction of S1 activity, we calculated each compo-nent of reconstructed activity using MCx, premotor cortices, M1, orperipheral afferent activity and their respectiveweight values in a decod-ing model that was built from combined activities in MCx andperipheral afferents. For example, the MCx component was calculatedas follows
y MCxj;TðtÞ ¼ ∑k;lwj;k;l � x MCxk;Tðt þ ldÞ þ bj ð2Þ
where y_MCxj,T(t) is a vector of theMCx component at an S1 electrodej at time index t in a trial T, x_MCxk,T(t + ld) is an input vector of acortical electrode k at time index t and time lag ld in a trial T, andwj,k,l is derived from a vector of weights in Eq. 1, but with weights as-signed to peripheral afferents removed.
11 of 14
SC I ENCE ADVANCES | R E S EARCH ART I C L E
on January 24, 2020http://advances.sciencem
ag.org/D
ownloaded from
The temporal activity of muscles was modeled as a weightedlinear combination of high-g activity in M1 or S1 using the aboveEq. 1. In the analysis, yj,T (t) is a vector of EMG of a muscle j (12 and10 muscles of Monkey T and C, respectively) at time index t in a trialT. xk,T (t + ld) is an input vector of a channel k at time index t andtime lag ld (d = 5 ms) in a trial T. wj,k,l is a vector of weights on achannel k at time lag ld for a muscle j, and bj is a vector of bias termsto yj,T. As we examined how activity in M1 or S1 before movementinitiation influenced the initial increase in muscle activity, time lag ldwas set to negative values. We built a model from the activity in M1or S1 to reconstruct the subsequentmuscle activity during the premove-ment period (−500 to 0 ms around movement onset). Then, we recon-structed EMG by applying the obtained model to the M1 or S1 activitythroughout the premovement andmovement periods (−500 to 2000msaroundmovement onset).We used a timewindow of 50ms because theprediction accuracy reached a plateau at 50 ms.
The initial peak EMG amplitude was modeled as a weighted linearcombination of the high-g activity inM1or in S1within an overlapping,sliding time window of 50 ms as follows
yj;T ¼ ∑k;lwj;k;l � xk;Tðt þ ldÞ þ bj ð3Þ
where yj,T is a vector of EMG of a muscle j (12 and 10 muscles of Mon-key T and C, respectively) in a trial T, xk,T(t + ld) is an input vector of achannel k at time index t and time lag ld in a trial T, wj,k,l is a vector ofweights on a channel k at time lag ld for a muscle j, and bj is a vector ofbias terms to yj,T. As we examined how the activity in M1 or S1 influ-enced the initial peak amplitude ofmuscle activity, time lag ldwas set tonegative values. We used a time window of 50 ms so that l was set to−10. To examine the point at which M1 or S1 started to encode EMGburst amplitude, we changed time index t.
Joint angles were modeled as a weighted linear combination ofneuronal activities in peripheral afferents or high-g power in M1 orS1 using multidimensional linear regression as follows
yj;TðtÞ ¼ ∑k;lwj;k;l � xk;Tðt þ ldÞ þ bj ð4Þ
where yj,T(t) is a vector of kinematic variables j (joint angle) at timeindex t in a trial T, xk,T (t + ld) is an input vector of unit k at timeindex t and time lag ld (d = 5 ms) in a trial T, wj,k,l is a vector ofweights on a peripheral afferent or a cortical electrode k at time lagld, and bj is a vector of bias terms to yj,T. We considered that, in thesensory-motor closed-loop pathway, neuronal activity inM1 evokes ac-tivity in muscles, which, in turn, generate the movement of the limb. Ina model of high-g activity in M1, we set the time lag ld (Eq. 4) tonegative values. In contrast, we considered that self-generatedmove-ments evoke the neuronal activity of peripheral afferents and high-gactivity in S1; therefore, in models of peripheral afferents or high-gactivity in S1, we set the time lag ld to positive values. By changing thelength of the time window, we attained a time window (400ms) withinwhich the accuracy of reconstructing joint kinematics reached a plateau.We then used this time window in encoding forelimb kinematics fromneural activities.
Data analysisWe built models to reconstruct activity in S1, temporal changes inEMG, or joint kinematics using a partial dataset (training dataset)
Umeda et al., Sci. Adv. 2019;5 : eaaw5388 10 July 2019
and tested them using the remainder of the same dataset (test dataset).For reconstruction of S1 activity and joint kinematics, we partitionedcontinuously recorded data of each session into 24 blocks (one blockfor 25 s of data). Among the 24 blocks, 20 randomly selected blockswere used for the training dataset and the remaining 4 blocks wereused for the test dataset. For reconstruction of EMG signals, five-sixthsof the full trials of each session were randomly selected as a trainingdataset and the remainder were selected as the test dataset. To assessthe model, we calculated the correlation coefficient between observeddata and their reconstruction in the test dataset.We also calculated var-iance accounted for (VAF) as follows
VAF ¼ 1�∑ðyðtÞ � f ðtÞÞ2∑ðyðtÞ � yðtÞÞ2 ð5Þ
where y(t) is a vector of the actual activity in S1 at time index t,yðtÞ is themean of y(t), and f(t) is the reconstructed activity at time index t. Weperformed sixfold cross-validation in the analysis of each session andused averaged values for the analysis. Then, we calculated averagedvalues of each electrode and each kinematic variable from data takenfrom 21 (Monkey T) and 7 (Monkey C) sessions in decoding S1 activityand joint kinematics and averaged values of each muscle from datataken from 24 (Monkey T) and 40 (Monkey C) sessions in decodingEMG activity. In control analyses of the model reconstruction, wecreated surrogate training datasets in which we shuffled temporalprofiles of inputs independently across different blocks to generatea model and subsequently tested the model.
We built amodel to predict the initial peak amplitude of EMGusinga training dataset and tested it using a test dataset. Five-sixths of the fulltrials were randomly selected as a training dataset and the remainderwere selected as the test dataset (Monkey T: 2847 trials for training,570 trials for test; Monkey C: 4234 trials for training, 847 trials for test).To assess the model, we calculated the correlation coefficient betweenthe observed and reconstructed EMG amplitude in the test dataset. Wealso calculated the largest possible variance (the first principalcomponent) between the observed and reconstructed EMG amplitudeto obtain the slope of the regression line. We drew regression lines thatpassed the centroid of the data in the plot (Fig. 6A). Among models ofhigh-g activity inM1or S1 in sliding timewindows in the premovementperiod (−500 to 0 ms around movement onset), we selected a modelthat reconstructed the initial peak amplitude of eachmuscle at the high-est accuracy (Fig. 6, B and C). We performed sixfold cross-validationin the analysis. In control analyses of the model reconstruction, wecreated surrogate training datasets in which we randomized the trialsof input array (trial shuffling) to generate a model and subsequentlytested the model.
We built a model to predict the initial peak amplitude of EMG fromM1, S1, or peripheral afferents activity using a training dataset andtested it using a test dataset. We first determined putatively the sameunits among different sessions according to the shape of waveformsand the distribution of interspike intervals. Thirty-one units were iden-tified as putatively the same units among nine different sessions inMonkey T. Five-sixths of the full trials were randomly selected as atraining dataset and the remainder were selected as the test dataset(1091 trials for the training, 219 trials for the test). To assess the model,we calculated the correlation coefficient and the slope of the regressionline between the observed and reconstructed EMGamplitude in the testdataset. We performed sixfold cross-validation in the analysis. In con-trol analyses of the model reconstruction, we created surrogate training
12 of 14

SC I ENCE ADVANCES | R E S EARCH ART I C L E
on January 24, 2020http://advances.sciencem
ag.org/D
ownloaded from
datasets in which we randomized the trials of input arrays (trialshuffling) to generate a model and subsequently tested the model.
To obtain the onset time of the activity or the reconstruction, we firstcalculated the average of the alignedwaveform in a test dataset [MonkeyT: 21.4 ± 0.7 trials (mean ± SD, n = 21 sessions); Monkey C: 19.8 ± 1.0trials (n = 7 sessions)]. Then, we calculated a threshold of the aver-aged aligned waveform by adding an average of activity during thebaseline period (−1250 to −250 ms around movement onset) to one-fifth of the amplitude of the activity from 250ms before to 100 ms aftermovement onset. If the activity was over the threshold in five consecu-tive bins, then the first of these bins was set as the onset of the activity.The calculated onset corresponded well with that based on visual in-spection. We calculated the average values of the onset from six testdatasets in one session and finally obtained their average from thewholesessions. We also used the average activity during the baseline period tocalculate the area above the baseline. To obtain the end point of the ac-tivity in S1, we first calculated a threshold of the aligned waveform byadding an average of activity during the baseline period (−1250 to−250msaround movement onset) to 3/10 of the amplitude of the activity from250 ms before to 100 ms after movement onset. If the activity 1000 msafter movement onset was below the threshold in five consecutivebins, the first of these bins was set as the end point of the activity inS1. The end point of the activity in S1 was 1307 ± 27 ms (mean ± SD,n = 16 signals; eight electrodes, two bands) after movement onset forMonkey T and 1450 ± 51 ms (mean, n = 12 signals; six electrodes,two bands) for Monkey C.
To calculate the point when M1 or S1 started to encode EMG burstamplitude (Fig. 6), we used a common threshold in the encoding ofM1 and S1. For both the correlation coefficient and the slope of theregression line, we calculated the encoding magnitude by subtractingthe baseline activity during the baseline period (−845 to −255 msaround movement onset) from the magnitude from 245 ms beforeto 255 ms after movement onset. Then, we calculated the 1/5 (corre-lation coefficient) or 1/20 (slope) of the encoding magnitude and used alarger one of the values for M1 and S1 as a common threshold. Last,we added the common threshold to the baseline activity for M1 andS1 and used this value as respective thresholds. If the indices were overthe threshold in three consecutive bins, then the first of these bins wasset as the point when M1 or S1 started to encode EMG burst ampli-tude. Reconstruction accuracy (slope) of the flexor digitorum profun-dus muscle of Monkey C was only 0.02 in the decoding from M1 and0.04 from S1, so we did not calculate the point when M1 or S1 startedto encode burst amplitude for this muscle.
To calculate the point whenM1, S1, or peripheral afferents started toencode EMGburst amplitude (fig. S8), we used a common threshold fortheir encoding. For both the correlation coefficient and the slope of theregression line, we calculated the encoding magnitude by subtractingthe baseline activity during the baseline period (−845 to −255 msaround movement onset) from the magnitude from 245 ms before to255 ms after the movement onset. Then, we calculated the 1/5 (correla-tion coefficient) or 1/20 (slope) of the encoding magnitude and used alarger one of the values forM1 and S1 as a common threshold. Last, weadded the common threshold to the baseline activity for M1, S1, andperipheral afferents and used this value as respective thresholds. If theindices were over the threshold in three consecutive bins, then the firstof these bins was set as the point when M1, S1, or afferents started toencode EMG burst amplitude.
To calculate the variability of the averaged profile of the MCx andAfferent components, a principal component analysis (PCA) was
Umeda et al., Sci. Adv. 2019;5 : eaaw5388 10 July 2019
performed on the MCx and Afferent components throughout the pre-movement andmovement periods (−500 to 2000ms aroundmovementonset) of eight (Monkey T) or six (Monkey C) electrodes. Values forhigh-g 1 and 2 were averaged before PCA was conducted. More than90% of the total variance was captured by the first principal componentfor the MCx component and by the first two principal components forthe Afferent component.
To obtain a weight value given to each electrode, weight vector wj,k,l
in Eq. 1 or 3 in the manuscript was averaged across time points. Valuesfor high-g 1 and 2 were averaged. The one-way ANOVA was used todetermine whether there are any statistically significant differences be-tween the means of weight values of different electrodes.
Statistical analysisWe used the nondirectional paired Student’s t test. An a level of signif-icance was set at 0.05 for all statistical tests. Data are expressed asmeans ± SE or means ± SD. We used MATLAB R2015b (MathWorks)for the statistical analysis. Data distribution was assumed to be normal,but this was not formally tested. No statistical methods were used topredetermine sample sizes. However, sample sizes were estimated bymethodologically comparable previous experiments in the laboratoryand are similar to those employed in the field.
SUPPLEMENTARY MATERIALSSupplementary material for this article is available at http://advances.sciencemag.org/cgi/content/full/5/7/eaaw5388/DC1Fig. S1. Closed-loop sensory-motor circuits were simultaneously recorded from monkeys.Fig. S2. Peripheral afferents, M1, and S1 activities encode forelimb joint kinematics.Fig. S3. Both MCx and peripheral afferent activities contribute to the decoding of S1 activity.Fig. S4. MCx, not peripheral afferent, activity contributes to the decoding of premovement S1activity.Fig. S5. M1 activity is a better predictor of S1 activity than premotor cortex.Fig. S6. M1 activity contributes to the decoding of premovement S1 activity.Fig. S7. Premovement activity in a core area encodes muscle activity.Fig. S8. Premovement activities in M1 and S1 encode EMG burst.Fig. S9. Proposed temporal dynamics in which S1 receives information about motor outputand somatosensory feedback signals.Table S1. Calculation of the joint angles.
REFERENCES AND NOTES1. R. C. Miall, D. M. Wolpert, Forward models for physiological motor control. Neural Netw. 9,
1265–1279 (1996).2. C. E. Chapman, M. C. Bushnell, D. Miron, G. H. Duncan, J. P. Lund, Sensory perception
during movement in man. Exp. Brain Res. 68, 516–524 (1987).3. R. W. Angel, R. C. Malenka, Velocity-dependent suppression of cutaneous sensitivity
during movement. Exp. Neurol. 77, 266–274 (1982).4. K. Seki, E. E. Fetz, Gating of sensory input at spinal and cortical levels during preparation
and execution of voluntary movement. J. Neurosci. 32, 890–902 (2012).5. W. Jiang, Y. Lamarre, C. E. Chapman, Modulation of cutaneous cortical evoked potentials
during isometric and isotonic contractions in the monkey. Brain Res. 536, 69–78 (1990).6. A. Starr, L. G. Cohen, ‘Gating’ of somatosensory evoked potentials begins before the
onset of voluntary movement in man. Brain Res. 348, 183–186 (1985).7. R. J. Nelson, Interactions between motor commands and somatic perception in
sensorimotor cortex. Curr. Opin. Neurobiol. 6, 801–810 (1996).8. M. J. Soso, E. E. Fetz, Responses of identified cells in postcentral cortex of awake monkeys
during comparable active and passive joint movements. J. Neurophysiol. 43, 1090–1110(1980).
9. B. M. London, L. E. Miller, Responses of somatosensory area 2 neurons to actively andpassively generated limb movements. J. Neurophysiol. 109, 1505–1513 (2013).
10. M. J. Prud’homme, J. F. Kalaska, Proprioceptive activity in primate primary somatosensorycortex during active arm reaching movements. J. Neurophysiol. 72, 2280–2301 (1994).
11. F. Cui, D. Arnstein, R. M. Thomas, N. M. Maurits, C. Keysers, V. Gazzola, Functionalmagnetic resonance imaging connectivity analyses reveal efference-copy to primarysomatosensory area, BA2. PLOS ONE 9, e84367 (2014).
13 of 14
SC I ENCE ADVANCES | R E S EARCH ART I C L E
on January 24, 202http://advances.sciencem
ag.org/D
ownloaded from
12. W. Jiang, C. E. Chapman, Y. Lamarre, Modulation of somatosensory evoked responses inthe primary somatosensory cortex produced by intracortical microstimulation of themotor cortex in the monkey. Exp. Brain Res. 80, 333–344 (1990).
13. H.-C. Shin, J. K. Chapin, Mapping the effects of motor cortex stimulation on singleneurons in the dorsal column nuclei in the rat: Direct responses and afferent modulation.Brain Res. Bull. 22, 245–252 (1989).
14. H.-C. Shin, J. K. Chapin, Mapping the effects of motor cortex stimulation onsomatosensory relay neurons in the rat thalamus: Direct responses and afferentmodulation. Brain Res. Bull. 24, 257–265 (1990).
15. M. Khateb, J. Schiller, Y. Schiller, Feedforward motor information enhancessomatosensory responses and sharpens angular tuning of rat S1 barrel cortex neurons.eLife 6, e21843 (2017).
16. E. Zagha, A. E. Casale, R. N. S. Sachdev, M. J. McGinley, D. A. McCormick, Motor cortexfeedback influences sensory processing by modulating network state. Neuron 79,567–578 (2013).
17. S. Lee, G. E. Carvell, D. J. Simons, Motor modulation of afferent somatosensory circuits.Nat. Neurosci. 11, 1430–1438 (2008).
18. S. Ray, S. S. Hsiao, N. E. Crone, P. J. Franaszczuk, E. Niebur, Effect of stimulus intensity onthe spike–local field potential relationship in the secondary somatosensory cortex.J. Neurosci. 28, 7334–7343 (2008).
19. R. J. Nelson, Activity of monkey primary somatosensory cortical neurons changes prior toactive movement. Brain Res. 406, 402–407 (1987).
20. D. Shin, H. Watanabe, H. Kambara, A. Nambu, T. Isa, Y. Nishimura, Y. Koike, Predictionof muscle activities from electrocorticograms in primary motor cortex of primates.PLOS ONE 7, e47992 (2012).
21. A. L. Towe, S. J. Jabbur, Cortical inhibition of neurons in dorsal column nuclei of cat.J. Neurophysiol. 24, 488–498 (1961).
22. M. Pais-Vieira, M. A. Lebedev, M. C. Wiest, M. A. L. Nicolelis, Simultaneous top-downmodulation of the primary somatosensory cortex and thalamic nuclei during activetactile discrimination. J. Neurosci. 33, 4076–4093 (2013).
23. M. M. Morrow, L. E. Miller, Prediction of muscle activity by populations of sequentiallyrecorded primary motor cortex neurons. J. Neurophysiol. 89, 2279–2288 (2003).
24. M. S. Christensen, J. Lundbye-Jensen, S. S. Geertsen, T. H. Petersen, O. B. Paulson,J. B. Nielsen, Premotor cortex modulates somatosensory cortex during voluntarymovements without proprioceptive feedback. Nat. Neurosci. 10, 417–419 (2007).
25. C. Darian-Smith, I. Darian-Smith, K. Burman, N. Ratcliffe, Ipsilateral cortical projections toareas 3a, 3b, and 4 in the macaque monkey. J. Comp. Neurol. 335, 200–213 (1993).
26. C. L. Witham, M. Wang, S. N. Baker, Corticomuscular coherence between motor cortex,somatosensory areas and forearm muscles in the monkey. Front. Syst. Neurosci. 4, 38 (2010).
27. A. Taylor, R. Durbaba, P. H. Ellaway, S. Rawlinson, Patterns of fusimotor activity duringlocomotion in the decerebrate cat deduced from recordings from hindlimb musclespindles. J. Physiol. 522, 515–532 (2000).
28. F. Matyas, V. Sreenivasan, F. Marbach, C. Wacongne, B. Barsy, C. Mateo, R. Aronoff,C. C. H. Petersen, Motor control by sensory cortex. Science 330, 1240–1243 (2010).
29. B. J. Sessle, M. Wiesendanger, Structural and functional definition of the motor cortex inthe monkey (Macaca fascicularis). J. Physiol. 323, 245–265 (1982).
30. M. P. Galea, I. Darian-Smith, Multiple corticospinal neuron populations in the macaquemonkey are specified by their unique cortical origins, spinal terminations, andconnections. Cereb. Cortex 4, 166–194 (1994).
Umeda et al., Sci. Adv. 2019;5 : eaaw5388 10 July 2019
0
31. G. L. Widener, P. D. Cheney, Effects on muscle activity from microstimuli applied tosomatosensory and motor cortex during voluntary movement in the monkey.J. Neurophysiol. 77, 2446–2465 (1997).
32. S. Lee, I. Kruglikov, Z. J. Huang, G. Fishell, B. Rudy, A disinhibitory circuit mediates motorintegration in the somatosensory cortex. Nat. Neurosci. 16, 1662–1670 (2013).
33. E. G. Jones, J. D. Coulter, S. H. C. Hendry, Intracortical connectivity of architectonic fields inthe somatic sensory, motor and parietal cortex of monkeys. J. Comp. Neurol. 181,291–347 (1978).
34. S. Cheema, A. Rustioni, B. L. Whitsel, Sensorimotor cortical projections to the primatecuneate nucleus. J. Comp. Neurol. 240, 196–211 (1985).
35. K. Kultas-Ilinsky, E. Sivan-Loukianova, I. A. Ilinsky, Reevaluation of the primary motor cortexconnections with the thalamus in primates. J. Comp. Neurol. 457, 133–158 (2003).
36. A. Canedo, L. Martinez, J. Mariño, Tonic and bursting activity in the cuneate nucleusof the chloralose-anesthetized cat. Neuroscience 84, 603–617 (1998).
37. R. Leiras, P. Velo, F. Martín-Cora, A. Canedo, Processing afferent proprioceptive information atthe main cuneate nucleus of anesthetized cats. J. Neurosci. 30, 15383–15399 (2010).
38. A. Palmeri, M. Bellomo, R. Giuffrida, S. Sapienza, Motor cortex modulation ofexteroceptive information at bulbar and thalamic lemniscal relays in the cat. Neuroscience88, 135–150 (1999).
39. T. Umeda, H. Watanabe, M.-a. Sato, M. Kawato, T. Isa, Y. Nishimura, Decoding of thespike timing of primary afferents during voluntary arm movements in monkeys.Front. Neurosci. 8, 97 (2014).
40. J. Wessberg, C. R. Stambaugh, J. D. Kralik, P. D. Beck, M. Laubach, J. K. Chapin, J. Kim,S. J. Biggs, M. A. Srinivasan, M. A. L. Nicolelis, Real-time prediction of hand trajectory byensembles of cortical neurons in primates. Nature 408, 361–365 (2000).
Acknowledgments: We thank Y. Yamanishi for animal care and Y. Nishihara, M. Suzuki, andM. Togawa for technical help. Funding: The monkeys used in this study were provided bythe National Institute of Natural Sciences through the National BioResource Project of theMinistry of Education, Culture, Sports, Science, and Technology of Japan (MEXT). This work wassupported by grants from the “Brain Machine Interface Development” and performedunder the Strategic Research Program for Brain Sciences from MEXT and the Japan Agency forMedical Research and Development; the Japan Science and Technology Agency; the Ministryof Education, Culture, Sports, Science, and Technology; Grant-in-Aid for Scientific Research(KAKENHI 23680061 and 25135733 to Y.N.); and Medtronic Japan External Research Institute(to T.U.). Author contributions: T.U. and Y.N. conceived and designed the experiments.T.U. and Y.N. performed the experiments. T.U. analyzed the data and prepared figures. Allauthors wrote the manuscript. Competing interests: The authors declare that they haveno competing interests. Data and materials availability: All data needed to evaluate theconclusions in the paper are present in the paper and/or the Supplementary Materials.Additional data related to this paper may be requested from the authors.
Submitted 29 January 2019Accepted 4 June 2019Published 10 July 201910.1126/sciadv.aaw5388
Citation: T. Umeda, T. Isa, Y. Nishimura, The somatosensory cortex receives information aboutmotor output. Sci. Adv. 5, eaaw5388 (2019).
14 of 14

The somatosensory cortex receives information about motor outputTatsuya Umeda, Tadashi Isa and Yukio Nishimura
DOI: 10.1126/sciadv.aaw5388 (7), eaaw5388.5Sci Adv
ARTICLE TOOLS http://advances.sciencemag.org/content/5/7/eaaw5388
MATERIALSSUPPLEMENTARY http://advances.sciencemag.org/content/suppl/2019/07/08/5.7.eaaw5388.DC1
REFERENCES
http://advances.sciencemag.org/content/5/7/eaaw5388#BIBLThis article cites 40 articles, 5 of which you can access for free
PERMISSIONS http://www.sciencemag.org/help/reprints-and-permissions
Terms of ServiceUse of this article is subject to the
is a registered trademark of AAAS.Science AdvancesYork Avenue NW, Washington, DC 20005. The title (ISSN 2375-2548) is published by the American Association for the Advancement of Science, 1200 NewScience Advances
License 4.0 (CC BY-NC).Science. No claim to original U.S. Government Works. Distributed under a Creative Commons Attribution NonCommercial Copyright © 2019 The Authors, some rights reserved; exclusive licensee American Association for the Advancement of
on January 24, 2020http://advances.sciencem
ag.org/D
ownloaded from