the solegel synthesis of perovskites by an edta/citrate ... · (ba 0.5sr 0.5)(co 0.8fe 0.2)o 3 d....
TRANSCRIPT

ARTICLE IN PRESS
Available online at www.sciencedirect.com
+ MODEL
Solid State Sciences xx (2008) 1e13www.elsevier.com/locate/ssscie
The solegel synthesis of perovskites by an EDTA/citrate complexingmethod involves nanoscale solid state reactions
A. Feldhoff a,*, M. Arnold a, J. Martynczuk a, Th.M. Gesing b, H. Wang a,c
a Institute of Physical Chemistry and Electrochemistry, Leibniz Universitat Hannover, Callinstraße 3-3A, D-30167 Hannover, Germanyb Institute of Mineralogy, Leibniz Universitat Hannover, Welfengarten 1, D-30167 Hannover, Germany
c College of Chemical and Energy Engineering, South China University of Technology, Guangzhou 510640, PR China
Received 26 January 2007; received in revised form 1 June 2007; accepted 19 November 2007
On the occasion of the 75th birthday of Prof. Schmalzried.
Abstract
Nowadays, solegel procedures are well established in the synthesis of complex oxides as they allow to obtain phase pure products and tocontrol precisely their stoichiometry. This quality makes them a tool of choice for the preparation of perovskite-type oxides. To optimize thefunctional properties of these materials, it is essential to set accurately their possible complex stoichiometries. However, details of the formationof the perovskite crystal remain obscure. Different stages of an ethylene-diamine-tetraacetic acid (EDTA)/citrate-gel based synthesis process formixed conducting (Ba0.5Sr0.5)(Fe0.8Zn0.2)O3�d of cubic perovskite structure are elucidated. The combination of analytical transmission electronmicroscopy with X-ray diffraction reveals that the perovskite-type oxide is formed already at moderate temperatures at around 700 �C viananoscale solid state reactions between finely-dispersed crystalline intermediates identified as a spinel and a carbonate. The reaction scheme,however, is intricate and includes stuffed tridymite structures as transient phases. The ultrafine intermixing of extremely small reactants makesEDTA/citrate-gel based procedures superior to classical solid state routes with respect to applications that demand phase purity and stoichiom-etry control.� 2007 Elsevier Masson SAS. All rights reserved.
Keywords: Solegel synthesis; Perovskite; Reaction mechanism; Transmission electron microscopy; Carbonate; Spinel; Stuffed tridymite; Rietveld refinement;
Ellingham diagram
1. Introduction
Conventionally, complex oxides are prepared by the solidstate route that is the blending of powdered reactants, mostlyoxides and carbonates, and their firing at temperatures ashigh as 1200 �C. At these high temperatures the loss of themost volatile component may easily occur leading to non-stoichiometric products with decreased functional properties.
* Corresponding author. Tel.: þ49 511 762 2940; fax: þ49 511 762 19121.
E-mail addresses: [email protected] (A. Feldhoff),
[email protected] (M. Arnold), julia.martynczuk@pci.
uni-hannover.de (J. Martynczuk), [email protected]
(Th.M. Gesing), [email protected], [email protected]
(H. Wang).
1293-2558/$ - see front matter � 2007 Elsevier Masson SAS. All rights reserved.
doi:10.1016/j.solidstatesciences.2007.11.030
Please cite this article in press as: A. Feldhoff et al., Solid State Sci. (2008), doi
Alternative chemical synthesis processes have been introducedin the 1960s by the thermal decomposition of stirred metaleorganic complexes that employ distinctly lower temperaturesin the range of 600e700 �C [1,2,3]. All these processes relyon the chemistry of gels that contain all the cations in thedesired ratios [4,5]. Even though variants of these solegel pro-cedures are widely used today, details of the formation of thefinal crystalline product are still little known. The combinedethylene-diamine-tetraacetic acid (EDTA)/citrate complexingmethod under investigation has been introduced some yearsago [6]. It has been shown elsewhere [7e9] that complexoxides of cubic perovskite structure are formed in nanoscalesolid state reactions between carbonate and spinel intermedi-ates. The general reaction scheme has been outlined for theperovskite stoichiometries (Ba0.5Sr0.5)(Fe0.8Zn0.2)O3�d and
:10.1016/j.solidstatesciences.2007.11.030

2 A. Feldhoff et al. / Solid State Sciences xx (2008) 1e13
ARTICLE IN PRESS
(Ba0.5Sr0.5)(Co0.8Fe0.2)O3�d. The present study is devoted todetails of the formation of the Zn-containing perovskite thatturns out to be intricate on the atomic scale.
2. Materials and methods
The synthesis process is evaluated for a perovskite-typeoxide that is a prospective membrane material for oxygenseparation technologies [10e12] or electrode material forsolid oxide fuel cells [13]. In the temperature range of 700e950 �C, (Ba0.5Sr0.5)(Fe0.8Zn0.2)O3�d [14,15] is a mixed elec-tron and oxygen conductor that provides high oxygen fluxesand exhibits an excellent phase stability even under lowoxygen partial pressures, superior to other compositions.
The processing route employs both citric acid and EDTA asthe complexing and gelation agents [6] and has been adaptedfor the specific stoichiometry under investigation. Properamounts of Ba(NO3)2, Sr(NO3)2, Fe(NO3)3, and Zn(NO3)2
were dissolved in water followed by the addition of citricacid, EDTA and NH3. In the temperature range of 120e150 �C, the reaction mixture was then heated under constantstirring to obtain a purple-coloured gel. Afterwards, the gelwas pre-calcined for 1 h at 700 �C. The pre-calcined powderswere grounded and heated at temperatures up to 750 �C witha heating rate of 3 �C/min. Intermediates as well as final pro-ducts were analyzed by several techniques that are describedbelow.
X-ray diffraction (XRD) was conducted in a q/2q geometryon a Philips X’pert-MPD instrument using monochromated CuKa1,2 radiation at 40 kV and 40 mA, receiving slit of 0.15 mmand count times of 5 s/step. Data were collected in a step-scanmode in the 2q range of 20e50� with intervals of 0.03�.
Data for interpretation were taken from the ICDD PDF-2database with PDF numbers FeFe2O4 [19-629], ZnFe2O4
[22-1012], Fe2O3 [33-664], SrFeO3�x [34-641], and BaFeO3�x
[147-180]. Lattice parameters for the exact stoichiometrieshave been calculated according to homogeneous solid solu-tions. To index experimental data related to (Ba0.5Sr0.5)CO3,the structure has been described with unit cell parameters ac-cording to Ref. [16]. To index data related to (Ba1�xSrx)Fe2O4,the structure has been described in space group Cmc21 (No.36) based on the structure given in Ref. [17].
For structure refinements of the product phase, X-raypowder diffraction data were collected on a Bruker AXS D8Advance diffractometer using a transmission geometry, a Go-bel mirror and Cu Ka1,2 radiation. Six thousand data pointswere collected with a step width of 0.02� in the 2q rangefrom 20� to 140�. XRD powder data Rietveld refinementswere carried out by using TOPAS 3.0 (Bruker AXS) software.During refinements, general parameters such as the scale fac-tor, seven background parameters and the zero point of thecounter were optimized. Profile shape calculations were car-ried out on the basis of standard instrumental parameters usingthe fundamental parameter method implemented in the pro-gram, varying also the average crystal size (integral breadth)and the strain parameter 30 (FWHM based strain calculationassuming intermediate strain broadening modelled by a Voigt
Please cite this article in press as: A. Feldhoff et al., Solid State Sci. (2008), doi
function giving Dd/2q with a 50% probability). Additionally,the cell parameter and the displacement parameters were re-fined. In the case of site occupation with mixed atoms, linearconstraints were used for occupancy (occupancy of atom B isequivalent to 1.0 minus occupancy of atom A) and displace-ment parameters (atoms on the same position have the samedisplacement parameter).
Transmission electron microscopy (TEM) and scanningtransmission electron microscopy (STEM) were performedat 200 kV on a field-emission instrument of the type JEOLJEM-2100F. The microscope was equipped with an ultra-high-resolution pole piece that provides a point-resolutionbetter than 0.19 nm (spherical aberration constant CS¼0.5 mm, chromatic aberration constant CC¼ 0.5 mm) andallowed to make high-resolution transmission electron micros-copy (HRTEM). STEM was conducted in high-angle annulardark-field (HAADF) contrast that allows to obtain mass-thick-ness information. The microscope was equipped with anenergy filter of the type Gatan GIF 2001 with a 1k charge-coupled-device (CCD) camera. The filter was used to enhancethe dynamics in selected area electron diffraction (SAED) pat-tern by elastic filtering with a bandwidth of 15 eV. The filterwas employed as well to acquire electron energy-loss spectra(EELS) of core-loss energies with a special emphasis onenergy-loss near-edge structures (ELNES) at ionization edges.To obtain elemental maps via energy-filtered transmissionelectron microscopy (EFTEM), the three-window techniquewas utilized with 40 eV energy slit and power law model[18]. For the Fe-L edge energy slits were centered at 643,683 eV (pre-edge) and 728 eV (post-edge). To avoid any over-lap with Fe-L signals, for the Ba-M edge energy slits werecentered at 661, 751 eV (pre-edge) and 801 eV (post-edge).Individual exposure times were 30 s, respectively. Elementalanalysis by energy-dispersive X-ray spectroscopy (EDXS)was made using an Oxford Instruments INCA-200-TEMsystem with an ultra-thin window that was attached to themicroscope.
To obtain specimen for TEM, dried gel was crushed inethanol by mortar and pestle. The suspension was droppedfrom a pipette to a 300-mesh copper-supported carbon foil(Quantifoil) that was placed on a piece of filter paper towick away excess ethanol. Calcined powders were preparedfor TEM investigations by epoxy gluing them between twopieces of silicon wafer. These sandwiches were cut into1� 1.5� 3 mm rectangular pieces and polished in cross-section on polymer embedded diamond lapping films downto 0.01� 1� 2.5 mm, approximately (Allied High Tech, Mul-tiprep). Thinned sandwiches were glued onto a copper slotgrid, respectively, and Arþ ion sputtered at 3 kV under anincident angle of 6� (Gatan, model 691 PIPS, precision ionpolishing system) until electron transparency was achieved.
A quantity of 2 g of pure (Ba0.5Sr0.5)CO3 powder and(Zn0.6Fe0.4)Fe2O4 powder was synthesized by the EDTA/citrate method, and phase purity and crystal size were deter-mined by SEM (JEOL JSM-6700F), respectively. Experimen-tal determination of the CO2 equilibrium pressure above thecarbonate as a function of temperatures was performed in
:10.1016/j.solidstatesciences.2007.11.030

3A. Feldhoff et al. / Solid State Sciences xx (2008) 1e13
ARTICLE IN PRESS
a quartz glass equipment flanged to a turbo molecular pump.After sealing and evacuating the equipment from atmosphericpressure to 1 Pa and heating to 700 �C, the pressure was mea-sured with a Pirani gage in steps of 50 �C up to 1000 �C afterequilibration times of ca. 1/2 h, respectively.
3. Results and discussion
3.1. Early stages
Gelation takes place in the temperature range of 120e150 �C due to the release of water and is accompanied by theevaporation of ammonia. This leads to a decrease of thenitrogen and oxygen content as it is shown elsewhere [7].Fig. 1 shows a magnification series of Z-contrast HAADFmicrographs of the gel after 18 h at 150 �C. The gel is charac-terized by a fine dispersion of metal complexes (high Z ) ina polymerized network (low Z ). Individual metal atoms or clus-tered metal complexes give rise to strong electron scattering
Fig. 1. Magnification series in high-angle annular da
Please cite this article in press as: A. Feldhoff et al., Solid State Sci. (2008), doi
and thus bright contrast in the micrographs. The polymericmatrix composed of atoms with much lower scattering cross-sections appears with grey contrast. Concerning the stabilityconstants for the complex formation K given logarithmicallyin Table 1, the distinctly higher K-values for EDTA for allfour cations make a total complexation with EDTA most likely.On the contrary, the citric acid contributes to the gelation, andformation of a polymeric network, by a condensation due to theesterification of the alcohol group of the citric acid moleculewith the carboxyl group of another citric acid molecule or anEDTA molecule. In Fig. 1a and b some relatively large clustersof metal complexes with sizes of around 15 nm are present.Predominantly, cluster sizes are distinctly smaller as it can beseen in Fig. 1c and d. An eminent fraction of clusters is around5 nm in size. Moreover, the close-up in Fig. 1d shows structuraldetails with sizes of just 1 nm that hint to the presence of verysmall individual clusters of metal complexes. In conclusion, thesolegel method prevails a very fine intermixing of metal cat-ions on the nanometer scale.
rk-field contrast of the gel after 18 h at 150 �C.
:10.1016/j.solidstatesciences.2007.11.030

Table 1
Complex forming constants of metal cations (from Refs. [19,20])
EDTA, log K Citric acid, log K
Ba2þ 7.86 2.73
Sr2þ 8.74 3.02
Fe3þ 25.1 11.2
Zn2þ 16.5 4.76
4 A. Feldhoff et al. / Solid State Sciences xx (2008) 1e13
ARTICLE IN PRESS
3.2. Crystalline intermediates and perovskite
During further heating the gel starts to crystallize at about550e600 �C under the formation of intermediate phases thatcan be detected by XRD. Typical diffraction pattern after 1 hat 700 �C are given for three preparations in Fig. 2aec show-ing reflections from an aragonite-type carbonate (Fig. 2a,c andf) and spinel-type (Zn0.6Fe0.4)Fe2O4 oxide (Fig. 2b,c and g).During cumulated further heat treatments of the powder in
Fig. 2. X-ray powder diffraction of intermediates and perovskite. (a) Taken
from the synthesis of (Ba0.5Sr0.5)CO3 after 10 h at 750 �C, (b) taken from
the synthesis of (Zn0.6Fe0.4)Fe2O4 after 1 h at 700 �C, (cee) taken from the
synthesis of (Ba0.5Sr0.5)(Fe0.8Zn0.2)O3�d after (c) 1 h at 700 �C, (d) additional
12 h at 700 �C, (e) additional 10 h at 750 �C. (fei) Assignment of diffraction
lines for different phases: (f) aragonite-type (Ba0.5Sr0.5)CO3 carbonate, (g)
(Zn0.6Fe0.4)Fe2O4 spinel, (h) g-(Ba0.5Sr0.5)Fe2O4, (i) perovskite-type
(Ba0.5Sr0.5)(Fe0.8Zn0.2)O3�d.
Please cite this article in press as: A. Feldhoff et al., Solid State Sci. (2008), doi
Fig. 2c, the reflections of the intermediate phases becomesmaller, reflections of a further transient phase of stuffed tridy-mite-type oxide arise (Fig. 2d), and finally the perovskitestructure is formed (Fig. 2e).
Fig. 2d shows an XRD pattern after heating the powder ad-ditionally 12 h at 700 �C. The reflections of the intermediatesare less pronounced and broad reflections of a BaeSreFeoxide dominate (marked by stars), which can be comparedto a g-(Ba0.5Sr0.5)Fe2O4-type phase (Fig. 2h). More detailsconcerning the transient phase are discussed below in contextof Fig. 7. After additional heating for 10 h at 750 �C, the inter-mediate and transient phases are completely vanished anda pure perovskite powder is obtained (Fig. 2e and i).
The XRD analysis points to a solid state reaction in thenanoscale powder between the intermediates of the followingsimplified type:
carbonateðsolidÞ þ spinelðsolidÞ
/þO2
perovskiteðsolidÞ þ carbon dioxideðgaseousÞ ð1ÞThe liberation of gaseous CO2 is manifested in the evolu-
tion of a porous sponge-like solid that has been investigatedby scanning electron microscopy [7,8]. Details of this reactionare, however, more intricate as it is manifested in additionaltransient phases. All involved phases are discussed in thefollowing.
3.2.1. Rietveld refinement of the(Ba0.5Sr0.5)(Fe0.8Zn0.2)O3�d product
The stoichiometry of the product has been determined byEDXS during TEM experiments to be close to (Ba0.5Sr0.5)(Fe0.8Zn0.2)O3�d as is described elsewhere [14]. By XRD(Fig. 3), the perovskite was found to crystallize in the cubicspace group Pm-3m (No. 221) with a lattice parameter of0.39900(2) nm. Barium and strontium were refined on thesame crystallographic position 1a (0,0,0) with 52(2)% occupa-tion for the barium atoms corresponding to the chemical anal-ysis and a displacement parameter of B¼ 1.4(1). Iron (80%)and zinc (20%) were calculated on the 1b (1/2,1/2,1/2) posi-tion showing a high displacement of B¼ 2.4(1). An individualrefinement of the occupancy parameters for this position is notpossible. An equivalent high displacement of B¼ 3.1(5) wasfound for the oxygen atoms on the 3c (0,1/2,1/2) site. Thesehigher displacement parameters correspond to a strain param-eter of 30¼ 0.157(5) expressing the high distortion in thestructure caused by the mixed occupancy of the anionic posi-tions in combination with the oxygen deficit introduced by thelower 2þ charge of the zinc atoms in relation to the 2þ/3þ/4þcharge value of iron atoms. Refining the occupancy parametersof the oxygen atoms, only 81(2)% could be found. This couldbe a hint for a mainly 2þ/3þ oxidation state for the ironatoms, but it has to be taken into account that the error forthe occupancy parameter is difficult to calculate caused bythe high scattering power of the cations in the structure. Therefinement converged to reliability factors of RWP¼ 0.053and PP¼ 0.042 for the pattern with a goodness of fit¼ 1.01,a DurbaneWatson parameter of 1.92, and Bragg R-value of
:10.1016/j.solidstatesciences.2007.11.030

Fig. 3. Rietveld plot of (Ba0.5Sr0.5)(Fe0.8Zn0.2)O3�d. The observed (blue) and calculated (red) intensities together with the difference between the observed and
calculated pattern (grey) as well as the possible reflex position (tick marks) are given.
5A. Feldhoff et al. / Solid State Sciences xx (2008) 1e13
ARTICLE IN PRESS
0.007 for the perovskite structure. Further details could betaken from CSD-No. 418850 [40]. Additionally, the averagecrystal size was found to be 56(2) nm (LVol-IB).
3.2.2. The mixed carbonate (Ba0.5Sr0.5)CO3
Very detailed considerations on the structure of the arago-nite-type (Ba0.5Sr0.5)CO3 carbonate are given elsewhere [7].XRD pattern of the mixed carbonate indicates unit cell param-eters a¼ 0.62450 nm, b¼ 0.52020 nm, and c¼ 0.86420 nm inspace group Pnma (No. 62) which agrees well with data ac-cording to Ref. [16] but deviates slightly from values givenby us elsewhere [7]. However, regarding the stability of thecarbonate at the applied temperatures, an Ellingham diagramhas been examined which is based on calculations that arevalid for bulk phases [7]. For nanocrystalline powders, the in-fluence of the surface cannot be neglected, and the ThomsoneFreundlich equation [21] predicts a higher chemical potentialof carbon dioxide, mCO2
, with respect to bulk phases. Conse-quently, the decarbonation temperature will decrease withdecreasing particle size.
Thus, a pure (Ba0.5Sr0.5)CO3 powder with crystal sizesbelow 100 nm has been synthesized, and CO2 equilibriumpressures have been measured. In the temperature range of850e1000 �C, the CO2 pressure above the nano-sized carbon-ate increases from about 100 Pa to 2.3 kPa. Data points havebeen connected with a spline function, and within the experi-mental error, the experimental curve lies slightly above theestimation from the Ellingham diagram (Fig. 4a). Consideringthe corresponding chemical potential, mCO2
, each experimentaldata point has been put into the Ellingham diagram in Fig. 4bby squared points. Their positions deviate slightly to highervalues compared to the calculated mixed carbonate in bulkphase (dashed line) are interpolated by the respective solidline.
In contrast to the presentation in Ref. [7], the calculated El-lingham diagram in Fig. 4b gives directly the chemical poten-tial of carbon dioxide, mCO2
, in dependence of the temperature.
Please cite this article in press as: A. Feldhoff et al., Solid State Sci. (2008), doi
Different partial pressures of CO2 are considered as well asequilibrium values over mixtures of carbonates (BaCO3,SrCO3) and rocksalt-type oxides (BaO, SrO). The line thatpresents mCO2
above a mixture of (Ba0.5Sr0.5)CO3 and(Ba0.5Sr0.5)O is assumed to lie symmetrically between thoseof the simple carbonate/oxide mixtures, indicated by a dashedline.
As mentioned above, liberated CO2 can easily evaporatethrough the porous sponge-like body of the reaction product.As all experiments were done under ambient atmospheres, itis assumed that isobaric conditions apply; with the partialpressure of CO2 being that in air, pCO2
¼ 30 Pa. The carbonatewould thermally decompose if its oxidation forces a chemicalpotential of CO2 that is higher than in the surrounding atmo-sphere. Considering bulk (Ba0.5Sr0.5)CO3, a decompositiontemperature of 808 �C is read from Fig. 4b as the intersectionpoint of the ‘‘pCO2
in air’’ line with the respective carbonateline (dashed). Considering the experimental data points(square brackets), the line valid for the nano-sized carbonateis shifted up by approximately 4 kJ/mol (solid line) so thatthe decomposition temperature lies at about 790 �C. The anal-ysis indicates that the decarbonation temperature of the nano-sized carbonate is decreased by ca. 20 �C with respect to bulkcarbonate. But it is still approximately 40 �C higher than thehighest applied temperature of 750 �C, and thus stabilityconsiderations support the solid state reaction pathway thatis given in Eq. (1).
However, in powder reactions the reaction interface islarge; especially if nanoscale powders are considered. Thiscan lead to the liberation of large amounts of heat [23,24]and consequently to local overheating. Despite the moderateheating rate of 3 �C/min up to a nominal maximum tempera-ture of just 750 �C makes it unlikely that in any of the exper-iments discussed here, the decomposition temperature of thecarbonate (ca. 790 �C) has been exceeded. This is supportedalso by the fact that there have been observed in nanoscale re-actions neither BaO nor SrO nor (Ba0.5Sr0.5)O.
:10.1016/j.solidstatesciences.2007.11.030

Fig. 4. (a) Experimental and calculated equilibrium CO2 pressures above (Ba0.5Sr0.5)CO3 as a function of temperature, (b) chemical potential of CO2 versus tem-
perature plots for different partial pressures including equilibrium values above barium and strontium carbonates. Experimental data are added as squares. Cal-
culations have been made after thermodynamic data [22] with reference to standard conditions ðp0CO2¼ 101:3 kPaÞ.
Fig. 5. X-ray powder diffraction: taken from the synthesis of (Zn0.6Fe0.4)Fe2O4
(a) after 1 h at 700 �C, (b) after 10 h at 750 �C, (c) FeFe2O4 (magnetite), (d)
ZnFe2O4 (franklinite), (e) a-Fe2O3 (hematite).
6 A. Feldhoff et al. / Solid State Sciences xx (2008) 1e13
ARTICLE IN PRESS
Please cite this article in press as: A. Feldhoff et al., Solid State Sci. (2008), doi
Fig. 4b contains also mCO2plots for ZnCO3 and FeCO3 to
illustrate that a formation of these carbonates do not playany role in the solid state reaction scheme.
3.2.3. The complex spinel (Zn0.6Fe0.4)Fe2O4
To prove the formation of the (Zn0.6Fe0.4)Fe2O4 spinelduring the perovskite synthesis, the solegel method was
Fig. 6. Thermodynamic calculations for the system ZneFeeO under different
O2 partial pressures [22]. Free enthalpy of formation for the (Zn0.6Fe0.4)Fe2O4
spinel has been calculated in consideration of the activities according to
Ref. [26]. Standard free enthalpies of O2 versus temperature plots for different
partial pressures are shown with dashed lines in the range of 1e1012 Pa ðp0O2¼
101:3 kPaÞ. All reactions illustrated proceed under atmosphere conditions
ðpO2in air ¼ 21:3 kPaÞ.
:10.1016/j.solidstatesciences.2007.11.030

Fig. 7. Close-up X-ray powder diffraction of intermediates and perovskite in the 2q range between 22� and 34�. (a) Taken from the synthesis of (Ba0.5Sr0.5)CO3
after 10 h at 750 �C, (b) taken from the synthesis of (Zn0.6Fe0.4)Fe2O4 after 1 h at 700 �C, (cee) taken from the synthesis of (Ba0.5Sr0.5)(Fe0.8Zn0.2)O3�d after (c)
1 h at 700 �C, (d) additional 12 h at 700 �C, (e) additional 10 h at 750 �C. (fei) Assignment of diffraction lines for different phases: (f) aragonite-type
(Ba0.5Sr0.5)CO3 carbonate, (g) (Zn0.6Fe0.4)Fe2O4 spinel, (h) g-(Ba0.5Sr0.5)Fe2O4, (i) perovskite-type (Ba0.5Sr0.5)(Fe0.8Zn0.2)O3�d, (j) close-up of peaks related to
240 and 221 of (Ba1�xSrx)Fe2O4, (k) close-up of peaks 061 and 002 of (Ba1�xSrx)Fe2O4.
7A. Feldhoff et al. / Solid State Sciences xx (2008) 1e13
ARTICLE IN PRESS
performed without barium and strontium. After calcination for1 h at 700 �C the formation of a (Zn0.6Fe0.4)Fe2O4 spinel wasconfirmed by XRD measurements (Fig. 2b) and EDXS. Fig. 5a(1 h at 700 �C) shows details of the diffraction pattern in the 2q
range of 34e37.5�, in the vicinity of the most intense (311)spinel reflex. After heat treatment in air for additional 10 h
Table 2
Crystallographic data for g-(Ba0.5Sr0.5)Fe2O4
Atom Site x y z Occ
Ba 4(a) 0 0.1307 0.2500 0.5
Sr 4(a) 0 0.1307 0.2500 0.5
Ba 4(a) 0 0.6173 0.2270 0.5
Sr 4(a) 0 0.6173 0.2270 0.5
Fe 8(b) 0.2776 0.0424 0.7320 1
Fe 8(b) 0.2913 0.2803 0.7740 1
O 8(b) 0.2430 0.0370 0.4030 1
O 8(b) 0.2250 0.1230 0.9170 1
O 8(b) 0.2913 0.2090 0.4170 1
O 4(a) 0 0.4530 0.2260 1
O 4(a) 0 0.2800 0.2260 1
Space group Cmc21 (No. 36) with a¼ 0.8448 nm, b¼ 1.9050 nm,
c¼ 0.5390 nm (unit cell dimensions according to Ref. [17]).
Please cite this article in press as: A. Feldhoff et al., Solid State Sci. (2008), doi
at 750 �C, the (311) and (222) spinel reflexes shift by about0.14� to smaller diffraction angles 2q. That indicates an incor-poration of a larger ion like Zn2þ for Fe2þ (61 pm / 75 pm[25]) into the A site of the spinel structure. A slightly largershift in the diffraction angle 2q by about 0.16� is noticedbetween FeFe2O4 (Fig. 5c) and ZnFe2O4 (Fig. 5d) that corre-sponds to an increase of the unit cell dimension from 0.8394 to0.8442 nm. Additionally, another reflection occurs at 35.6�
(see Fig. 5b), which was identified with attention to comple-mental diffraction peaks in the 2q range of 20e60� (Fig. 2b)as belonging to a-Fe2O3 (hematite, Fig. 5e). In conclusion,the (Zn0.6Fe0.4)Fe2O4 spinel formed at 700 �C decomposesin the absence of (Ba0.5Sr0.5)CO3 carbonate at higher temper-atures to a spinel with ZnFe2O4 stoichiometry and Fe2O3 ashematite.
To check whether this conclusion is in agreement with ther-modynamics, calculations have been performed, the results ofwhich are displayed in Fig. 6. Free enthalpy of formation forthe (Zn0.6Fe0.4)Fe2O4 spinel has been calculated consideringthe activities according to Ref. [26]. Because the graph forDGR lies lower than that for O2 partial pressure in airðpO2
in air ¼ 21:228 kPaÞ, dashed line in Fig. 6, the oxidation
:10.1016/j.solidstatesciences.2007.11.030

Fig. 8. Transmission electron micrographs showing the formation of the (Ba1�xSrx)Fe2O4 phase between the ZnFe2O4 spinel and (Ba0.5Sr0.5)CO3 carbonate in the
aragonite modification. (a) Bright-field micrograph with indicated area of high-resolution TEM, of Fig. 9, (bec) location of the different particles illustrated by
energy-filtered transmission electron micrographs showing high elemental concentrations by bright contrast: (b) iron, (c) barium, (d) location of the different par-
ticles illustrated by energy-filtered transmission electron micrographs showing high elemental concentrations by different colours (blue¼ iron, green¼ barium).
8 A. Feldhoff et al. / Solid State Sciences xx (2008) 1e13
ARTICLE IN PRESS
of the (Zn0.6Fe0.4)Fe2O4 spinel to ZnFe2O4 and Fe2O3 takesplace at atmospheric conditions in the whole temperaturerange of 20e1300 �C. Due to the fact that all graphs inFig. 6 are below the ‘‘pO2
in air’’ line, these reactions proceedregarding thermodynamics. In the presence of zinc oxide, theiron spinel favours to form the (Zn0.6Fe0.4)Fe2O4 or ZnFe2O4
spinels, and in its absence hematite is formed. However, inpresence of zinc oxide, the reaction of hematite to ZnFe2O4
spinel is thermodynamically advantageous, too. Strictly speak-ing, these thermodynamic considerations are valid for bulkphases only and not for nanoscale powders. But with the con-templations that have been made in context of Fig. 4, all DGR
curves in Fig. 6 would be shifted slightly down to represent thesituation for nanopowders. Anyway, the relative stabilities ofthe different phases would not be affected.
Please cite this article in press as: A. Feldhoff et al., Solid State Sci. (2008), doi
Recapitulatory, the (Zn0.6Fe0.4)Fe2O4 spinel is not the moststable spinel in the ZneFeeO system due to its decompositionat elevated temperatures. Thus, it is essential that the reactiontowards the perovskite with the carbonate takes place immedi-ately after the formation of the (Zn0.6Fe0.4)Fe2O4 spinel.
3.2.4. Complex (Ba,Sr)-Fe oxide intermediatesAs investigated by XRD pattern, crystalline intermediates that
are formed during the synthesis process are (Zn0.6Fe0.4)Fe2O4
spinel and (Ba0.5Sr0.5)CO3 carbonate in the aragonite modifi-cation. Against our previous assumption, the final perovskitemight be formed directly between the spinel and the carbonate[7,8], we now deliver results that indicate a more complex re-action pathway. This is due to the consideration of quenchedspecimen that represents earlier intermediate stages in that
:10.1016/j.solidstatesciences.2007.11.030

Fig. 9. (a and b) High-resolution transmission electron micrographs as indicated in Fig. 8a. (c) Diffraction data via FFT related to ZnFe2O4 spinel. (d) Diffraction
data via FFT related to (BaxSr1�x)Fe2O4.
9A. Feldhoff et al. / Solid State Sciences xx (2008) 1e13
ARTICLE IN PRESS
the perovskite structure is not yet clearly developed comparedto Refs. [7,8]. Fig. 7 displays XRD patterns given in Fig. 2with special emphasize on the 2q range between 22� and35�. A first glance on the XRD pattern of Fig. 2d might leadto the conclusion the perovskite structure is already evidentin the intermediate powder. Against this, a detailed examina-tion of the XRD pattern in Fig. 7d indicates that a differentphase is formed in the first place. The XRD pattern of Fig. 7dcould be satisfactorily indexed by a mixed oxide, namely(Ba1�xSrx)Fe2O4. Oxides of this kind have been intensivelydiscussed by several authors in the past decades [17,27e31].These oxides can be regarded as stuffed tridymite structureswhich are build of six-membered rings of corner-sharingFeO4-tetrahedra while the arrangement of the tetrahedra cor-ners within the rings determine the crystal structure [27]. Be-cause of the particular arrangement of the FeO4-tetrahedrawithin these structures, a channel-like network is evident
Please cite this article in press as: A. Feldhoff et al., Solid State Sci. (2008), doi
which can be occupied by the larger Ba2þ (160 pm [25])and Sr2þ (144 pm [25]) ions, respectively. We found that theorthorhombic crystal structure of g-BaFe2O4 fits best to theobtained XRD pattern [26].
In order to index XRD pattern as well as HRTEM micro-graphs, the structure has been described in space groupCmc21 (No. 36), see Table 2. It differs from Bb21m given inRef. [17] by a permutation of the crystal axes. At this point,it has to be stressed, that the investigated phases are deter-mined within a mixture that contains at least three differentphases. Additionally, it should be considered that the idealstoichiometry of g-BaFe2O4 should not be found in the reac-tion sequence, due to the cation ratio that has been appliedin the reaction mixture. Thus, various stoichiometries like(Ba1�xSrx)Fe2O4 should be evident. The existence of crystalswith various, slightly different, lattice parameter can be con-cluded from Fig. 7j and k as many reflections for the same
:10.1016/j.solidstatesciences.2007.11.030

Fig. 10. (a) High-resolution transmission electron micrograph of contact zone of two (BaxSr1�x)Fe2O4 grains. (bed) Diffraction data via FFT related to grains as
indicated in (a).
10 A. Feldhoff et al. / Solid State Sciences xx (2008) 1e13
ARTICLE IN PRESS
plane are observed. This seems to be reasonable as similarstructures like (Ba0.5Sr0.5)Fe2O4 have been already described[28], and they show polymorphism [29]. In order to supportXRD findings, TEM bright-field experiments have beenconducted with powders as in the XRD pattern in Fig. 7d.Fig. 8 shows a TEM micrograph exhibiting the reactionzone between ZnFe2O4 spinel (i), the above mentioned(Ba1�xSrx)Fe2O4 phase (ii) and (Ba0.5Sr0.5)CO3 carbonate(iii). Energy-filtered TEM (EFTEM) micrographs of this par-ticle display the cation distributions by colours. Obviously,the inner core (i) contains no barium, whereas barium isevident in the border (ii) as well as in site (iii). Contrary tobarium, iron can be found in the inner core as well in the bor-der (ii) but not in site (iii). EFTEM investigations have beenconfirmed by quantitative EDXS of respective specimen areas.It has been found that the inner core (i) exhibits a stoichiometrylike ZnFe2O4, whereas no zinc can be found in the border (ii)
Please cite this article in press as: A. Feldhoff et al., Solid State Sci. (2008), doi
and in site (iii). Further proof for this supposition can be foundin Fig. 9a and b in which HRTEM micrographs of the contactzone between ZnFe2O4 and (Ba1�xSrx)Fe2O4 are displayed.Structure determinations have been conducted via two-dimen-sional fast Fourier transformation (FFT) of the correspondingareas (Fig. 9c and d). The indexed pattern in Fig. 9c and d givehint to an orientation relationship between spinel (c) and stuf-fed tridymite (d) of the following type: (0,2,�2)c k (0,�2,1)d
and [4,1,1]c k [1,1,2]d. These findings agree well with theobservations displayed in Figs. 5 and 6. Below 1400 �C, the(Zn0.6Fe0.4)Fe2O4 spinel structure tends to separate intoZnFe2O4 and Fe2O3 with hematite structure (Fig. 6). Takenthis into account, it can be concluded, that the (Ba1�xSrx)FeO4
phase has been grown at the expense of the Fe2O3 which is onereaction product of the spinel separation. In order to underlinethe assumption of the formation of a (Ba1�xSrx)Fe2O4 phase,several other particles have been investigated with respect to
:10.1016/j.solidstatesciences.2007.11.030

11A. Feldhoff et al. / Solid State Sciences xx (2008) 1e13
ARTICLE IN PRESS
this phase. Fig. 10a displays an HRTEM micrograph exhibit-ing two grains of the (Ba1�xSrx)Fe2O4 phase, but in differentorientation. As it can be seen from FFTs in Fig. 10bed, thegrain related to (b) is viewed along the [0,1,4] zone axis, whilegrain related to (d) is viewed along [3,2,4]. Thus, (�1,4,�1)b k(0,�2,3)d and [0,1,4]b k [3,2,4]d. Additionally, Fig. 10d showsan FFT of the contact zone as indicated in Fig 10c. Fig. 11displays an HRTEM micrograph of the same grain as inFig. 10d now viewed along the [2,1,2] zone axis instead of[3,2,4] (after tilting the sample holder). Summing up the abovefindings, we postulate a rather complicated reaction sequence.After formation of spinel and carbonate, the formation ofa (Ba1�xSrx)Fe2O4 phase is postulated. Considering that thespinel structure (B3O4) consists only of type-B cations (ac-cording to the perovskite terminology ABO3) it is not surpris-ing that structures like AB2O4 are evident which can beunderstood as intermediate compositions regarding the type-A cation concentration in the spinel and the perovskite. Afterprolonged reaction time, the diffusion processes, which haveto be studied in more detail, between ZnFe2O4 spinel andthe (Ba1�xSrx)Fe2O4 phase might finally lead to the perovskitestructure.
EEL spectra of the phases under consideration are given inFig. 12aed in the energy-loss range of 500e850 eV. Theseshow up O-K, Fe-L2,3, and Ba-M4,5 ionization edges. The rel-ative intensities of Fe-L2,3 and Ba-M4,5 white lines clearlyshow that the stuffed tridymite structure (Fig. 12b) containsmore iron relative to barium compared to the perovskite struc-ture (Fig. 12a). The oxygen K-edge reveals characteristic sig-natures of the different phases that are shown in more detail inFig. 12eeh. The O-K ELNES of Fig. 12a,c,d,e,g, and h corre-spond to fingerprints given in the literature for spinel [32,33],carbonate [34], and perovskite [35], respectively. The stuffedtridymite structure shows after a pronounced leading peaka peak doublet (arrows in Figs. 12b and f) and is in goodagreement with the spectral signature given in Ref. [36] forCaAl2O4 that is structurally related.
Fig. 11. (a) High-resolution transmission electron micrograph of (BaxSr1�x)Fe2O4 gr
Please cite this article in press as: A. Feldhoff et al., Solid State Sci. (2008), doi
4. Conclusions
It is evidenced that in the solegel based synthesis route em-ployed here, the cubic perovskite-type (Ba0.5Sr0.5)(Fe0.8Zn0.2)O3�d is formed in a nanoscale solid state reaction betweenfinely-dispersed crystalline intermediates, i.e. a (Ba0.5Sr0.5)CO3 carbonate and a (Zn0.6Fe0.4)Fe2O4 spinel. Obviously,the reaction pathway goes from cubic spinel over transientphases of orthorhombic stuffed tridymite-type finally to cubicperovskite-type. XRD and TEM snapshots on quenched sam-ples reveal some details of the intricate reaction mechanism onthe atomic scale, however, not all questions can be answeredsatisfactorily.
The technologically so important spinel/perovskite inter-faces or superstructures [37,38] might suggest that a simpletopotactic arrangement of both cubic structures, spinel andperovskite, with low lattice misfit could be expected in thesenanoscale solid state reactions. Our investigations make clearthat this is not the case. In the quenched specimens fromdifferent stages of the synthesis process, we may find even ad-ditional phases that could be different from the so far foundones. For instance in the analogous synthesis of a cobalt con-taining cubic perovskite-type oxide, (Ba0.5Sr0.5)(Co0.8Fe0.2)O3�d, tetragonally distorted perovskite phases are involved[9].
From a general point of view it is nebulous how the spinelstructure with FeO4 and ZnO4 tetrahedra and FeO6 octahedratransforms to stuffed tridymite structures with FeO4-tetrahedraand finally to a perovskite structure with FeO6 and ZnO6 octa-hedra. Zinc seems to be squeezed first into a ZnFe2O4 spineland then probably into ZnO what was seen in some quenchedspecimen [7]. Incorporation of zinc into the perovskite struc-ture occurs obviously late in the reaction sequence. At whichstage, and how, this proceeds is not understood. In addition,the stuffed tridimyite (Ba,Sr)-Fe2O4-type phases show poly-morphism [29] so that in very detail everything is undoubtedlyeven more intricate. And, in these technologically so important
ain as in Fig. 9d viewed along different zone axis. (b) Diffraction data via FFT.
:10.1016/j.solidstatesciences.2007.11.030
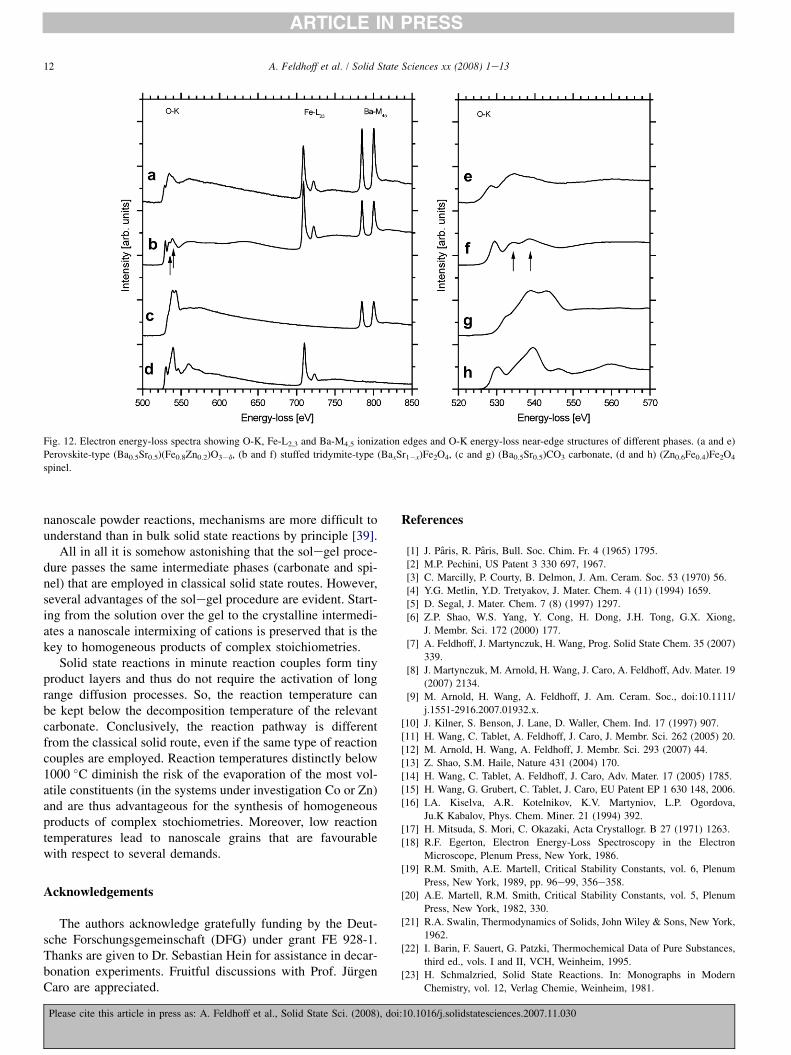
Fig. 12. Electron energy-loss spectra showing O-K, Fe-L2,3 and Ba-M4,5 ionization edges and O-K energy-loss near-edge structures of different phases. (a and e)
Perovskite-type (Ba0.5Sr0.5)(Fe0.8Zn0.2)O3�d, (b and f) stuffed tridymite-type (BaxSr1�x)Fe2O4, (c and g) (Ba0.5Sr0.5)CO3 carbonate, (d and h) (Zn0.6Fe0.4)Fe2O4
spinel.
12 A. Feldhoff et al. / Solid State Sciences xx (2008) 1e13
ARTICLE IN PRESS
nanoscale powder reactions, mechanisms are more difficult tounderstand than in bulk solid state reactions by principle [39].
All in all it is somehow astonishing that the solegel proce-dure passes the same intermediate phases (carbonate and spi-nel) that are employed in classical solid state routes. However,several advantages of the solegel procedure are evident. Start-ing from the solution over the gel to the crystalline intermedi-ates a nanoscale intermixing of cations is preserved that is thekey to homogeneous products of complex stoichiometries.
Solid state reactions in minute reaction couples form tinyproduct layers and thus do not require the activation of longrange diffusion processes. So, the reaction temperature canbe kept below the decomposition temperature of the relevantcarbonate. Conclusively, the reaction pathway is differentfrom the classical solid route, even if the same type of reactioncouples are employed. Reaction temperatures distinctly below1000 �C diminish the risk of the evaporation of the most vol-atile constituents (in the systems under investigation Co or Zn)and are thus advantageous for the synthesis of homogeneousproducts of complex stochiometries. Moreover, low reactiontemperatures lead to nanoscale grains that are favourablewith respect to several demands.
Acknowledgements
The authors acknowledge gratefully funding by the Deut-sche Forschungsgemeinschaft (DFG) under grant FE 928-1.Thanks are given to Dr. Sebastian Hein for assistance in decar-bonation experiments. Fruitful discussions with Prof. JurgenCaro are appreciated.
Please cite this article in press as: A. Feldhoff et al., Solid State Sci. (2008), doi
References
[1] J. Paris, R. Paris, Bull. Soc. Chim. Fr. 4 (1965) 1795.
[2] M.P. Pechini, US Patent 3 330 697, 1967.
[3] C. Marcilly, P. Courty, B. Delmon, J. Am. Ceram. Soc. 53 (1970) 56.
[4] Y.G. Metlin, Y.D. Tretyakov, J. Mater. Chem. 4 (11) (1994) 1659.
[5] D. Segal, J. Mater. Chem. 7 (8) (1997) 1297.
[6] Z.P. Shao, W.S. Yang, Y. Cong, H. Dong, J.H. Tong, G.X. Xiong,
J. Membr. Sci. 172 (2000) 177.
[7] A. Feldhoff, J. Martynczuk, H. Wang, Prog. Solid State Chem. 35 (2007)
339.
[8] J. Martynczuk, M. Arnold, H. Wang, J. Caro, A. Feldhoff, Adv. Mater. 19
(2007) 2134.
[9] M. Arnold, H. Wang, A. Feldhoff, J. Am. Ceram. Soc., doi:10.1111/
j.1551-2916.2007.01932.x.
[10] J. Kilner, S. Benson, J. Lane, D. Waller, Chem. Ind. 17 (1997) 907.
[11] H. Wang, C. Tablet, A. Feldhoff, J. Caro, J. Membr. Sci. 262 (2005) 20.
[12] M. Arnold, H. Wang, A. Feldhoff, J. Membr. Sci. 293 (2007) 44.
[13] Z. Shao, S.M. Haile, Nature 431 (2004) 170.
[14] H. Wang, C. Tablet, A. Feldhoff, J. Caro, Adv. Mater. 17 (2005) 1785.
[15] H. Wang, G. Grubert, C. Tablet, J. Caro, EU Patent EP 1 630 148, 2006.
[16] I.A. Kiselva, A.R. Kotelnikov, K.V. Martyniov, L.P. Ogordova,
Ju.K Kabalov, Phys. Chem. Miner. 21 (1994) 392.
[17] H. Mitsuda, S. Mori, C. Okazaki, Acta Crystallogr. B 27 (1971) 1263.
[18] R.F. Egerton, Electron Energy-Loss Spectroscopy in the Electron
Microscope, Plenum Press, New York, 1986.
[19] R.M. Smith, A.E. Martell, Critical Stability Constants, vol. 6, Plenum
Press, New York, 1989, pp. 96e99, 356e358.
[20] A.E. Martell, R.M. Smith, Critical Stability Constants, vol. 5, Plenum
Press, New York, 1982, 330.
[21] R.A. Swalin, Thermodynamics of Solids, John Wiley & Sons, New York,
1962.
[22] I. Barin, F. Sauert, G. Patzki, Thermochemical Data of Pure Substances,
third ed., vols. I and II, VCH, Weinheim, 1995.
[23] H. Schmalzried, Solid State Reactions. In: Monographs in Modern
Chemistry, vol. 12, Verlag Chemie, Weinheim, 1981.
:10.1016/j.solidstatesciences.2007.11.030

13A. Feldhoff et al. / Solid State Sciences xx (2008) 1e13
ARTICLE IN PRESS
[24] M.N. Rahaman, Ceramic Processing and Sintering, second ed. Marcel
Dekker, New York, 2003.
[25] R.D. Shannon, Acta Crystallogr. A 32 (1976) 751.
[26] A.A. Lykasov, V.V. D’yachuk, Inorg. Mater. 29 (1993) 786.
[27] W. Leib, H.K. Muller-Buschbaum, Z. Anorg. Allg. Chem. 538 (1986) 71.
[28] S. Meriani, G. Sloccari, Acta Crystallogr. B 26 (1970) 1184.
[29] S. Meriani, Acta Crystallogr. B 28 (1972) 1241.
[30] E. Lucchini, D. Minichelli, S. Meriani, Acta Crystallogr. B 29 (1973)
919.
[31] W. Horkner, H.K. Muller-Buschbaum, J. Inorg. Nucl. Chem. 38 (1976)
983.
[32] F.T. Docherty, A.J. Craven, D.W. McComb, J. Skakle, Ultramicroscopy
86 (2001) 273.
[33] C.C. Calvert, A. Brown, R. Brydson, J. Electron Spectrosc. Relat. Phe-
nom. 143 (2005) 173.
Please cite this article in press as: A. Feldhoff et al., Solid State Sci. (2008), doi
[34] J.L. Mansot, V. Golabkan, L. Romana, T. Cesaire, J. Microsc. 210 (2003)
110.
[35] A.S. Sefat, G. Amow, M.Y. Wu, G.A. Botton, J.E. Greendan, J. Solid
State Chem. 178 (2005) 1008.
[36] N. Jiang, J. Appl. Phys. 100 (2006) 13703.
[37] G. Chern, C. Cheng, J. Vac. Sci. Technol. A 17 (1999) 1097.
[38] H. Zheng, J. Wang, S.E. Lofland, Z. Ma, L. Mohaddes-Ardabili, T. Zhao,
L. Salamanca-Riba, S.R. Shinde, S.B. Ogale, F. Bai, D. Viehland, Y. Jia,
D.G. Schlom, M. Wuttig, A. Roytburd, R. Ramesh, Science 3003 (2004)
661.
[39] H. Schmalzried, Angew. Chem. 8 (1963) 353.
[40] Additional material to this paper can be ordered to the CSD-No. 418850,
names of the authors, and citations of the paper at the Fachinformations-
zentrum Karlsruhe, Gesellschaft fur wissenschaftlich-technische Infor-
mation mbH, D-76344 Eggenstein-Leopoldshafen, Germany.
:10.1016/j.solidstatesciences.2007.11.030