the solar array-induced disturbance of the hubble space
TRANSCRIPT

NASA Technical Paper 3556
The Solar Array-Induced Disturbanceof the Hubble Space TelescopePointing SystemC.L. Foster, M.L. Tinker, G.S. Nurre, W.A. Till
Marshall Space Flight Center • MSFC, Alabama
National Aeronautics and Space AdministrationMarshall Space Flight Center • MSFC, Alabama 35812
May 1995


TABLE OF CONTENTS
INTRODUCTION ..........................................................................................................................
DESCRIPTION OF ORIGINAL SOLAR ARRAY MECHANISMS ........................................
ONORBIT DEPLOYMENT SEQUENCE ANOMALIES ..........................................................
MANIFESTATION OF THE DISTURBANCE ..........................................................................
DISTURBANCE IDENTIFICATION AND CHARACTERIZATION ......................................
Further Description of Vehicle Disturbances ...................................................................Determination of Disturbance Source ...............................................................................
Thermal Analysis of Solar Array Booms ..........................................................................
Mechanisms of the Solar Array Disturbances .................................................................
Analytical Modeling of Transitional Disturbances ...........................................................
SOLUTIONS TO THE DISTURBANCE PROBLEM .................................................................
Control System Modifications ......................................................................................... ..
Solar Array Redesign .........................................................................................................
SUMMARY ....................................................................................................................................
REFERENCES ..............................................................................................................................
Page
1
2
4
6
7
8
8
13
16
18
21
2121
25
26
II glNEIwr 'ltllW"°°°
111

Figure
1.
2.
3.
4.
5.
6.
7.
8.
9.
10.
11.
12.
13.
14.
15.
16.
17.
18.
19.
20.
21.
22.
LISTOF ILLUSTRATIONS
Title
HST onorbit configuration ..............................................................................................
Solar cell blanket deployment .......................................................................................
Solar array boom actuator drive train ...........................................................................
Boom actuator mechanism ............................................................................................
Boom length compensation mechanism for original solar arrays ................................
HST shortly after release from shuttle orbiter .............................................................
Orbital day disturbance profile ......................................................................................
Orbital night disturbance profile ....................................................................................
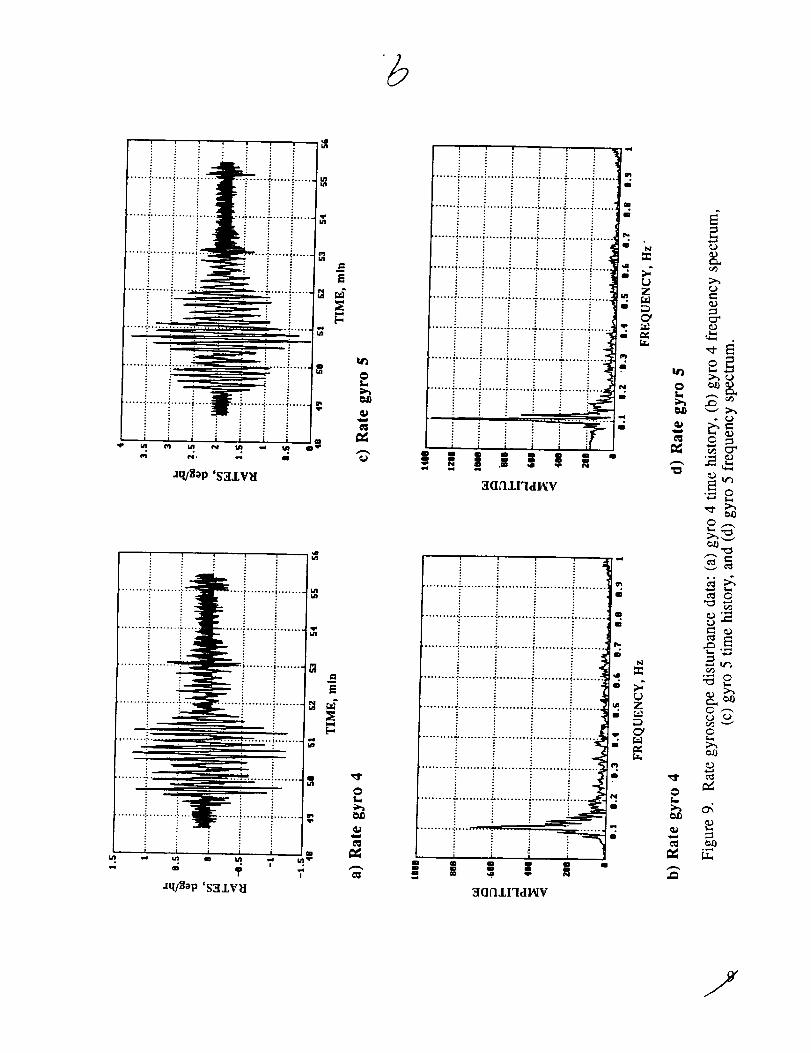
Rate gyroscope disturbance data: (a) gyro 4 time history, (b) gyro 4 frequency
spectrum, (c) gyro 5 time history, and (d) gyro 5 frequency spectrum .......................
Rate disturbances about (V1,V2,V3) axes for sunlight/eclipse transition ................
Vehicle disturbances about (V1,V2,V3) axes for eclipse/sunlight transition ...........
Orbital day vehicle rate disturbances ...........................................................................
Comparison of vehicle rates and control torques for V1 axis ......................................
Fundamental analytical bending modes of solar arrays ..............................................
Solar array boom cross section and radiative surface properties ...............................
Contact pressure variation with circumferential position ............................................
Predicted temperature profile for solar array booms ....................................................
Analytical orbital temperature gradient for booms ......................................................
Boom temperature gradient for eclipse/sunlight transition .........................................
Rate of change of temperature gradient for booms ......................................................
Solar array tip forces used in modeling of disturbances ..............................................
Response of telescope center of gravity due to solar array tip forces ........................
iv
Page
1
2
3
3
4
5
6
7
9
10
10
11
12
13
14
14
15
15
16
16
20
20

LIST OF ILLUSTRATIONS (Continued)
Figure
23.
24.
25.
26.
27.
28.
29.
Title
Frequency response about V2 axis for initial modified controller ...............................
Response about V2 for second modified controller ......................................................
Frequency response for final modified control system ................................................
Thermal shield for redesigned arrays in stowed and deployed configurations ...........
Reduction in boom thermal gradient due to addition of shields ...................................
Redesigned blanket tension assembly for solar arrays ...............................................
Simplified overall view of redesigned arrays ................................................................
Page
22
22
22
23
23
24
24
V

NOMENCLATURE
F
F(t)
I
K
M
q
R
TI, T2
X
o_
= external force vector, Ib
= vector of solar array tip forces, lb
= identity matrix
= stiffness matrix, lb/in
= mass matrix, lb-s2/in
= generalized displacement
= rigid body transformation matrix
= displacement transformation matrices
= displacement, in
= mode shape matrix
= matrix of damping ratios
= matrix of natural frequencies squared, 1/s 2
Subscripts and superscripts
b = boundary degrees of freedom
cg = center of gravity
q = generalized degrees of freedom
sa = solar arrays
sys = coupled telescope system
* = free-boundary and transformed modes
vi

TECHNICAL PAPER
THE SOLAR ARRAY-INDUCED DISTURBANCE OF THE
HUBBLE SPACE TELESCOPE POINTING SYSTEM
INTRODUCTION
The Hubble Space Telescope (HST) 1 was deployed from the remote manipulator system of
the space shuttle Discovery in a 332-nmi orbit on April 25, 1990. Within several orbits, it became
clear from observing real-time telemetry data that the pointing control system was experiencing
unexpectedly large disturbances that were most pronounced as the spacecraft entered or left Earth's
shadow. A concerted investigative analysis during the following weeks pointed to the solar arrays
as the source of the disturbance. The thermal/mechanical energy in the arrays was stored and
released in such a manner as to excite the primary modes of the arrays, and thus perturb the pointing
control system. The HST is shown in figure 1 and is normally operated so that the Sun is in the V1 to
V3 plane, confined to the angles shown. The solar arrays are oriented about V2 to point in the direc-
tion of the Sun. The European Space Agency (ESA) and British Aerospace provided the solar
arrays. The design is based on that of the flexible rolled-up solar array described in reference 2. The
other major parts of the HST are the optical telescope assembly made by Hughes Danbury Optical
Systems and the support systems module built by Lockheed Missiles and Space Company. This
paper begins with a section describing the solar arrays and their mechanisms, providing information
that is essential to understanding the disturbance phenomena. Next is a section that shows and
describes some of the flight data that illustrate the characteristics of the disturbance as it affects the
pointing control system. Following these introductory topics, the analysis of the disturbance and the
explanation of the phenomena are presented.
Solar
Array
Drive Primary Deployment
•..N(SAD) Mechanism (PDM)
_USolarCell
Blanket
V1
V2
Range of
Sun Angles135 °
V312.9m
Secondary
DeploymentMechanism
(SDM)
2.9m
Figure 1. HST onorbit configuration.

DESCRIPTION OF ORIGINAL SOLAR ARRAY MECHANISMS
The HST solar arrays consist of two identical wings. Each wing has two flexible solar cellblankets attached to a drum which rotates about a central spar tube or boom. The drum and spar tube
are parts of the secondary deployment mechanism, which was designed to provide structural support
of the solar arrays during launch and to deploy the blankets on orbit. For launch, the two blanketsand an embossed cushion were rolled tightly about the drum and locked in position. The boom was
secured to the forward shell and light shield of the HST by means of structural latches. On orbit, the
latches were released and the booms pivoted 90 ° by the primary deployment mechanism. The
secondary deployment mechanisms then deployed the blankets from the drums via spreader bars
attached to a pair of two-element storable tubular extendible member (BI-STEM) booms. As the
blankets were deployed, the cushion was taken up on a storage roller. The overall space telescope
configuration is shown in figure 1, and the solar array deployment is illustrated in figure 2. Reference3 gives a detailed description of the secondary deployment mechanism design and development.
BoomCassetteAssembly
Upper _ Deploying
__1 _ _ / -_ [ /"It/ Spreader
--"_J ,,._! ___/¢_._" EmbossedStru°Wage Cushion-
Figure 2. Solar cell blanket deployment.
The BI-STEM is made from thin strips of stainless steel formed into circular cross sections,which were flattened and stored on spools or cassettes within the mechanism. The elements were
rolled from the spools through specially shaped guides and nested together with the open seamsdiametrically opposed, forming the tubular structure of the boom. Two booms were deployed in
opposite directions from the actuator assembly as shown in figure 3. The secondary deployment
mechanism assembly includes both inboard and outboard actuators, mounted on the main spar on
either side of the drum. The actuator assemblies are connected via a torque tube, such that all four
booms could be driven by a motor located in the outboard end of the spar. The actuator assembly
includes limit switches on each boom that sensed a fully deployed or retracted condition; any switch
was capable of cutting off the drive motor when the limit of travel was reached. Figure 4 shows theactuator mechanism.
The spreader bars were attached to rails mounted at the tips of the BI-STEM's through asystem of steel tapes, rollers, tension springs, and linear potentiometers, which comprised the boom
length compensation mechanism. This system, along with a pair of negator springs which drove the
2

BI-STEMStorage Cassettes
Figure 3. Solar array boom actuator drive train.
Forward Guidance Rear Guidance
Outer Element
Inner Element Cassette
Figure 4.
Retract Limit Switch
Extend Limit Switch
Boom actuator mechanism.

drum, provided the blanket tension. It also compensated for small length differences among the four
booms, which could have occurred during deployment or retraction because of friction effects at the
guides or within the multiple layers of the rolled-up elements stored on the cassettes. The original
boom length compensation mechanism is illustrated in figure 5.
I
Spreader Primary StainlessBar Spring Steel Tape
7,
Tape LinearPotentiometer
Tape
r//A
solar Cell
Blanket
Boom
i |
r i
Figure 5. Boom length compensation mechanism for original solar arrays.
The drum rotates on the central spar tube on dry-lubricated ball bearings mounted in end
supports. The outboard bearing is free to slide axially to accommodate differential expansion
between the drum and the tube. The end support also includes a diaphragm section to limit bearing
axial loading should the sliding interface fail. For the original arrays, thermal expansion and
contraction of the blankets and booms were accommodated by small angle rotations of the drum.
Blanket tension was maintained by the constant torque negator springs.
During deployment, the spreader bars moved out along the compensator rails following thedrum lock release to a position where the tension of the linear springs in the compensation mecha-
nisms balanced the negator spring tension. If the booms were not synchronized during deployment,
the linear potentiometer and spring should have moved within the spreader bar as the attachment
bracket roller moved backward along the rail of the leading boom and the opposite roller moved for-
ward on the lagging boom. This action was designed to keep the spreader bar parallel to the drumthroughout the deployment, in order to maintain constant blanket tension. The four booms should
have extended until the limit switch of one boom was reached and the motor was cut off. During
ground testing of the secondary deployment mechanism, overall boom synchronization was within
approximately 1-in total among the four booms at the fully deployed position. After the motor
stopped, the spreader bars should have remained in equilibrium position on the rails.
ONORBIT DEPLOYMENT SEQUENCE ANOMALIES
The solar arrays were successfully deployed with the HST positioned above the orbiter cabin
and held by the remote manipulator system. There were a few minor anomalies encountered duringthe deployment sequence, which resulted in delays to the nominal timeline. The removal of the HST
4

from the orbiter cargo bay andits positioningin the appendagedeploymentattitude using the remotemanipulatorsystemwere completedwithout incident,but requiredapproximately30 min longer thanexpected. Completion of primary deployment system operations was also delayed by severalminutesbecauseof an anomaly in the positionswitch adjustments.A contingency procedure had tobe implemented to verify the final position of the solar array masts. The mechanisms had functioned
correctly, but the telemetry was ambiguous. As a result of these delays, subsequent appendagedeployment events had to be replanned in order to comply with the constraints on minimum time in
sunlight, time remaining in sunlight, and windows of uninterrupted communication.
The secondary deployment mechanism (SDM) operation for the +V2 solar array was com-
pleted with no anomalies. However, the -V2 SDM motor cut off immediately after the drum lock wasreleased, and telemetry indicated a blanket tension test failure. The SDM commands were sent
again, and the blankets deployed approximately 1.5 m before the motor was cut off again by the
blanket tension test. A visual check of the spreader bar position on the compensator rails verified
that the blanket tension was nominal. It was decided to bypass the blanket tension test, and the
-V2 deployment was completed successfully on the third try. Later, a failure investigation showed
that the tension test had shut down the SDM because of an intermittent open circuit in the -V2
upper blanket tension potentiometer. This potentiometer continued to give erratic readings, withchanges in the signal corresponding to the sunlit and eclipse periods of each orbit. Because there
was no corresponding change to the tension reading of the other blanket on the -V2 solar array, it is
possible that the problem was simply an electrical fault, unrelated to the disturbance phenomenon.
Photographs taken after release of the HST (fig. 6) indicate that the inboard boom of the
upper blanket on the -V2 array had a significant curvature, which resulted in a twist at the spreader
bar of as much as 12 ° out of the plane of the blankets. The possible relevance of this twisting to thevehicle disturbance phenomenon is discussed in a later section.
iii_,.̧...
Figure 6. HST shortly after release from shuttle orbiter.

MANIFESTATION OF THE DISTURBANCE
The pointing control system was designed to hold an image stable at the HST focal plane to0.007 arcsec (rms) for the duration of an observation, which varies from a few seconds to a few
hours. Consequently, careful attention was given to restricting the magnitude of internal dis-
turbances and to carefully characterizing those disturbances that appeared to be most threatening toobservations. In the case of the solar arrays, a disturbance level was specified for steady-state
operation that is consistent with the pointing requirements, and care was taken in designing HST
and solar array maneuver profiles to minimize the excitation of the solar array modes. Hence, the
phenomenon giving rise to the data in figures 7 and 8 was indeed a surprise. The two figures
together show attitude excursions of the line of sight of the HST for the day and night portions of two
noncontiguous orbits. The orientation of the solar arrays during these times was such that the plane
of the arrays was in the V2 to V3 plane.
The attitude data were derived from the rate gyro signals onboard the HST. The gyro data,
available every second, were integrated and resolved into the principal spacecraft coordinates.
Angular motion about V2 and V3 define the line of sight of the telescope and angular motion about
V 1 is roll about the line of sight. Figure 7 shows the attitude time history for the three axes for thedaylight portion of an orbit beginning with the transition from Earth's shadow (eclipse) to orbital
day. The effects of the disturbance associated with the transition are clearly evident with amplitudes
in V2 and V3 of approximately 0.1 arcsec. Later data showed disturbance amplitudes about V3 of 0.2
arcsec. The transition event lasted 4 to 5 min. Following the night/day transition, there was a series
of disturbances that persisted through most of the orbital day and that had amplitudes nearly as
large as those at the terminator. Then toward the end of the day, the disturbances waned and a quiet
! i i i , ,i Day i i i i i ! ::_ :
0.4= ...... ' ---'_ ........ _...... :..... "_..... " ..... ' ....... '........ _..... _...... _.... 1 _ ........ :........ -:.........i-....... _----_ ..... _ .... _ ...... _.... ..+-----_----'[
------I " ; " ; : ! _..... it .,4 t.._ : .... : _'J _-.,---._.
I • : ": : : : T-- _."r i- _ ! mr'It, r'---_: _ .... _....... _........ _...... _-.... 7--q ........
°
Vl o.o--
-0.4-
---t-tit----4 ........ _....... _......... - ........ -: ...... -- ....... :"........ "...... i.- .... _._-.a-. .... -| -_ .............,...... .....____......,.......,......,..... .... i--3.-lgi-_.._..._,.._ ..... _,.._ ..... 1_4 ...... j ..... .,t---_..-4 ..... -:.-----I _ ..... 4V2 0.0 - " -- . ' " ..::
.... :..... :....... :........ .--...... .--"..... "r....... :...... ."..... -=..... ="....... r'-" _"-'-
,,,, -3"__'+'-'"_. ...... 4.... _-:._--'"_ ...... t"+--_-'1
6
z 0.1
V3 0.0-.2"
-0.1-
...... "...... "...... ".......... '-"....... +"..... "' .... '-i.... 'i.... ---''...... "".... ''..... -;- .....
........_"......._"...... _'........t ...... _-'-¢ " "_...... ".... ÷.... -".............
................................................ •..... •..... .___. ..... :,::--:::::::::::::::::::::::::::::::::::::::::::::::::::::::::::::" "; ""-'_" " " "'" - " --: ...... _ .... .:':.---6"-:-i:-'_":;'-:"='k--'ll
..... ..............:......"P'I--'*_"'" :...... .'P...... ._..... _........ _......... _".... _----gl ._.......'-_'"-t."":'t ...... i...... i......_ ..... z..... :_
21.5 21.7 21.9 22.1 22.3 22.5 22.7
TIME, decimal hr
Figure 7. Orbital day disturbance profile.

i : L : : ; ; ,j
0.4= ........................:.........h........t...................J0.0-...........) i-0.4--_ ...........
i_i i l | i | 1
Z
0
VI
-- -4 _........ .-6----- , _ .........._ ,.........................
-]-....-.... i............i....,m._k-,l............4.-......._ ......._ ........-._ .........
V3
0.1 .::::::--_T.'::.-.. ............... "................. ,_, .......... ° .....
oo=-_'1---':"::'-':-- ........ : .............. "....."0. '.... :::::::::::::::::::::::::::::::
__---_"::::::::::::::::::::::::::::::::::
11.11 11.31
:::: ,. _. .t
::::_- .......... Z-........... -7-.......... $.........
::::::::::::::::::::::::::::::::::::::::::::::::::::::::::
11.51 11.71 11.
TIME, decimal hr
Figure 8. Orbital night disturbance profile.
91
period was seen for 8 to 10 min prior to entry into the Earth's shadow at 22.65 h. The transition to
darkness gave rise to another large attitude disturbance which showed larger amplitudes than the
night/day transition. Figure 8 shows the night portion of an earlier orbit. The first 14 min again
showed a quiet period just prior to entry into darkness at 11.34 h. At the day-to-night transition, alarge disturbance occurred with amplitudes in V2 and V3 in excess of 0.1 arcsec. The transition
event lasted from 3 to 4 min and was followed by a series of separate disturbances that persistedthrough the night.
These attitude time histories are representative of the dynamic behavior of the HST as was
seen on an orbit-to-orbit basis. In general, the transition disturbances were largest; the dis-turbances subsided completely during the latter part of the day; and the night was quieter than the
early day. The pointing disruptions associated with these disturbances were of sufficient magnitudeto compromise many of the science goals of the HST.
DISTURBANCE IDENTIFICATION AND CHARACTERIZATION
Investigation of the HST vibration problem was twofold. First, the source of the vehicle dis-
turbance was identified. This was accomplished by comparison of the characteristics of possible
excitation sources to the onorbit telemetry data describing the disturbances. Next, dynamic
mathematical models of the telescope were assembled or developed in attempts to analyticallycharacterize the disturbances and their effects on the vehicle motion. In the following sections, the
process of isolating the source of the transitional and orbital day disturbances and the procedure ofanalytically modeling the transitional disturbances are described. Results of mathematical modelsare used to verify the identification of the disturbances.

Further Description of Vehicle Disturbances
Detailed examination of the telemetry data (fig. 9) for the rate gyro assembly revealed a
beating phenomenon, particularly for rate gyro 5. This beating behavior provided an early indication
that either two disturbances with closely spaced frequencies were exciting the telescope or that the
source of excitation was affecting two closely spaced modes of the structure. These oscillations were
estimated to be two to three orders of magnitude greater than the allowable jitter for the telescope,
obviously large enough to prevent focusing on distant objects. The data shown in figure 9
corresponded to an orbital day-to-night transition and was reproduced from reference 4.
Also in figure 9, the frequency spectra corresponding to the disturbance time histories are
shown. Although these spectra represent a single average of raw telemetry data without windowingor bias removal, the dominant frequencies can be observed. It is seen that the disturbance occurred
at approximately 0.1 Hz. Rate gyro 5 showed a second large frequency component near 0.12 Hz,
verifying the beating phenomena shown in the time history data. These frequency components of the
disturbance occurring during transition to eclipse were also obtained in an independent data analysis
as described in reference 5. For convenience in the analysis, the vehicle rotations were transformed
to the (V1,V2,V3) axes of the telescope (fig. 1). The vehicle rates about these axes for one sun-
light/eclipse transition are shown in figure 10 to illustrate the onset of disturbance at the time of
transition and the subsequent damping of the oscillations. Analysis of the frequency content of the(V1,V2,V3) oscillations showed dominant frequencies of approximately 0.1 Hz for the V1 and V2
axes and 0.6 Hz for the V3 axis. The 0.1 Hz component was also well-defined for the V3 axis.
Disturbances occurring during the orbital days and eclipse/sunlight transitions were observedto have considerably different characteristics than the sunlight/eclipse disturbances. In figure 11, the
vehicle rates about the (V1,V2,V3) axes are shown for one eclipse/sunlight transition and the fol-
lowing period of approximately 18 min. The initial disturbance occurring near decimal hour 13.63 was
followed by a quiet period of about 6 rain, then another series of oscillations of slightly lower
amplitude than the initial disturbance. At the left of figure 11 is a large spike corresponding to a
vehicle maneuver. Oscillations occurring during the quiescent orbital day (well past the eclipse-to-
sunlight transition) are shown in figure 12. These disturbances exhibited damping and a well-defined
decay pattern; the beating behavior was less prominent than for the transitional vibrations. The
smooth decay of the oscillations in figure 12 could indicate that one excitation source was primarily
responsible for the quiescent day disturbances. For both types of disturbances discussed in thisparagraph, prominent frequencies were again 0.1 Hz for the V1 and V2 axes and 0.6 Hz for the V3axis.
Determination of Disturbance Source
Several potential sources of the HST disturbances were identified in reference 5 and by other
investigators. These mechanisms included the reaction wheel assemblies, data recorders, fine
guidance sensors, high gain antennas, aperture door, magnetic torquers, thermal creak in the support
systems module, the pointing control system, and the solar arrays. All of the potential sources wereinvestigated systematically in view of the telemetry data which showed that the disturbances
occurred mainly near 0.1 Hz.
The reaction wheel assemblies, data recorders, and fine guidance sensors all operate at very
low force and moment levels (m-lb and m-in-lb) and frequencies considerably higher than
0.1 Hz. The reaction wheel assemblies have one harmonic at 0.35 Hz, but the jitter test of the tele-
scope showed that this harmonic does not significantly excite the vehicle. The major response of the
8
p.S
............................... 0 ................... qP
-q
aq/_a,p '$31V_I 3(l_J.,]'][(l I_V
0L,,.,
OJO
<mr,
......... .:.......... .:.......... _.......... _..........
.t
q
Q
m.m
p.
o
qP
i
:: " -7 "i....... i..... -:
"- " : ! .'- "
3(ID_£I1di_Y
L)Z
r_
Zr_
ira
0t..,
t.,
_ta
eo
¢0
Or'
._._
I::_ exO
¢mo ,,,,,,_
t.r.,

1.,.c:
V1
0.5-
0.0_
-o.5
: ; ; ; ; ; ; ; ;._.; ; ;....._....._...._....._........_,....,...._.__._._...._.....;= .....
:::::_:::::_:::::_:::::_:::::_:::::_:::::_:_._..._;_]:K_._.`.:_.._`.::::_::::_::_::::_::::_::::_::::_::::±::::±_::_:::_::::_:::::'- ' - - ' --' ; - '- ' -' ' - _-
.....iillli..... ..... ..... ..... ..... ....... _----.----t----_----_----÷----_.....
¢,,f V2
.<
- .....i.....i.....i.....i.....i.....i--4.....i--4--t--:Tit:4...... -.-....L-.._-...'.-.._-..-_-..--..-.-....---..'.--:"--4.....O.2....._.....;.....;.....;.....;.....;.....;.....;...._,_.._.._..._---._.1_.-,_--..*...._....;.-..*....*..--_-.--*-.--*.--._.....
0.0-0.2__...;_.._ ....
-0.4 ...... ;.....;.....;.....;.....;.....;.....;.....;-.---;..... ;........ ,....._-----;-----;-----;---_-----_------_-----_--_------_-----_.....
V3
fir ---3 ..... ; ..... " ..... :..... : ..... ; ..... ;..... : ..... ;-----; .... -,'1.• .... ;..... J--- --g--..-'--.. '.:--...-- .-...:-....--.....J-' --.o*....._' .....:......J.' .....__.,.-_ .....,.....,.....,.....,.....,.....,.....,....., ,..=_, ....,.___._., _ _ ....._ ,....0.4 _iiiii!iiiiiiiiiiiiiEiiiii?!Eiii!i_ii!iiiiiii:E;:/i_[_.:i:=._iE.i7i:_iiii1i5:U_:_:ii_ii.:_::.E_F::_::::
::::::::::::::::::::::::::::::::::::::::::::::: --- ,:.. .... ::::::::::::::::::::::::::::::::::::::::::::::::/_/'tV.V ........................ ._..................
20:" =======================================================
vev ......... , - , I - I - | - i - i . i I . t ! . | i I - ! -
19.55 19.59 19.63 19.67 19.71 19.75
TIME, decimal hr
Figure 10. Rate disturbances about (V1,V2,V3) axes for sunlight/eclipse transition.
4.0
t_
V12.0 2
_
0.0-=
-2.0 -i...................i......... i
•4 _[--t_ ...................... , ....... _---r ....... , .......... _ - I.........
U. ....................... : .......... 1,.................. .l, ................. • .............,,,,_iilli!i,...,...........,._..--_,._: .........-........-,.-.,-..:_-w_--_.__............................. _IM, .....
0.8:_:=::=:::::=::i ::-':rl_!:: ...... I " " "I "
r._ v2
[...,<
0.4 -._--_...... ;.... .-,_-....... 4 ; ; ................ 4•"-_--4{" ................. t .... tdh*Ih'--*,H.-,----_ _ ,4. ................ -_
ii! ........- ...... .............-it.o.8 iiiii--.:!iiii-_ii_i_iii!iii!iiti_iiiii=--_::=:=-:i ! :====:13.5 13.6 13.7 13.8 13.9 14.0
TIME, decimal hr
Figure 11. Vehicle disturbances about (V1,V2,V3) axes for eclipse/sunlight transition.
10

t_
2.
V1 o. yvv,...... -, ............. '--v|YiYV
O. 0 100. 200. 300. 400. 500. 600. 700. 000. gO0.
2o
V2 o. "' ........"'"-' ............. ,V,,,"'.................................Ilm..rllvVV,V,,vvv- ..... IlYlYlYV'" ......... - • ......... "" .........
E,-,-2." 0.0 I00. 200. 300. 400. 500. 600. 700. 000. gO0.
2.
-2.0.0 I00. 200. 300. 400. 500. 600. 700. 000. go0.
TIME, s
Figure 12. Orbital day vehicle rate disturbances.
data recorders occurs at 1.4 Hz at very low disturbance levels, while the fine guidance sensors have
no output below 1 Hz. In addition, the vehicle disturbances were observed whether or not the fine
guidance sensors were in operation. Based on these findings, it was concluded that none of the three
mechanisms discussed in this paragraph could have caused the disturbances.
Boom bending modes of the high gain antennas occur between 0.4 to 1.0 Hz and can only be
excited when the telescope is oriented with the -V1 axis into the Sun (fig. 1). In addition, there wasno correlation between the disturbances and movement of the antenna gimbals. The aperture door
and magnetic torquers both have consistent responses during both transient and nominal conditions.Therefore, none of these mechanisms could have contributed unusual excitations during the dis-
turbances.
Thermal creak is a phenomenon where energy that builds up in tight joints due to thermal
expansion or contraction is suddenly released as friction force. 5 This phenomenon has a broadband
frequency response with most of the energy occurring in the high frequency region (50 to 100 Hz).
For thermal creak in the support systems module to excite a 0.1-Hz oscillation, it should have also
excited all the low-frequency modes of the module. Since this was not observed in the telemetrydata, it was concluded that thermal creak in the support systems module did not cause the vehicledisturbances.
Two remaining mechanisms were considered as possible sources of the vehicle rate dis-
turbances: the pointing control system and the solar arrays. Since the control system actively alters
the vehicle rotation rates throughout the orbit, 5 it was thought that the controller could cause theoscillations. However, the time histories in figure 13 for the vehicle rates and the total system torque
11

show that the control torquesalwaysoppose and lag behind the vehicle rates. Therefore, the control
system could not have induced the disturbances. 6 However, since the controller had a minimum in its
gain margin at about 0.1 Hz, 5 it appears that the control system in its nominal configuration was
unable to adequately damp the vehicle disturbances.
By the systematic investigation and process of elimination described in this section, it wasconcluded that the solar arrays were the source of the vehicle rate disturbances. The evidence sup-
porting this conclusion was strong: (1) the fundamental bending modes of the arrays were predicted 7 to be near 0.1 Hz (fig. 14); (2) the beating phenomena observed in the oscillation time
histories could be explained in terms of slight stiffness variations between the two arrays; and (3)
the highly flexible arrays were the most logical sources of disturbance for the orbital transitions
where large thermal gradients were built up between the hot and cool surfaces of the spacecraft. Inaddition, the observed rotations of the vehicle changed in direct correlation to changes in solar array
orientation. 5
To identify possible mechanisms of the solar arrays causing the disturbances, it was first
necessary to determine the thermal characteristics of the arrays. It was recognized that the steel
deploying booms (fig. 2) governed the array deflections due to temperature gradients. Modeling ofthe booms and calculation of the thermal gradient across them for an eclipse/sunlight transition aredescribed in the next section.
L.
m-
2.
1.
Vl o.
45. 50. 55 • 60. 05 •
0.2
0.1
Z
_._ o.Vl
-.2
[-
J /45. 50. 55. 80. 85.
TIME, s
Figure 13. Comparison of vehicle rates and control torques for V1 axis.
12

a) .0857 Hz b) .0866 Hz
Figure 14. Fundamentalanalyticalbendingmodesof solar arrays.
Thermal Analysis of Solar Array Booms
The BI-STEM booms have low mass and, in the original arrays, experienced considerable
thermal excursions. To assess the deflections of the booms induced by thermal gradients, analyses
were performed to determine their temperature response. During the course of an orbit, the booms
were subjected to time-varying heat rates due to changes in vehicle position and the transitions to
and from orbital eclipse. These eclipse transitions contributed the largest variation in heat rates andwere of particular interest. Further, the vehicle's inertial orientation, with one side of the booms
always oriented toward the Sun, inherently caused orbital heating to be concentrated on that side.
As stated in the description of the solar array mechanisms, each array wing has four booms,
two per blanket. When each wing was deployed, the booms for one blanket had seams orientedtoward the Sun, while the booms for the other blanket had seams oriented away from the Sun. Para-
metric studies 8 showed that the worst-case heating occurred with the seams oriented away from the
Sun. To determine the temperature response of the booms, a finite-difference model of a boom cross
section was developed as described in reference 9. The inner and outer elements or sleeves were
both represented by 11 nodes, with each node corresponding to 30 ° of arc. A cross section of the
boom is shown in figure 15 with the radiative surface properties used. Heat rates were calculated
based on a 330-nmi orbit, 0 '_ beta angle, and nominal flux values. The model incorporated bothtemperature-dependent thermal conductivity and capacitance. Analyses showed the gradient in the
booms to be strongly dependent on the heat transfer coefficients assumed between the inner and
outer sleeves. Since these coefficients are dependent upon contact pressure between the sleeves,
estimated contact pressures were factored into the model. Figure 16 shows the estimated contact
pressure between the sleeves as a function of circumferential position. The average pressure,
0.074 lb/in 2, was equated to a heat transfer coefficient of 2.5 Btu/h-ft2-°F. The specific coefficients
were then varied in proportion to the pressure, with the linear equivalent radiation coupling as alower bound. 9
13

seam = 30° (2 places)
Each BI-STEM element is
2.5" x .005' and is divided
into 11 equal nodes.
Worst .case , _ '_a/F.=.391.13
ceFigure 15. properties.
0.0 * t , i1 2 3 4 5
NODAL POSITION
Figure 16. Contact pressure variation with circumferential position.
In thermal analyses of low-Earth-orbit spacecraft, the solar heat rates are often treated as
step functions at the terminators. In actuality, the penumbra moderates the solar influence during the
eclipse transitions. With the previously described orbit parameters, the telescope encounters an
approximate 17-s penumbra (8.5 s both entering and leaving the eclipse). For these analyses, the
penumbra effect was incorporated into the model by linearly ramping the solar heating over the 8.5-s
periods. The 0 ° beta angle gave the shortest penumbra period and, consequently, produced the worst
case in terms of how rapidly the gradient is established.
The resulting temperature profile from the analysis for the hottest and coolest areas of the
boom cross section is shown in figure 17. These areas corresponded to those directly facing the solar
flux, and the portion of the inner sleeve exposed by the seam in the outer sleeve, respectively. The
14

temperaturegradient, regardedhere as the difference in thesetemperatureextremes, is shown infigure 18. The orbital position where the vehicle was just entering the Sun produced the largestgradient,near30 °C, and a more detailed profile is shown in figure 19. This detailed view shows that
a 20 °C gradient was established quickly, after only 30 s of exposure to the Sun. In addition, it is
observed that the gradient approximated a quarter-sine function. The rate at which the gradient was
changing was dynamically more significant (fig. 20). It is noted that figures 15 to 20 were reproducedfrom reference 9.
"°I140
/,oor// \
_ so
_ 6o
_ 40
0 1000 2000 3000 4000 5000 6000 7000
TIME, s
Figure 17. Predicted temperature profile for solar array booms.
" 25r_
Z 20
eer_r_ 15r_km
lO
5t_ee
o.
0
-5
-11o
Figure 18.
2obo ' _oo ' 6o'00 'TIME, s
8000
Analytical orbital temperature gradient for booms.
15

o
r_
Zr_
r_
[-
r_e.
[-
Figure
3O
25
20
15
10
5
0
-5 i i i i i i i i 1 i
3820 3840 3860 3880 3900 3920
TIME, s
19. Boom temperature gradient for eclipse/sunlight transition.
t-
ee
[-
r_
[-
1.1
0.9
0.7
0.5
0.3
0.1
-0.13820
Figure 20.
' 3_i40 ' 3_860 ' 3880 ' 3900 ' 3_20
TIME, S
Rate of change of temperature gradient for booms.
Mechanisms of the Solar Array Disturbances
In order to identify possible solar array mechanisms causing the telescope oscillations, theoriginal array geometry was studied in detail. Several geometry characteristics are important toundersthnding potential sources of vibration. As stated previously, the metal booms used to deployand support the array blankets governed the thermally induced deflections. These booms haveseams that were oriented toward the Sun for two arrays and away from the Sun for the other arrays.
16

Therefore, the thermal gradients were greater for the arrays with boom seams oriented away from
the Sun, and the arrays had unequal and likely out-of-phase deflections. Early in the investigation, it
was thought that these unequal deflections could have caused the observed oscillations; however,
continued study showed that this is unlikely.
Another geometry feature of importance is the offset between the booms and the base of each
blanket, as shown in figure 2. Due to this offset and the tension in the blankets, two arrays were
pulled toward the Sun and the other arrays were pulled away from the Sun. It was thought that thethermal stresses induced during orbital transitions could have caused sudden crossover or "snap
through" of the arrays and, thus, could have initiated the vehicle oscillations. However, previous
analysislO 11 showed that a sudden "snap through" of the arrays could not have occurred, but that a
smooth crossover or change of curvature was possible. The gradual nature of this crossover
precluded the possibility of it causing the disturbances.
Two mechanisms that were considered most likely to cause the vehicle disturbances, espe-
cially the orbital day oscillations, were the solar array drums and spreader bars. The drums are
located at the bases of the array blankets (fig. 2) and, in the original design, released or retracted the
arrays to maintain constant blanket tension during thermal expansion or contraction. According to
the ESA, stick/slip effects in the drums due to dry friction could have created high frequency inplane
blanket modes reacting against the telescope through an interactive torque. This torque could have
triggered the 0.1-Hz bending modes of the arrays. The spreader bars are located at the ends of thearrays, as shown in figures 2 and 5 for the original design. These mechanisms were originally
designed to maintain uniform tension across the blankets, and to move only when something
occurred to upset the uniform stress distribution. Soon after release of the telescope from the remote
manipulator system, differential bending or twisting of the upper blanket on the -V2 array was
observed (fig. 6). It is possible that this twisting could have caused the spreader bar to experience
stick/slip motion on the compensator rails (fig. 5) and, thus, to initiate the disturbances, particularly
during the orbital day. The deployment sequence anomalies described previously provided additional
evidence that the -V2 array was the source of the orbital day disturbances.
In addition to investigating unusual mechanisms or off-nominal behavior as possible causes
of the oscillations, it was also considered whether nominal buildup of thermal gradients during
transitions could have initiated vibration. Early studies predicted a slow buildup of the thermal
gradients, occurring over a period of 300 s, such that significant dynamic effects could not beobserved. However, the analysis described in the previous section (fig. 19) showed that the primary
portion of the buildup occurred in 50 to 60 s, quickly enough to excite the solar array bending modes.
Further, a static analysis of nominal thermal gradients in the solar arrays showed that torques
consistent with telemetry data could be induced on the vehicle by application of a 10-in tip deflection.
Such a tip deflection could be caused by the thermal gradients that occurred across the array booms.
Detailed dynamic analyses of the transition disturbances were also performed and results compared
to telemetry data. Modeling of those events is described in the following section.
In summary of the mechanisms discussed in this section, consensus was developed among
the investigators that the transitional disturbances most likely occurred due to nominal thermalgradients in the solar arrays, and that the orbital day disturbances probably occurred due to stick/slip
behavior of the spreader bars or drums. Comparison of the orbital day telemetry data and results of
solar array ground tests provided further evidence that both the spreader bars and the drums were
possible sources of the orbital day oscillations. Drum or spreader bar stick/slip behavior during the
orbital day is also thought to have had a residual effect on the night disturbances.
17

Analytical Modeling of Transitional Disturbances
Although it was realized that analytical models could not prove or disprove the theories con-cerning the origin of the orbital day disturbances, it was also recognized that analysis could verify or
disprove the theorized source of transitional disturbances. In this section, open-loop dynamic analy-
ses of the nominal thermal gradient buildup during an eclipse/sunlight transition and the resulting
motion of the space telescope are described.
Using the Craig-Bampton method, 12 the equations of motion for the +V2 and -V2 solar
arrays were written in reduced form, as shown in equation (1):
[Msa] (qb)sa+ [gsa] (qblsa--[_sa]T(FSlsa '(1)
and coupled with the equations of motion for a rigid telescope body:
[Mc 8] {2c s} = {Fog} (2)
The subscript b indicates forces, accelerations, and displacements corresponding to physical bound-
ary degrees of freedom, and the subscript q corresponds to generalized degrees of freedom. In
equation (1), dPs a represents the solar array mode shape matrix. The open-loop coupled dynamic
equations were written in the form:
(3)
which allows calculation of the telescope cg response due to forces applied to the solar arrays. In thisformulation, the system modal matrix is given by:
(4)
where
[dpcg ] = [T1] [CD_ys] , (5)
[dPsal = [¢sa] [T2] [¢_ys] (6)
The transformation matrices in equations (5) and (6) are defined in the expressions for the
component displacements in terms of the coupled system displacements:
,xc,, (7)
18

(8)
and the modal matrix _sys comes from an eigenvalue solution of the free-free coupled equations of
motion. Finally, the modified modal matrix _sa in equation (6) is given by:
[_s*al = [Rsa] T [_sa] r ([Rsa] r)-l (9)
where the matrix Rsa defines the rigid-body transformation from the solar array boundaries to the
space telescope cg.
To simulate the dynamics of an eclipse/sunlight transition, a set of equivalent solar array tip
forces 5 (corresponding to a nominal 28 °C thermal gradient) was used in equation (3). As shown in
figure 2 l, the gradient and the tip forces were assumed to build up over a 60-s period. It is noted that
the assumed tip forces are quarter-sine functions. Refined thermal analyses discussed in the previ-ous section and onorbit data showed that the actual solar array temperature/time variations were
close to the assumed functions. Using a 10-percent difference in the first natural frequencies for the
+V2 and -V2 arrays, and the equivalent tip forces described in figure 21, the rotational rates of thevehicle were calculated using Eqs. (10) and (11):
[11 {q} + [2_] {g/} + [0921 {q} = [_,y_l r F(t) , (10)
£Cc8\=
"rsaJ [_sys] (<t} ,(11)
where the mass and stiffness matrices are shown as described in reference 12, and (is the assumed
damping coefficient. The cg rotation rates .tc8 are shown in figure 22 for the V2 and V3 axes.
Response about the V1 axis was approximately two orders of magnitude smaller than about V2 or
V3, and smaller than onorbit V1 disturbances, due to orientation of solar array tip forces along V1. In
orbit, the forcing functions likely had significant inplane components not accounted for in the analysis.
Vehicle rates computed as described in reference 5 showed some of the characteristics of the
onorbit data, such as the 0.1-Hz frequency and the "beating" behavior, and the maximum ampli-tudes were of the right order of magnitude. Analyses by NASA and ESA investigators for a different
array orientation agreed with these results, providing a consensus that the orbital transition
disturbances were caused primarily by normal buildup or release of thermal gradients. While these
were open-loop simulations of the transition dynamics, it was previously concluded that the control
system could not have initiated the disturbances. Thus, the results were conclusive enough to verifythe source of transitional disturbances. It is noted that a later paper, reference 13, though not
addressing the dynamic interaction of solar arrays and the telescope body, is of interest due to its
detailed treatment of thermally induced vibrations of a cantilever HST solar array model.
19

2" 0 ....0.0 .0 40.0 60.0 8().0 160.0 !
120.0
TIME, s
Figure 21. Solar array tip forces used in modeling of disturbances.
O
lllIl
...... ..: ...... J ...... l ...... 1
o0
I
o.o too.o 200.0 -_oo.o 400.0 soo.o 6oo.o o.o too.o 200.0 soo.o 400.0 500.0
TIME, s TIME, s
Figure 22. Response of telescope center of gravity due to solar array tip forces.
600.0
20

SOLUTIONS TO THE DISTURBANCE PROBLEM
Although the purpose of this paper is to describe the characteristics and the sources of the
HST disturbances, a brief discussion of solutions to the problem is presented for completeness. With
the determination that the pointing control system disturbances were caused by solar array
dynamics, including normal boom vibration due to thermal gradients as well as possible stick/slip
behavior of the drums and spreader bars, an extensive 2-year effort was undertaken to modify the
controller to attenuate the disturbances to tolerable levels. In addition, redesign of the solar arrayswas initiated in an attempt to eliminate the source of disturbances.
Control System Modifications
The first approach considered was to redesign the controller through flight software modifica-tions that could be uplinked to the HST onorbit. Chronological development of these control law
changes is described in detail in reference 14. The design approach consisted of three phases:
(1) initially implement a compensator to attenuate the 0.1-Hz solar array out-of-plane bending
disturbances, (2) perform an onorbit transfer function test to help provide an accurate dynamic modelof telescope flexible body dynamics, and (3) implement a final compensator to attenuate the
remaining disturbances, particularly those due to 0.6-Hz solar array in-plane modes.
Phases 1 and 3 were fully implemented, while an onorbit transfer function test was partially
completed. 15 The limited set of measured transfer functions was useful, however, in design of the
final or phase 3 compensator. In addition to the initial compensator, a second phase 1 controller was
designed having similar attenuation characteristics but being easier to implement. 14 Based upon the
success of the second phase 1 compensator in attenuating the 0.1-Hz disturbance, the final com-
pensator was a design that improved the phase 1 controller to allow attenuation of the 0.6-Hz dis-turbance.
Flight testing verified the predicted characteristics of the redesigned control system. Theinitial phase 1 controller virtually eliminated the 0.1-Hz disturbance (fig. 23), but showed
undesirable limit cycle behavior under some conditions. Testin 8 of the second phase 1 compensator
showed improved performance, with excessive line-of-sight jitter occurring only during orbital day-
night transitions (terminator crossings). As seen in figure 24, the higher frequency 0.6 Hz
disturbance still presented difficulty. Finally, the flight test of the phase 3 or final compensator
demonstrated the success of the pointing control system changes by reducing the 0.6-Hz
disturbance as shown in figure 25. Dramatic improvements in line-of-sight jitter problems wereachieved, making science operations successful about 95 percent of the time. It may be concluded
that changes in the controller were successful in attenuating disturbances to tolerable levels until
modified solar arrays could be installed during the HST refurbishment mission. Redesign of the
arrays is briefly discussed in the following section.
Solar Array Redesign
As described in previous sections of this paper, it was determined that orbital transition dis-
turbances likely occurred in response to normal buildup or release of thermal gradients in the
BI-STEM booms. Thus, one goal of the redesign effort was to reduce the rate of change of the
thermal gradient between BI-STEM elements (figs. 15 and 20) and thus minimize thermal bending
21

+ .
'_._I+_!!!+!!!!!!!!!!!++_!++!+_!_+_+_!!!!!!!!!!+!!!!!!!!!!!!!!_!_!!!!!++!+!!!!!!!+!!!!!!!_!_!!!!!!!1lO- iiiiiiiiiii_iiiii_ii+_..i,_,_+i:+,i_i_i_i_ii_+_+_+_i_+_i__i_i_ii_i_i_+i_i_i_i_
LV !!!!!!'_!!!!!!_!:!!_i_i_:!iiii_!iii:._-'._i_iii_i_i_!_'_: _.=.i. _:;" :"
_ 10 -s
10" 3 10" 2 10" i 10 o 101
FREQUENCY, Hz
Figure 23. Frequency response about V2 axis for initial modified controller.
"4 + + r ' +'r'+ ' ' + ":''r+ .... ; "_+:" ' _ " _ _I0
e_o 10 "s + : i : :: : : ! ....... + ,:rq_ : .H .....
t..
_. 10.7Z
,._ lO-S[-
10.9
ol i i i i i i i _ !ii i _iiii i i_iii_d t u i tl N t J t t i I _ i i ,..titlO" o'" io" io_ i'o' lO'
FREQUENCY, Hz
Figure 24. Response about V2 for second modified controller.
22
10-_
lO.S
¢,J
10-+
&3
10-7Z
10 "s
[....10 .9
_e
eq
;:,- 10-14
Iii+i il ililii+ili_i!ii__i_i•_ii, i _ii
•0"" 10" 1 10 o 101 10 2
FREQUENCY, Hz
Figure 25. Frequency response for final modified control system.

of the booms. The solution approach taken by the ESA was to cover the booms with cylindrical
thermal shields that would easily deploy/retract with the booms (fig. 26). A bellows design wasutilized with Teflon TM outer surface and aluminum inner surface. In figure 27, test results show thedramatic reduction in thermal gradient across the BI-STEMS due to addition of the shields.
Figure 26. Thermal shield for redesigned arrays in stowed and deployed configurations.
o
Z
f.,T.,
_T2
[--,"e
p..,
[-
ao iUnshlelded
20
15
10
5
I(4-2) 2
©
\
", Shielded ,
0 ..... (4-2)
-5. Ji i
0 20 40 60 80 100 120
TIME, min
Figure 27. Reduction in boom thermal gradient due to addition of shields.
A second goal of the redesign process was to minimize static/dynamic friction effects in the
solar array mechanisms, due to consensus of the investigators that orbital day disturbances were
likely due to stick/slip behavior of the drums or spreader bars. This goal was accomplished in two
steps. First, the boom actuator (fig. 4) was modified by incorporating a drum brake into the system
to prevent drum rotation after array deployment was complete. As discussed earlier in the paper, the
23

drumswere originally designedto rotatein responseto thermalexpansionor contractionof the arrayblanketsand thus maintain constantblanket tension(fig. 2). Locking the drum with the new brake
mechanism required a modification of the blanket tension assembly to provide this compensation.The new tension assembly design, shown in figure 28, utilizes 15 soft "bed springs" attached to the
main spreader bar and a new intermediate spreader bar. This new spring system provides the nec-
essary compensation for blanket expansion/contraction without introducing stick/slip frictionaleffects. Further, the low stiffness of the spring system and the lateral flexibility of the metal bellows
at the boom ends compensate for deployment rate variations between the two booms.
LIMIT STRAP SPRING SPREADER BAR
ERMEDIATE
B SPREADER BAR
OUTER BUFFER
VIBRATION DAMPERS
Figure 28. Redesigned blanket tension assembly for solar arrays.
Comparison of figures 5 and 28 shows that the original system of steel tapes and rollers has
been eliminated, and the potential for stick/slip in the tension mechanism has been reduced. Figure
29 shows a simplified view of an entire redesigned solar array. Initial flight data following the HSTrefurbishment mission in December 1993 indicated that the redesigned solar arrays considerably
reduced the disturbances of the pointing control system. The postservicing disturbances withoutonboard attenuation were comparable to the original disturbances with enhanced control systemattenuation. 16 An onorbit modal transfer function test indicated that the modified control algorithm
described previously was stable with the new arrays, and the modified controller was activated. Thecombination of mechanical and thermal changes to the solar arrays and enhanced disturbance
attenuation of the control system reduced the pointing system disturbances to levels below the
design requirement of 0.007 arcsec for 95 percent of the orbit and below 0.012 arcsec for the entireorbit. 16
BLANKET TENSION
ASSEMBLY _DRUM BRAKE
[ O'I_!'IJIIIIII!IIU !Oll'|llJil|'l_ __
1 "
Figure 29. Simplified overall view of redesigned arrays.
24

SUMMARY
Based on observation of onorbit telemetry data and results of dynamic math models, it wasconcluded that orbital transition disturbances of the HST were caused primarily by normal thermal
gradients in the solar array booms. Thermal analyses and onorbit data showed that the thermal
gradients during the early part of eclipse/sunlight transition were similar to quarter-sine functions.The orbital day disturbances are thought to have been caused by stick/slip behavior of the solar array
drums or spreader bars. Further, it is thought that the orbital day stick/slip behavior affected thenight disturbances.
Control law modifications were described that reduced the disturbances to levels allowingsuccessful science operations about 95 percent of the time. The controller redesign was first seen as
a temporary measure, pending installation of modified solar arrays during the HST maintenance
mission. Redesign of the solar arrays was briefly described, and it was shown that the new arrays
have considerably less potential for significant stick/slip behavior and large amplitude thermal bend-
ing that were the sources of the pointing control system disturbances. Flight data following the
refurbishment mission showed that the new solar arrays performed well, and in combination with on-board control system attenuation minimized the disturbances.
25

REFERENCES
o
.
3.
.
.
.
.
.
,
10.
11.
12.
13.
Nurre, G.S., and Dougherty, H.J.: "The Pointing System for Space Telescope." The National
Symposium and Workshop on Optical Platforms, Charles L. Wyman, editor, Proceedings ofSPIE, vol. 493, Society of Photo-Optical Instrumentation Engineers, Bellingham, WA, June
1984, pp. 22-31.
Wolff, G., and Withmann, A.: "The Flight of the FRUSA." AIAA Paper 72-510, April 1972.
Cawsey, T.R.: "A Deployable Mechanism for the Double Roll-Out Flexible Solar Array on the
Space Telescope." The 16th Aerospace Mechanisms Symposium, NASA CP-2221, May 1982,
pp. 223-233.
Sharkey, J., and Dunker, T., private communication, NASA Marshall Space Flight Center,
Huntsville, AL, May 1990.
Blair, M., and Vadlamudi, N.: "Hubble Space Telescope Vehicle Rate Anomaly Investigation:
Intermediate Results." Lockheed Missiles and Space Co., F373203, Sunnyvale, CA, May1990.
Hegel, D., private communication, Lockheed Missiles and Space Co., Sunnyvale, CA, May1990.
Deloo, P., Klein, M., and Reynolds, J.: "Solar Array Deployed Finite Element Model: Volume
2." European Space Research and Technology Center, ESA Document TN-SA-0011, vol. 2,
Noordwijk, Netherlands, March 1989.
Kay, S.: "Solar Array BI-STEM Thermal Analysis." Lockheed Missiles and Space Co., IDC
TCS/01-003, Sunnyvale, CA, May 1990.
Kay, S., and Yoshikawa, Y.: "Solar Array BI-STEM Thermal Analyses." Lockheed Missiles
and Space Co., EM TCS512, Sunnyvale, CA, August 1990.
Davies, W.V.: "Analysis of BI-STEM Booms to Ascertain Possibility of 'Snap Through' Due
to Thermal Gradients." British Aerospace, ESA Document TN-SA-B638, Bristol, England,
U.K., May 1986.
Klein, M.: "Thermal Induced Solar Array Disturbances." European Space Research and
Technology Center, ESA Document TN-SA-0001, Noordwijk, Netherlands, October 1985.
Craig, R., and Bampton, M.: "Coupling of Substructures for Dynamic Analysis." AIAA
Journal, vol. 6, No. 7, July 1968, pp. 1313-1319.
Thornton, E.A., and Kim, Y.A.: "Thermally Induced Bending Vibrations of a Flexible Rolled-
Up Solar Array." Journal of Spacecraft and Rockets, vol. 30, No. 4, July-August 1993, pp. 438-448.
26

14.
15.
16.
Sharkey, J., Nurre, G., Beals, G., and Nelson, J.: "A Chronology of the Onorbit Pointing
Control System Changes on the HST and Associated Pointing Improvements." AIAA Paper92-4618, August 1992.
Vadlamudi, N., Blair, M.A., and Clapp, B.R.: "Hubble Space Telescope Onorbit Transfer
Function Test." AIAA Paper 92-4614, August 1992.
Anderson, G., Bradley, A., Kelley, J., Nelson, J., and Dougherty, H.: "HST Preservicing
Mission Overview and Servicing Mission Results." The 13th International Federation of
Automatic Control Symposium on Automatic Control in Aerospace, Pergamon Press, Oxford,
U.K., September 1994.
"_U S, GOVERNMENT PRINTING OFFICE 1995 633--109 I 20040
27


Form Approved
REPORT DOCUMENTATION PAGE OM8No.oTo_-olas
Pub C reDortlng burden for thgs collection of information ,S estimated to average 1 hour I)er response, including the time for reviewing instructions, searching exlst, lng data source!.,
gathering and ma ntainmg the data ne_:led and completing and reviewing the collection of information. Sefld comments rec_ardlng this !l:)urden estimate or any Other a _sl_[,Ol tins
co,,_,ono,,n,o_ma,io....c,_ding,oggest,ons'o,_=,ngth,s_,den.toW.h,ngton.e,_u..e._.,,.. O,,,_Orate,or,°fo___;,,o.OJ._..._0_,a_ _.,,5 Je.,.',=Davis Highway, Suite 1204, Arlington, VA 22202-4302, and to the Office of Management and Budget. Paf;_rwork Reduction Pro ec't (g/_]l_h wl_n ngto , uL. _u,.
t11. AGENCY USE ONLY (Leave blank) 2. REPORT DATE 3. REPORT TYPE AND DATES COVERED
May 1995i
4. TSLEAND SUBTITLE
The Solar Array-Induced Disturbance of the Hubble Space
Telescope Pointing System
6. AUTHOR(S)
C.L. Foster, M.L. Tinker, G.S. Nurre, and W.A. Till
7. PERFORMINGORGANIZATIONNAME(S)AND ADDRESS(ES)
George C. Marshall Space Flight CenterMarshall Space Flight Center, Alabama 35812
9. SPONSORING/MONITORINGAGENCYNAME(S)AND ADORESS(ES)
National Aeronautics and Space Administration
Washington, DC 20546
Technical Paper5. FUNDING NUMBERS
8. PERFORMING ORGANIZATION
REPORT NUMBER
M-782
10. SPONSORING / MONITORING
AGENCY REPORT NUMBER
NASA TP-3556
11. SUPPLEMENTARYNOTES
Prepared by Structures and Dynamics Laboratory, Science and Engineering Directorate.
12=. DISTRIBUTION/AVAILABIUTYSTATEMENT
Subject Category 39
Unclassified Unlimited
12b. DISTRIBUTION CODE
13. ABSTRACT (Maximum 200 words)
The investigation of the vibrational disturbances of the Hubble space telescope that were dis-
covered soon after deployment in orbit is described in detail. It was found that the disturbances were
particularly evident during orbital day-night crossings, and that the magnitudes of the disturbances
were considerably larger than the design jitter requirements. This paper describes the process bywhich the vibrations were characterized and isolated to a particular mechanism. The analysis of the
flight data and comparisons with computer simulation results showed that the source of the dis-turbances was the thermally driven deformation of the solar arrays in conjunction with frictionaleffects in the array mechanisms. The control system was successfully modified to attenuate the dis-
turbances to tolerable levels pending mechanical and thermal redesign of the solar arrays. The new
arrays were installed during the first space telescope servicing mission and, in combination with theenhanced control system algorithm, reduced the disturbances to satisfactory levels.
14. SUBJECT TERMS
Hubble space telescope, solar arrays, disturbance, yibration,
pointing control system
17. SECURITY CLASSIFICATION
OF REPORT
Unclassified
NSN 7540-01-280-5500
18. SECURITY CLASSIFICATIONOF THIS PAGE
Unclassified
lg. SECURITY CLASSIFICATION
OF ABSTRACT
Unclassified
15. NUMBER OF PAGES
32
16. PRICE CODEA03
20. LIMITATION OF ABSTRACT
Unlimited
Standard Form 298 (Rev. 2-89)
