the six minute walk test accurately estimates mean peak oxygen
TRANSCRIPT

Ross et al. BMC Pulmonary Medicine 2010, 10:31http://www.biomedcentral.com/1471-2466/10/31
Open AccessR E S E A R C H A R T I C L E
Research articleThe six minute walk test accurately estimates mean peak oxygen uptakeRobert M Ross*1, Jayasimha N Murthy2, Istvan D Wollak3 and Andrew S Jackson4
AbstractBackground: Both Peak Oxygen Uptake (peak VO2), from cardiopulmonary exercise testing (CPET) and the distance walked during a Six-Minute Walk Test (6 MWD) are used for following the natural history of various diseases, timing of procedures such as transplantation and for assessing the response to therapeutic interventions. However, their relationship has not been clearly defined.
Methods: We determined the ability of 6 MWD to predict peak VO2 using data points from 1,083 patients with diverse cardiopulmonary disorders. The patient data came from a study we performed and 10 separate studies where we were able to electronically convert published scattergrams to bivariate points. Using Linear Mixed Model analysis (LMM), we determined what effect factors such as disease entity and different inter-site testing protocols contributed to the magnitude of the standard error of estimate (SEE).
Results: The LMM analysis found that only 0.16 ml/kg/min or about 4% of the SEE was due to all of the inter-site testing differences. The major source of error is the inherent variability related to the two tests. Therefore, we were able to create a generalized equation that can be used to predict peak VO2 among patients with different diseases, who have undergone various exercise protocols, with minimal loss of accuracy. Although 6 MWD and peak VO2 are significantly correlated, the SEE is unacceptably large for clinical usefulness in an individual patient. For the data as a whole it is 3.82 ml/kg/min or 26.7% of mean peak VO2. Conversely, the SEE for predicting the mean peak VO2 from mean 6 MWD for the 11 study groups is only 1.1 ml/kg/min.
Conclusions: A generalized equation can be used to predict peak VO2 from 6 MWD. Unfortunately, like other prediction equations, it is of limited usefulness for individual patients. However, the generalized equation can be used to accurately estimate mean peak VO2 from mean 6 MWD, among groups of patients with diverse diseases without the need for cardiopulmonary exercise testing. The equation is:
BackgroundThe Six-Minute Walk Test (6 MWT) is an inexpensive,relatively quick, safe and a well-tolerated method ofassessing the functional exercise capacity of patients withmoderate-to-severe heart or lung disease. Its use hasfound popularity in following the natural history of vari-ous diseases, for timing of procedures such as heart orlung transplantation and for measuring the response tomedical interventions [1].
Cardiopulmonary Exercise Testing (CPET) with themeasurement of peak oxygen uptake (peak VO2) is the"gold standard" for assessing aerobic capacity. However,the test is relatively expensive and time consuming.Although CPET may be used periodically during a study,generally the 6 MWT is used for the routine following ofstudy patients' exercise capacity.
There has been a substantial body of literature pub-lished looking at the relationship between 6 MWT andpeak VO2 in individuals [2-11]. These studies have foundthat the standard error of estimate (SEE) in the correla-tion equation between 6 MWD and peak VO2 is quite
Mean Peak VO ml kg Mean 6 MWD meters2 4 948 0 023( / / min) . . * ( )
(
= +SSEE ml kg1 1. / / min)
* Correspondence: [email protected] Baylor College of Medicine, 3333 Richmond Ave, 2nd Floor, Houston, Texas 77098, USAFull list of author information is available at the end of the article
BioMed Central© 2010 Ross et al; licensee BioMed Central Ltd. This is an Open Access article distributed under the terms of the Creative Commons At-tribution License (http://creativecommons.org/licenses/by/2.0), which permits unrestricted use, distribution, and reproduction in anymedium, provided the original work is properly cited.
Ross et al. BMC Pulmonary Medicine 2010, 10:31http://www.biomedcentral.com/1471-2466/10/31
Page 2 of 9
large. However, the source of this large error has not beenexplored. Further, the relationship between the meanpeak VO2 and the mean Six Minute Walk Distance (6MWD) among different study groups, has not beenassessed. This could have significant value when compar-ing study groups in terms of average peak VO2 when only6 MWD data is available. For example, if a therapeuticintervention showed promise in one study but notanother, a potential reason could be that the groups hadsignificantly different mean peak VO2's and the therapy isonly efficacious for those with adequate aerobic reserve.
A potential problem in deriving an equation to estimatemean peak VO2 from mean 6 MWD is that the two testsare not performed uniformly at different institutionsthroughout the world. Type of disease and test adminis-tration factors could significantly influence the relation-ship. These include the manner in which the 6 MWT isperformed, whether there is a learning 6 MWT per-formed first, the CPET protocol used, the test mode used,treadmill or cycle ergometer, and whether the individualuses supplemental oxygen for the 6 MWT. All of thesefactors are potential sources of confounding bias thatcould conceivably make a generalized equation of limitedpractical use. However, the magnitude of these variableson the SEE has not been explored.
This study was designed to examine the relationshipbetween 6 MWD and peak VO2 in diverse groups ofpatients with various cardiac, circulatory and pulmonarydisorders, who were tested under different clinical proto-cols, to determine if a useful generalized equation to esti-mate peak VO2 from 6 MWD could be derived.
MethodsThe data for this study came from two sources. The firstwas data from a sequential, retrospective chart analysis of50 patients who had completed both a CPET and 6 MWTon the same day performed at our institution, The Meth-odist Hospital, Baylor College of Medicine in Houston,Texas. Many of these patients had both studies as part ofa heart or lung transplant program. The authors were notinvolved in the patient selection or decision to have thetests. The study was approved by The Methodist HospitalResearch Institute Office of Research Protections. If thesame patient had more than one test, only the first testwas used for analysis. A total of 48 patients met these cri-teria. The patients had a diverse group of cardiopulmo-nary disorders including pulmonary hypertension,interstitial lung disease and chronic obstructive pulmo-nary disease. There were 25 women with a mean age of55.4 ± 10.1 years and 23 men with a mean age of 53.3 ±13.1 years.
The 6 MWT was performed walking a corridor of 100feet in length utilizing the protocol outlined by the Amer-ican Thoracic Society ATS [1]. Some of our study patients
required supplemental oxygen while performing the test,however, all completed the 6 MWT. Peak oxygen uptakewas obtained from expired gas analysis using an Eric Jae-ger ™ Oxycon Alpha or Oxycon Pro. The patients wereencouraged to exercise to voluntary exhaustion. TheCPET protocol was designed by an experienced techni-cian so that each patient would reach maximum poweroutput by approximately ten minutes. The women had amean 6 MWD of 346.6 ± 128.5 meters and mean peakVO2 of 12.5 ± 3.1 ml/kg/min. The men had a mean 6MWD of 361.3 ± 136.3 meters and mean peak VO2 of13.7 ± 3.5 ml/kg/min. Their pooled results and linearregression statistics are shown in Table 1.
We also performed a literature search up through mid2006 utilizing Pub Med. We looked for studies where rawdata displaying the relationship between 6 MWD andpeak VO2 was presented. 10 studies [2-11] were found.Eight of the studies published the data only as bivariatescattergrams. In these cases, the graphs from these arti-cles were electronically copied to a program where thecoordinates of each point could be ascertained. Thesevalues were then multiplied by appropriate scaling factorsto obtain each individual's peak VO2 and 6 MWD values.Points of some subjects were superimposed on each othermaking it impossible to recover all the data. However, wewere able to obtain 95% of all published data points.These studies were performed at sites around the world,including the US, Europe and Japan. They encompassedpatients with many different heart and lung disorders,exercised under various protocols. Table 2 lists informa-tion regarding the CPET and 6 MWT protocols utilizedby the different studies. These studies, each of uniformpatient diseases and exercise protocols, were used forcomparison to the results from our study group. Wefound that the correlation coefficient and SEE of our datawere similar to those from these other studies eventhough our group consisted of patients with a mixture ofcardiopulmonary disorders exercised according to ourprotocol. This suggested that different patient diseases aswell as different CPET and 6 MWT techniques (which wewill call collectively the "inter-site effect") might not bemajor factors in the size of the SEE.
To study the magnitude of this "inter-site effect" on theSEE more rigorously, we used Linear Mixed Modelsregression analysis (LMM). In this regard, the inter-siteeffect encompassed the various differences in diseaseextent and type, as well as exercise protocols and othervariability among the different data sets obtained fromthe different studies. For this analysis, each of the studieswas treated as a random variable. Both random interceptand random coefficient models were examined [12,13]. Alog ratio test [14] was used to determine which model fitthe data better. The method of obtaining estimates of theunknown parameters of the LMM was by optimizing a

Ross et al. BMC Pulmonary Medicine 2010, 10:31http://www.biomedcentral.com/1471-2466/10/31
Page 3 of 9
Table 1: Sample and linear regression characteristics for all subjects contrasted by study.
Study Sample Characteristics Linear Regression Statistics
Disease n peak VO2 Mean ± SD
6 MWT Mean ± SD
Slope Intercept R SEE (SEE/Mean) × 100
Cahalin 1996 (3) CHF 45 12.4 ± 4.5 310 ± 103 0.028 3.583 0.65 3.44 27.7
Cahalin 1995 (2) ESLD 60 9.6 ± 3.8 294 ± 139 0.019 4.042 0.69 2.81 29.2
Lucas 1999 (6) CHF 307 14.2 ± 4.9 391 ± 105 0.027 3.666 0.59 3.99 28.1
Miyamoto 2000 (7) PH 27 13.9 ± 4.4 377 ± 115 0.026 4.213 0.68 3.25 23.4
Opasich 2001 (8) CHF 269 14.5 ± 4.9 378 ± 95 0.027 4.498 0.59 3.42 23.6
Roul 1998 (9) CHF 114 16.8 ± 4.5 437 ± 108 0.009 12.910 0.21 4.43 26.4
Starobin 2006 (10) COPD 49 14.0 ± 4.4 436 ± 89 0.027 2.184 0.55 3.69 26.4
Zugck 2000 (11) DC 112 15.6 ± 5.2 463 ± 107 0.033 0.113 0.69 3.78 24.2
Faggiano 1997 (4) CHF 26 15.1 ± 3.9 419 ± 121 0.019 7.260 0.58 3.25 20.8
Lipkin 1986 (5) CHF 26 14.0 ± 4.1 452 ± 147 0.019 5.271 0.70 2.95 21.0
Baylor CPD 48 13.1 ± 3.4 354 ± 131 0.017 6.921 0.68 2.50 19.1
All Data All 1,083 14.3 ± 4.8 393 ± 115 0.025 4.682 0.59 3.82 26.7
ESLD - End Stage Lung Disease; DC - Dilated Cardiomyopathy; CHF - Congestive Heart Failure; PH -Pulmonary Hypertension; COPD - Chronic Obstructive Pulmonary Disease; CPD - Various Cardiopulmonary Disorders. Peak VO2 - peak oxygen uptake (ml/kg/min.); 6 MWD- distance walked (meters) during the 6-minute walk test.
likelihood function. STATA 9.0 [14] was used for all anal-yses.
ResultsScanned DataOf the 10 studies found in the literature, the data fromeight were obtained from scans of the published scatter-grams. To our knowledge, this technique has not beenused before. In order to validate it, we compared statisticsderived from our "measured" data from the graphs to val-ues published in the articles. The largest differencebetween the mean 6 MWD reported and calculated frommeasured data was only 18 meters. This was for the sam-ple with the most under represented data points [8]. Thelargest mean difference for the remaining samples wasjust 4 meters. The largest difference in the standard devi-ations between reported and graphed data was only 3meters. For peak VO2 the largest difference was 0.5 ml/kg/min [10] and the next was 0.2 ml/kg/min. The largest
difference in the standard deviations was 0.5 ml/kg/minwhile the next highest was 0.3 ml/kg/min. The largest dif-ference in the correlations reported and those that weobtained from the scanned data was only 0.06. Thesefindings indicate that the data obtained from scans of thepublished scattergrams were accurate as they provided anexcellent fit of the published results.
Linear Regression AnalysisTable 1 provides sample characteristics for each of the 11studies and all studies combined. For the Baylor group,the mean peak VO2 was 13.1 ml/kg/min (± 3.4 ml/kg/min). The mean 6 MWD was 354 (± 131) meters. Thecorrelation between peak VO2 and 6 MWD was 0.68 (p <0.001) with a SEE of 2.50 ml/kg/min. The sample sizes ofthe studies from the literature ranged from 26 to 307patients. The mean peak VO2 of the groups ranged from9.6 to 16.8 ml/kg/min, while the range for the 6 MWDmeans was from 294 to 463 meters. Table 1 also provides

Ross et al. BMC Pulmonary Medicine 2010, 10:31http://www.biomedcentral.com/1471-2466/10/31
Page 4 of 9
linear regression statistics. While all correlations werestatistically significant, they ranged from a low of 0.21 toa high of 0.70. Standard errors of estimate ranged from alow of 2.50 to 4.43 ml/kg/min. The SEE normalized bymean peak VO2, ranged from 19.1 to 29.2%. The correla-tion for all 1,083 patients combined was 0.59 and the SEEwas 3.82, nearly 27% of the mean of 14.3 ml/kg/min.
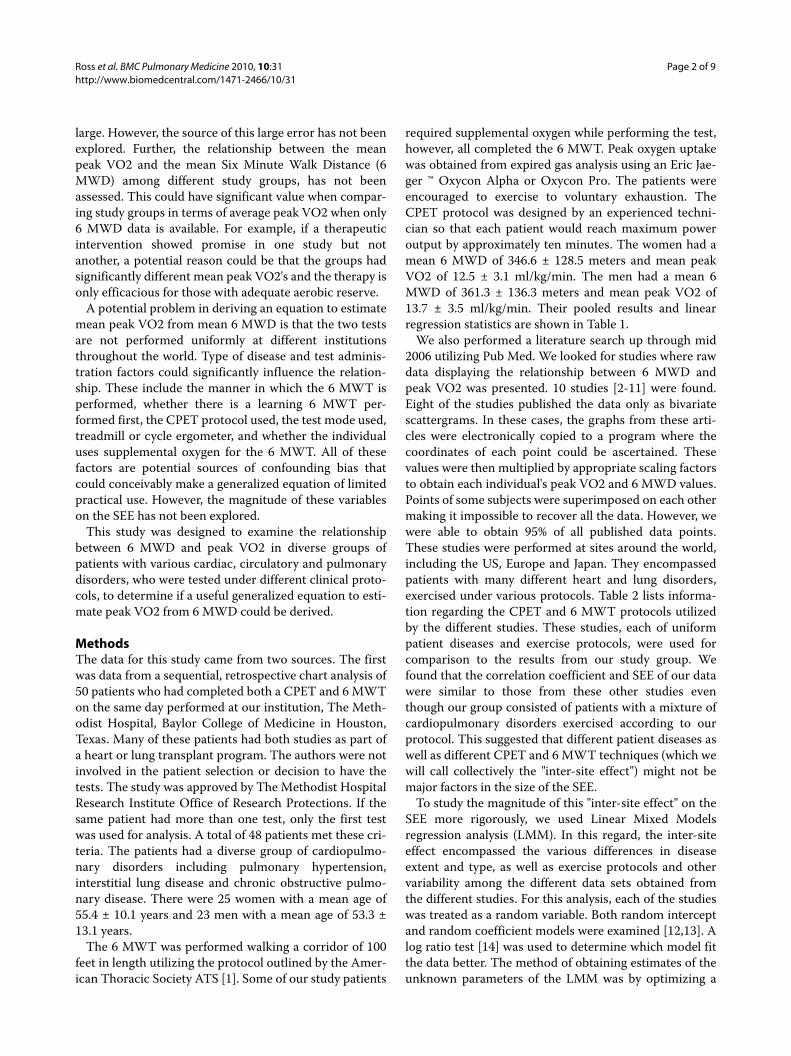
Figure 1 gives the regression lines for estimating peakVO2 from 6 MWD for each of the 11 studies. The slopesranged from 0.017 to 0.33 and the intercept range wasfrom 0.113 to 12.9. The linear regression equationderived from the combined data of this diverse group of1,083 patients who had their 6 MWT and CPET per-formed under various different protocols had a slope of0.025 and intercept of 4.682.
Linear Mixed Model Analysis (LMM)Table 3 gives the LMM analysis. Provided are two mod-els, random intercept (LMM-I) and random coefficient
(LMM-II) [12]. The coefficients for the intercepts and 6MWD slope for the fixed part of the two models were sig-nificantly different from zero (p < 0.001). The equationsof the two models were nearly identical, with a differenceof just 0.322 for intercepts and 0.001 for 6 MWD slope.The fixed-effect LMM SEE, which represents population-averaged measurement error estimates [13], and the lin-ear regression SEE for the entire group were identical at3.82 ml/kg/min.
The log ratio test [14] found that the random coeffi-cient model (LMM-II) provided a better fit than the ran-dom intercept model (Chi square = 15.65, p = 0.0004)documenting that the differences in the regression slopesand intercepts graphed in Figure 1 were due to inter sitedifferences and not chance variation. The correlation forthe slopes and intercepts of the 11 studies was -0.94 dem-onstrating that the steeper slopes among the 11 studieswere associated with lower intercepts. The SEE of therandom effects model was 3.66 ml/kg/min (95% CI, 3.54
Table 2: Exercise characteristics of the different studies
CPET 6 MWT
Author Type Stop AT RER Length Practice Stop
Cahalin (2) cycle Pt 70% NR 168 ft yes Distress, O2 < 80% *
Cahalin (3) Cycle Pt 88% NR 168 ft Yes Distress
Faggiano (4) Cycle Pt 88% NR NR Yes NR
Lipkin (5) TM Pt NR NR 20 M Yes NR
Lucas (6) Cycle Pt NR NR 20 M Yes? NR
Myamoto (7) Cycle NR NR NR NR NR NR
Opasich (8) Cycle NR 82% NR 34 M Yes Distress
Roul (9) Cycle NR 100% NR Ped NR NR
Starobin (10) Cycle NR NR NR Cor NR NR
Zugck (11) Cycle Pt NR NR 132 M NR None
Baylor Cycle TM Pt NR NR 100 ft NR None *
CPET- Cardiopulmonary Exercise Test: Type: cycle- cycle ergometer or treadmill (TM) using various protocols of gradually increasing power output. Stop: Pt: voluntary exhaustion. AT: % of group that had an anaerobic threshold. RER: Average maximum respiratory exchange ratio. 6 MWT- Six Minute Walk Test: Length: length of corridor in feet or Meters. Ped: pedometer, Cor: corridor but length not reported. Stop (Criteria for terminating walk): Distress: various distress criteria, O2 < 80%: O2 saturation dropping below 80%, None: Everyone completed test. NR: not reported, * some patients used O2 during the walk.
Ross et al. BMC Pulmonary Medicine 2010, 10:31http://www.biomedcentral.com/1471-2466/10/31
Page 5 of 9
to 3.86). This SEE is lower than for the fixed effects modelbecause the site-specific variation in slopes and inter-cepts is statistically controlled, yielding an estimate of the6 MWT prediction accuracy free of any inter-site effect.This SEE was only 0.16 ml/kg/min lower than the fixed-effect SEE of 3.82, indicating that the inter-site effectswere small and accounted for only 4% of the overall SEE.
Figure 2 is a bivariate scattergram of all the patient dataand the regression line (LMM II) to estimate peak VO2from 6 MWD. The scattergram illustrates that there isconsiderable variability in peak VO2 for any given 6MWD.
Figure 3 graphically presents the bivariate scattergramof 6 MWD by the LMM II residuals for the fixed (blackcircle) and random (gray triangle) models. The randommodel residuals controlled for variation among test sites.Provided for reference are solid lines for residuals of 0and ± 3.5 ml/kg/min. The dashed lines represent predic-tion errors ± 5 ml/kg/min. Analysis of the distributions ofresiduals showed that 67% of the fixed equation residualswere ± 3.5 ml/kg/min and 82% were ± 5 ml/kg/min. AsFigure 3 documents, the difference in residuals betweenLMM II fixed and random models was small and not sys-tematic. An analysis of the LMM II random equationresiduals showed that 68% of the errors were ± 3.5 ml/kg/min and 83% were ± 5 ml/kg/min.
Estimation of mean Peak VO2The data in Table 4 examines the accuracy of the general-ized equation (LMM II) to estimate the mean peak VO2from the mean 6 MWD for each of the 11 studies. Thisanalysis shows that the range for the mean differences,between measured and estimated peak VO2, is -2.1 to 1.8ml/kg/min. The standard deviation of the mean errorestimates is 1.1 ml/kg/min, or only 7.7% when normalizedby mean peak VO2.
DiscussionThe results of our study, all other individual studies andall data combined showed that 6 MWD and peak VO2were significantly correlated. Although, the site-specificprediction equations, which are presented in Table 1, dif-fered somewhat, they all had large SEE's, particularly as apercent of mean peak VO2. LMM analysis showed thatinter-site variability such as disease type and differenttesting protocols did not substantially increase the SEE.The LMM II error estimates for the fixed (3.82 ml/kg/min) and random models (3.66 ml/kg/min), although sta-tistically significantly different, were almost identical.The fixed effects SEE of 3.82 ml/kg/min is the averageerror estimate of all sites [15]. The random effects SEE of3.66 ml/kg/min is the SEE statistically excluding all fac-tors associated with variability among the sites and studygroups by utilizing empirical Bayes predictor, or the bestlinear unbiased predictor [12], which accounts for thevariability among test sites. The degree of error that isdue to differences in test site variation was just 0.16 ml/kg/min or 4% of the SEE. The analysis of the residuals inFigure 3 documents this small difference in measurementerror. This finding indicates that a generalized equationcan be used to estimate peak VO2 from 6 MWD with lit-tle loss of accuracy. Generalized across the 11 test sites,the SEE was 3.82 ml/kg/min, which was about 27% ofmean peak VO2.
Intuitively, it might be thought that inter-site factorswould have a larger effect on the SEE. Most of the authorsfrom the 10 additional studies we evaluated used patientswith a uniform disorder and exercised them in a uniformmanner in an attempt to minimize any error introducedby these factors. However, our study found that these fac-tors were a minor source of error. We believe this isbecause the major source of error is the random, inher-ent, within-subject measurement errors associated withCPET and the 6 MWT. In this regard, although the test-retest reliability for peak VO2 from CPET for normalpeople has been found to be about 0.96, this represents astandard error of measurement of about 2 ml/kg/min[16]. Similar results have been found for patients. Agroup of patients with fibrotic interstitial pneumonia hada coefficient-of-variation of 10.5% of peak VO2. This rep-resented approximately 2 to 2.5 ml/kg/min [17]. Thisvalue is about 15% of the mean peak VO2 of the pooledpatient data we obtained.
The 6 MWT also has significant inherent variability. Inone study, the within-subject variability for 6 MWD was4.2% or about ± 34 m [17]. In another study, after an ini-tial learning period, patients with chronic heart or lungdisease had a within-person standard deviation for 6MWD of about 6%. This represented a 95% likelihood ofabout ± 40 m [18]. Since the vast majority of the patientsevaluated in the studies we reviewed had a 6 MWD
Figure 1 Linear regression lines defining the relation between the distance walked in 6 minutes and peak VO2 for the 11 studies.

Ross et al. BMC Pulmonary Medicine 2010, 10:31http://www.biomedcentral.com/1471-2466/10/31
Page 6 of 9
between 200 and 600 m, this could lead to as much as20% variability in 6 MWD. Based on the correlation equa-tion we obtained, this could contribute an additionalerror in estimating peak VO2 of about +/- 1 ml/kg/min.
Although walking is an aerobic activity and, for peoplewith significant aerobic limitation, may be a maximalexercise activity, there are many reasons why people witha similar peak VO2 might have a different 6 MWD. The 6MWT is a voluntary effort where the person's walkingspeed can vary and the person might even stop and rest
for a period of time. Two people with the same peak VO2might choose different walking strategies. One mightwalk more slowly, the other faster but rest periodically.Patients might chose different average walking speedsbased on physiological factors such as work-of-breathing,auto-PEEP [19], work-of-the-heart or how much carbondioxide retention the individual can comfortably tolerate.For example, in a group of patients with congestive heartfailure, the VO2 measured at the end of the 6 MWT wason average 15% lower than peak VO2. However, it wasequal to or higher than measured peak VO2 from CPET
Table 3: Maximum likelihood estimates for the linear mixed model to estimate peak VO2 from 6-minute walk distance.
Parameter M-I: Random Intercept Estimate ± SEE M-II: Random Coefficient Estimate ± SEE
Fixed Component
Intercept 4.626 ± 0.516 4.948 ± 0.990
6-Minute Walk 0.024 ± 0.001 0.023 ± 0.002
SEE(AVG) 3.82 3.82
Random Component
Intercept(SD) 0.91 ± 0.25 2.80 ± 0.79
Slope(SD) 0.01 ± >0.01
R(Slope, Intercept) -0.94 ± 0.05
SEE(CON) 3.73 ± 0.08 3.66 ± 0.08
Log likelihood -2972.51 -2964.69
Figure 2 Scattergram and linear regression line for the distance walked in 6 minutes and peak VO2 for all patients from the 11 studies.
Figure 3 Bivariate plot of the residuals of the LMM fixed and ran-dom models contrasted by distance walked in 6 minutes.

Ross et al. BMC Pulmonary Medicine 2010, 10:31http://www.biomedcentral.com/1471-2466/10/31
Page 7 of 9
in about 25% of the patients [4]. Psychological factorssuch as anxiety or a patient's unique perception of pain,dyspnea or discomfort due to their abnormal physiologyalso can affect 6 MWD. In this regard encouragement hasbeen shown to increase 6 MWD in sick patients [20].
If the test-retest variations are random for both peakVO2 and 6 MWD measurements, as would be expected,it is not surprising that we obtained a SEE of 3.66 ml/kg/min independent of the error introduced by site differ-ences. It is unlikely that utilizing a different walk timewould improve predictive accuracy, as the physiologicalprinciples are the same. Similar correlations and standarderrors have been found utilizing the two and the twelve-minute walk tests [21,22] as well as for predicting peakVO2 from maximal exercise treadmill time [23].
It is possible that part of the large SEE may not havecome from the intrinsic variability of the testing tech-niques but from improper patient selection. The physio-logic basis behind utilizing the 6 MWT to estimate peakVO2 is that maximal exercise tests correlate quite wellwith peak VO2 [24]. However, the 6 MWT is a submaxi-
mal exercise test for most people with normal or mild-to-moderately reduced aerobic capacity. Submaximal exer-cise tests require some estimate of internal effort, such asexercise heart rate so that maximal exercise capacity canbe predicted, before they can be used to adequately esti-mate peak VO2. That is, if the 6 MWT is a submaximaleffort, there is no physiologic basis for a close correlationbetween maximal walking speed and peak VO2. There-fore, it is possible that including people whose 6 MWDwas not limited by aerobic factors might have affected thesize of the SEE we found. In normal people, the distancewalked in 6 minutes of voluntary non-markedly-encour-aged walking does not vary due to peak VO2 but to otherfactors such as gait limitation [25]. Normative values forthe 6 MWT have been published [26]. For a 60 year oldman, the lower limit of normal would be about 450 m. Toexclude the effect that people with a potentially normalaerobic capacity might have on the SEE, we analyzed thecombined data using only subjects who walked <450 m.There were 742 patients in this group. The mean peakVO2 was 12.9 ml/kg/min and the SEE for this group was
Table 4: Accuracy of the generalized LMM equation in estimating mean measured peak VO2 from mean 6 MWD.
Study M-peak VO2 6 MWD E-peak VO2 Measured - Estimated
Cahalin (3) 12.4 310 12.1 0.3
Cahalin (2) 9.6 294 11.7 -2.1
Lucas (6) 14.2 391 13.9 0.3
Miyamoto (7) 13.9 377 13.6 0.3
Opasich (8) 14.5 378 13.6 0.9
Roul (9) 16.8 437 15.0 1.8
Starobin (10) 14.0 436 15.0 -1.0
Zugck (11) 15.6 463 15.6 0.0
Faggiano (4) 15.1 419 14.6 0.5
Lipkin (5) 14.0 452 15.3 -1.3
Baylor 13.1 354 13.1 0.0
Grand Mean 13.9 392 13.9 0.0
M-peak VO2 (Measured mean peak VO2 from CPET)E-peak VO2 (Estimated mean peak VO2 from 6 MWD):Mean peak VO2 = 4.948 + (0.023 × 6 MWD) (SEE 1.1 ml/kg/min)

Ross et al. BMC Pulmonary Medicine 2010, 10:31http://www.biomedcentral.com/1471-2466/10/31
Page 8 of 9
+/- 3.44 ml/kg/min or 26.7% of the mean. Thus, evenwhen patients with potentially normal functional capac-ity are excluded, the accuracy for estimating an individ-ual's peak VO2 is poor. This indicates that the large SEEthat we observed was not due to improper patient selec-tion.
Although the SEE is 3.82 ml/kg/min when predictingan individual's peak VO2, it is only 1.1 ml/kg/min whenpredicting the mean peak VO2 of a study group (Table 4).This much smaller SEE also indicates that inter-site fac-tors are not as important as the intrinsic variability of thetest results. Further, this finding suggests the variability israndom because with larger numbers, random effectswould tend to cancel out and the SEE would be smaller.This is what we found.
A meta analysis is used to combine data from severalstudies to expand generalizability. The common methodis to use the means of published results weighted by sam-ple size. This is the first instance, to our knowledge, toreproduce data at the individual level from scanned scat-tergrams. Our comparative analyses of the scanned andpublished data documented that the errors were smalland likely random. The major advantage of this approachis that we cannot only examine mean differences, butmore importantly, estimate individual variation. This isshown by comparing the results provided in Figures 2 and3 and the data in Table 4. The error analysis in Figure 3showed that 33% of individual differences between mea-sured and peak VO2 estimated with the fixed effect equa-tion (LMM II) were greater than ± 3.5 ml/kg/min andnearly 20% were greater than ± 5 ml/kg/min. In contrast,the data in Table 4 shows that when the level of analysiswas the average value, the prediction error was quitesmall, varying from -2.1 to 1.8 ml/kg/min. The correla-tion between peak VO2 and 6 MWD for all 1,083 individ-ual patient data was 0.59. The correlation between peakVO2 and 6 MWD for the means of the 11 data sets was0.82.
Our findings suggest that 6 MWD has too large of aSEE to be clinically useful for estimating peak VO2 for anindividual. However, we were able to obtain only 6 MWDand peak VO2 for each data point. It is possible that withmore information, and utilizing multiple linear regressionanalysis, a more accurate equation could have beenderived. Several studies have utilized multiple linearregression analysis for patients with uniform diseasesexercised with uniform protocols and still had relativelylarge standard errors [2,3,27]. Therefore, we doubt thatthis would dramatically improve accuracy.
Although the 6 MWT does not accurately predict anindividual's peak VO2, many investigators have found ituseful for therapeutic decision-making in moderate-to-severely ill patients [1]. 6 MWD has also been found tocorrelate reasonably well with the New York Heart Asso-
ciation (NYHA) lower functional classes [28]. The 6MWT may act as a somewhat more objective, expandedNYHA scale [25] which could potentially allow research-ers to monitor more subtle changes in exercise capacity inan individual or in a group. In this regard, serial exercisetesting over about one year revealed that changes in peakVO2 were directly proportional to changes in 6 MWD[11].
Presently, no equation has been published that allowsestimation of mean peak VO2 from mean 6 MWD acrossa large spectrum of patient groups with different diseasesand exercise protocols. Our study provides this equation.Its accuracy is similar to population specific equations.However, when using this equation researchers should becautious to exclude individuals whose 6 MWD is not lim-ited by aerobic factors as this could lead to large errors.Maximum walking speed is generally less than 4-4.5 mphor about 700 m. in six minutes. Only 5 people in the stud-ies we reviewed had a 6 MWD > 700 m. Based on theequation we derived, a 6 MWD of 700 m would predict apeak VO2 of about 21 ml/kg/min. In one of the studies wereviewed, the peak VO2 and 6 MWD of 10 normal sub-jects were reported [5]. Peak VO2 ranged from 26 to 35ml/kg/min. The corresponding 6 MWD for these twosubjects, at the extremes, were 666 m and 700 m, respec-tively. Our predictive equation would estimate a peakVO2 of 21.3 and 22.2 ml/kg/min. That is, utilizing theequation we derived, 6 MWD poorly predicts, and sub-stantially underestimates, peak VO2 in people with a rel-atively normal aerobic capacity. Thus, people with a peakVO2 above about 20 ml/kg/min should be excluded fromthe group, when utilizing the equation we derived, to esti-mate mean peak VO2. If an individual's peak VO2 is notknown, we recommend utilizing the equation only forpeople with moderate-to-severe heart or lung disease,excluding people whose 6 MWD is above 600 meters, asfew of the patients we evaluated walked further than thisand this value would estimate a peak VO2 of about 20 ml/kg/min.
ConclusionsBased on data from 1,083 patients, we found a SEE of 3.82ml/kg/min when predicting an individual's peak VO2from 6 MWD. Utilizing LMM analysis we found inter-sitedifferences contributed little to the size of this value sothe equation can be generalized and used for patientswith various diseases exercised under various protocols.However, the large SEE suggests poor prediction accu-racy for clinical purposes when assessing an individual.
Conversely, for groups of patients with moderate-to-severe heart or lung disease, the generalized equationquite accurately estimated mean peak VO2 from mean 6MWD. The equation is:

Ross et al. BMC Pulmonary Medicine 2010, 10:31http://www.biomedcentral.com/1471-2466/10/31
Page 9 of 9
If individuals with normal aerobic capacity or a 6 MWDover about 600 meters are excluded, this equation can beused to compare the average peak aerobic capacity of dif-ferent study groups even if they have different diseasesand have exercised under slightly different 6 MWT pro-tocols. We believe this equation could be useful for com-paring study groups, in terms of average peak aerobiccapacity without the need for CPET, where the 6 MWT isused to monitor the natural history of a disease or deter-mine the efficacy of various forms of treatment.
Competing interestsThe authors declare that they have no competing interests.
Authors' contributionsRMR was responsible for the concept and design of the study, supervision ofdata acquisition, was a significant manuscript writer and is the correspondingauthor. JNM was responsible for data acquisition and literature review. IDW wasresponsible for data acquisition and literature review. ASJ was responsible forstatistical expertise, data analysis and interpretation, and was a significant man-uscript writer. All authors read and approved the final manuscript.
Author Details1Baylor College of Medicine, 3333 Richmond Ave, 2nd Floor, Houston, Texas 77098, USA, 2Division of Pulmonary Critical Care and Sleep Medicine, University of Texas Health Science Center at Houston, Texas, USA, 3Memphis Lung Physicians, 6025 Walnut Grove, Memphis, TN 38120, USA and 4Department of Health and Human Performance, University of Houston, Houston, Texas, Adjunct Professor of Medicine, Baylor College of Medicine, Houston, Texas, USA
References1. ATS statement: guidelines for the six-minute walk test. Am J Respir Crit
Care Med 2002, 166(1):111-7.2. Cahalin L, Pappagianopoulos P, Prevost S, Wain J, Ginns L: The
relationship of the 6-min walk test to maximal oxygen consumption in transplant candidates with end-stage lung disease. Chest 1995, 108(2):452-9.
3. Cahalin L, Mathier MA, Semigran MJ, Dec GW, DiSalvo TG: The six-minute walk test predicts peak oxygen uptake and survival in patients with advanced heart failure. Chest 1996, 110(2):325-32.
4. Faggiano P, D'Aloia A, Gualeni A, Lavatelli A, Giordano A: Assessment of oxygen uptake during the 6-minute walking test in patients with heart failure: preliminary experience with a portable device. Am Heart J 1997, 134(2 Pt 1):203-6.
5. Lipkin D, Scriven AJ, Crake T, Poole-Wilson PA: Six minute walking test for assessing exercise capacity in chronic heart failure. Br Med J (Clin Res Ed) 1986, 292(6521):653-5.
6. Lucas C, Stevenson LW, Johnson W, et al.: The 6-min walk and peak oxygen consumption in advanced heart failure: aerobic capacity and survival. Am Heart J 1999, 138(4 Pt 1):618-24.
7. Miyamoto S, Nagaya N, Satoh T, et al.: Clinical correlates and prognostic significance of six-minute walk test in patients with primary pulmonary hypertension. Comparison with cardiopulmonary exercise testing. Am J Respir Crit Care Med 2000, 161(2 Pt 1):487-92.
8. Opasich C, Pinna GD, Mazza A, et al.: Six-minute walking performance in patients with moderate-to-severe heart failure; is it a useful indicator in clinical practice? Eur Heart J 2001, 22(6):488-96.
9. Roul G, Germain P, Bareiss P: Does the 6-minute walk test predict the prognosis in patients with NYHA class II or III chronic heart failure? Am Heart J 1998, 136(3):449-57.
10. Starobin D, Kramer MR, Yarmolovsky A, et al.: Assessment of functional capacity in patients with chronic obstructive pulmonary disease:
correlation between cardiopulmonary exercise, 6 minute walk and 15 step exercise oximetry test. Isr Med Assoc J 2006, 8(7):460-3.
11. Zugck C, Kruger C, Durr S, et al.: Is the 6-minute walk test a reliable substitute for peak oxygen uptake in patients with dilated cardiomyopathy? Eur Heart J 2000, 21(7):540-9.
12. Rabe-Hesketh S, Skrondal A: Multilevel and Longitudinal Modeling Using Stata 2nd edition. College Station: Stata Press; 2008:553.
13. West B, Welch K, Gatecki A: Linear Mixed Models Chapman & Hall/CRC. New York; 2007.
14. STATA, editor: Data Management Reference Manual, Release 9 ed StataCorp LP, College Station; 2005.
15. West BT, Welch KB, Gatecki AT: Linear Mixed Models New York: Chapman & Hall/CRC; 2007.
16. Hall C, Figueroa A, Fernhall B, Kanaley JA: Energy expenditure of walking and running: comparison with prediction equations. Med Sci Sports Exerc 2004, 36(12):2128-34.
17. Eaton T, Young P, Milne D, Wells AU: Six-minute walk, maximal exercise tests: reproducibility in fibrotic interstitial pneumonia. Am J Respir Crit Care Med 2005, 171(10):1150-7.
18. Guyatt GH, Sullivan MJ, Thompson PJ, et al.: The 6-minute walk: a new measure of exercise capacity in patients with chronic heart failure. Can Med Assoc J 1985, 132(8):919-23.
19. Marin JM, Carrizo SJ, Gascon M, Sanchez A, Gallego B, Celli BR: Inspiratory capacity, dynamic hyperinflation, breathlessness, and exercise performance during the 6-minute-walk test in chronic obstructive pulmonary disease. Am J Respir Crit Care Med 2001, 163(6):1395-9.
20. Guyatt GH, Pugsley SO, Sullivan MJ, et al.: Effect of encouragement on walking test performance. Thorax 1984, 39(11):818-22.
21. Leung AS, Chan KK, Sykes K, Chan KS: Reliability, validity, and responsiveness of a 2-min walk test to assess exercise capacity of COPD patients. Chest 2006, 130(1):119-25.
22. McGavin CR, Gupta SP, McHardy GJ: Twelve-minute walking test for assessing disability in chronic bronchitis. Br Med J 1976, 1(6013):822-3.
23. Foster C, Jackson AS, Pollock ML, et al.: Generalized equations for predicting functional capacity from treadmill performance. Am Heart J 1984, 107(6):1229-3.
24. Wasserman K, Hansen JE, Sue DV, et al.: Principles of exercise testing and interpretation, including pathophysiology and clinical applications 4th edition. Philadelphia; Lea and Febiger; 2005.
25. Poole-Wilson PA: The 6-minute walk. A simple test with clinical application. Eur Heart J 2000, 21(7):507-8.
26. Enright PL, Sherrill DL: Reference equations for the six-minute walk in healthy adults. Am J Respir Crit Care Med 1998, 158(5 Pt 1):1384-7.
27. Ingle L, Goode K, Rigby ASR, et al.: Predicting peak oxygen uptake from 6-min walk test performance in male subjects with left ventricular systolic dysfunction. Eur J Heart Fail 2006, 8(2):198-202.
28. Humbert M, Sitbon O, Chaouat A, et al.: Pulmonary arterial hypertension in France: results from a national registry. Am J Respir Crit Care Med 2006, 173(9):1023-30.
Pre-publication historyThe pre-publication history for this paper can be accessed here:http://www.biomedcentral.com/1471-2466/10/31/prepub
doi: 10.1186/1471-2466-10-31Cite this article as: Ross et al., The six minute walk test accurately estimates mean peak oxygen uptake BMC Pulmonary Medicine 2010, 10:31
Received: 14 August 2009 Accepted: 26 May 2010 Published: 26 May 2010This article is available from: http://www.biomedcentral.com/1471-2466/10/31© 2010 Ross et al; licensee BioMed Central Ltd. This is an Open Access article distributed under the terms of the Creative Commons Attribution License (http://creativecommons.org/licenses/by/2.0), which permits unrestricted use, distribution, and reproduction in any medium, provided the original work is properly cited.BMC Pulmonary Medicine 2010, 10:31
Mean Peak VO ml kg Mean 6 MWD meters2 4 948 0 023( / / min) . . * ( )
(
= +SSEE ml kg1 1. / / min)