the shift in stages of the nutrition transition in the ... · the shift in stages of the nutrition...
TRANSCRIPT

Mal J Nutr 8(1): 109-124, 2002
The Shift in Stages of the Nutrition Transition in the Developing World Differs from Past Experiences! Barry M Popkin Carolina Population Center University of North Carolina Chapel Hill, University Square, North Carolina, USA ABSTRACT This paper explores the unique nutrition transition shifts in diet and activity patterns from the period termed the receding famine pattern to one dominated by nutrition-related noncommunicable diseases (NR-NCDs). The paper examines the speed and timing of these changes; unique components, such as the issue of finding both under- and over-nutrition in the same household; potential exacerbating biological relationships that contribute to differences in the rates of change; and political issues. The focus is on lower and middle income countries of Asia, Africa, the Middle East and Latin America. These changes are occurring at great speed and at earlier stages of these countries’ economic and social development. There are some unique issues that relate to body composition and potential genetic factors. The significance of the high number of persons exposed to heavy insults during pregnancy and infancy (fetal origins hypothesis) and the subsequent rapid shifts in energy imbalance remains to be understood. Countries that are still addressing major concerns of under-nutrition are not ready to address these NR-NCDs. These finding indicate that the developing world needs to give far greater emphasis to addressing the prevention of the adverse health consequences of this shift to the nutrition transition stage of the degenerative diseases. INTRODUCTION Scholars and policy-makers who focus on obesity and nutrition-related noncommunicable disease (NR-NCD) issues in the developing world often assert that the situation facing developing Countries is unique. But is the experience related to the rapid onset of obesity and NR-NCDs of the lower and middle income countries of Asia, Africa, the middle East, Latin America, and Oceana different from what occurred in the Western European countries, the United States (US), and Japan at a similar stage in their economic development? An exploration of the “differences” in the speed of the nutrition transition across the globe is beyond the scope of this paper but is certainly worthy of future exploration. This paper summarizes some arguments and evidence that lead us to assert the experience (rapid onset of obesity and NR-NCD) may be unique. Understanding this topic is important for planning a strategy to prevent obesity and its complications in the developing world. In this paper we focus on several ways the conditions in the higher income Western Europe countries, the US, and Japan differ from the lower and middle income countries. Essentially the key assertions are: 1. The speed of change appears unique due to the timing of the economic, technological and
social transformation now faced by lower and moderate income, transitional societies, and

Barry M Popkin
that faced by higher income, industrialized societies decades ago. 2. The unique issue of finding both under- and over-nutrition in the same household is
indicative of the different sets of stresses and societal changes currently facing lower and moderate income countries shifting to a pattern of NR-NCDs
3. The differences in the rates of change may be exacerbated by some biological relationships. 4. The politics differ, as does the capacity, of these countries to address the rapid increase in the
prevalence of NR-NCDs Assertion 1. The shifts in dietary and activity patterns and body composition seem to be occurring more rapidly The pace of the rapid nutrition transition shifts in diet and activity patterns from the period, termed the receding famine pattern, to one dominated by NR-NCDs seems to be accelerating in the lower and middle income transitional countries. We use nutrition rather than diet so that the term NR-NCD incorporates the effects of diet, physical activity and body composition rather than solely focus on dietary patterns and their effects. This is based partially on incomplete information that seems to indicate that the prevalence of obesity and a number of NR-NCD are increasing far much faster in the lower and middle income world than it has in the West. Another element is that the rapid changes in urban populations are much greater than that experienced a century or less ago in the West; yet another is the shift in occupation structure and the rapid introduction of the modern mass media. Underlying such changes is a general concern for rapid globalization as the root cause. Clearly, there are quantitative and qualitative dimensions to these changes. On the one hand, changes toward a high density diet, reduced complex carbohydrates and other important elements, and inactivity may be proceeding faster than in the past. The shift from labor intensive occupations and leisure activities toward more capital-intensive, less strenuous work and leisure is also occurring faster. On the other hand, qualitative dimensions related to multidimensional aspects of the diet, activity, body composition, and disease shifts may exist. Social and economic stresses people face and feel as these changes occur might also be included. At the start of the new millennium, scholars often feel as if the pace and complexity of life, reflected in all aspects of work and play, are increasing exponentially; there are also unanticipated developments, new technologies, and the impact of a very modern, high-powered communications system. It is this sense of rapid change that makes it so important to understand what is happening and anticipate the way changes in patterns of diet, activity, and body composition are occurring. While the penetration and influence of modern communications, technology and economic systems-related to what is termed globalization-have been a dominant theme of the last few decades, there seem to be some unique issues that have led to a rapid increase of ‘globalization and its impact.” P1acing the blame on globalization is, on the one hand, focusing on broad and vaguely measured set of forces; this ignores the need to be focused and specific which would allow us to develop potentially viable policy options. It is difficult to measure each element of this globalization equation and its impact. These processes certainly have been expanded as indicated by enhanced free trade, a push toward reduction of trade barriers in the developing world, and the increasing penetration of international corporations into the commerce in each country (measured by share of GNP or manufacturing). Similarly, other

The Shift in Stages of the Nutrition Transition is Accelerating
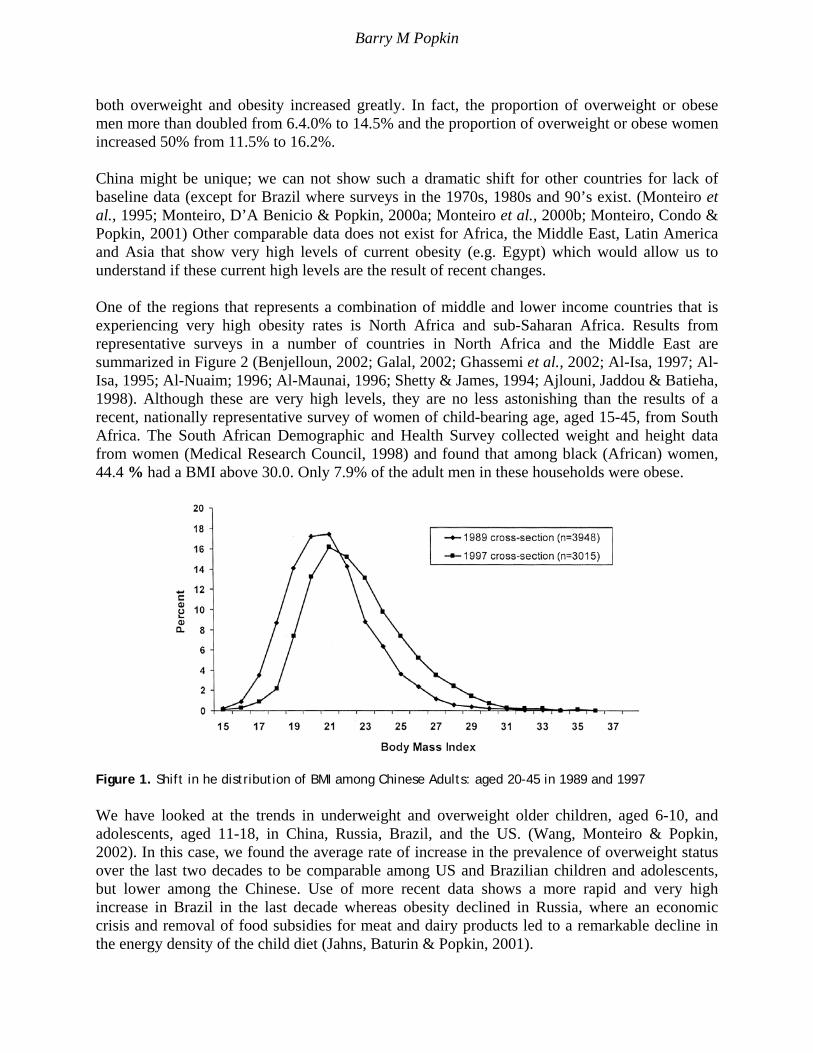
economic issues related to enhanced value given to market forces and international capital markets are important. Equally, the increasing access to Western media, the removal of communication barriers enhanced by the World Wide Web, cable TV, mobile telephone systems, etc. is important. The accelerated introduction of western technology into the manufacturing, basic sectors of agriculture, mining, and services is also a key element. Another way to consider the types of changes the developing world is facing is to consider an urban squatter’s life and a rural villager’s life in China 20 years ago, and today. During the 1970s, food supply concerns still existed; there was no television; limited bus and mass transportation, little food trade, minimal processed food existed, and most rural and urban occupations were very labor intensive. Today, work and life activities have changed: small gas-powered tractors are available; modern industrial techniques are multiplying; offices are quite automated; soft drinks and many processed foods are found everywhere; TV’s are found in about 89% of households (at least a fifth of whom are linked to Hong Kong Star and western advertising and programming); younger children do not ride bicycles, and mass transit has become heavily used. Multiply such changes by similar ones occurring in much of Asia, North Africa, the Middle East, Latin America, and many areas (particularly cities) in sub-Saharan Africa and it is evident that the shift from a subsistence economy to a modern, industrialized one occurred in a span of 10-20 years; whereas, in Europe and other industrialized high income societies, this occurred over many decades or centuries. To truly measure and examine these issues, we would need to compare changes in the 1980-2000 period, for countries that are low and middle income, with changes that occurred a half century earlier for the developing world. However, data on diet and activity patterns are not available and there is only minimal data on NR-NCDs and obesity. The elements of the nutrition transition that we know to be negatively linked with NR-NCDs are obesity; adverse dietary changes (e.g. shifts in the structure of diet toward a greater role for higher fat and added sugar foods, reduced fruit and vegetable intake, reduced fiber intake, greater energy density, and greater saturated fat intake); and reduced physical activity in work and leisure. We focus on these first, and then a few select underlying factors. The causes of these elements of the nutrition transition are not as well understood as are the trends in each of them. In fact, there are few studies attempting to study the causes of such changes and there are only a few data sets that are equipped to allow such crucial policy analyses to be undertaken. Obesity trends Many of the papers in this volume, and others we have published, highlight the trends in obesity (Popkin & Doak, 1998). In this paper, I present one set of comparable results for children and adolescents and another for Chinese adults to highlight the rapidity of change. In China, we examined the shifts in body composition among adults aged 20-45 (Bell, Ge & Popkin, 2001) over an eight-year period. As we have shown (Bell et al., 2001) not only did mean Body Mass Index (BMI) increase, but the shape of the BMI distribution curve changed over the 8-year period (Figure 1). From 1989 to 1997 the proportion of underweight men and women dropped considerably and the prevalence of
Barry M Popkin
both overweight and obesity increased greatly. In fact, the proportion of overweight or obese men more than doubled from 6.4.0% to 14.5% and the proportion of overweight or obese women increased 50% from 11.5% to 16.2%. China might be unique; we can not show such a dramatic shift for other countries for lack of baseline data (except for Brazil where surveys in the 1970s, 1980s and 90’s exist. (Monteiro et al., 1995; Monteiro, D’A Benicio & Popkin, 2000a; Monteiro et al., 2000b; Monteiro, Condo & Popkin, 2001) Other comparable data does not exist for Africa, the Middle East, Latin America and Asia that show very high levels of current obesity (e.g. Egypt) which would allow us to understand if these current high levels are the result of recent changes. One of the regions that represents a combination of middle and lower income countries that is experiencing very high obesity rates is North Africa and sub-Saharan Africa. Results from representative surveys in a number of countries in North Africa and the Middle East are summarized in Figure 2 (Benjelloun, 2002; Galal, 2002; Ghassemi et al., 2002; Al-Isa, 1997; Al- Isa, 1995; Al-Nuaim; 1996; Al-Maunai, 1996; Shetty & James, 1994; Ajlouni, Jaddou & Batieha, 1998). Although these are very high levels, they are no less astonishing than the results of a recent, nationally representative survey of women of child-bearing age, aged 15-45, from South Africa. The South African Demographic and Health Survey collected weight and height data from women (Medical Research Council, 1998) and found that among black (African) women, 44.4 % had a BMI above 30.0. Only 7.9% of the adult men in these households were obese.
Figure 1. Shift in he distribution of BMI among Chinese Adults: aged 20-45 in 1989 and 1997 We have looked at the trends in underweight and overweight older children, aged 6-10, and adolescents, aged 11-18, in China, Russia, Brazil, and the US. (Wang, Monteiro & Popkin, 2002). In this case, we found the average rate of increase in the prevalence of overweight status over the last two decades to be comparable among US and Brazilian children and adolescents, but lower among the Chinese. Use of more recent data shows a more rapid and very high increase in Brazil in the last decade whereas obesity declined in Russia, where an economic crisis and removal of food subsidies for meat and dairy products led to a remarkable decline in the energy density of the child diet (Jahns, Baturin & Popkin, 2001).

The Shift in Stages of the Nutrition Transition is Accelerating
Figure 2. Obesity patterns in North Africa and the Middle East Dietary changes: shift in the overall structure over time The diets of the developing world are shifting equally rapidly. We do not have good data for most countries on total energy intake, but we do have reasonable data to examine shifts in the structure of the diet. Food balance data was used to examine the shift, over time, in the proportion of energy from fat. (Quo et al., 2000). The dramatic changes in the aggregate income-fat relationship from 1962 to 1990 are displayed in Figure 3 by the estimated regression lines based on cubic polynomial regressions. (Quo et al., 2000). Most significantly, even the poor nations had access to a relatively high-fat diet by 1990, when a diet deriving 20% of energy (kcal) from fat was associated with countries having a GNP of only $750 per capita. Whereas in 1962, the same energy diet (20% from fat) was associated with countries having a GNP of $1475 (both GNP values in 1993 dollars). This dramatic change arose from a major increase (from 10 to 13%) in the consumption of vegetable fats by poor and rich nations; similar increases (3-6%) also occurred in middle and high income nations. At the same time there were decreases in the consumption of fat from animal sources for all except the low income countries. The availability of animal fats continued to be linked to income, though less strongly in 1990 than 1962. These decreases, combined with the increase in vegetable fat intake for all income countries, resulted in an overall decrease in fat intake for moderate income countries of about 3%, but an increase of about 4-5% for low and high income countries. Figure 3 indicates these substantial shifts in the relationships between GNP and the composition of diets over time.

Barry M Popkin
Figure 3. Relationship between the percentage of Energy from fat and GNP per capita, 1962 and 1990 Vegetable fats in 1990 accounted for a greater proportion of dietary energy than animal fats for countries in the lowest 75% of countries (all of whom have incomes below 5800 per capita) of the per capita income distribution. The absolute level of vegetable fat consumption increased but there remained at most a weak association of GNP and vegetable fat intake in these aggregate data. The change in edible vegetable fat prices, supply, and consumption is unique because it equally affected rich and poor countries but the net impact is relatively much greater on low income countries. We have shown elsewhere that there is also an equally large and important shift in the proportion of energy from added sugar in the diets of lower income countries (Drewnowski & Popkin, 1997). When we specifically examine the combined effect of these various shifts in the structure of rural and urban Chinese diets (Popkin Lu & Zhai, 2002) we find an upward shift in the energy density of the foods consumed. In this study, the kcal of energy intake from foods and alcohol per 100 grams of food in both urban and rural Chinese adult diets increased over 10% (to 2.42) between 1989 and 1997. These are very rapid shifts in energy density. It is important to note that this value of 2.42 is not comparable with the normal measure of energy density of the diet. The normal method includes full measures of all beverages while the Chinese Food Composition Table, from which this data was extracted, measures only a few beverages (milk, coconut juice, sugarcane juice, spirits, beer, wine, champagne, and brandy) and excludes many beverages, particularly tea and coffee. There are a number of clinical studies that varied the energy density of the diet in ad libitum studies. Each finds higher density increases, often only an increase as low as from 1 kcal/gram to 1.3 kcal per gram, can increase total energy intake (Drewnowski, 1998; Bell et al., 1998). For these reasons, energy density changes in China, and most likely in other developing countries, are critical components of dietary change to be monitored.

The Shift in Stages of the Nutrition Transition is Accelerating
Physical activity shifts are equally rapid There is much less data and analysis on the shifts, over time, in energy expenditures and physical activity patterns in general. Some published studies have demonstrated the remarkable shift in the structure of occupations, as well as in the activities performed in each occupation (Popkin, 1998; Popkin, 1999). However, we have few publications or data that have documented either physical activity patterns or precisely measured data on the physical activity component of total energy expenditures for adults and children in the developing world. There is no basis to state that there have been shifts in the other components of energy expenditures (e.g. basal metabolic rates), so we focus on physical activity except for selected disease shifts (e.g. reductions in parasitic infection and other infectious disease which might have some independent effect on energy expenditures). We have relied on the China Health and Nutrition Survey (CHNS) results with adult physical activity patterns measured over the 1989-97 period to examine this topic. Figure. 4 shows a remarkable downward shift for the proportion of adults, aged 20-45, whose daily activity profile categorizes them in a moderate category, compared to those in the light category over the last decade. In other works, we have shown that light and moderate activity profiles are linked with greater obesity (Bell, Ge & Popkin, 2001; Pacratukul et al., 1998).
Figure 4. The physical activity profiles of urban Chinese adults aged 20-45, 1989-97 Rapid social change is important: urbanization, rapid demographic change, and other behavioral changes are occurring simultaneously Our focus in this section is on the ways diets have shifted in urban areas and with other socio-demographic changes in the past several decades, rather than how the shifts of the age structure and spatial distribution of the population in the developing world has changed dramatically in the past three decades. (Watkins, 1987). Although we do not address these issues here, there are several points to note about these key elements:

Barry M Popkin
a Rapid reductions in fertility have enhanced the shift in the age distribution. b Urbanization continues unabated in Asia and Africa. More poor will reside in urban than
rural areas in future decades. c Economic changes, in particular increased income and income inequality, appear to define
changes in many regions of the developing world. d Globalization of mass media is occurring at an earlier stage of economic development than
faced on higher income countries in the past. The two major themes in this section: (1) rapid change for some and (2) how greater social inequality between rich and poor define the current nutrition transition facing lower and middle income countries, will be addressed. Urbanization In other published work we have shown how the structure of diet has shifted markedly as populations have urbanized (Drewnowski & Popkin, 1997). This relationship will, by itself, shift the structure of diet significantly at the national level as urbanization continues and as the proportion of the population in urban areas grows. Structural shifts in income-diet relationships are occurring Economists speak of two types of behavioral change. One relates to shifts in the composition of society regarding the plurality of the educated, rich, or urban residents. The other type relates to the way persons with different characteristics behave, and in our case, economic behavior. This latter type, termed changes in behavior, means that for the same level of education or income, a person would buy different amounts or types of commodities at different points in time. Research conducted in China shows there have been profound behavioral shifts during the last decade (i.e. for each extra dollar of income, additional high fat foods are purchased vs. what would have been purchased in previous years for the equivalent extra dollar) (Guo et al., 2000). Economists speak of this effect as one that shows how the decision-making demand pattern for food has changed so for the same income level the patterns of demand have changed significantly from earlier periods. Figure 5 shows how extra income in China affects the poor differentially than the rich, enhancing fat intake of the poor more than the rich; the changes from 1989 to 1993 were statistically significant for both groups. The explosion in access and exposure to mass media may very well have created this situation. Mass media There is no doubt that access to modern mass media has grown very rapidly, particularly in the last decade. Elsewhere, we have shown worldwide trends. It is most very useful to look at the proportion of households in a country that own television (TV) sets to gain insight into this topic. Again we use CHNS data to reflect the types of changes in one setting. Figure 6 shows the proportion of low, middle and upper income tertile households that owned TVs during the 1989-97 period. Overall, 88.5% of Chinese households in the CHNS sample owned TVs in 1997. It is important to note that in China, not only the proportion of people with access to television was shifting, but also the types of programs and access to western influences were shifting. In the

The Shift in Stages of the Nutrition Transition is Accelerating
1980s, cable systems in China did not provide outside programming but by 1997 many provinces provided access to China Star, a Hong Kong television system that relies heavily on US and British programming and provides modern TV advertising.
Figure 5. Changes in the income elasticity for edible oil food consumption in China (increases in
income elasticity between 1989-93) Again, while extensive data is not available on the proportions of Chinese households with access to mass media 30-70 years ago, we certainly know that the penetration into Chinese households in 1997 is far greater than it was into US households 50 years ago; TV was in its infancy then.
Figure 6. TV ownership in China, 1989-97 (% of Chinese households who own TV, CHNS 1989-97) Assertion 2. The joint presence of under nutrition and overweight seems important. There are two related issues: (1) at the societal level, endemic levels of undernutrition and over-

Barry M Popkin
nutrition exist in many countries, and (2) often at the same time in the same household. India is a prime example of the first point. One well-designed representative survey (the National Family Health Survey, 1998-99) of nearly 83,000 women, aged 15-45, found that one main problem continues to be under-nutrition, with 36% of the women having a low (<18.5) Body Mass Index. (Indian Institute of Population Sciences, 2000; Griffiths & Bentley, 2000) However, 11% of the women can be classified as overweight (BMI> 25) and 2% are obese (BMI > 30). There were significant differences between urban and rural residents with 41% of the rural women having a low BMI contrasted with 23% of the urban women; and only 6% of the rural women were overweight or obese, compared to 24% for urban women. Many other examples abound; South Africa has a very high rate of adult female overweight and obesity (44%) and also large proportions of malnourished children (Medical Research Council, 2000). The work of Doak and others to highlight the large proportion of households in which persons with both low and high BMIs co-exist, reflective of under-nutrition and over-nutrition, is important. She and her colleagues have shown that this is the case in both rich and poor families from many developing countries. A representative sample in Indonesian households which revealed that the prevalence of almost 10% of all households had members with both low and high BMIs is most interesting (Doak, Monteiro & Popkin, 2001; Doak et al., 2000). The fact that low income households in many regions of the world have high levels of overweight members is indicative of a rather new phenomenon in the developing world, one of household food insecurity coupled with an energy imbalance. The exact implications of this phenomenon need to be much more fully understood. Assertion 3. Is the biology different? Or rather, do we have different social structures and body composition patterns that affect BMI-disease relationships? Or are there genetic variants that are important? There are a number of different ways these questions could be answered in the affirmative. One is if the body composition and other unmeasured race-ethnic factors affect susceptibility to NR-NCDs. Another might be if previous disease patterns (e.g. the presence of malaria or other tropical diseases) led to disease patterns that predisposed the population to certain problems. One component of this might be the fetal insult syndrome developed and popularized by Barker (1998; 2001). There has been a growing body of research that shows the international standards, used to delineate who is overweight and obese, are not appropriate for many large subpopulations in the world. For instance, a BMI of 25 in an Asian adult appears to have a far greater adverse metabolic effect than in a Caucasian adult (Deurenberg et al., 1998). In fact, the World Health Organization (WHO) and the International Obesity Task Force (IOTF) formed a group of scientists and agencies in Asia to review this topic. This group held international meetings and has proposed a lower BMI cutoff for Asians of 23 for overweight and of 25 for obesity (International Diabetes Institute, 2000). In one paper comparing China, the Philippines and US Hispanics, Blacks and whites, the odds of being hypertensive were higher for Chinese men and women compared the other subpopulation groups at lower BMI’s in the 23-25 range (Bell et al., in press). Ethnic differences in the strength of the association between BMI and disease

The Shift in Stages of the Nutrition Transition is Accelerating
outcomes warrants further consideration. Zimmet and others who have focused on this issue as it relates to lower income countries have felt that the highest genetic susceptibility for adult-onset diabetes was for Pacific Islanders, American Indians, Mexican Americans and other Hispanics, and Asian Indians. Those with modest genetic susceptibility include Africans, Japanese, and Chinese (Zimmet, 1991; Zimmet, McCarty & deCourten, 1997) .The age of onset (usually made after the age of 50) of non-insulin dependent diabetes mellitus (NIDDM) is much lower for these susceptible populations and it appears that the prevalence is higher for a given level of obesity and waist-hip ratio. Zimmet (1991; Zimmet et al., 1997) summarizes a large selection of literature that has explored these issues relating to diabetes among susceptible populations. What is not clear is how much of this difference between sub-populations BMI-diabetes or other BMI-morbidity relationships is a function of differences of body composition, metabolic or genetic factors, or social causes. Elsewhere we have shown that part of the apparent race- hypertension relationship may also be explained partially by socioeconomic status (Bell, Adair & Popkin, 2002) There is another pathway related to the role of previous health problems for which we have less understanding and no real documentation of its impact (e.g. malnutrition that caused a virus to mutate, parasitic infections that affected long-term absorption patterns, or a parasite that is linked with an unknown genotype- comparable to sickle cell anemia and its evolutionary linkage with malaria). We have no basis for speculation about this potential pathway. However, the final pathway-the effect of fetal and infant insults on subsequent metabolic function-is one that appears to be a critical area. If the rapid shifts toward positive energy imbalance are occurring concurrently with higher levels of low birth weight in a population, then this becomes a much more salient aspect of this argument. In the developing world, where intrauterine malnutrition rates are high and a high prevalence of nutrition insults during infancy exist, the work of Barker and many others portends important potential effects on the prevalence of NR-NCDs in the coming decades (Barker, 2001; Adair, Kuzawa & Borja, 2002). Not only is there an emerging consensus that fetal insults, in particular with regard to thin, low birth weight infants who subsequently face a shift in the stage of the transition and become overweight, are linked with increased risk of the NR-NCDs but infancy may equally be a period of high vulnerability. Three new studies by Hoffman et al. (2000a; 2000b; 2002c) suggest that fat metabolism of stunted infants is impaired to the extent that this could lead to increased obesity and other metabolic shifts. Other work on the role of stunting on obesity had suggested such an effect, but Hoffman’s work suggests the mechanism, and fits with the correlational work (Popkins et al., 1996). Assertion 4. The politics are different in the developing world and lead to a program and policy dilemma! The capacity to address the rapid increase in NR-NCDs does not exist as it did at this stage in higher income countries! In the developing world countries where the politicians have focused for decades on issues of hunger and infectious diseases, we face a major challenge in directing the focus on prevention of

Barry M Popkin
obesity and NR-NCDs. The rapidity of the increases in obesity and many NR-NCDs are indications of the need for preventive action. The ultimate challenge is to get countries that are poor to develop a preventive public health agenda rather than relying on subsequent treatment. The examples from Latin America, where hunger-oriented programs that ignored the issues of obesity actually led to increased obesity (Uauyet, Albala & Kain, 2001) strengthen the arguments for this approach. Another concern is the large proportion of lower income households with separate individuals who have under and overweight at the same time. The key point is the findings of Doak et al. (2000; 2001) findings of large proportions of households with underweight and overweight members simultaneously. Finally, the NR-NCDs increased in prevalence slowly in the higher income countries; medical systems had time to adjust to the needs; public health systems were able to begin addressing the situations, and individual treatments could he undertaken because incomes were higher. Effective public health interventions have rarely been adopted. The collective wisdom of the Bellagio meeting will focus on this topic as one of the more important issues that ultimately needs to be addressed. CONCLUSION The shift toward the nutrition transition stage linked with a high level of NR-NCDs is finding most lower and middle income countries unprepared. The changes are occurring very rapidly and the costs, in terms of health, are great. Large populations are still undernourished and programs and policies to address these new changes in a preventive way are not being developed. Further understanding of the causes and consequences of these shifts must be understood and far greater priority needs to be given to the area of prevention. ACKNOWLEDGMENTS This study was supported in part by grants from the US National Institutes of Health (NIH) (R01-HD30880 and R01-HD38700). I thank Colleen Doak and Carlos Monteiro for their excellent in-depth comments on a draft of this paper, Ms. Frances Dancy for her administrative assistance, Bill Shapbell for editorial assistance and Mr. Tom Swasey for in the preparation of the graphs assistance. REFERENCES Adair LS, Kuzawa C & Borja JR (2002). Maternal Energy Stores and Diet Composition during
Pregnancy Program Adolescent Blood Pressure. Circulation (In press).

The Shift in Stages of the Nutrition Transition is Accelerating
Ajlouni K, Jaddou H & Batieha (1998) Obesity in Jordan. Int J Obes 22: 624-8. Al-Isa AN (1995). Prevalence of obesity among adult Kuwaitis: a cross-sectional study. Int J
Obes 19: 431-3. Al-Isa AN (1997). Changes in body mass index (BMI) and prevalence of obesity among
Kuwaitis. 1980-1994. Int J Obes 21: 1093-9. Al-Mannai A, Dickerson, JWT, Morgan, JB & Khalfan, H (1996). Obesity in Bahraini Adults.
Journal of the Royat Society of Heatth. 116: 30-40. Al-Nuaim AR, Al-Rubeaan K, Al-Mazrou Y, Al-Attas O, Al-Daghari N & Khoja T (1996). High
prevalence of overweight and obesity in Saudi Arabia. Int J Obes 20: 547-52. Barker DJP (1998). Mothers, babies and disease in later life. Edinburgh: Churchill Livingstone. Barker DJP (2001). Fetal origins of cardiovascular and lung disease. New York: Marcel Dekker,
Inc. Bell AC, Adair LS & Popkin BM (2002). Clarifying the association between socioeconomic
status and newly diagnosed hypertension within and between ethnic groups. Bell AC, Adair LS & Popkin BM (in press) Ethnic differences in the association between body
mass index and hypertension Am J Epidemiol. Bell C, Ge K & Popkin BM (2001). Weight gain and its predictors in Chinese adults. Int J of
Obes 25: 1079-86. Bell EA, Castellanos VII, Pelkman CL, Thorwart ML & Rolls BJ (1998). Energy density of
foods affects energy intake in normal-weight women. Am J Clin Nutr, 67: 412-20. Benjelloun S (2000). Nutritional transition in Morocco. Public Health Nutr (In Press). Deurenberg P, Yap M & Staveren WA (1998) Body mass index and percent body fat: a meta
analysis among different ethnic groups. Int J Obesity 22(12): 1164-71. Doak C, Adair LS, Monteiro C & Popkin BM (2000). Overweight and underweight co-exists in
Brazil, China, and Russia. J Nutr 130: 2965-80. Doak C, Monteiro C & Popkin BM (2001). Co-existing overweight and underweight within
households is related to the nutrition transition., Chapel Hill: University of North Carolina.
Drewnowski A & Popkin BM (1997). The Nutrition Transition: New Trends in the Global Diet.
Nutr Rev 55: 31-43.

Barry M Popkin
Drewnowski A (1998). Energy density, palatability, and satiety: implications for weight control. Nutr Rev 56: 347-53.
Galal OM (2002) The nutrition transition in Egypt: obesity, undernutrition and the food
consumption context. Public Health Nutr (In Press). Ghassemi H, Harrison G, Mohammad K & Balaa ALNX (2002). An accelerated nutrition
transition in Iran. Public Health Nutr (In Press). Griffiths PL & Bentley ME (2000) The nutrition transition is underway in India. J Nutri. Guo X, Mroz TA, Popkin BM & Zhai F(2000). Structural changes in the impact of income on
food consumption in China, 1989-93. Econ Dev Cult 48: 737-60. Hoffman DJ, Sawaya AL, Coward WA, Wright A, Martins PA, de Nascimento C, Tucker KL &
Roberts SB (2000a). Energy expenditure of stunted and nonstunted boys and girls living in the shantytowns of Sao Paulo, Brazil. Am J Clin Nutr 72: 1025-31.
Hoffman DJ, Roberts SB, Verreschi I, Martins PA, de Nascimento C, Tucker KL & Sawaya AL
(2000b). Regulation of energy intake may be impaired in nutritionally stunted children from the shantytowns of Sao Paulo, Brazil. J Nutr 130: 2265-70.
Hoffman DJ, Sawaya AL, Verreschi I, Tucker KL & Roberts SB (2000c). Why are nutritionally
stunted children at increased risk of obesity? Studies of metabolic rate and fat oxidation in shantytown children from Sao Paulo, Brazil. Am J Clin Nutr 72: 702-7.
Indian Institute of Population Sciences. (2000). National Family Health Study 1998-99. Mumbai,
India: Indian Institute of Population Sciences 1-328. International Diabetes Institute (2000). The Asia-Pacific perspective: redefining obesity and its
treatment. Australia: Health Communications Australia Pty Limited. Jahns L, Baturin A & Popkin BM (2001). Post-soviet changes in diet and nutritional status of
Russian children. Medical Research Council, Department of Health and Macro International (2000). South African
Demographic and Health Survey 1998: Preliminary Report. Capetown: South African Medical Research Council.
Monteiro CA, Mondini L, de Souza ALM, Popkin BM (1995). The nutrition transition in Brazil.
Eur J Clin Nutr 49: 105-13. Monteiro CA, D’ABenicio MH, Popkin BM (2000a). Economic and cultural-educational
predictors of overweight in urban and rural Brazilian women. Rev Brasilian Nutr Clin 15(1): 253-60.

The Shift in Stages of the Nutrition Transition is Accelerating
Monteiro CA, D’A Benicio MH, Conde WL & Popkin BM. (200Gb) Shifting obesity trends in Brazil. Eur J Clin Nutr 54: 342-46.
Monteiro CA, Conde WL, & Popkin BM. (2001). Independent effects of income and education
on the risk of obesity in the Brazilian adult population. J Nutr 131: 881S-6S. Paeratakul S, Popkin BM, Ge K, Adair LS & Stevens J (1998). Changes in diet and physical
activity affect the body mass index of Chinese adults. Int J Obes 22: 424-32. Popkin BM (1998). The nutrition transition and its health implications in lower income
countries. Public Health Nutr l: 5-21. Popkin BM (1999). Urbanization, lifestyle changes and the nutrition transition. World
Development 27: 1905-16. Popkin BM & Doak C (1998). The obesity epidemic is a worldwide phenomenon. Nutr Rev 56:
106-14. Popkin BM, Lu B & Zhai F. (2002). Understanding the nutrition transition: Measuring rapid
dietary: changes in transitional countries public health nutrition. Public Health Nutr (In press).
Popkin BM, Richards MK, Monteiro C (1996). Stunting is associated with overweight in
children of four nations that are undergoing the nutrition transition. J Nutr 126: 3009-16. Shetty PS & James WPT (1994). Chapter 7: BMI distribution in developed and developing
countries. In Body Mass Index: a Measure of Chronic Energy Deficiency in Adults. Rome: Food and Agriculture Organization of the United Nations;. FAO Food and Nutrition Papers No. 56.
Uauyet R. Albala C & Kain J (2001). Obesity trends in Latin America: Transiting from under-to
overweight. J Nutr 131: 893S-899S. Wang Y, Monteiro C & Popkin BM (2002) Trends of overweight and underweight in Children
and Adolescents in the United States, Brazil, China and Russia Am J Clin Nutr (in press). Watkins SC. (1987) The fertility transition: Europe and the Third World compared. Sociological
Forum 2: 645-73. Zimmet PZ (1991). Kelly West Lecture. Challenges in diabetes epidemiology from west to the
rest. Diabetes Care 15: 232-52. Zimmet PZ, McCarty DJ & de Courten MP (1997). The global epidemiology of non-insulin-
dependent diabetes mellitus and the metabolic syndrome. J Diabetes Complications 11(2): 60-8.