the shared cm project version 3.0 (august 2017) · page 1 of 31 the shared cm project – version...
TRANSCRIPT

Page 1 of 31
The Shared cM Project – Version 3.0 (August 2017) Blaine T. Bettinger
The Shared cM Project is a collaborative data collection and analysis project created to understand the ranges of shared centimorgans associated with various known relationships. For this update, total shared cM data for more than 25,000 known relationships were provided.
For more information:
• The Shared cM Project - http://thegeneticgenealogist.com/2015/05/29/the-shared-cm-project/
• Autosomal DNA Statistics - http://isogg.org/wiki/Autosomal_DNA_statistics
• Bettinger, Blaine T., The Shared cM Project: A Demonstration of the Power of Citizen Science. Journal of Genetic Genealogy, 2016, pgs. 38-42. http://jogg.info/pages/vol8/editorial/bettinger/bettinger-sharedcMProject.html
To provide your data for subsequent updates:
• http://thegeneticgenealogist.com/2015/03/04/collecting-sharing-information-for-known-relationships/
Possible issues with user-provided data:
• Data entry errors – some of the information entered by participants is affected by data entry errors (for example, a longest segment greater than the total shared cM). When these entries could be definitively determined, they were removed.
• Incorrect relationships (known or unknown) – some relationships were almost certainly entered incorrectly, which might be due to misunderstandings of “removed” relationships in genealogy. Other relationship errors were clearly due to misattributed parentage events resulting in the believed relationship being incorrect.
• Endogamy and Pedigree Collapse - Some relationships will be affected by endogamy and/or pedigree collapse, which will increase the amount of DNA shared by test-takers having a certain genealogical relationship. Although the collection form requests information about known endogamy and/or pedigree collapse, many contributors will not be aware of the endogamy and pedigree collapse in their tree. Additionally, some participants may have selected only one relationship although there were several known relationships.
• Company Thresholds – Each of the DNA testing companies applies a different matching threshold to maximize the identification of genetic cousins while minimizing false positives. These thresholds may impact the total amount of DNA shared by two test-takers, especially at more distant relationships.

The Shared cM Project – Version 3.0 (August 2017)
Page 2 of 31
Using the Shared cM Project
Step 1: How much DNA do two people share?
• Determine how much DNA you share with a genetic match
• In this AncestryDNA example, I share 95 cM with this match
Step 2: Which Cluster(s) does the total shared cM fit into?
• Review the Cluster Chart to see into which Cluster(s) the total shared cM fits, using the 95th percentiles
• In this example, 95 cM fits into each of Clusters #6, 7, and 8 (that is, it falls within the 95th percentile
range for each of these Clusters).
Step 3: Which Cluster(s) the total shared cM best fits into
• Based on the average, which Cluster(s) does the total shared cM most closely match?
• In this example, 95 cM best fits into Clusters #6 and 7 (i.e., 95 cM is closest to the average for these
Clusters)
Step 4: Review the histograms for the relationships in the best fit Cluster(s)
• Using the relationships listed in the Cluster(s), go to the histograms and see which relationship(s)
the total shared cM is nearest the peak of the histogram. Note that this only provides clues as to the
most likely relationships; your actual relationship may vary.
• For this example, for which relationships in Clusters #6 and 7 is 95 cM closest to the peak of the
histogram?
This method helps you narrow in on most likely relationships,
but does not definitely identify a specific relationship.

The Shared cM Project – Version 3.0 (August 2017)
Page 3 of 31
Table 1. The Cluster Chart
The average, minimums, and maximums for each Cluster were calculated using every submission for the relationships within that Cluster, rather than
averaging the previously calculated averages for those relationships. Minimums were automatically set to “0 cM” for Clusters 6-10.

The Shared cM Project – Version 3.0 (August 2017)
Page 4 of 31
Figure 1. The Relationship Chart
NOTE: for this and other charts or diagrams in this document, the minimum was automatically set to “0 cM” for relationships more distant than Half 2C, and averages were determined only for relationships in which DNA was shared.
Larger version at: https://isogg.org/wiki/Autosomal_DNA_statistics

The Shared cM Project – Version 3.0 (August 2017)
Page 5 of 31
The Shared CM Project – Version 3.0 (August 2017) Blaine T. Bettinger
Histograms
Histogram = a graphical representation of the distribution of numerical data
The following steps are followed to create a histogram:
1. Divide entire range of total shared cM (from the smallest amount to the largest amount) into a series of intervals of equal size (called “bins”); and
2. Count how many data points fall within each of the intervals. How to read these histograms:
The minimum and maximum are for the 99th percentile when available (thus there may be values below the minimum and below the maximum, which should be considered outliers)
These are “bins,” ranges of total
shared cM. For example, a total of 203
data entries are in the interval of
2632.2 to 2692.1 cM for this
relationship (siblings).
The number at the top of each bar is
the total number of data entries for
each interval (see “bin,” below). For
example, 203 data entries are in the
interval of 2632.2 to 2692.1 cM.

The Shared cM Project – Version 3.0 (August 2017)
Page 6 of 31
Table 2. Relationship Histograms o NOTES:
o Data for the Min, Average, and Max columns is the 99th percentile where available, otherwise it is the 95th percentile (see Table 3 for more information). The data for the histograms contain all submissions (including outliers) for the relationship.
o The minimum was automatically set to 0 cM for relationships more distant than Half 2C, and averages were determined only for relationships in which DNA was shared. Because the data is biased toward relationships in which DNA was shared, an analysis of the frequency of submissions in which the shared DNA was 0 cM was not performed.
o The total number of submissions (provided in the column marked “#”) may include MyHeritage submissions, which were not analyzed because there wasn’t enough data.
Relationship # Min Average Max Histogram
Parent/Child 1378 3330 3487 3720 (histogram not necessary)
Sibling (Cluster #1)
(Although siblings should share 50% of their DNA,
similar to parent/child, the testing companies only report sharing of half-identical regions even
though siblings share fully-identical regions. As a
result, siblings are incorrectly reported to
share less than 50% of their DNA)
1345 2209 2629 3384

The Shared cM Project – Version 3.0 (August 2017)
Page 7 of 31
Relationship # Min Average Max Histogram
Aunt/Uncle/Niece/Nephew (Cluster #2)
1411 1349 1750 2175
Grandparent/Grandchild (Cluster #2)
611 1156 1766 2311

The Shared cM Project – Version 3.0 (August 2017)
Page 8 of 31
Relationship # Min Average Max Histogram
Half Sibling (Cluster #2)
451 1317 1783 2312
1C (Cluster #3)
1512 553 874 1225

The Shared cM Project – Version 3.0 (August 2017)
Page 9 of 31
Relationship # Min Average Max Histogram
Great- Aunt/Uncle/Niece/Nephew
(Cluster #3) 413 251 914 2108
Great-Grandparent/Great
Grandchild (Cluster #3)
61 464 881 1486 (not enough data for a histogram)
Half Aunt/Uncle/Niece/Nephew
(Cluster #3) 275 500 891 1446

The Shared cM Project – Version 3.0 (August 2017)
Page 10 of 31
Relationship # Min Average Max Histogram
1C1R (Cluster #4)
1594 141 439 851
Great-Great-
Aunt/Uncle/Niece/Nephew (Cluster #4)
25 191 427 885 (not enough data for a histogram)
Half 1C (Cluster #4)
177 137 457 856

The Shared cM Project – Version 3.0 (August 2017)
Page 11 of 31
Relationship # Min Average Max Histogram
Half Great- Aunt/Uncle/Niece/Nephew
(Cluster #4) 44 125 432 765 (not enough data for a histogram)
1C2R (Cluster #5)
481 43 229 531
2C (Cluster #5)
1590 46 233 515

The Shared cM Project – Version 3.0 (August 2017)
Page 12 of 31
Relationship # Min Average Max Histogram
Half 1C1R (Cluster #5)
138 57 226 530
Half Great-Great- Aunt/Uncle/Niece/Nephew
(Cluster #5) 15 12 187 383 (not enough data for a histogram)
1C3R
(Cluster #6)
38 0 123 283 (not enough data for a histogram)
The Shared cM Project – Version 3.0 (August 2017)
Page 13 of 31
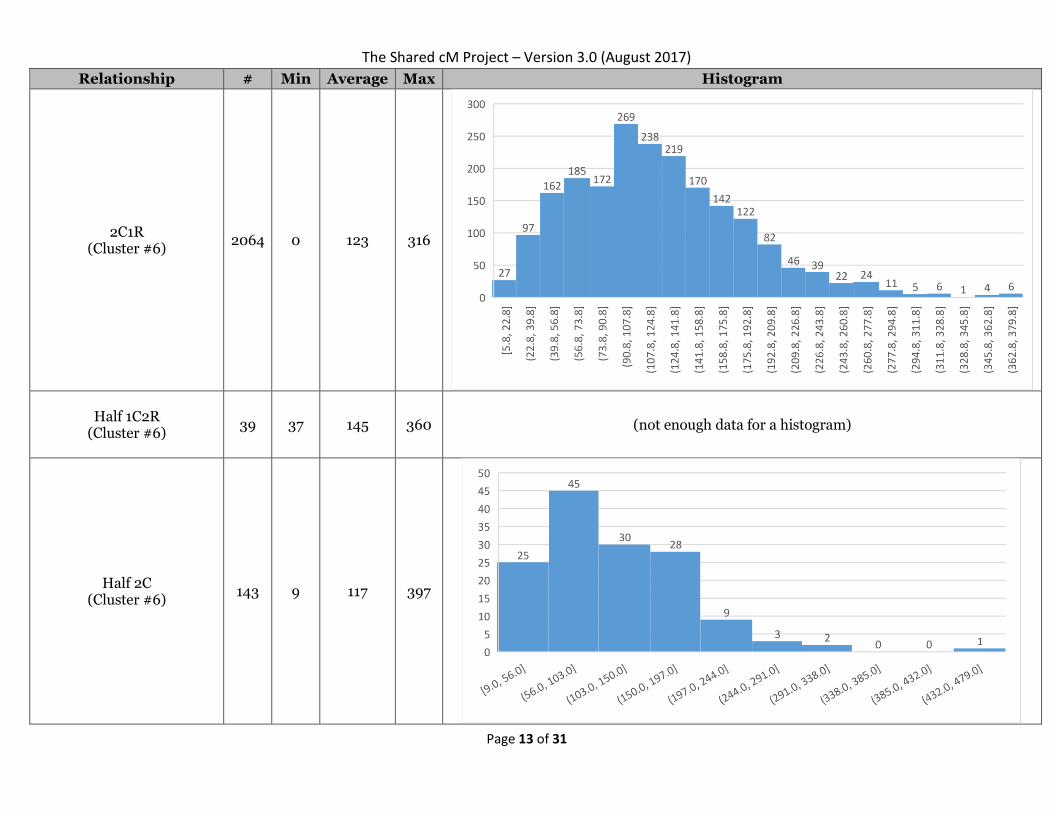
Relationship # Min Average Max Histogram
2C1R (Cluster #6)
2064 0 123 316
Half 1C2R (Cluster #6)
39 37 145 360 (not enough data for a histogram)
Half 2C (Cluster #6)
143 9 117 397
The Shared cM Project – Version 3.0 (August 2017)
Page 14 of 31
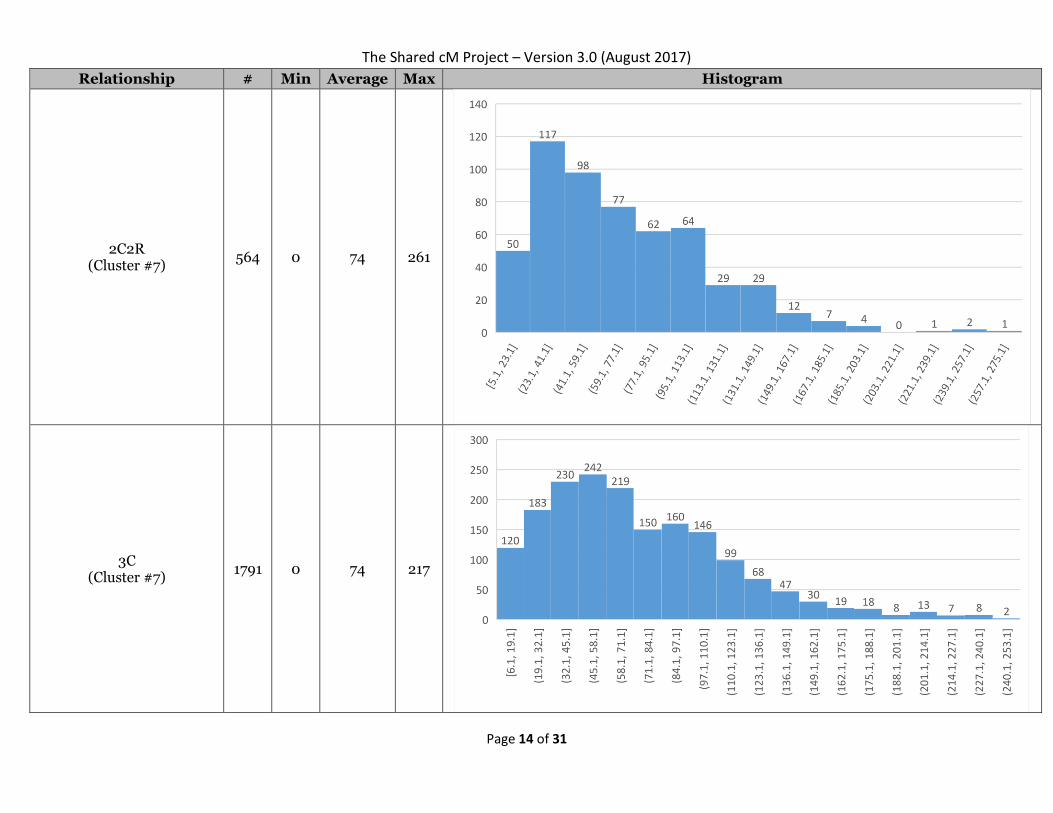
Relationship # Min Average Max Histogram
2C2R (Cluster #7)
564 0 74 261
3C (Cluster #7)
1791 0 74 217

The Shared cM Project – Version 3.0 (August 2017)
Page 15 of 31
Relationship # Min Average Max Histogram
Half 1C3R (Cluster #7)
19 0 87 191 (not enough data for a histogram)
Half 2C1R (Cluster #7)
116 0 73 341
2C3R
(Cluster #8) 50 0 57 139 (not enough data for a histogram)

The Shared cM Project – Version 3.0 (August 2017)
Page 16 of 31
Relationship # Min Average Max Histogram
3C1R (Cluster #8)
1736 0 48 173
Half 2C2R (Cluster #8)
24 0 61 353 (not enough data for a histogram)
Half 3C
(Cluster #8)
55 0 61 178 (not enough data for a histogram)

The Shared cM Project – Version 3.0 (August 2017)
Page 17 of 31
Relationship # Min Average Max Histogram
3C2R (Cluster #9)
459 0 35 116
4C (Cluster #9)
998 0 35 127

The Shared cM Project – Version 3.0 (August 2017)
Page 18 of 31
Relationship # Min Average Max Histogram
Half 3C1R
(Cluster #9)
71 0 42 165 (not enough data for a histogram)
3C3R
(Cluster #10)
47 0 22 48 (not enough data for a histogram)
4C1R (Cluster #10)
934 0 28 117
Half 3C2R (Cluster #10)
26 0 34 96 (not enough data for a histogram)
Half 4C
(Cluster #10)
32 0 36 120 (not enough data for a histogram)

The Shared cM Project – Version 3.0 (August 2017)
Page 19 of 31
Relationship # Min Average Max Histogram
4C2R 245 0 22 109
5C 429 0 25 94
4C3R 25 0 29 86 (not enough data for a histogram)

The Shared cM Project – Version 3.0 (August 2017)
Page 20 of 31
Relationship # Min Average Max Histogram
5C1R 354 0 21 79
5C2R 92 0 17 43 (not enough data for a histogram)
6C 122 0 21 86
5C3R 12 0 11 44 (not enough data for a histogram)

The Shared cM Project – Version 3.0 (August 2017)
Page 21 of 31
Relationship # Min Average Max Histogram
6C1R 138 0 16 72
6C2R 59 0 17 75 (not enough data for a histogram)
7C 54 0 13 57 (not enough data for a histogram)
7C1R 89 0 13 53 (not enough data for a histogram)
8C 80 0 12 50 (not enough data for a histogram)

The Shared cM Project – Version 3.0 (August 2017)
Page 22 of 31
Table 3. Company and Endogamy Breakdown
NOTES: o The total number of submissions (marked as “#”) may include MyHeritage submissions, which were not
analyzed because there wasn’t enough data. o “n/a” indicates that there was not enough data (i.e., not enough submissions) to calculate the percentile. o For some relationships, there was not enough data to breakdown the submissions into endogamous
versus non-endogamous, or into different companies
Relationship Total #
Average Median 5th
Percentile 95th
Percentile 1st
Percentile 99th
Percentile
Parent/Child
Total 1348 3487 3468 3380 3718 3330 3720
Non-Endogamous 1246 3490 3469 3380 3718 3343 3720
Endogamous 102 3445 3395 3283 3671 1752 3850
23andMe 143 3680 3717 3535 3720 3307 3770
AncestryDNA 285 3449 3466 3352 3544 3157 3587
FTDNA 524 3379 3384 3379 3384 3375 3586
GEDmatch 380 3586 3587 3578 3587 3531 3851
Sibling
Total 1348 2629 2627 2342 2917 2209 3384
Non-Endogamous 1181 2630 2624 2339 2931 2201 3504
Endogamous 167 2656 2653 2352 2910 2116 3659
23andMe 112 2852 2793 2533 3779 2188 3984
AncestryDNA 190 2585 2583 2309 2841 2032 2922
FTDNA 644 2563 2558 2302 2812 2213 3381
GEDmatch 394 2696 2700 2461 2933 2321 3065

The Shared cM Project – Version 3.0 (August 2017)
Page 23 of 31
Aunt/Uncle/Niece/Nephew
Total 1411 1750 1752 1452 2034 1349 2175
Non-Endogamous 1250 1747 1749 1447 2033 1344 2185
Endogamous 161 1776 1789 1492 2039 1416 2119
23andMe 142 1810 1805 1547 2082 1324 2255
AncestryDNA 226 1720 1725 1428 1998 1275 2156
FTDNA 617 1711 1709 1437 1965 1351 2108
GEDmatch 416 1808 1814 1546 2095 1422 2227
Grandparent
Total 611 1766 1770 1360 2136 1156 2311
Non-Endogamous 579 1764 1770 1353 2136 1144 2306
Endogamous 32 1797 1773 1371 2403 n/a n/a
23andMe 79 1826 1842 1421 2159 n/a n/a
AncestryDNA 130 1729 1740 1245 2184 727 2367
FTDNA 196 1720 1713 1338 2055 1242 2248
GEDmatch 205 1811 1834 1410 2191 1167 2503
Half Sibling
Total 451 1783 1779 1453 2111 1317 2312
Non-Endogamous 401 1784 1779 1450 2113 1314 2294
Endogamous 50 1779 1751 1510 2126 n/a n/a
23andMe 43 1887 1868 1367 2421 n/a n/a
AncestryDNA 93 1741 1731 1440 2057 n/a n/a
FTDNA 141 1730 1722 1442 1997 1343 2176
GEDmatch 174 1826 1821 1478 2135 1327 2337
1C
Total 1512 874 873 638 1119 553 1225
Non-Endogamous 1283 867 865 636 1107 556 1209
Endogamous 229 914 906 650 1207 544 1350
23andMe 113 895 897 603 1170 524 1341
AncestryDNA 303 849 843 636 1094 561 1257
FTDNA 770 872 872 637 1106 558 1213
GEDmatch 322 898 889 657 1150 549 1295

The Shared cM Project – Version 3.0 (August 2017)
Page 24 of 31
Great Aunt/Uncle
Total 413 914 872 487 1770 251 2108
Non-Endogamous 385 907 866 483 1774 245 2117
Endogamous 28 1010 940 490 1775 n/a n/a
23andMe 42 971 899 550 2154 n/a n/a
AncestryDNA 94 876 848 406 1491 n/a na/
FTDNA 144 915 871 531 1800 282 1956
GEDmatch 131 918 891 416 1851 207 2122
Great Grandparent/Great Grandchild
Total 61 881 894 552 1201 n/a n/a
Half Aunt/Uncle/Niece/Nephew
Total 275 891 875 637 1196 500 1446
Non-Endogamous 235 888 870 641 1189 496 1610
Endogamous 40 905 935 595 1205 n/a n/a
23andMe 23 949 925 679 1308 n/a n/a
AncestryDNA 70 863 867 555 1209 n/a n/a
FTDNA 63 872 828 596 1113 n/a n/a
GEDmatch 119 905 909 638 1197 510 1657
1C1R
Total 1594 439 430 236 657 141 851
Non-Endogamous 1402 433 427 227 641 132 770
Endogamous 192 486 455 264 823 168 1065
23andMe 147 466 466 249 672 154 885
AncestryDNA 490 420 405 215 635 148 976
FTDNA 602 446 434 245 660 132 770
GEDmatch 350 444 433 243 663 129 938
Great Great Aunt/Uncle/Niece/Nephew
Total 25 427 455 198 797 n/a n/a

The Shared cM Project – Version 3.0 (August 2017)
Page 25 of 31
Half 1C Total 177 457 449 259 695 137 856
Half Great Aunt/Uncle/Niece/Nephew
Total 44 432 415 175 741 n/a n/a
1C2R
Total 481 229 221 96 385 43 531
Non-Endogamous 436 219 228 93 380 42 528
Endogamous 45 246 245 97 404 n/a n/a
23andMe 57 258 255 129 379 n/a n/a
AncestryDNA 154 217 203 67 384 35 504
FTDNA 166 238 228 128 388 73 578
GEDmatch 103 219 223 84 383 27 521
2C
Total 1590 233 223 102 406 46 515
Non-Endogamous 1393 227 220 99 391 46 501
Endogamous 197 274 255 145 466 38 671
23andMe 156 233 232 92 405 4 498
AncestryDNA 598 219 208 93 390 41 515
FTDNA 478 248 238 124 413 87 551
GEDmatch 358 237 222 102 422 39 647
Half 1C1R Total 138 226 219 78 397 57 530
Half Great Great Aunt/Uncle/Niece/Nephew
Total 15 187 188 n/a n/a n/a n/a
1C3R Total 38 123 116 32 240 n/a n/a

The Shared cM Project – Version 3.0 (August 2017)
Page 26 of 31
2C1R
Total 2064 123 116 36 235 20 316
Non-Endogamous 1888 120 114 35 229 20 298
Endogamous 176 153 139 62 283 32 387
23andMe 168 133 132 41 238 19 274
AncestryDNA 961 112 108 31 221 16 311
FTDNA 524 136 128 53 245 26 353
GEDmatch 407 129 120 43 247 22 349
Half 1C2R Total 39 145 131 54 279 n/a n/a
Half 2C Total 143 117 105 16 237 9 397
2C2R
Total 564 74 63 19 157 8 261
Non-Endogamous 527 71 62 19 142 9 236
Endogamous 37 119 110 7 271 n/a n/a
23andMe 49 76 66 14 153 n/a n/a
AncestryDNA 309 64 49 18 141 7 241
FTDNA 106 94 85 43 162 31 401
GEDmatch 100 83 72 17 176 n/a n/a
3C
Total 1791 74 64 17 155 9 217
Non-Endogamous 1607 70 63 16 147 9 208
Endogamous 184 101 101 43 223 43 396
23andMe 158 73 74 31 170 30 245
AncestryDNA 853 64 53 14 146 10 207
FTDNA 406 93 88 46 181 39 233
GEDmatch 366 76 69 23 155 20 231
Half 1C3R Total 19 87 58 n/a n/a n/a n/a

The Shared cM Project – Version 3.0 (August 2017)
Page 27 of 31
Half 2C1R Total 116 73 61 15 193 8 341
2C3R Total 50 57 48 9 136 n/a n/a
3C1R
Total 1736 48 41 10 112 7 173
Non-Endogamous 1616 47 40 9 108 7 153
Endogamous 120 71 58 14 183 6 292
23andMe 117 49 41 9 106 7 244
AncestryDNA 972 39 33 9 100 6 137
FTDNA 332 74 66 30 147 24 218
GEDmatch 310 48 43 10 101 8 152
Half 2C2R Total 24 61 49 2 301 n/a n/a
Half 3C Total 55 61 54 9 165 n/a n/a
3C2R
Total 459 35 31 9 90 6 116
Non-Endogamous 423 35 31 9 84 6 115
Endogamous 36 40 30 7 114 n/a n/a
23andMe 30 28 27 8 57 n/a n/a
AncestryDNA 281 30 25 7 69 6 108
FTDNA 68 59 54 27 111 n/a na/
GEDmatch 79 38 33 10 94 n/a n/a
4C
Total 998 35 29 7 82 5 127
Non-Endogamous 905 33 28 7 77 5 104
Endogamous 93 53 42 9 152 n/a n/a
23andMe 34 34 28 10 91 n/a n/a
AncestryDNA 584 29 25 7 68 5 96
FTDNA 134 66 59 18 141 10 255
GEDmatch 242 33 29 8 71 5 80

The Shared cM Project – Version 3.0 (August 2017)
Page 28 of 31
Half 3C1R Total 71 42 33 8 108 n/a n/a
3C3R Total 47 22 19 7 48 n/a n/a
4C1R
Total 934 28 22 7 65 5 117
Non-Endogamous 858 27 22 7 59 5 94
Endogamous 76 45 34 6 135 n/a n/a
23andMe 35 32 28 9 81 n/a n/a
AncestryDNA 580 22 19 6 50 5 89
FTDNA 122 61 50 29 124 22 556
GEDmatch 196 30 26 7 61 6 140
Half 3C2R Total 26 34 28 9 96 n/a n/a
Half 4C Total 32 36 27 7 96 n/a n/a
4C2R Total 245 22 17 6 55 5 109
5c
Total 422 25 19 6 66 5 94
Non-Endogamous 374 24 19 6 58 5 81
Endogamous 48 33 24 7 89 n/a n/a
23andMe 8 n/a n/a n/a n/a n/a n/a
AncestryDNA 250 18 15 6 39 5 78
FTDNA 60 50 45 22 81 n/a n/a
GEDmatch 104 30 25 8 65 n/a n/a
4C3R Total 25 29 25 9 82 n/a n/a

The Shared cM Project – Version 3.0 (August 2017)
Page 29 of 31
5C1R
Total 350 21 15 6 61 5 79
Non-Endogamous 290 20 14 6 57 5 76
Endogamous 60 30 26 7 70 n/a n/a
23andMe 6 25 26 n/a n/a n/a n/a
AncestryDNA 223 16 12 6 39 5 70
FTDNA 39 49 42 22 83 n/a n/a
GEDmatch 82 29 28 8 62 n/a n/a
5C2R Total 92 17 14 6 43 n/a n/a
6C Total 122 18 13 6 50 5 86
5C3R Total 12 11 8 n/a n/a n/a n/a
6C1R Total 138 16 12 5 44 5 72
6C2R Total 59 17 14 5 45 n/a n/a
7C Total 54 13 9 6 39 n/a n/a
7C1R Total 89 13 9 5 39 n/a n/a
8C Total 80 12 9 5 29 n/a n/a

Page 30 of 31
Table 4. Relationship Chart
Cluster # Relationship # Min Average Median Max Expected
Parent/Child 1378 3330 3487 3468 3720 Varies
1 Sibling 1345 2209 2629 2627 3384 2550
2 Aunt/Uncle/Niece/Nephew 1411 1349 1750 1752 2175 1700
2 Grandparent/Grandchild 611 1156 1766 1770 2311 1700
2 Half Sibling 451 1317 1783 1779 2312 1700
3 1C 1512 553 874 873 1225 850
3 Great-
Aunt/Uncle/Niece/Nephew 413 251 914 872 2108 850
3 Great-Grandparent/Great-
Grandchild 61 464 881 894 1486 850
3 Half
Aunt/Uncle/Niece/Nephew 275 500 891 875 1446 850
4 1C1R 1594 141 439 430 851 425
4 Great-Great-
Aunt/Uncle/Niece/Nephew 25 191 427 455 885 425
4 Half 1C 177 137 457 449 856 425
4 Half Great-
Aunt/Uncle/Niece/Nephew 44 125 432 415 765 425
5 1C2R 481 43 229 221 531 213
5 2C 1590 46 233 223 515 213
5 Half 1C1R 138 57 226 219 530 213
5 Half Great-Great-
Aunt/Uncle/Niece/Nephew 15 12 187 188 383 213
6 1C3R 38 0 123 116 283 106
6 2C1R 2064 0 123 116 316 106
6 Half 1C2R 39 37 145 131 360 106
6 Half 2C 143 9 117 105 397 106
7 2C2R 564 0 74 63 261 53
7 3C 1791 0 74 64 217 53
7 Half 1C3R 19 0 87 58 191 53
7 Half 2C1R 116 0 73 61 341 53
8 2C3R 50 0 57 48 139 27
8 3C1R 1736 0 48 41 173 27
8 Half 2C2R 24 0 61 49 353 27
8 Half 3C 55 0 61 54 178 27
9 3C2R 459 0 35 31 116 13
9 4C 998 0 35 29 127 13
9 Half 3C1R 71 0 42 33 165 13
10 3C3R 47 0 22 19 48 7
10 4C1R 934 0 28 22 117 7

The Shared cM Project – Version 3.0 (August 2017)
Page 31 of 31
Cluster # Relationship # Min Average Median Max Expected
10 Half 3C2R 26 0 34 28 96 7
10 Half 4C 32 0 36 27 120 7
n/a 4C2R 245 0 22 17 109 3.3
n/a 5C 422 0 25 19 94 3.3
n/a 4C3R 25 0 29 25 86 1.7
n/a 5C1R 354 0 21 15 79 1.7
n/a 5C2R 92 0 17 14 43 0.8
n/a 6C 122 0 18 13 86 0.8
n/a 5C3R 12 0 11 8 44 0.4
n/a 6C1R 138 0 16 12 72 0.4
n/a 6C2R 59 0 17 14 75 0.2
n/a 7C 54 0 13 9 57 0.2
n/a 7C1R 89 0 13 9 53 0.1
n/a 8C 80 0 12 9 50 0.05