the serious games of racial accounting in schools
TRANSCRIPT

1
Volume 14, Number 3 August 26, 2011 ISSN 1099-839X
The Serious Games of Racial Accounting in Schools
Martha I. Martinez
University of Oregon
Educational disparities are frequently framed in racial comparisons that are based on data generated by sorting and counting racial subgroups. Our reliance on these data, and the sorting and counting mechanisms entailed therein, is fundamental to debates about racial inequalities. What is largely ignored in achievement gap discourse is how racial data collection procedures naturalize and legitimize what counts as race and what doesn’t. The contested racial status of Latinos illustrates the tension within and political significance of government-sanctioned racial classificatory schemes. By situating race discourse within actual race data collection practices, particularly as they relate to Latinos in the U.S. and other racial misfits, this study explores how technologies of truth re-create racial (arti)facts and how school staff interpret race and their roles in the data-keeping process, It also considers the implications of recent changes to racial accounting procedures in schools. Keywords: race/ethnicity, racial measurement, Latinos, multi-racial students, racial disparities
In 2001, I registered my daughter for kindergarten. On the school registration form was a question regarding her ethnicity, with instructions that respondents select one of five options presented: American Indian or Alaskan Native; Asian or Pacific Islander; Black; White; or Hispanic. I asked the office assistant if I could check two boxes: having a Latina1 mother and White father, I didn’t want my daughter to have to be identified as one at the expense of the other. I was instructed that I could only choose one. I checked off two boxes anyway. The next year, when the form was returned to me for updating, one box was checked: White. I didn’t protest the erasure of my racial/ethnic contribution to my child’s racial/ethnic identification. Although I resented it, I nevertheless rationalized that, if forced to choose, I would classify my child as White instead of Latina – because, in my formulation of racial/ethnic identities, she is more White than Latina. She is far more privileged in many respects than many Latinos in the U.S. – in fact, than I was as a child. Although I understood the history and rationale behind the data collection effort, I nevertheless resented being boxed in, or in this case, boxed out. The paperwork
seemed to represent more than bureaucratic record-keeping. To me it represented a definition of racial/ethnic identity; and, I identified my child as being equal parts Latina and White. This incident wasn’t the only or primary reason for initiating a project on race data collection in schools, but it nevertheless captures a key question of interest: what officially and actually counts as race in school data and for whom? The question is particularly significant given what appear to be two competing contemporary trajectories in U.S. racial ideology and its manifestation in school policy. On the one hand, there is considerable criticism within theoretical and applied research, as well as in public policy arenas, regarding the validity and utility of existing racial categories. Essentialized ethnic/racial categories have been destabilized in academic circles (Allen, 1998a, 1998b, 1999; Gimenez, 1998; Hollinger, 1995; Moya, 2000). Findings from the Human Genome Project dispute the contention that “separate classifiable subspecies (races) exist within modern humans” (U.S. Department of Energy, n.d.). And, race-based remedies to racial disparities have become increasingly criticized in legal circles as reverse
Current Issues in Education Vol. 14 No. 3
2
discrimination or anathema to a colorblind democracy. The U.S. Supreme Court’s decision in Parents Involved in Community Schools (PICS) further restricting the use of race in student assignment policies showcases this “colorblind/reverse discrimination” reasoning. Writing for the majority, Chief Justice Roberts concluded:
The school districts have not carried their heavy burden of showing that the interest they seek to achieve justifies the extreme means they have chosen--discriminating among individual students based on race by relying upon racial classifications in making school assignments (PICS, 2007).
Anderson (2007) contends that the PICS decision and contemporary legal arguments against the use of race-conscious education policies rely on a faulty theory of “color-blind constitutionalism,” i.e., that the intent of the Reconstruction Congress was to articulate one class of American citizenship without regard to racial classification and thus establish a constitutional goal of “racial neutrality” (p. 249). In contrast, he provides ample evidence that racial ideology and not color-blindness permeated the legal foundations upon which citizenship and equal rights continued to be defined and enforced. Moreover, he finds this racial ideology was not limited to Black-White race relations, but existed within the context of a multiracial landscape where concerns about American Indians and Asians were also predominant. Thus, Anderson (2007) concludes, “We may argue for or against the use of racial classifications to pursue issues of school desegregation and affirmative action, but we should not pretend that we are constrained by a color-blind Constitution” (p. 256). At the same time that the construct and political utility of race is undergoing considerable challenge, our educational system has become increasingly invested in race data as it seeks to address persistent achievement gaps between White students and students of color. The No Child Left Behind Act of 2001 (NCLB) relies heavily on racial data collection procedures, and these procedures have taken on greater significance given the consequences for schools that fail to report adequate yearly progress for racial (and other) subgroups on standardized tests. Moreover, substantial demographic changes in the past two decades have led to heightened attention within the school system on the growing Latino population, especially those for whom English is a second language. The data-keeping enterprise initiated with NCLB creates a very real triple data monitoring of many Latinos who are “subgrouped” in NCLB accountability reports not just by race (or rather ethnicity, since they are not classified as a race), but potentially by limited English proficiency and socioeconomic disadvantage as well. The purpose of the study is to explore how racial “truths” in education are (re)created via one of the most mundane bureaucratic tasks in schools: race data collection procedures. The primary questions guiding my investigation are: (1) what counts as race (and what
doesn’t) within actual race data collection practices in schools, particularly as these practices relate to “non-conforming” racial types; (2) how do school staff interpret the race categories and their data collection roles; and (3) what do existing practices imply for the recent changes to racial data collection and reporting in U.S. schools? I refer to the racial accounting practices in schools as “serious games” not to make light of them, but rather to highlight the practices as a series of negotiations between actors within a discursive web of meaning construction. In addition to the local players involved in the collection of these data (i.e., students, their families, and school staff), there are state and federal government representatives who regulate the collection process. The uses of these data vary and encompass other players in the game of racial accounting in schools. These players, such as policymakers, researchers and the general public, use these data to monitor and debate how our schools are serving a racially diverse student body. These are, as Ortner (1996) suggests, “serious games” that are steeped in power and inequality, and that involve actors who play with “skill, intention, wit, and intelligence” (p. 12). Ladson-Billings (2004), for example, recounts the following story of an elementary school in a historically Black neighborhood in San Francisco that was ordered to desegregate and prohibited from having more than 47% of any one “designated” minority.
When I asked the school principal about the school demographics, she responded, “Do you want to know what it is on paper or what it is in reality?” I was surprised to learn that when African American parents saw that the school district was willing to improve the school once White children were coming in and their children were being sent out of the community, a large contingent of them re-enrolled their children in the neighborhood school with the racial/ethnic designation “Native American.” The principal told me, “I have the largest concentration of “Native American” students in the city!” (p. 8).
The example above and the PICS case illustrate the high stakes of racial accounting practices in the context of school desegregation cases, and the ways in which students and families are active participants in the data collection and interpretative processes entailed therein. However, the collection of racial/ethnic data frequently occurs in schools where their use(s) may be unclear to students and their families, as is the case in this particular project. No desegregation order or voluntary integration plan governs student assignment policies in the schools involved in this study. Yet, in these schools, as in all U.S. public schools, racial data are collected and interpreted by school staff and educational researchers to (a) make meaning of the educational experiences of students, and, in the wake of NCLB, (b) hold schools accountable for meeting specific assessment outcomes for all racial/ethnic subgroups. While students and families are key players in
The Serious Games of Racial Accounting in Schools
3
this racial accounting game, this study focuses on the institutional apparatus of racial data keeping in schools, how school staff navigate this system and interpret their roles within it, and the implications of this game for critical consumers of the “racial (arti)facts” that emerge: educational policymakers, practitioners, and researchers. I use the term “racial (arti)facts” to reflect the contradictory characteristics of these data: they are labels and counts of social groups defined by characteristics and conditions that are real and imaginary, stable and unstable, present and past. The next section highlights the historical evolution of this game and some of the current challenges to keeping racial boxes intact.
The Creation and Maintenance of a U.S. Racial Cosmology
Despite the significant impact NCLB has had on school data, its passage did not initiate racial data collections in schools. Nor did the racial and ethnic categories currently in use materialize in an institutional vacuum. The policies and practices related to race data collection in schools are embedded within the larger sociopolitical forces that have helped shape racial data-keeping across government institutions. The evolution of these classificatory schemes supports Omi and Winant’s (1994) contention that race is an “unstable and ‘decentered’ complex of social meanings constantly being transformed by political struggle” (p. 55). The contested racial status of Latinos (or Hispanics, as they are frequently referred to and categorized in U.S. demographic profiles) illustrates the tension within and political significance of government sanctioned racial classificatory schemes. According to U.S. racial classification systems, Hispanics are not officially a race but instead an ethnic group (Allen, 1999; Hirschman, Alba, & Farley, 2000; Logan, 2004; Saenz, 2004; Snipp, 2003). An anomaly of racial sorts, they are the only ethnic group officially classified and counted as such in the U.S. Census and in federal and state school reports. Although race is more often linked with human differences in phenotype and ethnicity is frequently defined in terms of a shared cultural heritage, there is much debate about the utility/validity of this distinction and much variability in the manner in which Hispanics identify themselves racially (Hirschman et al., 2000; Logan, 2004; Omi & Winant, 1994; Snipp, 2003; Suro, 2006a, 2006b). In an effort to better count Hispanics, the Census 2000 reordered the ethnic and race questions, hoping to encourage more Hispanics to identify their Hispanic heritage in the ethnic question as well as their racial type in the race question that followed. However, Hispanics continued to defy neat racial categorization, choosing instead the “some other race” category and writing in “Latino”, “Hispanic” or a similar term almost half the time (Logan, 2004; Saenz, 2004). And, Hispanics aren’t the only ones wreaking havoc on U.S. Census interpretability. In response to growing criticisms around the race categories used in the U.S. Census, the 2000
Census allowed individuals to check multiple boxes and over 6.8 million people did. Although many of these individuals identified Hispanic or Latino as one of the “other races” they claimed, another significant multi-race respondent (approximately 1 million individuals) were those who identified as both American Indian/Alaskan Native and White (Tafoya, Johnson, & Hill, 2004). Despite what might be construed as having a subordinate racial status, Hispanics constitute one of the five racial/ethnic groups that are routinely counted by various government agencies, including the U.S. Department of Education. This is largely the result of the Office of Management and Budget’s (OMB) Statistical Policy Directive No. 15 (Snipp, 2003). OMB Directive 15, which became official federal policy in 1977, standardized and institutionalized racial data-keeping into five racial/ethnic data categories: (a) American Indian and Alaska Natives, (b) Asians and Pacific Islanders, (c) Non-Hispanic Blacks, (d) Non-Hispanic Whites, and (e) Hispanics (Hollinger, 1995; Snipp, 2003). Hollinger (1995) refers to these five categories as the ethno-racial pentagon. Snipp (2003) suggests that this ethno-racial pentagon constitutes a racial cosmology that permeates U.S. society to this day. Maintaining this racial cosmology, however, has its challenges, particularly when self-enumeration is the principal process by which racial data collection proceeds and when increasing diversity in the U.S. undermines the adequacy of existing racial boxes. Contested definitions of race aren’t new; they in fact co-exist with dominant racial narratives to elaborate, refine and challenge racial realities. As Omi and Winant (1994) contend, race is not an essence or an illusion, but a social construct under constant political struggle that “continues to play a fundamental role in structuring and representing the social world” (p. 55). At times the omnipresent political struggle for racial “truths” destabilizes the racial order and new meanings seep into the broader public domain, staking claim on what officially counts as race, for whom, and for what purpose. Changes to the racial order are only achieved “when there is significant ‘decay’ in the capacities of pre-existing state programs and institutions to organize and enforce racial ideology” (Omi & Winant, 1994, p. 88). With the move from observer identification in the 1960 U.S. census to self-identification in order to better count Native Americans living in non-reservation settings (Snipp, 2003), the racial ideology Pandora’s box was irrevocably opened. Skerry (2000) suggests that collecting and interpreting racial/ethnic data has become increasingly difficult because “race and ethnicity are coming to be understood less as social constructs denoting affiliation to one or more groups than as psychological choices denoting individual identity” (p.8). Whether or not individuals respond to the categories based on social affiliation or personal identification with one or more social groups, census studies indicate that individuals respond to these questions differently at
Current Issues in Education Vol. 14 No. 3
4
different times, and increasingly choose either not to respond at all or to respond in ways that do not conform to the official racial classification scheme (Hirschman et al., 2000; Logan, 2004; Skerry, 2000). The new racial/ethnic categories to be used by K-12 schools and other government agencies beginning in 2010 represent the federal government’s most recent attempt to replace the ill-fitting previous racial lid with a new one. The title of the federal government’s 2008 guide for implementing the new categories – Managing an Identity Crisis – suggests a paternalistic nation-state’s assessment of its racially conflicted citizenry. Although the guide states that the changes were prompted in part to accommodate “parents [who] want the opportunity to more fully describe their children’s heritage” (p. 3), there is no open-ended response to the race/ethnicity question in the new format. To handle this identity crisis, the state’s response is a minor tweaking of the previous categories and the utilization of its bureaucratic machine to establish the new racial order. Thus, the primary audience for the 2008 guide is not the public, but “data, information systems, and program staff” (National Forum, p. v) who are charged with operationalizing the changes, and, in an ironic twist of racial data keeping fate, using observer identification when the racially conflicted citizenry refuses to comply with the new rules of the game. Because this study was initiated prior to the implementation of the new federal guidelines, the racial accounting game that follows focuses on practices immediately prior to the new rules and discusses what these changes imply for the future.
Methods of Inquiry I began the study using two guiding questions: (1) what counts as race within actual race data collection practices; and (2) how do school staff interpret the race categories and their data collection roles? A third question was added when the new federal guidelines on race and ethnicity data surfaced mid-way through the data collection phase: What do the recent changes to racial data collection and reporting in U.S. schools imply based on existing practices? Drawing on Smith’s concept of ruling relations (1990, 1999), I examined the discursive and multifaceted web of coordinated activities that “produce local events as readable in the texts of the ruling” (1999, p. 87). Like Foucault’s (2000) concept of governmentality, Smith recognizes the salience of the scientific apparatuses used by the state to (re)create the knowledge and truths necessary for governance, while at the same time not reducing the state to a monolithic unity that directs all human action. To investigate microsocial phenomena and the power relations embedded within them, Smith (1990) emphasizes focusing not only on textual representations of discourse but in “actual relations that are vested in texts” (p. 162). I also relied on Ortner’s (1996) articulation of practice theory to help interpret the results of the study. Her methodological approach rests upon “a model of practice that embodies
agency but does not begin with, or pivot upon the agent” and instead highlights the “serious games” of social life where power differentials and inequalities manifest themselves in multiple ways (p. 12). To examine how the policies and procedures governing race data collection and reporting practices mediated actual race data collection practices within and across public schools in Oregon, I relied on two data sources: archival documents and interviews. The principal archival data sources used were race data collection protocols and policy documents, as well as district and state reports referencing student demographics. These texts were supplemented with interviews of staff responsible for student data collection activities in Oregon. Archival documents and interviews were analyzed using an iterative approach to illuminate race data collection and reporting practices and how staff interpreted their roles within these processes. The investigative process began with an analysis of archival documents to decipher how official policies and procedures were supposed to guide the data collection and reporting process. Interviews with staff helped to fill in the gaps that emerged from the analysis of the documents, and to gather evidence about how staff interpreted their roles and the race categories. Observing actual incidents of families providing these data to the schools would have also been helpful. However, at this point in the project I was more interested in understanding the rules of racial data collection and how staff interpreted and enacted these rules. In addition to researcher, I was known by some of the study participants as a parent, a Latina, a diversity advocate, and a relatively well educated community member. Not all study participants were fully aware of my personal and professional background, but all were aware that their comments were being recorded and analyzed. This of course had an effect on what they told me and what they allowed me to see. As Mauthner and Doucet (2003) contend, I recognize that I have made “choices about how to interpret the voices [of study participants] and which transcript extracts to present as evidence” (p. 418). I have nevertheless tried as much as possible to critically reflect on what I was being told, what I saw, and how my lens distorted and clarified the data I collected and my analytical focus. Additional details about the research setting, participants and procedures follow. Setting The study was conducted in Oregon, and involved staff from a medium-sized school district, two elementary schools within this district, the Oregon Department of Education, and an Education Service District (ESD). The schools, school district, ESD, and state were selected largely on the basis of convenience, but also because of the relatively high numbers of Latino families that the study schools and the ESD’s Migrant Education program served. In 2007-08, the Meadows2 school district served approximately 7200 students, of which 10% were Hispanic/Latino. Of the total student population in Oregon,

The Serious Games of Racial Accounting in Schools
5
ethnic minority students accounted for about 30% in 2007, with Hispanic students representing over half the total ethnic minority population. Although the state is not among the most diverse in the country, the White student population has steadily decreased while minority student enrollment, particularly Hispanic enrollment, has increased – student demographic trends that are consistent with schools across the country (Fry, 2006). From 1992-2007, the total actual growth rate of Oregon public school students was approximately 10%, with White students decreasing by over 11% during this time and Hispanic students growing by over 230% (Oregon Department of Education, 2006-2007). The participating schools and the ESD were also selected due to the relatively large Hispanic populations that each served. The two elementary schools involved in the study, Centennial and New River, were district English Learner magnet schools for Spanish-speaking students and served disproportionately larger numbers of Hispanic students than the remaining six elementary schools. In the 2007-08 school year, Centennial had about 380 students, over 36% of whom were Hispanic. New River had about 440 students, just over 30% of whom were Hispanic. The percentage of Hispanic enrollment at the other elementary schools in the Meadows school district ranged from about 2-6%. ESDs are intermediary administrative agencies that serve multiple school districts, providing administrative support and other supplementary educational services to support the activities of their respective districts. The ESD included in the study was responsible for the Migrant Education program that operated in a geographic region adjacent to the school district. Migrant Education programs, including the program staffed by this particular ESD, typically serve large numbers of Hispanic students and their families, many of whom speak Spanish as their primary language. Participants Selection of participants was based on a purposive sampling strategy (Teddlie & Yu, 2007). Direct involvement in the collection of race and ethnicity data in Oregon schools was the criterion used to recruit interview participants. I relied on personal connections at the schools and the department of education to direct me to appropriate staff. I did not provide any incentives for participation. A total of twelve individuals were interviewed, including three Oregon Department of Education (ODE) employees, two Meadows school district employees, five elementary school employees, and two ESD employees affiliated with the Migrant Education program that operates in several counties adjacent to the Meadows school district. Two participants were males, the rest females. At least half the participants were 50 years or older (one respondent didn’t return the background survey). When asked how they identified racially/ethnically, most (9 out of 12) identified themselves as Caucasian or White. One identified as White
Hispanic. Another identified as being half White and half Mexican. Race/ethnicity data is unavailable for the participant who did not return the background survey. Procedures Interview questions were emailed in advance to all participants, with the hope that these would guide later discussions. However, some participants (two ODE employees and one district employee) chose to answer the questions exclusively via email. The rest of the participants (9) were interviewed in person, with some individuals providing additional information via email either before or after our conversations. Interviews took place August 2007 – April 2009. In-person interviews occurred at the participants’ worksites, with two exceptions. Both ESD employees were interviewed at a local eating establishment. In-person interviews ranged in duration from about 20 minutes to an hour, and all but one of these interviews were digitally recorded. Interviews were semi-structured and designed to elucidate the textual forms used to capture race data, how these forms were interpreted to families, how “non-conforming” race data were entered and reported in the system, and how staff interpreted their roles and the race categories. Because I was also interested in how NCLB might be influencing current race data collections, I specifically asked staff about whether NCLB had had any effect on race data collection processes. I was aware that all students filled out a school registration card upon enrollment in the district and that this card requested racial/ethnic background information, so I used this as a principal investigatory tool in interviews. For Migrant Education staff, the comparable in-take form that we discussed in interviews was the Certificate of Eligibility. Interviews with school, district, and state staff investigated race data collection processes articulated across these levels of school governance. However, the interviews with Migrant Education staff solely examined the data collection interface between Migrant Education staff and families, as interpreted by Migrant Education staff. Despite the more limited investigation of race data collection processes within the Migrant Education program, the interviews were helpful in providing additional insight into the manner in which racial categories were explained to non-English speaking immigrants from Latin America, which are the families typically served by Migrant Education programs in Oregon. The following three sections summarize the results related to each of the research questions.
The Ruling Relations of Racial Data Monitoring There is an extensive paper trail governing race data collection procedures in schools. Several texts stand out as those that actively shape what counts as race for students in the study’s schools. These are school registration forms, the computer technologies that transfer these data from school to district to state to federal offices, and the policy directives that govern race data collection
Current Issues in Education Vol. 14 No. 3
6
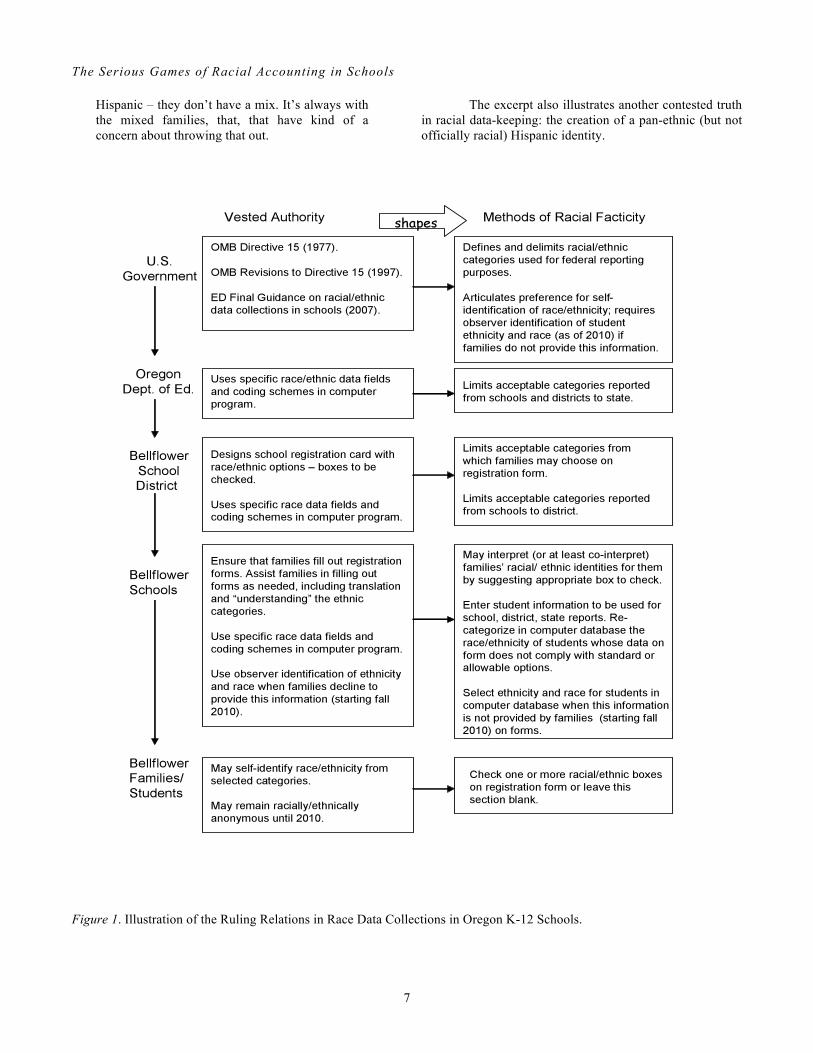
practices in schools. Counting race in schools, however, isn’t solely accomplished by texts. Official counts of students begin with students and their families – who are charged with voluntarily identifying their racial/ethnic affiliation in school registration forms, frequently by checking a box. This practice of self-identification is fundamental to racial accounting in schools, but it doesn’t always yield data that is easily translated into standardized racial/ethnic categories for all students. In the cases of racial misfits, i.e., those who check too many boxes or none at all, school staff must decide what and who counts racially within schools. Their actions and the racial/ethnic self-designations of students and families in their schools, while not controlled by the racial discourse that permeates the school environment, are nevertheless constrained and guided by allowable standardized options from a complex racial accounting bureaucracy. This racial accounting bureaucracy could be conceived of as the ruling relations of race data collection practices in schools. The ruling relations governing racial/ethnic data collections in schools start with federal policies that dictate what must be counted as race, what must be counted as ethnicity, and how counting should happen. They trickle down to the school in an articulated, official discourse that illuminates some racial truths and obfuscates others. Figure A illustrates the ruling relations of racial data collections in the Oregon schools I investigated. As the figure shows, the textual forms that govern these practices aren’t just in paper form. Computer-based data systems play a significant role in the standardization of racial types via the use of race data fields in computer programs that only permit acceptable data forms to be entered. Two contested areas of racial truth construction within the context of these ruling relations emerged in the analysis of theinterviews and archival documents: the (non)existence of multi-racial students and Hispanic racial/ethnic ambiguities.
The (Non)Existence of Multi-Racial Students In the 2007-08 school year, the year in which most of the interviews for the study took place, the Meadows school district used the same five categories (i.e., the ethno-racial pentagon) established by OMB Directive 15 in 1977 to collect racial/ethnic information from families: (1) American Indian or Alaska Native, (2) Asian or Pacific Islander, (3) Black, (4) White, and (5) Hispanic. All categories on the form appeared under the heading “Ethnic”, even though officially (per federal guidelines) Hispanic is considered an ethnicity and the remaining four categories are defined as races. Although the majority of other Oregon districts of similar size or larger counted students who identified as multi-racial by 2007, the Meadows district did not report these data until 2009. (For student enrollment counts by ethnic group, see Table 2 for Meadows school district and Table 3 for all districts, including those with 1000 or more students.) Prior to 2009, when families from New River and Centennial checked
multiple boxes these students were reported either as Unknown, Declined to Report, or by one of the ethnic categories that were checked on the registration card (school staff determined which one). There was a good deal of discomfort that I was asking these questions about staff’s specific role in helping students and families officially identify their racial/ethnic identity, with all staff stressing that self-identification was the only method they relied on, as Michele’s comments below highlight. Michele was a front office assistant at Centennial.
How do we explain it? Well, basically, it’s what do they think their first ethnicity is. You know, if, for instance, if a parent has a Black child and they are White, what do you consider your child? We can’t make that decision what we think. It’s what the parent thinks that that child is. What do they honor? And, same with if we have a Spanish family that they, um, who are White. What do you consider? I mean we put both. We put, you know, they say, “Well, I would think my first one would be White, and secondary is Spanish.” And, we put in… or Hispanic… we put that in. It’s not something that we make that choice on. We let the parent choose what, what’s important to them.
Nevertheless, since the school’s computer program had limited racial data entry fields, Michele revealed how staff were the final arbiters when families did not comply with the rules of the racial identification game.
Before the parent even leaves, I see this. And, I look at it. And, if they’ve marked two, I ask them what they, what they prefer, as first or second. Um, if they don’t want to, they, they do not have to answer it. If they decline, that’s what it shows on the, in the system. That they declined. Or if they inadvertently left it out, but they didn’t know, and we didn’t catch it or they just handed it in, then we put in that they declined it. Because we can’t ask them to fill it out.
Multi-racial students (or multi-ethnic, which was the category used by the state for the collection and reporting of student race/ethnicity data3) within the Meadows district were thus transformed into acceptable ethnic data-keeping categories via the technological apparatus of the district, which (prior to 2009) literally did not compute multi-racial bodies. Despite the official non-existence of multi-racial students in Meadows’ schools, staff at New River and Centennial staff nevertheless commented on the existence of these students in the years prior to 2009, as the following excerpt illustrates. It is from my interview with Candice, a bilingual front office assistant at New River:
Like I said it’s mainly the mixed families that either decline or choose both boxes. So, we really don’t have a problem with Hispanic families trying to choose one or the other ‘cuz it’s mainly just
The Serious Games of Racial Accounting in Schools
7
Hispanic – they don’t have a mix. It’s always with the mixed families, that, that have kind of a concern about throwing that out.
The excerpt also illustrates another contested truth in racial data-keeping: the creation of a pan-ethnic (but not officially racial) Hispanic identity.
Figure 1. Illustration of the Ruling Relations in Race Data Collections in Oregon K-12 Schools.

Current Issues in Education Vol. 14 No. 3
8
Hispanic Racial/Ethnic Ambiguities A significant area of interest in my interviews with school staff was how racial categories were explained to recent immigrants who may be unfamiliar with U.S. customary and legal practices, including the collection of racial data, and who may not speak or read English. In addition to asking whether registration forms were translated into other languages, I asked what additional types of assistance staff provided to these families to help them understand the ethnic categories they were offered and to choose among the options. I also asked whether staff were provided any training about what the categories meant (e.g., how they were defined) in order to explain the categories to families who may have questions about the options offered or how they should identify their children. Both the school staff and the Migrant Education staff indicated that the immigrant population they predominantly interacted with was Spanish-speakers from Latin America. Spanish translations of registration forms were provided at both schools, and staff members who spoke Spanish were available to assist families in both schools. The Certificate of Eligibility that Migrant Education recruiters used to enroll families was not translated into Spanish, since the recruiter was the person responsible for completing the form. However, most Migrant Education recruiters in the state, including the individual who participated in the study, spoke Spanish. The ethnic categories used by the Migrant Education recruiters were the same as those used in the Meadows school registration forms, although the ethnic categories did not appear on the Certificate of Eligibility (COE) form. The codes for the six ethnic background categories (the OMB ethno-racial pentagon plus an “Other” category) were listed in the instruction manual for how to complete the COE. Staff reported receiving no training on what the categories meant and few inquiries about the racial categories from Spanish-speakers. They also reported that most Spanish-speakers willingly complied with the request for ethnic identification, and most frequently selected Hispanic from the available choices. The manner in which the categories were presented to Spanish-speakers varied among the Spanish-speaking staff charged with assisting families with this task. The Spanish-speaking staff with whom I spoke were Candice (who identified as half White and half Mexican), Jan (who identified as Caucasian), and Isabel (who identified as White Hispanic). According to Candice, Spanish-speakers at New River were typically not provided assistance in interpreting the ethnic categories or how to fill this section out. This was left to family members to figure out on their own. Jan, a Migrant Education recruiter indicated that in accordance with the training she’d received, she simply asked families which category they identify with and would read all six. Isabel, on the other hand, indicated that she typically referred to the Hispanic category first and sometimes referenced the White category too in her conversations with families around the school
registration form. Following is an excerpt from my interview with Isabel where she explains how she approached this issue.
Isabel: I just ask them: Do you think you feel the… the Hispano part? And they say: Yes. And, because they don’t speak English, um… You know, I… maybe I had have very few cases where the, the, White and Hispanic were one thing. And, then I fill both. … MIM: So when you talk with families maybe that don’t read the categories, do you read all the categories, or do you just say, “Are you Hispanic?” Isabel: Hmm. I guess I never had the case like that. They all kind of read [here she says “read” in the past tense, i.e., like red]. And, if they don’t read anything, maybe…. No, I don’t think I have read the whole thing. Just these two. So I make assumptions, I guess.
Jan noted that she was surprised not to encounter more questions in her current job as a recruiter for the Migrant Education program given her previous years of experience helping Latino immigrants complete immigration paperwork that also asked for racial/ethnic identification. In her previous experience, she found that the immigrants with whom she interacted often expressed confusion and/or were more likely to “take it on as an issue”, by either joking about the race/ethnic question or wanting to leave it blank. In contrast, when asked whether she encountered any confusion or resistance to the categories in her current work with the Migrant Education program she stated:
I’ve only been there six months. I’ve probably done, I wonder how many I’ve done… 40 or 50 of the [Certificate of Eligibility] forms? 50…? And, yeah…. So I haven’t had that come up. Even though I expect it would with all my experience filling out forms with immigration – that came up often, you know. People would be like, not knowing what, what they want to say. [She pauses briefly then continues.] I guess I’ve gotten some little joke comments, something like, “Soy Mexicano. I’m Mexican.” A couple of those, but then they’ll just say, “Mark Hispanic.”
Staff Interpretations of Race and Race Data Two major themes emerged from the interviews with staff that characterized how they interpreted the racial categories and their roles within the racial accounting system. The first theme, race is personal, encompasses a general staff sentiment that racial identification was a personal matter, and that staff should play no role in deciding how students and their families identified racially. This was evident in several of the quotes above. Staff consistently minimized their role in the process, and indicated that the process was so routine that families did

The Serious Games of Racial Accounting in Schools
9
not ask questions about it and staff did not insert themselves into these decisions. If families chose not to answer these questions, staff indicated that they did not press the issue, as the following excerpt illustrates.
Candice: Honestly, no one’s ever asked questions about that, that part of the registration card. I know some people will, will decline or say other or something like that and they won’t give that kind of information. MIM: Do you ever follow-up with families who don’t provide that information to see if they forgot to do it or do you just leave it at that? Candice: Honestly, I just leave it at that.
Although data collection procedures are technical and likely boring to most people, race is a sensitive topic and the results of the study suggest that race data collection is as well. There was a general discomfort evident in my conversations with staff regarding race data collection procedures. Several participants were visibly relieved when I informed them that their identity would remain confidential. Discomfort with my questions was particularly evident in my interviews with school and ESD staff. This was likely because they were the individuals primarily responsible for gathering race data from families. While my questions about how racial/ethnic categories get explained to families, especially those that don’t speak English, could be and were shrugged off by district and ODE staff with “you’ll have to ask school staff those questions,” school staff did not have the luxury of “passing the buck.” They were the individuals ultimately responsible for making sure families filled out their registration forms. Families were expected (although not legally required) to check one of the five racial/ethnic boxes on these forms. If they had questions, didn’t fill out this section, or chose multiple boxes, it was the school staff that dealt with these issues. Distancing themselves from the collection of these data appeared to be influenced by staff’s expressed belief that race was a personal matter not just for students and families but for them as well. A second theme that emerged concerned the utility of student race data for staff. Staff weren’t sure how these data could or whether the data should inform their work. Cindy, who worked in the district office, expressed concerns that collecting and analyzing race data ran counter to her belief that race or color shouldn’t matter,
How do you be neutral and then focus on it at the same time. We’re being trained/coached and some of us just know not to treat people different. Then I’m being involved in pulling apart data [into racial categories]. It’s hard to know how to balance that. I’ve grown up in this area, [she mentions a nearby rural community], which is obviously White. Maybe there were one or two Latino students in the school. I don’t have preconceived notions. I notice them, visually. But, others from more racially diverse neighborhoods seem to have
more preconceived ideas about other racial or ethnic groups.
Marla, a front office staff person at Centennial, also believed a student’s ethnicity (which she consistently called “ethnicicity”) wasn’t important, although language background was.
To me it’s more important to know what language you’re speaking than it is to know what ethnicicity [sic] you are. It is. It really is, because … because of that melting pot that we’re all in right now.
George, who worked for the state department of education, suggested that some school staff lack the statistical expertise to understand their student achievement data, and erroneously focus on racial achievement gaps when their problem lies elsewhere. He recounted the following example to illustrate his point.
What they’re trying to improve by their [school improvement] plans should be backed up by, you know, statistics … not guesses…. An example was in [a mid-sized Oregon city]. In [this city], you looked at their data and they said, “Well we’ve got a problem with all, with the minority kids, ‘cuz their tests are down compared to the non-minority kids. And, folks that we had go [sic] there, looked at it, …and said, “No, you’re wrong…. What you do [have is] something happening at the 8th grade.. that’s [what is] wrong. Because the [lower] test scores for minorities is [sic] across all the grades. All the grade levels are below non-minorities. So it’s consistent. But, here in the 8th grade, you’ve got this down drop of everybody…from what, sort of, the norm is. So, there is what your problem is. It’s in your 8th grade.
Interestingly, George’s comments implied that because the racial disparities in achievement were consistent, they were “normal,” not statistically meaningful, and did not merit focused attention by the school.
Implications for Recent Changes to the Rules of the Game
There are myriad rules that govern racial and ethnic data collection practices in schools. Racial and ethnic identity construction, at least in school records, occurs within the context of these ruling relations. In 2010, the rules of the game changed in significant ways. New federal rules governing racial/ethnic data collection in schools went into effect then, rules that were codified in 1997 but had been under review and in various stages of adoption by federal agencies since then (National Forum on Education Statistics, 2008). I discuss what these changes imply based on existing racial accounting practices and staff roles, as well as the broader implications regarding the interpretation and use(s) of these data. Changing Categories and Counts In 2010, “two or more races” became a required data entry and reporting category. The Oregon Department of Education reports this category as “multi-ethnic.” As a

Current Issues in Education Vol. 14 No. 3
10
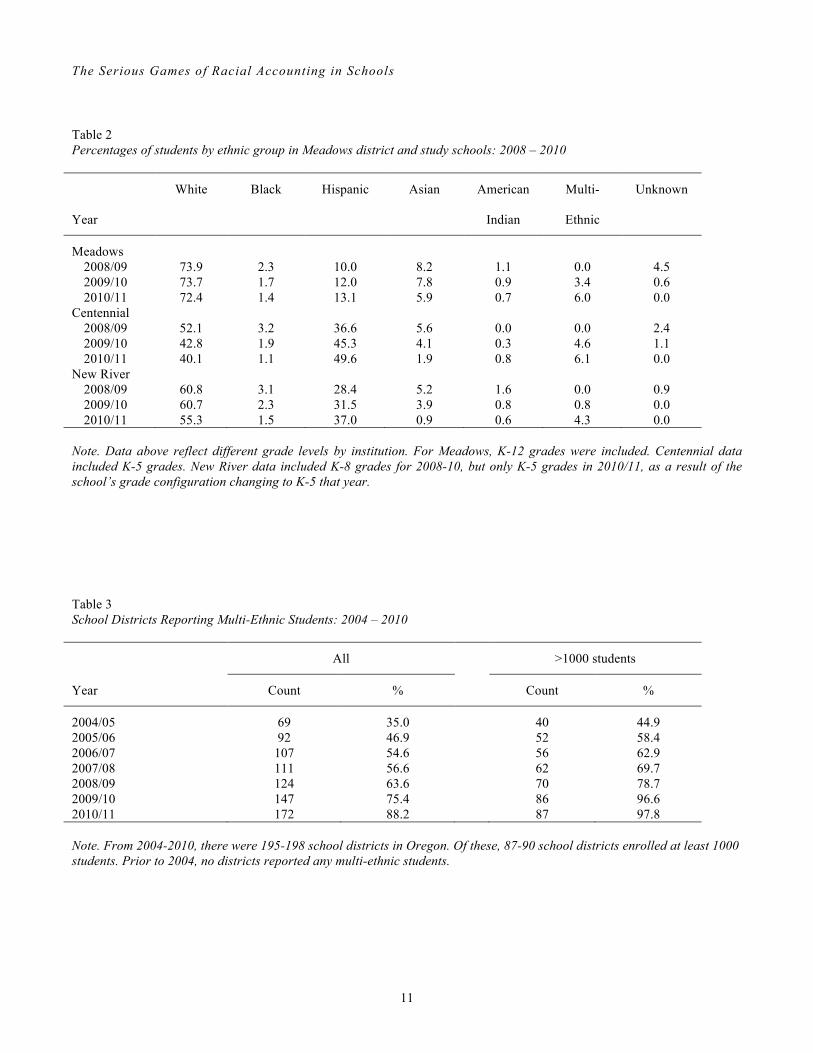
result of this change, the official racial/ethnic make-up of the Meadows schools and many other schools in districts across the state changed – not because of a change in the bodies occupying the school seats, but because the bodies that were already there now had a new name. The Oregon Department of Education’s website provides data on the ethnic breakdown of K-12 students by district for each academic year beginning with the 1997-98 school year. A multi-ethnic category was included in all years in the state’s tally of students but not all Oregon schools appeared to have collected and/or reported these data until 2010. The first year that multi-ethnic students appeared in the state’s student enrollment counts was 2004-05, when 35% of the state’s school districts reported having at least one multi-ethnic student and 0.7% of the state’s total student population was reported as multi-ethnic. Table 1 summarizes the percentages of Oregon students by ethnicity for the state from 2001-2010. Meadows school district did not report any multi-ethnic students until 2009-10, when 3.4% of the district’s students and 2.7% of the state’s total population were reported in this category. The following year the percentage of Meadows’ (6%) and the state’s (4.2%) multi-ethnic students (6%) almost doubled. Table 2 lists the percentages of students by ethnic group for Meadows school district and Centennial and New River schools from 2008-2010. It is hard to know exactly how many students within the Meadows school district would have been
identified as multi-ethnic prior to 2009 or whether the one-year growth in multi-ethnic students was a reflection of new students in the schools or existing students that identified themselves differently and/or were reported by staff differently in the two years. These students were similarly rendered invisible in other district’s student enrollment counts until 2010, when all schools were required to comply with the new federal regulations governing racial/ethnic data collection. Table 3 provides a snapshot of the state’s school districts reporting multi-ethnic students from 2004-2010. A second change relates to the Hispanic category. In 2010, schools were required to use a two-question ethnic/racial identity format on school registration forms that first asks whether the student is Hispanic, followed by a question requesting racial identification. This is the same format used in the U.S. Census since 2000. Since the manner in which Hispanics are counted will remain the same as in previous years (i.e., Hispanics by ethnicity, all others by race), the clear demarcation of Hispanic as an ethnic identity and not a race won’t likely effect the Hispanic counts in K-12 student enrollment. While the racial identity of students who identify as Hispanic will not be counted, Hispanic students will still be asked to identify racially by selecting one or more of the acceptable race options: American Indian or Alaska Native; Asian; Black or African American; and Native Hawaiian or Other Pacific. Because Hispanics frequently interpret the Hispanic/Latino
Table 1 Percentages of K-12 students by ethnic group in Oregon: 2001 – 2010
Year White Black Hispanic Asian American
Indian
Multi-
Ethnic
Unknown
2001/02 77.6 2.9 11.3 4.1 2.1 0 1.9 2002/03 76.3 3.0 12.2 4.1 2.2 0 2.3 2003/04 75.0 3.0 13.4 4.3 2.3 0 2.0 2004/05 72.5 3.2 13.9 4.4 2.2 0.7 3.2 2005/06 72.2 3.0 15.1 4.5 2.2 1.1 1.8 2006/07 70.4 3.0 16.1 4.6 2.1 1.9 2.0 2007/08 69.1 3.0 16.8 4.7 2.1 2.3 2.0 2008/09 68.4 2.9 17.2 4.7 2.0 2.9 1.8 2009/10 67.5 2.8 19.6 4.6 1.9 2.7 1.0 2010/11 66.3 2.6 20.5 3.9 1.9 4.2 0 Note. American Indian category also included Alaska Natives. Asian category also included Pacific Islanders, even in 2010-11 despite the new federal guidelines requiring separately reporting Native Hawaiians/Pacific Islanders beginning that year.
The Serious Games of Racial Accounting in Schools
11
Table 2 Percentages of students by ethnic group in Meadows district and study schools: 2008 – 2010
Year
White Black Hispanic Asian American
Indian
Multi-
Ethnic
Unknown
Meadows
2008/09 73.9 2.3 10.0 8.2 1.1 0.0 4.5 2009/10 73.7 1.7 12.0 7.8 0.9 3.4 0.6 2010/11 72.4 1.4 13.1 5.9 0.7 6.0 0.0
Centennial 2008/09 52.1 3.2 36.6 5.6 0.0 0.0 2.4 2009/10 42.8 1.9 45.3 4.1 0.3 4.6 1.1 2010/11 40.1 1.1 49.6 1.9 0.8 6.1 0.0
New River 2008/09 60.8 3.1 28.4 5.2 1.6 0.0 0.9 2009/10 60.7 2.3 31.5 3.9 0.8 0.8 0.0 2010/11 55.3 1.5 37.0 0.9 0.6 4.3 0.0
Note. Data above reflect different grade levels by institution. For Meadows, K-12 grades were included. Centennial data included K-5 grades. New River data included K-8 grades for 2008-10, but only K-5 grades in 2010/11, as a result of the school’s grade configuration changing to K-5 that year. Table 3 School Districts Reporting Multi-Ethnic Students: 2004 – 2010
All >1000 students
Year Count % Count %
2004/05 69 35.0 40 44.9 2005/06 92 46.9 52 58.4 2006/07 107 54.6 56 62.9 2007/08 111 56.6 62 69.7 2008/09 124 63.6 70 78.7 2009/10 147 75.4 86 96.6 2010/11 172 88.2 87 97.8 Note. From 2004-2010, there were 195-198 school districts in Oregon. Of these, 87-90 school districts enrolled at least 1000 students. Prior to 2004, no districts reported any multi-ethnic students.
Current Issues in Education Vol. 14 No. 3
12
label as a race and not an ethnicity (Logan, 2004; Saenz, 2004; Tafoya et al., 2004), it is unclear how Hispanics will respond to the racial question. A third change that will impact racial/ethnic counts concerns a category that wasn’t explicitly requested in ethnic/race data collections but has nevertheless been allowed. This category is reported by various names: Unknown, Declined to Report, or Other. As of 2010, this category is no longer valid. From 2000-2009, when multi-ethnic students in Oregon schools were either not counted at all or partially counted, unknowns averaged 2.0% of K-12 students in the state. In 2010, 0% of students were reported in this category, and interestingly in one year the multi-ethnic percentage of K-12 students grew from 2.7% to 4.2% in the state, and from 3.4% to 6.0% in the Meadows school district. Whether the increase in multi-ethnic students is a result of (a) families in all school districts being able to self-identify multi-ethnically, (b) staff relying more heavily on multi-ethnic categorization for those who chose not to provide racial/ethnic information, or (c) a combination of both, is unknown. Changing Staff Roles Another change to the racial accounting rules is the requirement that school staff use observer identification when families choose not to answer the ethnicity and/or racial identity questions. Officially, the policy about self-identification of race/ethnicity has not changed: self-identification continues to be optional. However, the new requirement that staff use observer identification when families do not provide this information means that all elementary and secondary students will be racially classified even if they wish not to be. The federal guidelines stress that self-identification continues to be the preferred method of securing racial/ethnic data for students, and that observer identification should be used “as a last resort” in accordance with the following procedures.
If respondents do not provide information about their race or ethnicity, educational institutions and other recipients should ensure that respondents have refused to self-identify rather than simply overlooked the questions. If adequate opportunity has been provided for respondents to self-identify and respondents still do not answer the questions, observer identification should be used (Final Guidance, 2007, p. 59268).
Based on the staff interviews I conducted, observer identification was not a task for which staff were prepared or comfortable. Before staff were aware of the new guidelines, I inquired whether they had received any training in racial data collection and how they should explain the categories to families. They consistently reported that they did not and when they were informed that observer identification would be required in the near future when families did not fill out this section, their eyes grew big. Although observer identification is now required only as a last resort, it seemed clear that staff training about the
categories, their use, and the data collection procedures was necessary and that the federal government’s response to this need was likely insufficient. The 2008 guide to implementing the changes devotes a chapter to training and communication, which includes a list of the staff training topics that should be covered, examples from districts that have already adopted the changes, and other tips such as:
Anticipating questions about race and ethnicity identification will help:
• Middle Eastern students should be identified as “White,” not “Asian.”
• Students from Spain should be identified as Hispanic and one or more of the racial categories (p. 16).
• Districts can provide some “real life” practice as school personnel analyze their current student population, develop scenarios of possible observer misidentification, and anticipate possible data entry errors (p. 18).
This training may help staff better understand their data collection roles and responsibilities, but the training topics highlighted in the federal guide focus on the mechanics and legalities of racial data collection, not the history behind it or the evidence for and against their continued collection and uses. Thus, there are much broader implications to the changes to race data collection that merit further policy attention than simply training school staff about the new rules of the racial accounting game. How should/will multi-racial students challenge our understanding of and responses to school segregation and achievement gap concerns? If Latinos officially count in terms of ethnicity only and they frequently interpret Latino as a racial identity, why is it necessary for Latinos to have an officially sanctioned racial identity? Because educational practitioners, researchers and policymakers regularly rely on race data to make meaning of the educational experiences of students and craft policies in response to the meanings we infer, we all need to grapple with these questions, understand the history and purposes of racial data collection, recognize the limitations of racial measurement, and continually seek better ways to ensure that no child is left behind.
Conclusion This study was designed to shed light on the serious games of racial accounting practices in schools by examining three questions: (1) what officially counts as race, (2) how staff interpret their data-keeping roles and race data, and (3) the implications of the recent changes to racial data collection and reporting. The findings regarding the first question focused on two contested areas of racial truth construction within the context of the previous rules of racial accounting practices: the (non)existence of multi-racial students and Hispanic racial/ethnic ambiguities. Two major themes emerged in response to the second question. The first theme, race is personal, reflected staff’s expressed

The Serious Games of Racial Accounting in Schools
13
desire to distance themselves from the racial identification of students and their discomfort with the topic of race in general. The second theme highlighted the questionable utility of race data for staff. The findings related to the last question suggest that the recent changes in racial accounting practices would likely yield relatively small differences in the racial/ethnic counts of students, but important differences in the official recognition of multi-racial identities and the requirement that all bodies have an official racial label. Moreover, they highlight the need for greater understanding among school staff, researchers, and policymakers about the history, purposes and mechanics of racial data-keeping in schools. Although individuals are actively involved in selecting their own identities and/or the identities of their children within schools, they do so within the context of the ruling relations of race data monitoring. Legally, their active participation in the game is optional. However, for all intents and purposes, after 2010, their participation is mandatory – with all K-12 students officially classified and counted racially, whether they selected this identity or not. This change to racial data-keeping could be viewed as a more accurate reflection of racial realities – whether we choose to play or not, we live in a society in which “there has been a continuous tendency, arguably a necessity, to organize and signify domination along the lines of corporeality/‘phenotype’” (Winant, 2004, p. ix). Measuring race is not an exact science, it is a political science. Thus, the significance of the distortion in racial facts built into the racial/ethnic counts of students lies not just in the actual numbers, but in whether ultimately the racial counts correspond closely enough with the racial realities that we seek to understand and racial injustices that we seek to redress. Measuring these racial truths by racially sorting and counting people is always fraught with error, controversy, compromises, and, increasingly, resistance. In 2003 the American Sociological Association issued a statement in response to the growing skepticism of the validity and utility of race-based research. Refusing to measure the impact of race, the ASA contends, will simply preserve the status quo of racial inequality. Nevertheless, the effectiveness of the racial classificatory scheme to measure truths, albeit partial-truths, in school data-keeping depends on a minimum level of agreement on which racialized bodies should count and how they should count. Whether the new rules will better illuminate racial realities and lead to socially just policies or not depends on how all the players (the families, school staff, researchers and policymakers) regard the purpose and rules of the game, and whether they are in agreement with their purported goals. 1 The terms Latino/a and Hispanic are used interchangeably
throughout the paper.
2 The district name is a pseudonym as are the names of the study schools and participants.
3 For this reason, multi-racial and multi-ethnic are used interchangeably throughout the paper.
References Allen, T. W. (1998a). Summary of the argument of “The
Invention of the White Race”: Part one. Cultural Logic, 1(2). Retrieved July 21, 2008 from http://clogic.eserver.org/1-2/allen.html
Allen, T. W. (1998b). Summary of the argument of “The Invention of the White Race”: Part two. Cultural Logic, 1(2). Retrieved July 21, 2008 from http://clogic.eserver.org/1-2/allen2.html
Allen, T. W. (1999). “Race” and “Ethnicity”: History and the 2000 Census. Cultural Logic, 3(1). Retrieved March 4, 2007 from http://clogic.eserver.org/3-1%262/allen.html
American Sociological Association. (2003). The importance of collecting data and doing social scientific research on race. Washington, D.C.: American Sociological Association.
Anderson, J. D. (2007). Race-conscious educational policies versus a “colorblind constitution”: A historical perspective. Educational Researcher, 36(5), 249-257.
Final Guidance on Maintaining, Collecting, and Reporting Racial and Ethnic Data to the U.S. Department of Education, 72(202) Fed. Reg. 59,266-59,279 (Oct. 19, 2007)
Foucault, M. (2000). The essential works of Foucault, 1954-1984 (Vol. 3/ R. Hurley & Others, Trans.). New York: New York Press. (Original work published 1994)
Fry, R. (2006, October). The changing landscape of American public education: New students, new schools. Washington, D. C.: Pew Hispanic Center.
Gimenez, M. E. (1998). Latinos/Hispanics…What next! Some reflections on the politics of identity in the U.S. Cultural Logic, 1(2). Retrieved July 21, 2008 from http://clogic.eserver.org/1-2/gimenez.html
Hirschman, C., Alba, R., & Farley, R. (2000). The meaning and measurement of race in the U.S. Census: Glimpses into the future. Demography, 37(3), 381-393.
Hollinger, D. A. (1995). Postethnic America. New York, NY: Basic Books.
Ladson-Billings, G. (2004). Landing on the wrong note: The price we paid for Brown. Educational Researcher, 33(7), 3-13.
Logan, J. R. (2004). How race counts for Hispanic Americans. Sage Race Relations Abstracts, 29(7). Retrieved March 10, 2007, from http://sra.sagepub.com
Current Issues in Education Vol. 14 No. 3
14
Mauthner, N. S., & Doucet, A. (2003). Reflexive accounts and accounts of reflexivity in qualitative data. Sociology, 37, 413-430.
Moya, P. (2000). Introduction: Reclaiming identity. Cultural Logic, 3(2). Retrieved March 4, 2007 from http://clogic.eserver.org/3-1%262/moya.html
National Forum on Educational Statistics, Race/Ethnicity Data Implementation Task Force. (2008). Managing an identity crisis: Forum guide to implementing new federal race and ethnicity categories (NFES 2008-802). Washington, DC: National Center on Education Statistics, Institute of Education Sciences, U.S. Department of Education.
No Child Left Behind Act of 2001, Pub. L. No. 107-110. Omi, M., & Winant, H. (1994). Racial formation in the
United States: From the 1960s to the 1990s (2nd Ed.). New York and London: Routledge.
Oregon Department of Education. (2006-2007). Statewide report card: An annual report to the Legislature on Oregon’s public schools. Retrieved December 22, 2008, from http://www.ode.state.or.us/data/
annreportcard/rptcard2007.pdf Ortner, S. (1996). Making gender: The politics and erotics
of culture. Boston, MA: Beacon Press. Parents Involved in Community Schools v. Seattle School District No. 1, et al., 551 U.S. 701 (2007). Retrieved September 21, 2010 from http://laws.findlaw.com/us/000/05-908.html
Saenz, R. (2004). Latinos and the changing face of America. New York, NY: Russell Sage Foundation.
Skerry, P. (2000, March). Counting on the Census? (Policy brief no. 56). Washington, DC: Brookings
Institution. Smith, D. E. (1990). Texts, facts, and femininity: Exploring the relations of ruling. New York and London:
Routledge. Smith, D. E. (1999). Writing the social: Critique, theory,
and investigations. Toronto: University of Toronto Press.
Snipp, C. M. (2003). Racial measurement in the American Census: Past practices and implications for the future. Annual Review of Sociology, 29, 563-588.
Suro, R. (2006a). Beguiling mysteries and known unknowns: The research challenges posed by the Latino experience. Latino Research @ ND, 3(3). Indiana: Institute for Latino Studies at Notre Dame.
Suro, R. (2006b). A developing identity. Hispanics in the United States. Carnegie Reporter, 3(4), Retrieved March 10, 2007, from http://www.carnegie.org/reporter/12/identity/index.html
Tafoya, S. M., Johnson, H., & Hill, L. E. (2004). Who chooses to choose two? New York, NY: Russell Sage Foundation.
Teddlie, C., & Yu, F. (2007). Mixed methods sampling: A typology with examples. Journal of Mixed Methods Research, 1(1), 77-100.
U.S. Department of Energy (n.d.). Human Genome Project Information: Minorities, race and genomics. Retrieved January 31, 2008 from http://www.ornl.gov/sci/techresources/Human_Genome/elsi/minorities.shtml
Winant, H. (2004). The new politics of race. Minneapolis, MN: University of Minnesota Press.
The Serious Games of Racial Accounting in Schools
15
Article Citation Martinez, M. I. (2011). The serious games of racial accounting in schools. Current Issues in Education, 14(3). Retrieved
[date], from http://cie.asu.edu/ojs/index.php/cieatasu/article/view/785 Author Notes Martha I. Martinez University of Oregon 5267 University of Oregon, Eugene, OR 97403 [email protected] Martha I. Martinez recently received her Ph.D. in Educational Methodology, Policy and Leadership from the University of Oregon. Her research examines school policies and practices that impact the educational opportunities and outcomes of underserved populations. She wishes to thank the Center on Diversity and Community at the University of Oregon for the Graduate Summer Research Award that supported this research.
Current Issues in Education Vol. 14 No.3
16
Volume 14, Number 3 August 26, 2011 ISSN 1099-839X Authors hold the copyright to articles published in Current Issues in Education. Requests to reprint CIE articles in other journals should be addressed to the author. Reprints should credit CIE as the original publisher and include the URL of the CIE publication. Permission is hereby granted to copy any article, provided CIE is credited and copies are not sold.
Editorial Team
Executive Editor Lori Ellingford
Assistant Executive Editors
Melinda Hollis
Layout Editor Elizabeth Reyes
Recruitment Editor Rory Schmitt
Copy Editor/Proofreader Lucinda Watson
Section Editors Hillary Andrelchik
Meg Burke Elizabeth Frias Ayfer Gokalp
David Hernandez-Saca Seong Hee Kim Anglea Hines Younsu Kim
Lisa Lacy
Carol Masser Leslie Salazar Jennifer Shea Alaya Swann
Technical Editor
James Stockburger
Faculty Advisors Dr. Gustavo Fischman
Dr. Jeanne Powers