the second national infrastructure assessment: …
TRANSCRIPT
November 2021
THE SECOND NATIONAL INFRASTRUCTURE
ASSESSMENT BASELINE REPORT
2
National Infrastructure Commission | The Second National Infrastructure Assessment Baseline Report
Foreword 3
In brief 4
Executive summary 6
1 Introduction 19
2 Reaching net zero 30
3 Climate resilience and the environment 44
4 Supporting levelling up 56
5 Next steps 74
Acknowledgements 80
The Commission 82
Endnotes 85
Contents
3
National Infrastructure Commission | The Second National Infrastructure Assessment Baseline Report
To build a long term vision for the infrastructure of the future we need to understand where we are today
This Baseline Report surveys the state of our national systems of digital energy flood resilience water and wastewater waste and transport
It enables the Commission to identify the biggest questions about the UKrsquos readiness for the challenges and opportunities of the future and to review developments since we published the first ever National Infrastructure Assessment in 2018
We acknowledge areas of tangible improvement in recent years contributing to generally good levels of public satisfaction with national infrastructure services We highlight the progress of the rollout of gigabit-capable broadband major steps in electricity decarbonisation and the establishment of the UK Infrastructure Bank as examples
But major challenges remain Carbon emissions from economic infrastructure must reduce further and fast We are not investing sufficiently in maintenance of key assets to ensure their resilience in future particularly in the face of climate change Extreme weather also heightens the risk of flooding with surface water flooding a key risk to many properties And our transport systems in many places are not good enough
Inevitably itrsquos a mixed picture but that shouldnrsquot cloud the need for decisive action and the adoption of long term plans supported by adequate funding
This is categorically not the time for complacency To underline this we have decided that the second Assessment will focus on the three strategic themes of reaching net zero climate resilience and the environment and supporting levelling up
Each pose urgent and wide ranging questions Each draw broad political and public support for their end goal Each however offer few quick wins or cheap fixes
So under the umbrella of the themes we propose to tackle nine key challenges over the next two years developing recommendations for the second Assessment due in the second half of 2023 These challenges range from how we can accelerate work to decarbonise home heating to how we can improve urban mobility and reduce congestion
We will now embark on this work ndash informed by input and insight from industry political leaders representative bodies other organisations across the country and the public ndash and formulate policy recommendations to put forward to government
We hope this report prompts discussion but also encourages optimism a confidence that working in a collaborative spirit the private and public sectors can develop infrastructure solutions to meet the challenges of the second half of this century ndash so that every part of the UK can share in the rewards of a safer cleaner better connected society
Sir John Armitt Chair
Foreword
4
National Infrastructure Commission | The Second National Infrastructure Assessment Baseline Report
This Baseline Report sets out the current state of the UKrsquos economic infrastructure and identifies key challenges for the coming decades The Commission will make recommendations to address these challenges in the second National Infrastructure Assessment to be published in the second half of 2023
Since the first Assessment there has been progress on some issues
These include full fibre rollout electricity decarbonisation drought resilience infrastructure financing ndash through the creation of the UK Infrastructure Bank ndash and design
However in other areas there is more to be done
z greenhouse gas emissions from economic infrastructure must reduce further fast
z asset maintenance issues undermine performance in some sectors
z more than three million properties in England are at risk from surface water flooding
z serious pollution incidents from water and sewerage are unacceptably high
z urban transport connectivity varies and is poor in many places
Future trends and government commitments will bring new challenges
z climate change will make it harder to make and keep infrastructure resilience
z nature is declining at unprecedented rates
z the Covid-19 pandemic may lead to long term changes in where people live and work
z new and emerging technologies will offer opportunities across sectors
Delivering on these challenges will require bold action stable plans and long term funding
The Commission has identified nine key challenges for the second Assessment
z all sectors will need to take the opportunities of new digital technologies
z the electricity system must decarbonise fast to meet the sixth Carbon Budget
z decarbonising heat will require major changes to the way people heat their homes
z new networks will be needed for hydrogen and carbon capture and storage
In brief
5
National Infrastructure Commission | The Second National Infrastructure Assessment Baseline Report
z good asset management will be crucial as the effects of climate change increase
z action is needed to improve surface water management as flood risk increases
z the waste sector must support the move to a circular economy
z improved urban mobility and reduced congestion can boost urban productivity
z a multimodal interurban transport strategy can support regional growth
The Commission welcomes views on these key challenges and encourages readers to respond to the Call for Evidence questions set out in this document The Commission will also hold events during the call for evidence period and in the run up to the second Assessment
6
National Infrastructure Commission | The Second National Infrastructure Assessment Baseline Report
Long term infrastructure policy can help address major future challenges such as reaching net zero adapting to climate change reducing environmental impacts and levelling up across regions The Commission will make recommendations to address these challenges in the second National Infrastructure Assessment to be published in the second half of 2023 This document assesses the state of economic infrastructure today and identifies the future priorities for the second Assessment
The Commission has identified three strategic themes for the second Assessment
z Reaching net zero All sectors have more to do to reach net zero particularly transport where road and rail vehicles all need to become zero emission energy where government has committed to decarbonise electricity generation by 2035 and decarbonising heat which will require major changes to the way people heat their homes
z Climate resilience and the environment While economic infrastructure has generally proved resilient to shocks and stresses over recent years climate change will only increase pressures across all sectors and infrastructure sectors have significant impacts ndash both positive and negative ndash on the environment
z Supporting levelling up There is significant variation in the quality of transport provision across England which can affect economic outcomes and peoplersquos quality of life Improving transport provision is therefore key to the governmentrsquos levelling up agenda
All sectors must also take the opportunities offered by new digital technologies
All of this will require significant levels of investment which will ultimately be funded by consumers (via bills) or taxpayers The Commission will carry out cross cutting analysis on all its recommendations for the second Assessment including considering the overall affordability of required investment the distribution of costs and savings across groups in society and who should pay
This document is the start of a conversation with the public and stakeholders about the countryrsquos infrastructure needs and how to meet them which will inform the development of the second Assessment The Commission welcomes responses to the Call for Evidence questions set out in the document and it will also hold a programme of events to gain new insights and evidence
The second National Infrastructure AssessmentThe Commission carries out a National Infrastructure Assessment once every five years These set out the Commissionrsquos assessment of long term needs in the transport energy water and wastewater flood resilience digital and waste sectors and recommendations to meet them including the right policy
Executive summary
7
National Infrastructure Commission | The Second National Infrastructure Assessment Baseline Report
regulatory and funding mechanisms The Assessments are guided by the Commissionrsquos objectives to support sustainable growth across all regions of the UK improve competitiveness and quality of life and the Commissionrsquos new objective to support climate resilience and the transition to net zero carbon emissions by 2050 The Assessments take a long term view looking ahead over the next 10-30 years
The Commission will publish the second Assessment in the second half of 2023 The second Assessment will build on the first Assessment and the Commissionrsquos wider body of work much of which is still relevant It will focus on key challenges not covered in the first Assessment areas where the Commissionrsquos recommendations need to be updated or where the Commission needs to address new issues
The Baseline Report
Progress has been made in some areas since the first Assessment
The first Assessment was published in July 2018 Since then it has shaped infrastructure policy across sectors The governmentrsquos National Infrastructure Strategy a formal response to the Assessment aligned closely with the Commissionrsquos recommendations and there has been significant progress on many of the recommendations including
z access to gigabit capable broadband the government has set out a clear vision to deliver gigabit capable broadband to at least 85 per cent of UK premises by 2025 ndash in late 2021 this was well underway reaching over 50 per cent of premises
z a shift to renewable electricity there has been a shift towards a highly renewable electricity system with almost 40 per cent of electricity generated by renewable sources in 2019
z electric vehicles government has banned the sale of new petrol and diesel cars and vans in the UK from 2030 following the Commissionrsquos recommendation that charging infrastructure should be delivered to enable this shift
z flooding the government will invest pound56 billion over the next six years to reduce the risk of flooding following Commission recommendations
z drought resilience government and the water industry in England have taken on the Commissionrsquos recommendations to increase water supply and reduce leakage
z the UK Infrastructure Bank the independent infrastructure financing institution the Commission recommended be established following the UKrsquos loss of access to the European Investment Bank was launched in June 2021
z design principles the government endorsed the Commissionrsquos design principles and recommendation for board level design champions on major infrastructure projects
Infrastructure has continued to perform well in some areas
The Commissionrsquos performance assessment has identified several areas where infrastructure is performing well including
z access to mobile connectivity 92 per cent of the UK landmass is covered by at least one mobile operator with a funded plan to increase this to 95 per cent by 2026
8
National Infrastructure Commission | The Second National Infrastructure Assessment Baseline Report
z reliable energy supply the energy sector delivers electricity and gas of reliable quality to consumers ndash loss of supply is rare and interruptions to supply are reducing over time
z access to clean water the water sector delivers water of reliable quality to homes and businesses across England with low numbers of service interruptions and customers are generally satisfied with the water and wastewater services provided
Social research
In June 2021 the Commission carried out social research with a range of respondents from across the UK nationally representative by age gender region and ethnicity
The research showed relatively high levels of confidence from respondents from across the UK that infrastructure will meet peoplersquos needs over the next 30 years with confidence increasing since the first Assessment Only two sectors ndash flood resilience and waste ndash had lower than 70 per cent confidence with the digital sector performing particularly strongly This social research will shape the Commissionrsquos approach to the second Assessment
Figure 01 Public confidence in infrastructure has improved since the first Assessment
Percentage of respondents who were confident that the sector would meet their needs in the next 30 years in 2021 vs in 2017 (ahead of the first Assessment)
Source PwC (2021) NIA2 Social Research Final report
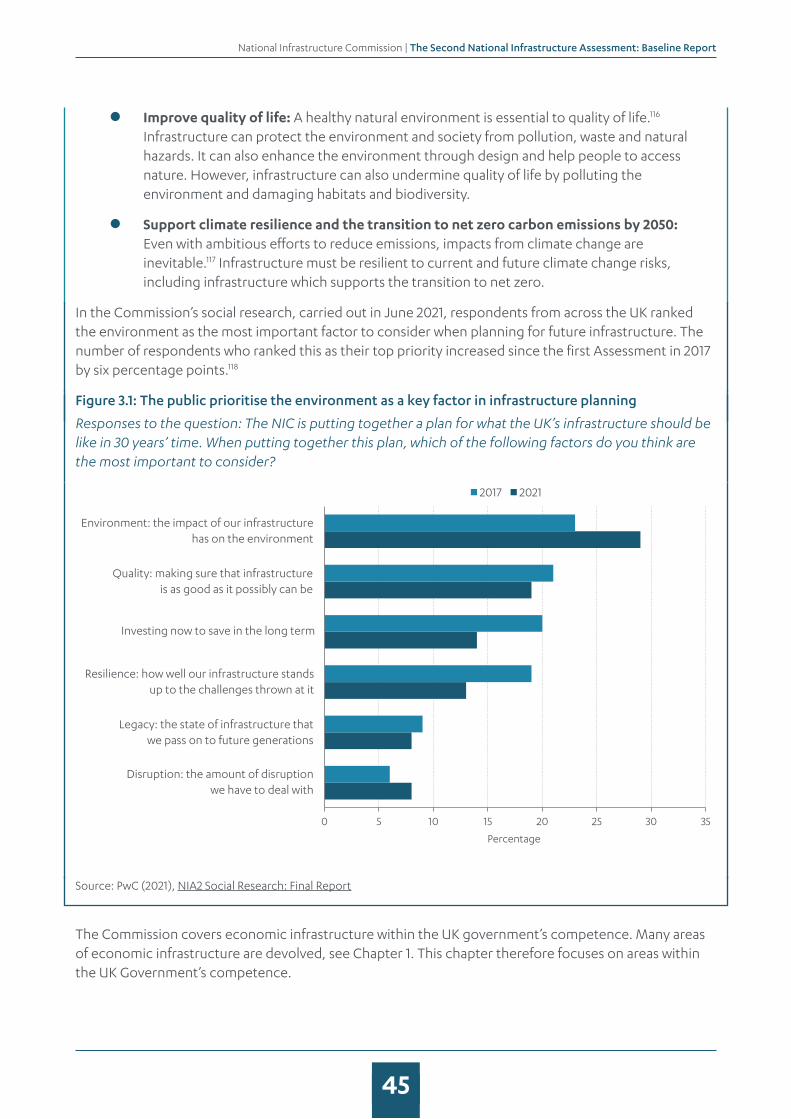
The research also showed that the public increasingly believe that infrastructure should lead the fight against climate change and a plan for infrastructure should consider the impact of infrastructure on the environment
0 10 20 30 40 50 60 70 80 90 100
Flood management
Solid waste
Transport
Water andwastewater
Energy
Digital
Percentage
Sect
or
2017 2021
9
National Infrastructure Commission | The Second National Infrastructure Assessment Baseline Report
However in other infrastructure areas there is a lot more to be done
Nevertheless there remain major significant challenges across sectors particularly to reduce emissions Key areas where infrastructure needs to improve performance
z emissions from electricity and heat are still too high as the electricity sector will need to reduce emissions to near zero by 2035 and little progress has been made so far on heat decarbonisation although the technologies to do so already exist
z emissions from transport have not been declining despite improvements in engine efficiency and although electric vehicle charge point numbers are increasing the pace needs to pick up to enable a transition to electric vehicles in the 2020s and 2030s
z asset maintenance issues undermine performance in some sectors including ageing and leaky water pipes and potholes in local roads
z more than five million properties are currently at risk of flooding in England including more than three million at risk of surface water flooding
z serious pollution incidents from water and sewerage have plateaued at an unacceptably high level and 32 per cent of water bodies in England do not have good ecological status due to continuous discharges from sewage and seven per cent due to stormwater overflows
z recycling rates have plateaued and emissions from waste have begun to rise again while the total waste generated in England is also increasing
z urban transport connectivity is poor in many places and the largest urban areas tend to have the worst connectivity as congestion slows down journeys
z there are wide variations in interurban connectivity between similar places but with no clear regional patterns or trends
Progress is already being made in some of these areas including reducing emissions from electricity enabling the transition to electric vehicles and reducing the risks of flooding However there is still further to go More detail on the performance of each sector is set out in annexes A-F
The overall cost to households of infrastructure services has remained relatively stable over the last ten years At the same time there have been significant increases in investment in many areas Average energy bills rose from the mid-2000s until the mid-2010s and then gradually declined
However gas prices have risen significantly in recent months pushing up the price of both gas and electricity as gas remains a significant input into electricity generation Domestic consumers have been shielded from some of this volatility due to the regulated cap on energy prices introduced from 2017 But prices have risen and are expected to rise further Businesses have also been affected especially those that are energy intensive This inevitably creates serious problems for some households and firms
Current high prices appear to be mostly due to temporary factors including the effects of the Covid-19 pandemic Prices may fall again but volatility in prices is inherent in a system dependent on fossil fuels As set out below this price volatility reinforces the strategic need to transition to a low carbon energy system as soon as practicable
10
National Infrastructure Commission | The Second National Infrastructure Assessment Baseline Report
Infrastructure also faces new challenges
As well as improving current performance infrastructure must be prepared for future challenges including from a changing climate and behaviour change following the Covid-19 pandemic And it should also take the opportunities offered by new digital technologies
Infrastructure sectors are beginning to tackle the challenge of reaching net zero reducing the impact of infrastructure on the climate But the climate will also have impacts on infrastructure Sectors must prepare for the risks of a changing climate including increased incidence of flooding and drought
And alongside climate change there is another environmental crisis that must be addressed Global assessments show that nature is declining at rates unprecedented in human history with accelerating rates of species extinction and severe disruption to ecosystem services Infrastructure contributes to this decline but can also help prevent it
Finally the Covid-19 pandemic may lead to long term changes in where people live and work This in turn could lead to new patterns of infrastructure demand especially in the transport sector where there may be a change in the established levels of demand for different modes Car use has already returned to levels seen before the Covid-19 pandemic but in the longer term the way people use roads and public transport could be very different
Key challenges for the second Assessment
Bold action and stable plans will be needed to address the existing issues and prepare for the coming challenges The Commission has identified the key areas that it will develop recommendations on in the second Assessment The Commission has focussed on those that have a good fit with the Commissionrsquos remit are strategically important and are an issue where the Commission can add value considering the current policy landscape and the Commissionrsquos existing work The key challenges are set out thematically in figure 02 and in Chapters 1-3
Digital technologies present opportunities for all sectors
Higher quality digital infrastructure will present opportunities across the economy including the opportunity to make improvements in all other infrastructure sectors The adoption of digital technologies has the potential to cut costs enhance service quality improve resilience and enable better demand management across a range of infrastructure services Sensors can be deployed across infrastructure assets to monitor their condition allowing for more timely and efficient maintenance interventions Real time data on road use could facilitate better traffic management and alleviate congestion However the adoption of digital technologies in infrastructure is patchy
Challenge 1 The digital transformation of infrastructure ndash the Commission will consider how the digital transformation of infrastructure could deliver higher quality lower cost infrastructure services
11
National Infrastructure Commission | The Second National Infrastructure Assessment Baseline Report
Figure 02 Key challenges for the second assessment
Link to other theme
Challenge
Waste and the circular
economy
Decarbonising electricitygeneration
Heat transition and energy efficiency
Networks for hydrogen
and CCS
Surface water
management
Interurbantransport
across modesUrban
mobility and congestion
Digital transformation
Asset managementand resilience
C L I M AT E R E S I L I E NC
E A
ND
TH
E E
NV
I RO
NM
EN
TR
EA
CH
I NG
NE
T Z
E R O
S U P P O R T I N G L E V E L L I N G U P
12
National Infrastructure Commission | The Second National Infrastructure Assessment Baseline Report
Reaching net zeroTo meet its legally binding climate targets the UK must reduce its overall greenhouse gas emissions by 78 per cent compared to 1990 levels by 2035 and to net zero by 2050 In October 2021 the government published its Net Zero Strategy setting out how it will deliver against its commitment to reach net zero emissions by 2050
Economic infrastructure sectors generate a major part of the UKrsquos current emissions ndash in 2019 direct emissions from the energy transport and waste and wastewater sectors accounted for over 66 per cent of all UK greenhouse gas emissions Reducing emissions is important to the public the Commissionrsquos social research carried out in June 2021 found that people cited fighting climate change by reducing greenhouse gases as the top priority for the UKrsquos infrastructure in 30 yearsrsquo time
Figure 03 Energy transport and waste account for a large proportion of total UK emissions
Total UK greenhouse gas emissions split by infrastructure sector 1990 and 2019
Source Department for Business Energy amp Industrial Strategy (2020) Final Greenhouse Gas Emissions National Statistics 2019
Reaching net zero will require high levels of investment both to decarbonise existing infrastructure networks and to build new ones for example for carbon capture and storage and hydrogen This investment will ultimately need to be funded by either consumers (via bills) or taxpayers The Commission will consider funding challenges in the second Assessment including the overall affordability of required investment the distribution of costs and savings across groups in society and who should pay
Decarbonising electricity generation
Electricity has made significant progress towards net zero decarbonising faster than any other sector In 2019 total emissions from electricity were around 60 MtCO
2e a reduction of 74 per cent since 1990 But
the electricity system must now move away from fossil fuels ndash government has committed to electricity
0
100
200
300
400
500
600
700
800
900
1990 2019
MtC
O2e
Year
Energy (incl electricity and heat) Transport (incl international aviation and shipping)
Waste (incl energy from waste) Wastewater handling
Non-infrastructure
13
National Infrastructure Commission | The Second National Infrastructure Assessment Baseline Report
generation reaching nearly zero emissions by 2035 subject to being able to maintain security of supply Over the same time the electricity system will need to adapt to deliver on major increases in demand as other sectors decarbonise
A net zero electricity system must also be secure and low cost As the current energy price shock has shown the volatility inherent in gas and oil prices ndash as internationally traded commodities ndash can have serious impacts on households and businesses A low carbon electricity system based more on long-lasting capital assets like wind farms and nuclear power plants should reduce exposure to this kind of shock
Challenge 2 Decarbonising electricity generation ndash the Commission will consider how a decarbonised secure and flexible electricity system can be achieved by 2035 at low cost
Decarbonising heat and improving energy efficiency
Decarbonising heat is complex and progress has been slow Total emissions from buildings in 2019 were around 90 MtCO
2e only a 17 per cent fall on 1990 levels Most of these emissions arise from burning
fossil fuels for heating Providing zero carbon heat will likely require transitioning to a mix of electric heating and heat from hydrogen alongside improving the energy efficiency of buildings with insulation to reduce the demand for energy for heat The heat transition has so far proved difficult to implement as it directly affects individuals and causes significant disruption in homes buildings and at street level
The government has recently published its strategy for decarbonising heat via a gradual transition It contains new funding commitments to support installation of low carbon heating systems in homes with the goal that no new gas boilers will be sold by 2035 However there are still major questions to be answered including what level of insulation will be needed to efficiently operate heat pumps whether hydrogen for heating will be available as a source of heat for all homes what this means for the continuing use of the gas network and how to deliver these major changes in peoplersquos homes
Challenge 3 Heat transition and energy efficiency ndash the Commission will identify a viable pathway for heat decarbonisation and set out recommendations for policies and funding to deliver net zero heat to all homes and businesses
New networks to decarbonise hard to abate sectors
As well as transforming the existing infrastructure for electricity and heat the UK needs new infrastructure networks to decarbonise including
z hydrogen networks to help decarbonise hard to electrify sectors such as heavy industry shipping aviation heavy goods vehicles parts of the rail network and heat
z carbon capture and storage networks which will be needed to decarbonise parts of industry hydrogen production electricity generation (from sources such as waste incineration or biomass) and to enable engineered greenhouse gas removals
Challenge 4 Networks for hydrogen and carbon capture and storage - the Commission will assess the hydrogen and carbon capture and storage required across the economy and the policy and funding frameworks needed to deliver it over the next 10-30 years
14
National Infrastructure Commission | The Second National Infrastructure Assessment Baseline Report
Climate resilience and the environmentEconomic infrastructure has generally proved resilient to shocks and stresses over recent years although good asset management will be important in future Climate change will increase a variety of risks that affect economic infrastructure in the coming decades with floods and drought a key risk
Alongside climate change there is another environmental crisis Global assessments show that nature is declining at rates unprecedented in human history with accelerating rates of species extinction and severe disruption to ecosystem services Infrastructure contributes to this decline in natural capital and biodiversity but can also help prevent it The Commission supports an lsquoenvironmental net gainrsquo approach for all infrastructure projects (which includes but is wider than biodiversity net gain) ensuring that developers leave the environment in a measurably better state than they found it
There are challenges in some sectors that affect the governmentrsquos objectives from the 25 Year Environment Plan including minimising waste and ensuring clean air and clean and plentiful water The challenges under lsquoreaching net zerorsquo will help to address the clean air objective while the Commissionrsquos previous recommendations supported the objective on clean and plentiful water However the net zero target means that the Commission will need to revisit its work on waste in the second Assessment including considering how to further increase recycling The government has also committed to move to a more circular economy which could have wider implications for the sector
Resilience must be embedded in asset management approaches
Good asset management requires managing infrastructure assets so that they can deliver services in a cost effective and timely way This will be crucial to maintain resilience and performance as existing pressures increase or new ones emerge There is already concern about the condition of assets in some sectors ndash the UK is still reliant on infrastructure built during the nineteenth century including roads railways tunnels water pipes and sewers Some older components can be at greater risk of failure as they were not constructed to be resilient to extreme weather There is also a lack of data on asset condition and in some cases deterioration is not noticed until a failure occurs Furthermore decision making frameworks can undervalue maintenance and disincentivise good asset management
Challenge 5 Asset management and resilience ndash the Commission will consider how asset management can support resilience barriers to investment and the use of data and technology to improve the way assets are maintained
Surface water management is a key resilience challenge
Droughts and floods will be a key risk for infrastructure as the climate changes Government and industry are making progress on drought resilience and coastal and river flooding following the Commissionrsquos recommendations in the first Assessment However surface water flooding which the Commission has not yet considered in detail presents a risk to more than 3 million properties
Multiple organisations are currently responsible for assets that affect surface water flooding including local authorities drainage boards highways authorities and water companies Relatedly reducing sewer overflows and the pollution they cause will be a key challenge for the water and wastewater sector in the future The government is making improvements in this area but the scale of the challenge may require a more fundamental review of current arrangements In the second Assessment the
15
National Infrastructure Commission | The Second National Infrastructure Assessment Baseline Report
Commission will carry out a dedicated study as requested by government on effective approaches for managing surface water in England This will consider issues of planning funding and governance arrangements as well as the role of data and nature based solutions
Challenge 6 Surface water management ndash the Commission will consider actions to maximise short term opportunities and improve long term planning funding and governance arrangements for surface water management while protecting water from pollution from drainage
The Commission will deliver this as a separate study and report to government by November 2022 in advance of its other recommendations
The waste sector can support the move to a circular economy
Waste infrastructure helps to protect the environment by enabling the safe collection processing and disposal of municipal and industrial waste preventing harmful waste products from entering the natural environment The government has framed its waste objectives as part of the move to a more circular economy ndash one where products and materials are kept in productive use for longer and the environmental impacts from extracting raw materials are reduced In the second Assessment the Commission will consider additional changes needed in the waste sector to enable the move to a more circular economy and to reduce the environmental impacts of waste This will include looking at ways to increase recycling rates for municipal and construction waste and deliver the infrastructure needed to achieve net zero It will also look at waste processing capacity and interdependencies with other economic infrastructure sectors including energy and water and construction waste
Challenge 7 Waste and the circular economy ndash the Commission will examine the role of the waste sector in enabling the move towards a more circular economy
Supporting levelling upThe government has set itself the ambition of lsquolevelling uprsquo outcomes across the UK reducing disparities between different towns cities and regions These variations are caused by multiple interacting factors Addressing these disparities is hard Infrastructure can help address them but it cannot do so singlehandedly
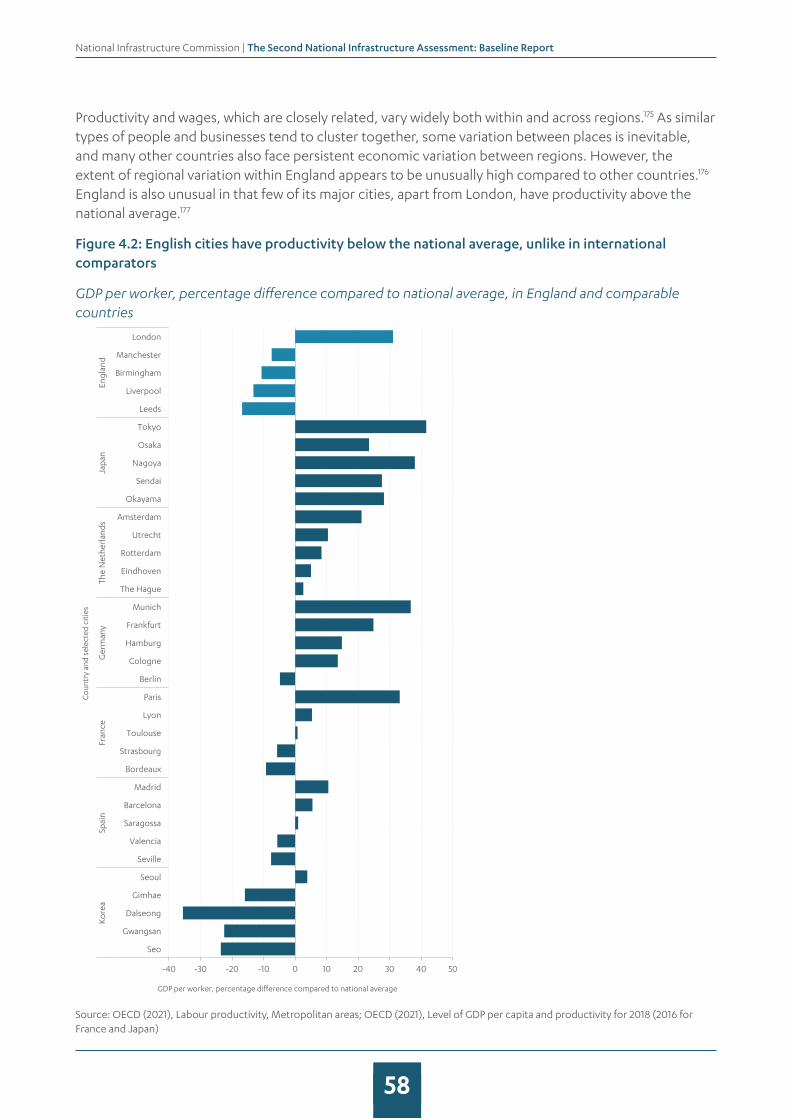
Productivity potential varies as different parts of the country play different roles in the economy and different places have different economic densities ndash for example it is not realistic to have the same productivity in rural Cumbria as in central Manchester While no two places are exactly the same the Commission will look at broadly comparable places to assess economic potential
While most infrastructure sectors can have some impact on outcomes improvements in the transport sector can improve quality of life and help address constraints to growth and with the right conditions contribute to economic transformation in particular places ndash for example major rail stations and other nationally significant infrastructure projects can offer significant potential for urban regeneration and these opportunities should be maximised
The Commission has made recommendations in the past to support levelling up covering
z Devolved powers and funding for cities and towns to develop locally led infrastructure strategies Infrastructure strategies need to be developed and determined locally by people who understand the needs and strengths of the area
16
National Infrastructure Commission | The Second National Infrastructure Assessment Baseline Report
z The need for infrastructure strategies to form part of wider economic strategies While infrastructure can improve productivity and make places more liveable it is not the whole solution ndash factors like skills and education also have an important role to play and therefore need to be aligned to infrastructure investment
z The need for local capacity to deliver these strategies Government should make expert support and advice available to help those local authorities where capacity is an obstacle to developing and delivering their infrastructure strategies
In the second Assessment the Commission will take account of where places are not achieving their economic potential to identify where interventions are likely to deliver significant benefits ndash for example identifying where growth could be unlocked by increasing capacity in congested city centres ndash and consider how these interventions can improve both productivity and quality of life in the places concerned
In the energy sector the Commission will consider opportunities for major investments in new low carbon infrastructure to support levelling up by boosting growth in lower productivity places ndash the development of offshore wind energy has already created new opportunities for coastal towns close to large wind farms such as Grimsby The Commission will also analyse how each of its recommendations reduce regional differences and support improvements in national productivity
Improved connectivity and reduced congestion can boost urban productivity
Before the Covid-19 pandemic many major cities suffered from congestion and poor public transport connectivity preventing goods services and people from travelling in an efficient and sustainable way Overcrowded or slow transport networks limited the ability of businesses and workers to locate in dense city centres which has been a major barrier to urban productivity and growth
The Covid-19 pandemic may lead to new travel patterns changing the established levels of demand for different modes Car use has already returned to levels seen before the Covid-19 pandemic but in the longer term the way people use roads and public transport could be very different Urban transport strategies need to be robust to different future scenarios
The busiest cities with the most growth potential may need very large scale transport capacity projects or network extensions allowing people in nearby towns to work some days in a central location Demand management policies such as congestion charging may also be needed to maximise the benefits of transport for agglomeration and productivity
Challenge 8 Urban mobility and congestion ndash the Commission will examine how the development of at scale mass transit systems can support productivity in cities and city regions and consider the role of congestion charging and other demand management measures
A multi-modal transport strategy can support regional growth
Investment in interurban road and rail can support regional growth Transport connectivity varies significantly between places but there is not an obvious north-south or rural-urban divide in performance Furthermore technological innovation decarbonisation and behaviour change all mean that patterns of transport demand and ways to meet that demand may be very different in future
17
National Infrastructure Commission | The Second National Infrastructure Assessment Baseline Report
It is difficult to determine the optimal balance of investment between different places and modes A multi modal transport strategy could help the country plan more effectively for sustainable growth quality of life outcomes and the shift to net zero optimising the use of different accessible modes
Challenge 9 Interurban transport across modes ndash the Commission will consider relative priorities and long term investment needs including the role of new technologies as part of a strategic multimodal transport plan
Next stepsThe Commission welcomes views on the themes and challenges it has identified for the second Assessment Interested parties are encouraged to respond to the Call for Evidence questions set out in this document The Commission will also hold a programme of events during the call for evidence period and in the run up to the second Assessment to explore policy questions in detail with regional and sectoral stakeholders
The Commission will also research the views and preferences of the public to shape its recommendations The Assessment will be supported by expert panels of industry specialists academics and regulators who will assess and challenge the Commissionrsquos emerging thinking and by its Design Group and Young Professionals Panel
The Commission will take a range of approaches to manage uncertainty including that created by the Covid-19 pandemic by making recommendations which balance the risks of major investment making complementary recommendations and planning for future decisions The Commission will use a range of scenarios to be published in spring 2022
Cross-cutting analysis
The Commission will carry out cross-cutting analysis to inform the policy options and assess the impact of recommendations in the Assessment across six categories
z bills impact the second Assessment will show the total costs of recommendations that will be raised through bills including assessing the impact of the Commissionrsquos recommendations on household bills overall in line with its economic remit
z public spending impact the Commission will set out the impact of its recommendations on gross public investment in economic infrastructure in line with its fiscal remit
z distributional impacts assessing whether recommendations will have disproportionate impacts on specific groups of people
z climate change impact assessing the impacts of economic infrastructure and the Commissionrsquos recommendations on greenhouse gas emissions
z environmental impact assessing how the economic infrastructure and the Commissionrsquos recommendations affect the UKrsquos natural capital and biodiversity
z regional impacts assessing whether recommendations will have disproportionate impacts on regions
18
National Infrastructure Commission | The Second National Infrastructure Assessment Baseline Report
The Commission will look at the appropriate policy regulatory and funding mechanisms to meet the infrastructure needs covered by the recommendations in the second Assessment and will consider the most effective decision-making models for infrastructure balancing national and local needs and priorities Recommendations will also be guided by the Commissionrsquos design principles for national infrastructure climate people places and value
19
National Infrastructure Commission | The Second National Infrastructure Assessment Baseline Report
Ahead of the second National Infrastructure Assessment the Baseline Report sets out an evaluation of the performance of the six infrastructure sectors in the Commissionrsquos remit identifies nine key infrastructure challenges for the second Assessment and asks Call for Evidence questions on these topics The key challenges are grouped under three strategic themes reaching net zero climate resilience and the environment and supporting levelling up
11 The Baseline ReportThe Commission carries out a National Infrastructure Assessment once every five years setting out the Commissionrsquos assessment of long term needs in the digital energy flood resilience water and wastewater waste and transport sectors and recommendations to meet them including the right policy regulatory and funding mechanisms The Assessments are guided by the Commissionrsquos objectives to support sustainable growth across regions improve competitiveness and quality of life and its new objective to support climate resilience and the transition to net zero carbon emissions by 2050 The Assessments take a long term view looking ahead over the next 10-30 years
The Commissionrsquos remit covers economic infrastructure within the UK Governmentrsquos competence Many areas of economic infrastructure are devolved see figure 11 The Commissionrsquos role is to advise the UK Government but the Commission works with both the UK Government and the devolved administrations where responsibilities interact
Figure 11 Devolved administration responsibilities by infrastructure sector
Sector Devolved administration responsibility
Northern Ireland Scotland Wales
Digital Reserved Reserved Reserved
Energy Devolved except nuclear
Reserved except energy efficiency
Reserved except energy efficiency
Flood risk Devolved Devolved Devolved
Transport Devolved except aviation and maritime
Largely devolved except aviation and maritime
Road transport largely devolved most rail aviation and maritime reserved
Waste Devolved Devolved Devolved
Water and wastewater
Devolved Devolved Devolved
1 Introduction
20
National Infrastructure Commission | The Second National Infrastructure Assessment Baseline Report
The first Assessment was published in July 20181 Since then it has shaped infrastructure policy across the UK The governmentrsquos National Infrastructure Strategy a formal response to the Assessment aligned closely with the Commissionrsquos recommendations2
The Baseline Report has three key functions
z setting out an evaluation of the performance of the six economic infrastructure sectors
z identifying the nine key future infrastructure challenges for second Assessment which will set out recommendations to address them
z inviting views on the set of challenges it has identified through call for evidence questions
The Commission has identified the key challenges that it will consider in the second Assessment based on issues identified through the performance metrics progress that is already being made future trends and the publicrsquos priorities as identified through social research The Commission has also focussed on those that have a good fit with the Commissionrsquos remit are strategically important and are an issue where the Commission can add value considering the current policy landscape and the Commissionrsquos existing work
In October 2021 the Commission was given a new objective to support climate resilience and the transition to net zero carbon emissions by 2050 The Commission is confident that the key challenges identified are consistent with this new objective ndash the Commission has considered both climate resilience and net zero in its work to date3 and both are strategic themes in this Baseline Report Chapters 2-4 set out how each strategic theme aligns to all four of the Commissionrsquos objectives
Alongside a cross cutting digital challenge (see section 14) a further eight challenges have been identified which are grouped under three strategic themes
z reaching net zero
z climate resilience and the environment
z supporting levelling up
The key challenges the Commission has identified are set out in figure 12 overleaf
The Commission will publish the second Assessment in the second half of 2023 The Commission ndash and the Assessments ndash take a long term view making recommendations over the next 10-30 years and encouraging long term stable infrastructure policy Many recommendations from the first Assessment ndash or from the Commissionrsquos studies see box 11 ndash are therefore still relevant In addition government has made progress in implementing many of the Commissionrsquos existing recommendations where they were endorsed or its own approach where they were not The Commission will continue to monitor delivery but will not generally revisit these issues
However in some areas ndash such as the governmentrsquos commitments on the environment and climate the effects of the Covid-19 pandemic or technologies that can support infrastructure ndash the context has changed since the first Assessment Therefore while the first Assessment made recommendations across all sectors the second will focus on the remaining key challenges areas where the Commissionrsquos recommendations need to be updated or where the Commission needs to address new issues
21
National Infrastructure Commission | The Second National Infrastructure Assessment Baseline Report
Figure 12 Key challenges for the second Assessment
Following the first Assessment the Commission carried out a comprehensive engagement process with its staff and external stakeholders to gather feedback The conclusions of this were published in a paper in March 20194 The Commission has taken this feedback into account in this document and in the plans for the second Assessment
Link to other theme
Challenge
Waste and the circular
economy
Decarbonising electricitygeneration
Heat transition and energy efficiency
Networks for hydrogen
and CCS
Surface water
management
Interurbantransport
across modesUrban
mobility and congestion
Digital transformation
Asset managementand resilience
C L I M AT E R E S I L I E NC
E A
ND
TH
E E
NV
I RO
NM
EN
TR
EA
CH
I NG
NE
T Z
E R O
S U P P O R T I N G L E V E L L I N G U P
22
National Infrastructure Commission | The Second National Infrastructure Assessment Baseline Report
Box 11 Commission studies since the first Assessment
Since the first Assessment the Commission has published studies as requested by government on
z Freight The Commission found that through the adoption of new technologies and the recognition of freightrsquos needs in the planning system it is possible to decarbonise road and rail freight by 2050 and manage its contribution to congestion The government welcomed the core themes of the Commissionrsquos report and will develop these themes through the Freight Council and the Future of Freight strategic Plan
z Regulation The Commissionrsquos regulation study set out how regulators industry and government must adapt to face the coming challenges of achieving net zero ensuring resilience and increasing digitalisation The study looked at how to keep critical services affordable ensure competition and attract the right levels of investment and innovation The government has responded to the Commissionrsquos recommendations to improve regulation and will set out further details later this year
z Resilience The Commissionrsquos study examined how to improve the resilience of the UKrsquos water digital transport and energy infrastructure including the key strategic changes required to meet forthcoming challenges while maintaining levels of service for users Government has accepted the potential role for more and better resilience standards and stress testing and will set out further details in the National Resilience Strategy
z Rail Needs Assessment for the Midlands and the North To inform the governmentrsquos Integrated Rail Plan the Commission developed a menu of options for a programme of rail investments in the Midlands and the North using three different illustrative budget options The Commission recommended an adaptive approach beginning with a core set of programmes
z Engineered greenhouse gas removals The study set out that engineered greenhouse gas removals will become a major new infrastructure sector for the UK over the coming decades It recommended that government ensure the first engineered removals plants are up and running no later than 2030 delivering 5-10 MtCO
2e of removals per year The
governmentrsquos Net Zero Strategy has since set an ambition to deploy at least 5 MtCO2e of
engineered greenhouse gas removals by 2030 rising to around 23 MtCO2e by 2035 and a
plan to consult in 2022 on business models to incentivise investment
z Towns This study focused on towns and suburban centres considering the potential for both economic and quality of life benefits from infrastructure intervention in different types of towns The Commission awaits governmentrsquos response
12 Work informing the second AssessmentThe Baseline Report forms part of a wide body of work to inform the second Assessment The Commission has published a number of supplementary papers since the first Assessment aside from its studies (see above) and annual monitoring reports and more are planned in the run-up to the second Assessment
23
National Infrastructure Commission | The Second National Infrastructure Assessment Baseline Report
The Commissionrsquos interpretation of its objectives
The Commission is in the process of publishing discussion papers on its interpretation of its objectives including two discussion papers published to date covering the first two objectives
z Supporting sustainable economic growth across regions Growth across regions sets out the relationship between economic infrastructure and local growth and identifies three pathways for infrastructure investment to help achieve economic outcomes in regional areas addressing constraints to growth contributing to transformation and universal provision5
z Improve competitiveness Improving competitiveness identifies three ways in which infrastructure can contribute to competitiveness improving access to markets improving access to mobile labour and capital supporting and being a source of globally significant clusters and assets6
The Commission is planning to publish a discussion paper on its quality of life objective in spring 2022 It has also published a literature review on the impacts of infrastructure on quality of life which sets out a rapid evidence assessment of the impact of each of the Commissionrsquos six infrastructure sectors on quality of life7 The Commission has recently been given a new objective to support climate resilience and the transition to net zero carbon emissions by 2050 and will consider in due course whether to publish a discussion paper on this objective
Drivers of infrastructure supply and demand
Ahead of the first Assessment the Commission published documents on drivers of infrastructure supply and demand8 The theoretical relationships between each of these drivers and infrastructure supply and demand remain largely unchanged since the first documents were published however there are some updates
z Environment and climate change Chapter 3 sets out the Commissionrsquos up to date understanding of the impact of climate change on the infrastructure sectors and the impact of sectors on the environment
z Economy The UK is still recovering from the historic shock caused by the Covid-19 pandemic The Commission will consider the implications of this as more data emerges based on forecasts from the Office for Budget Responsibility
z Population and demography An ageing population and the impact of the UKrsquos exit from the EU mean that population projections have changed since the original paper was published The Office for National Statistics is expected to publish updated projections in December 2021 The Commission will consider the impact of these once latest projections are available
z Technological change The original paper included a horizon scan of new technologies that could impact infrastructures supply and demand9 The Commission will publish an update to this in spring 2022
z Behaviour change Since the first Assessment the Commission has published a fifth paper on a driver of infrastructure supply and demand Behaviour change and infrastructure beyond Covid-1910 The Commission will continue to monitor the impacts of behaviour change as data emerges
24
National Infrastructure Commission | The Second National Infrastructure Assessment Baseline Report
The Commission will publish updates to the drivers and publish the set of scenarios it will use to develop the second Assessment in spring 2022
13 Assessment of the infrastructure sectors
Progress has been made in some areas since the first Assessment
The first Assessment was published in July 2018 Since then it has shaped infrastructure policy across sectors The governmentrsquos National Infrastructure Strategy11 a formal response to the Assessment aligned closely with the Commissionrsquos recommendations and there has been significant progress on many of the recommendations including
z access to gigabit capable broadband the government has set out a clear vision to deliver gigabit capable broadband to at least 85 per cent of UK premises by 2025 ndash in late 2021 this was well underway reaching over 50 per cent of premises12
z a shift to renewable electricity there has been a shift towards a highly renewable electricity system with almost 40 per cent of electricity generated by renewable sources in 201913
z electric vehicles government has banned the sale of new petrol and diesel cars and vans in the UK from 203014 following the Commissionrsquos recommendation that charging infrastructure should be delivered to enable this shift
z flooding the government will invest pound56 billion over the next six years to reduce the risk of flooding following Commission recommendations15
z drought resilience government and the water industry in England have taken on the Commissionrsquos recommendations to increase water supply and reduce leakage16
z the UK Infrastructure Bank the independent infrastructure financing institution the Commission recommended be established following the UKrsquos loss of access to the European Investment Bank was launched in June 202117
z design principles the government endorsed the Commissionrsquos design principles and recommendation for board level design champions on major infrastructure projects18
Infrastructure has continued to perform well in some areas
The Commissionrsquos performance assessment has identified several areas where infrastructure is performing well including
z access to mobile connectivity 92 per cent of the UK landmass is covered by at least one mobile operator with a funded plan to increase this to 95 per cent by 202619
z reliable energy supply the energy sector delivers electricity and gas of reliable quality to consumers ndash loss of supply is rare and interruptions to supply are reducing over time20
z access to clean water the water sector delivers water of reliable quality to homes and businesses across England with low numbers of service interruptions and customers are generally satisfied with the water and wastewater services provided21
25
National Infrastructure Commission | The Second National Infrastructure Assessment Baseline Report
Social research
In June 2021 the Commission carried out social research with a range of respondents from across the UK nationally representative by age gender region and ethnicity
The research showed relatively high levels of confidence from respondents from across the UK that infrastructure will meet peoplersquos needs over the next 30 years with confidence increasing since the first Assessment Only two sectors ndash flood resilience and waste ndash had lower than 70 per cent confidence with the digital sector performing particularly strongly This social research will shape the Commissionrsquos approach to the second Assessment
Figure 13 Public confidence in infrastructure has improved since the first Assessment
Percentage of respondents who were confident that the sector would meet their needs in the next 30 years in 2021 vs in 2017 (ahead of the first Assessment)
Source PwC (2021) NIA2 Social Research Final report
The research also showed that the public increasingly believe that infrastructure should lead the fight against climate change and a plan for infrastructure should consider the impact of infrastructure on the environment22
However in other infrastructure areas there is a lot more to be done
Nevertheless there remain major significant challenges across sectors particularly to reduce emissions Key areas where infrastructure needs to improve performance
z emissions from electricity and heat are still too high as the electricity sector will need to reduce emissions to near zero by 203523 and little progress has been made so far on heat decarbonisation although the technologies to do so already exist
0 10 20 30 40 50 60 70 80 90 100
Flood management
Solid waste
Transport
Water and wastewater
Energy
Digital
Percentage
Sect
or
2017 2021
26
National Infrastructure Commission | The Second National Infrastructure Assessment Baseline Report
z emissions from transport have not been declining despite improvements in engine efficiency24 and although electric vehicle charge point numbers are increasing25 the pace needs to pick up to enable a transition to electric vehicles in 2020s and 2030s26
z asset maintenance issues undermine performance in some sectors including ageing and leaky water pipes and potholes in local roads27
z more than five million properties are currently at risk of flooding in England28 including more than three million at risk of surface water flooding29
z serious pollution incidents from water and sewerage have plateaued at an unacceptably high level30 and 32 per cent of water bodies in England do not have good ecological status due to continuous discharges from sewage and seven per cent due to stormwater overflows31
z recycling rates have plateaued and emissions from waste have begun to rise again while the total waste generated in England is also increasing32
z urban transport connectivity is poor in many places and the largest urban areas tend to have the worst connectivity as congestion slows down journeys33
z there are wide variations in interurban connectivity between similar places but with no clear regional patterns or trends34
Progress is already being made in some of these areas including reducing emissions from electricity enabling the transition to electric vehicles and reducing the risks of flooding However there is still further to go More detail on the performance of each sector is set out in annexes A-F
The overall cost to households of infrastructure services has remained relatively stable over the last 10 years35 At the same time there have been significant increases in investment in many areas Average energy bills rose from the mid-2000s until the mid-2010s and then gradually declined
However gas prices have risen significantly in recent months pushing up the price of both gas and electricity as gas remains a significant input into electricity generation Domestic consumers have been shielded from some of this volatility due to the regulated cap on energy prices introduced from 2017 But prices have risen and are expected to rise further Businesses have also been affected especially those that are energy intensive This inevitably creates serious problems for some households and firms
Current high prices appear to be mostly due to temporary factors including the effects of the Covid-19 pandemic Prices may fall again but volatility in prices is inherent in a system dependent on fossil fuels As set out below this price volatility reinforces the strategic need to transition to a low carbon energy system as soon as practicable
27
National Infrastructure Commission | The Second National Infrastructure Assessment Baseline Report
Figure 14 The overall cost to UK households of infrastructure services remains relatively stable despite increases in investment
Average annual household expenditure pound (2019-20 prices CPI deflated)
0
1000
2000
3000
4000
5000
6000
7000
8000
pound 2
019
-20
pri
ces
Year
Total Energy Water Telecoms Transport
Sources DfT ONS Ofwat Ofcom
Infrastructure also faces new challenges
As well as improving current performance infrastructure must be prepared for future challenges including from a changing climate and behaviour change following the Covid-19 pandemic And it should also take the opportunities offered by new digital technologies
Infrastructure sectors are beginning to tackle the challenge of reaching net zero reducing the impact of infrastructure on the climate But the climate will also have impacts on infrastructure Sectors must prepare for the risks of a changing climate including increased incidence of flooding and drought
And alongside climate change there is another environmental crisis that must be addressed Global assessments show that nature is declining at rates unprecedented in human history with accelerating rates of species extinction and severe disruption to ecosystem services36 Infrastructure contributes to this decline but can also help prevent it
Finally the Covid-19 pandemic may lead to long term changes in where people live and work This in turn could lead to new patterns of infrastructure demand especially in the transport sector where there may be a change in the established levels of demand for different modes Car use has already returned to levels seen before the pandemic but in the longer term the way people use roads and public transport could be very different37
28
National Infrastructure Commission | The Second National Infrastructure Assessment Baseline Report
Call for evidence questions
This document contains call for evidence questions on each of the nine challenges These are mostly set out where the challenge is identified However there are several cross cutting call for evidence questions that are relevant across all nine challenges set out below A summary of call for evidence questions and information on how to respond is set out in Chapter 5
Question 1 Do the nine challenges identified by the Commission cover the most pressing issues that economic infrastructure will face over the next 30 years If not what other challenges should the Commission consider
Question 2 What changes to funding policy help address the Commissionrsquos nine challenges and what evidence is there to support this Your response can cover any number of the Commissionrsquos challenges
Question 3 How can better design in line with the design principles for national infrastructure help solve any of the Commissionrsquos nine challenges for the next Assessment and what evidence is there to support this Your response can cover any number of the Commissionrsquos challenges
Question 4 What interactions exist between addressing the Commissionrsquos nine challenges for the next Assessment and the governmentrsquos target to halt biodiversity loss by 2030 and implement biodiversity net gain Your response can cover any number of the Commissionrsquos challenges
Question 5 What are the main opportunities in terms of governance policy regulation and market mechanisms that may help solve any of the Commissionrsquos nine challenges for the Next Assessment What are the main barriers Your response can cover any number of the Commissionrsquos challenges
14 Digital technologies present opportunities for all sectorsThe Commission made recommendations on the availability and quality of digital infrastructure in the first Assessment and the government is making good progress delivering on this as set out above The Commission will continue to monitor government progress in these areas through the Annual Monitoring Report but does not plan to undertake new work on network rollout as part of the second Assessment Instead the Commission will turn its attention to how the widespread availability of fixed and mobile networks and services can be used in other infrastructure sectors to deliver better services at lower cost
Higher quality digital infrastructure will present opportunities across the economy including the opportunity to make improvements in all other infrastructure sectors Adoption of digital technologies has the potential to cut costs enhance service quality improve resilience and enable better demand management across a range of infrastructure services Sensors can be deployed across infrastructure assets to monitor their condition allowing for more timely and efficient maintenance interventions Real time data on road use could facilitate better traffic management and alleviate congestion However the adoption of digital technologies across infrastructure sectors is patchy The second Assessment will consider barriers that are preventing the adoption of new digital technologies in infrastructure and what policy and regulatory interventions may be needed
29
National Infrastructure Commission | The Second National Infrastructure Assessment Baseline Report
Challenge 1 The digital transformation of infrastructure ndash the Commission will consider how the digital transformation of infrastructure could deliver higher quality lower cost infrastructure services
Question 6 In which of the Commissionrsquos sectors (outside of digital) can digital services and technologies enabled by fixed and wireless communications networks deliver the biggest benefits and how much would this cost
Question 7 What barriers exist that are preventing the widescale adoption and application of new digital services and technologies to deliver better infrastructure services And how might they be addressed Your response can cover any number of the Commissionrsquos sectors outside digital (energy water flood resilience waste transport)
30
National Infrastructure Commission | The Second National Infrastructure Assessment Baseline Report
The effects of climate change which are already evident in the UK and worldwide can only be mitigated by cutting greenhouse gas emissions fast In 2019 two thirds of all UK greenhouse gas emissions arose from transport energy waste and wastewater infrastructure While progress has been made in these sectors they all need to decarbonise further And the move to net zero will also require new infrastructure networks for hydrogen and carbon capture and storage
In the second Assessment the Commission will focus on the following key challenges
z decarbonising electricity generation by 2035
z the heat transition and energy efficiency
z new networks for hydrogen and carbon capture and storage
While the decarbonisation of surface transport is discussed in this chapter transport will be covered as part of the challenges outlined in Chapter 4 Similarly waste will be considered in the circular economy challenge set out in Chapter 3 The water floods and digital sectors have much lower emissions and so will not be considered as priority challenges for decarbonisation in the second Assessment although the Commission will assess the emissions impact of all the recommendations it makes
21 Infrastructure and net zeroIn 2019 UK greenhouse gas emissions stood at around 500 MtCO
2e a reduction of 40 per cent since
199038 The UK has legally binding targets to reduce greenhouse gas emissions by 78 per cent by 2035 relative to 1990 levels39 and to net zero by 205040 In October 2021 the government published its Net Zero Strategy ndash a summary of the actions it is taking and plans to take to deliver against its commitment to reach net zero emissions by 205041
Reductions in emissions have so far been concentrated largely in the electricity sector with only limited progress in most other infrastructure sectors (figure 21)
2 Reaching net zero
31
National Infrastructure Commission | The Second National Infrastructure Assessment Baseline Report
Figure 21 Total UK emissions have reduced since 1990 especially in electricity generation
Annual greenhouse gas emissions by infrastructure sector 1990 to 2019
0
100
200
300
400
500
600
700
800
900
MtC
O2e
Year
Total UK emissions Total - infrastructureTransport (incl international aviation and shipping) Electricity generationHeating Waste (incl energy from waste)Wastewater
Source Commission calculations using Department for Business Energy amp Industrial Strategy (2021) Final UK greenhouse gas emissions national statistics 1990 to 2019
In 2019 two thirds of all UK greenhouse gas emissions arose from transport energy waste and wastewater infrastructure
z transport (including surface transport aviation and shipping) emitted around 165 MtCO2e (33
per cent of all UK emissions)
z electricity generation emitted around 50 MtCO2e (11 per cent)
z heat for residential public sector and commercial buildings emitted around 90 MtCO2e (17
per cent)
z waste emitted just over 20 MtCO2e (four per cent)42
z wastewater emitted around 3 MtCO2e (less than one per cent)
In the transport sector the route to net zero is clear for cars and vans but more complicated for HGVs rail planes and ships And while cars and vans can be decarbonised by the switch to electric vehicles this needs to accelerate to meet the sixth Carbon Budget target ndash government must ensure public charge points are available to encourage take up
In the energy sector there is a clear route to decarbonise the electricity system But it needs to happen fast ndash the electricity system must be near zero emissions by 2035 In heat the challenge is different ndash the technologies to decarbonise heat exist but how to deliver the necessary changes in homes and businesses is not clear
32
National Infrastructure Commission | The Second National Infrastructure Assessment Baseline Report
To decarbonise the waste sector emissions from landfill must be reduced More detail on how the Commission will consider the waste sector in the second Assessment is set out in Chapter 3 The Commission will also look at the emissions from energy from waste plants as part of the wider electricity system
The Commission is not planning to consider process emissions from wastewater treatment as a priority in the second Assessment as these represent a very small proportion of overall emissions
The Commissionrsquos other infrastructure sectors ndash the water flood resilience and digital sectors ndash do not directly emit greenhouse gases in the way that power stations or cars do Their reliance on energy and transport infrastructure does indirectly raise emissions but as those sectors decarbonise the emissions from the water flood resilience and digital sectors will also fall The water flood resilience and digital sectors are therefore not considered in this chapter
The move to net zero will also require new infrastructure networks including for hydrogen and carbon capture and storage Government has set out strategies for both however there are still many questions to be resolved It still needs to be determined how quickly these networks can be delivered at what scale and how plans can be coordinated
Achieving net zero ndash a 100 per cent reduction in net (rather than gross) greenhouse gas emissions from 1990 levels ndash means that some sectors are still expected to emit a small amount of greenhouse gases in 2050 These will have to be offset by greenhouse gas removals which the Commission considered in its 2021 report Engineered greenhouse gas removals43
All infrastructure sectors have emissions lsquoembeddedrsquo in their construction process and in their use of materials Hydrogen and carbon capture and storage are two of the solutions to decarbonising the production of construction materials The infrastructure needed to allow for this will be considered by the Commission
All infrastructure sectors need to decarbonise further fast to meet the governmentrsquos emissions targets for 2035 and 2050 While the legally binding net zero and sixth Carbon Budget targets only refer to total UK emissions across all sectors the government has set out illustrative sectoral ranges for emissions reductions in its Net Zero Strategy44 These ranges are similar to the illustrative roadmaps produced by the Climate Change Committee to meet both the sixth Carbon Budget and net zero target The Commission uses these illustrative roadmaps as guidance for the expected decarbonisation path in its infrastructure sectors The Climate Change Committeersquos lsquobalanced pathwayrsquo scenario for each sector is shown in figure 22
Many areas of economic infrastructure are devolved see Chapter 1 The Commissionrsquos role is to advise the UK Government This chapter therefore focusses on UK Government climate targets and areas of competence
33
National Infrastructure Commission | The Second National Infrastructure Assessment Baseline Report
Figure 22 Some economic infrastructure sectors must decarbonise faster than others
Emissions reduction roadmaps for economic infrastructure in the Climate Change Committeersquos lsquobalanced pathwayrsquo scenario
0
50
100
150
200
250
300
350
400
2019 emissions 2035 scenario 2050 scenario
MtC
O2e
Year
Surface transport BuildingsElectricity generation Aviation and shippingWaste (inc wastewater and energy from waste)
Source Climate Change Committee (2020) Sixth Carbon Budget ndash Dataset Note allocation of emissions to sectors varies from the figures presented elsewhere in this report
Box 21 Reaching net zero is a key theme for the Commission
Reaching net zero supports all four of the Commissionrsquos objectives
z Support sustainable economic growth across all regions of the UK Reducing greenhouse gas emissions is vital for economic growth The scale of the productivity impacts of heatwaves and other extreme weather is likely to be in the order of billions of pounds per year45 The benefits from mitigating climate change will be felt across all regions There are likely to be some economic benefits in areas where new low carbon industries are located through jobs created in the construction and operation of these industries and through associated services However the transition away from oil and gas may have the opposite effect in places where these industries are centred
z Improve competitiveness Many of the UKrsquos existing competitive advantages are in high carbon industries Net zero means that some of these industries face uncertain futures But the UK can and should transfer its advantages ndash which lie across a broad range of professional financial and engineering and design services ndash to emerging low carbon industries such as carbon capture and storage and electric vehicle technology46 Getting ahead of this challenge now will maximise the UKrsquos future competitiveness as the global economy shifts towards net zero
34
National Infrastructure Commission | The Second National Infrastructure Assessment Baseline Report
z Improve quality of life Reducing greenhouse gas emissions is expected to help mitigate the impacts of climate change which have significant impacts on quality of life in the UK and globally47 The largest impacts are likely to be on health and availability (and therefore affordability) of food It will also impact on quality of life through affecting infrastructure and access to infrastructure services for example from flooding or overheated train tracks48
z Support climate resilience and the transition to net zero carbon emissions by 2050 Reaching emissions targets in economic infrastructure will reduce emissions not only in those sectors but also in the sectors that depend on them Reducing greenhouse gas emissions will also help mitigate climate change supporting climate resilience
The Commissionrsquos social research found that people increasingly rank reducing emissions as a priority for infrastructure Respondents cited fighting climate change by reducing greenhouse gases as the top priority for the UKrsquos infrastructure in 30 yearsrsquo time49
22 TransportIn 2019 greenhouse gas emissions from the transport sector stood at around 165 MtCO
2e or 33 per cent
of total UK emissions that year Emissions from transport broadly fall into two categories
z surface transport which emitted around 115 MtCO2e in 2019
z aviation and shipping both domestic and international which emitted around 50 MtCO2e in
2019
Figure 23 Surface transport makes up two thirds of transport emissions
Annual greenhouse gas emissions by transport mode 2019
0
20
40
60
80
100
120
140
160
180
Transport Surface transport breakdown
MtC
O2e
Sector
Surface transportAviation and shipping (incl international)
Cars and light road vehiclesHGVs coaches and busesRail
Source Commission calculations using Department for Business Energy amp Industrial Strategy (2021) Final UK greenhouse gas emissions national statistics 1990 to 2019
35
National Infrastructure Commission | The Second National Infrastructure Assessment Baseline Report
Surface transport
In 2019 emissions from surface transport made up around two thirds of all transport emissions in the UK50 These emissions have persisted at similar levels since 1990 Surface transport emissions arise from
z cars taxis light vans motorcycles and mopeds which produce just under 80 per cent of emissions from surface transport
z HGVs buses and coaches which emitted around 25 MtCO2e in 2019 around 20 per cent of
surface transport emissions with the majority coming from HGVs
z railways which emitted less than 2 MtCO2e in 2019 ndash this is close to a 15 per cent reduction
on 1990 emissions despite a 115 per cent rise in passenger journeys51
The Climate Change Committeersquos balanced pathway scenario assumes emissions from surface transport will fall to 32 MtCO
2e by 2035 and to 1 MtCO
2e by 205052
Cars taxis light vans motorcycles and mopeds
The move to electric cars and vans will eliminate the majority of emissions from surface transport In the first Assessment the Commission recommended the roll out of charging infrastructure sufficient to enable 100 per cent electric new car and van sales by 203053 Government has since committed to ending the sale of new petrol and diesel cars and vans in the UK by 2030 and to working closely with Ofgem and industry to ensure there is the charging infrastructure in place to support this54
However plans to deliver an electric vehicle charging network must accelerate if electric vehicle take up is to happen at the pace needed to meet the sixth Carbon Budget which will require a significant shift to electric vehicles over the 2020s Without available chargers drivers will not have the confidence to make the switch As of July 2021 there were around 24300 public charging points55 It is estimated that between 280000 and 480000 public charging points would be needed to support 100 per cent electric new car and van sales in 203056
In the National Infrastructure Strategy government committed to publish an electric vehicle charging infrastructure strategy by November 202157 This is urgently required to help support the delivery of charging infrastructure that will encourage drivers to make the required switch to electric vehicles It will also help both the market and local authorities plan the delivery of additional charging points Ofgem has recently published its priorities for enabling the transition to electric vehicles setting out plans to ensure that the networks are prepared for increased adoption and that network connections are timely and cost effective It also outlines how it will support off peak lsquosmart chargingrsquo using market incentives and support the sale of battery stored electricity back to the grid58
HGVs buses and coaches
Decarbonising heavy road vehicles presents a further challenge The options being considered to decarbonise HGVs are hydrogen and electrification either of which would require a change in existing fuelling infrastructure The Commission has recommended that new diesel HGV sales should end by 204059 This year the government committed to phase out the sale of new non zero emissions HGVrsquos by 204060 The governmentrsquos forthcoming lsquoFuture of Freight Planrsquo must address the need for a comprehensive assessment of the infrastructure needed to enable freight HGV decarbonisation including working with Ofgem and distribution network operators to plan any necessary infrastructure upgrades
36
National Infrastructure Commission | The Second National Infrastructure Assessment Baseline Report
In its Transport Decarbonisation Plan government committed to measures to boost zero emission bus fleets Currently only two per cent of English buses are run on lower carbon fuel such as electricity or hydrogen 61
Railways
In the rail network many of the intercity mainlines and almost all London commuter routes have already been electrified62 Further electrification of the rail network will reduce emissions The Commission has called for a rolling programme of electrification to be established but has noted that detailed work will be needed to establish which routes are the priority for early electrification63 The Commission has also recommended that government publish a detailed strategy for achieving rail freight decarbonisation by 205064 The high costs associated with installing overhead line electrification pose a challenge for decarbonising all rail routes65 for some battery or hydrogen trains may offer an alternative means of decarbonising66 Government has committed to encourage the development of battery and hydrogen trains in the Transport Decarbonisation Plan
Chapter 4 sets out the Commissionrsquos plans to look at improving urban and interurban transport As the Commission develops transport recommendations for the second Assessment it will ensure these recommendations are consistent with the governmentrsquos decarbonisation targets
Aviation and shipping
In 2019 emissions from aviation and shipping stood at around 50 MtCO2e Emissions from shipping have
declined since 1990 But international aviation emissions were on a strong upwards trend prior to the Covid-19 pandemic reaching close to 40 MtCO
2e in 2019
Figure 24 UK emissions from aviation and shipping in 201967
Aviation Shipping
Domestic 1 MtCO2e 6 MtCO
2e
International 37 MtCO2e 8 MtCO
2e
Aviation and shipping are particularly difficult to decarbonise The technologies to do so do not yet exist or are not yet mature enough to be used at scale68 The Climate Change Committeersquos balanced pathway scenario assumes that emissions from aviation and shipping will remain at 24 MtCO
2e even in 205069
Greenhouse gas removals will therefore be necessary to offset the remaining emissions in this sector The international aviation sector has committed to offset growth in emissions from 2019 levels through the UN Aviation Agencyrsquos Carbon Offsetting and Reduction Scheme for International Aviation70
The Commission has recommended that engineered greenhouse gas removals are developed in the UK to address emissions from this hard to abate sector71 The governmentrsquos Net Zero Strategy has since set an ambition to deploy at least 5 MtCO
2e of engineered greenhouse gas removals by 2030 rising to
around 23 MtCO2e by 2035 and a plan to consult in 2022 on business models to incentivise investment
The Commission will continue to promote its recommendations and monitor governmentrsquos progress in establishing an engineered removals sector in the UK The Commission does not intend to take forward any further work during the second Assessment on the infrastructure required to decarbonise aviation and shipping
37
National Infrastructure Commission | The Second National Infrastructure Assessment Baseline Report
23 EnergyIn 2019 emissions from the energy sector stood at around 140 MtCO
2e equivalent to 28 per cent of UK
emissions for that year Despite dramatic reductions in emissions from electricity generation energy infrastructure remains the largest source of emissions after transport Emissions from energy arise from
z electricity generation which emitted around 50 MtCO2e in 2019 a fall of 74 per cent since
199072
z heat for residential public sector and commercial buildings which emitted around 90 MtCO
2e in 2019 17 per cent of total emissions
Average energy bills rose from the mid 2000s until the mid 2010s before gradually declining However gas prices have risen significantly in recent months which has pushed up the price of both gas and electricity as gas remains a significant input into electricity generation Domestic consumers have been shielded from some of this volatility due to the regulated cap on energy prices introduced from 2017 But prices have risen and are expected to rise further Businesses have also been affected especially those that are energy intensive This inevitably creates serious problems for some households and firms
Oil and gas are internationally traded commodities with volatile prices determined by factors over which the UK has little control Current high prices appear to be mostly due to temporary factors including the effects of the Covid-19 pandemic73 Prices may fall again but volatility in prices is inherent in a system dependent on fossil fuels Transitioning to a low carbon energy system based on long lasting capital assets such as wind farms and nuclear power stations with less dependence on fuel should reduce exposure to price spikes like those currently being experienced
Decarbonising energy will require high levels of investment both to decarbonise existing infrastructure networks and to build new ones for example for carbon capture and storage and hydrogen This investment will ultimately need to be funded by either consumers (via bills) or taxpayers The Commission will consider funding challenges in the second Assessment including the overall affordability of required investment the distribution of costs and savings across groups in society and who should pay
Electricity generation
Electricity generation has made significant progress in reducing emissions decarbonising faster than any other sector The share of electricity generated from renewable sources has grown from less than ten per cent in 2010 to almost 40 per cent in 201974
The pathway to decarbonise electricity generation is clear electricity generation needs to primarily come from low carbon energy sources (like wind solar and nuclear) complemented by storage interconnection with other countries demand management and novel flexible low carbon generation (such as hydrogen or gas or biomass with carbon capture and storage) The transmission and distribution networks will need to be ready to support these new sources of generation and manage increased demand (such as from electric vehicles) as other sectors decarbonise
In the first Assessment the Commission recommended that government aim to deliver 50 per cent renewable generation by 203075 The Commission later increased that recommendation to 65 per cent by 2030 in light of faster than expected cost reductions in renewable technologies76 Since the Commission reached this position the government has committed to the sixth Carbon Budget and to decarbonising the electricity system by 2035 (subject to being able to maintain security of supply)77
38
National Infrastructure Commission | The Second National Infrastructure Assessment Baseline Report
Reaching near zero emissions by 2035 will require an acceleration in the current pace of decarbonisation While reliance on coal and oil has dropped significantly gas remains the largest single source of electricity generation holding around a 40 per cent share of generation in 201978
Delivering this will require significant new capacity to be deployed over the next decade The government has committed to achieving 40 GW of offshore wind generation by 2030 and is reopening Contracts for Difference auctions held approximately every two years to onshore wind and solar79 These actions are in line with the Commissionrsquos recommendations Government and industry must now focus on delivery
While the pathway to decarbonisation is clear and progress is being made the energy sector still faces a significant challenge A low cost net zero electricity system capable of meeting increased demand must be delivered without jeopardising security of supply Renewable electricity generation from solar or wind cannot be turned on when needed like a gas power plant can so flexibility including through electricity storage will be vital for a highly renewable electricity system There is some evidence that the electricity storage market is maturing Battery storage capacity exceeded 1 GW for the first time in 2021 and the pipeline of battery storage projects has expanded rapidly in the last three years80 The government and Ofgem recently updated their Smart Systems and Flexibility Plan and issued a call for evidence on facilitating the deployment of large scale and long duration electricity storage81
Challenge 2 Decarbonising electricity generation ndash the Commission will consider how a decarbonised secure and flexible electricity system can be achieved by 2035 at low cost
Heat
Decarbonising heat is complex and limited progress has been made While the technologies to decarbonise heat exist delivering the transition to zero carbon heat presents a significant challenge to policymakers as it will directly affect individuals and will cause significant disruption in homes buildings and at street level
Most of the emissions from heat arise from burning fossil fuels for heating and hot water Total emissions from buildings in 2019 were around 90 MtCO
2e only a 17 per cent fall on 1990 levels This includes a 15
per cent reduction in residential combustion emissions supported by improved efficiency of heating systems and government schemes to encourage the installation of energy efficiency measures in homes82 Reductions began to tail off in 2014 as those schemes ended or were reduced in scope and emissions have plateaued since then83
Over 75 per cent of the energy needed for heating space and water in homes is provided by natural gas with oil electricity and bioenergy providing under ten per cent each84 This reliance on fossil fuels will need to end to reach net zero ndash the Climate Change Committeersquos balanced pathway scenario sees emissions from heating falling to 47 MtCO
2e by 2035 and to 1 MtCO
2e by 205085
Providing zero carbon heat will require both
z Improving energy efficiency of buildings This will reduce the amount of heat that is lost and therefore reduce the demand for energy for heat The UK has some of the oldest and least energy efficient homes in Europe86 Improving energy efficiency will require millions of existing homes to be better insulated for example by double glazing windows or increasing insulation in walls and roofs and new homes to be built to high levels of efficiency
39
National Infrastructure Commission | The Second National Infrastructure Assessment Baseline Report
z Transitioning to a mix of electric heating and heat from hydrogen This will mean replacing fossil fuel heating systems mainly natural gas boilers with lower carbon alternatives that use electricity like heat pumps or heat networks or hydrogen or hybrid systems The appropriate balance between these sources of heat is not yet clear
In the first Assessment the Commission recognised that difficult decisions would need to be made about how and when the UKrsquos reliance on natural gas for heating will come to an end It therefore recommended a series of near term actions to build the evidence base on heat decarbonisation and improve energy efficiency including
z setting a target rate of installing 21000 energy efficiency measures per week in England by 2020 and allocating funding to enable this
z establishing an up to date evidence base on the performance of heat pumps within the building stock and getting a better understanding of the scope for future cost reductions
z establishing the safety case for hydrogen and trialling it first at community scale by 2021 and then a larger trial of at least 10000 homes by 202387
Government accepted the Commissionrsquos recommendations on gathering evidence on heat pumps and the use of hydrogen for heating It did not support setting a target for the number of energy efficiency measures Progress is lagging behind the Commissionrsquos recommended timetable88
The energy efficiency of homes in England has been gradually improving89 But government policy to date to spur action has been stop start Energy efficiency installations are therefore falling short of what is needed In 2019 the number of energy efficiency installations installed through government schemes averaged 4200 per week far below levels in the early 2010s90 Heat pump installations remain low at 36000 a year91 far below the government ambition to get installations to 600000 a year by 202892
Box 22 Heat decarbonisation in Europe
The UK is not alone in facing the challenge of heat decarbonisation But it is unusual in the degree to which it currently depends on gas boilers for heating The UK has one of the highest levels of on gas grid heating in the OECD93
Most other European countries already generate much of their energy for heating through sources other than natural gas such as electricity or biofuels and make greater use of district heating systems to transport heat It is estimated that 85 per cent of heating in Norway is provided by electricity mainly generated through hydroelectricity and 60 per cent of heating in Sweden is from district heating with electricity meeting most of the remaining demand94 Heat pumps are installed in approximately a fifth of Swedish homes95 These countries have benefitted from converting district heating systems originally powered by coal and oil to less carbon intensive sources96
The UKrsquos closest comparator in terms of heating systems is the Netherlands where in 2016 nearly 95 per cent of households were connected to the gas grid97 The Netherlands has banned new connections to its gas grid98 It has also committed to scaling up production of low carbon hydrogen by 2030 and 46 local authorities are piloting alternative heating technologies with many opting to install heat pumps99
40
National Infrastructure Commission | The Second National Infrastructure Assessment Baseline Report
The UK Government has recently published its strategy for decarbonising heat100 The Scottish and Welsh Governments are also focused on this issue101 The UK Governmentrsquos strategy sets out plans to cut emissions via a gradual transition which will start by incentivising consumers through grant funding to install heat pumps and working with industry to drive down their cost and encourage uptake It also outlines measures to promote improved efficiency to business and public sector buildings The stated ambition is that by 2035 no new gas boilers will be sold
The lack of progress to date in decarbonising heat and the legislated sixth Carbon Budget mean understanding and resolving the challenges that the UK will face in decarbonising its homes and businesses is now urgent There are still major questions to be answered as acknowledged in the Heat and Buildings Strategy102 These questions include what level of insulation will be needed in different homes to efficiently operate heat pumps whether hydrogen for heating will be available as a source of heat for all homes and what this means for the continuing use of the gas network and how to deliver these major changes in peoplersquos homes
The Commission does not yet have the answers to these questions But it will continue to work with government to build a stronger evidence base so that these important decisions can be made in time to meet carbon targets The government has committed to making a decision on the role of hydrogen for heating by 2026103 If this does not happen the risk of not achieving net zero is very real
In tackling these questions the Commission will consider how the heat transition will impact household bills Using a heat pump currently costs more than a natural gas boiler as both the upfront installation cost and running cost are higher And while hydrogen boilers are expected to have a similar cost to natural gas boilers the running costs are currently uncertain and will depend on the cost of producing hydrogen Making the change to zero carbon heat in a well planned way with appropriately targeted policy can ease the burden on the most vulnerable
Challenge 3 Heat transition and energy efficiency ndash the Commission will identify a viable pathway for heat decarbonisation and set out recommendations for policies and funding to deliver net zero heat to all homes and businesses
24 WasteIn 2019 emissions from the waste sector stood at just over 20 MtCO
2e four per cent of total UK
emissions Emissions from waste arise from
z landfill waste which represented the majority of emissions in 2019
z incineration composting anaerobic digestion and mechanical biological treatment which make up around 2 MtCO
2e
z energy from waste plants which represent around 5 MtCO2e104
These domestic figures do not account for emissions from exporting waste
Emissions from waste fell significantly from 1990 to 2014 Most of the reduction in emissions from waste to date has been due to falling methane emissions from landfill following the landfill tax ndash the UK achieved an 84 per cent reduction in biodegradable waste sent to landfill between 1990 and 2015 (see Annex C)105 However landfill emission reductions have stagnated and energy from waste emissions have grown which has caused a ten percent increase in emissions since 2015106
41
National Infrastructure Commission | The Second National Infrastructure Assessment Baseline Report
Reducing the volume of waste that is disposed of through landfill or incineration without recovery ndash or reducing emissions from treatments such as incineration with energy recovery ndash is therefore critical to reducing overall emissions in the waste sector
The net zero target means that the Commission will need to revisit its work on waste in the second Assessment More detail on how the Commission will consider the waste sector in the second Assessment is set out in Chapter 3 The Commission will consider emissions from energy from waste plants under challenge 2 (see section 23)
25 WastewaterThe wastewater sector emitted around 3 MtCO
2e in 2019 less than one per cent of total UK emissions
These emissions have been broadly stable since 1990 These emissions arise from wastewater handling
The Commission is not planning to consider process emissions from water and wastewater treatment as a priority in the second Assessment due to the low level of overall emissions and the industryrsquos ambition107
More detail on the performance of the water and wastewater sector is set out in Annex D
26 New infrastructure networks to support net zeroTackling emissions from some sectors ndash largely from harder to abate sectors such as industry aviation agriculture and shipping ndash will require new infrastructure networks These will include
z hydrogen networks to help decarbonise hard to electrify sectors such as heavy industry shipping aviation heavy goods vehicles some heating and parts of the rail network
z carbon capture and storage networks which will be needed to decarbonise parts of industry hydrogen production electricity generation (from sources such as gas waste incineration or biomass) and to enable engineered greenhouse gas removals
While government has published strategies and business models for both networks there are still many questions to be resolved It is still to be determined how quickly these networks can be delivered at what scale and how plans can be coordinated
In the second Assessment the Commission will consider the rollout of these networks The key challenge will be understanding what scale of networks will be necessary for both hydrogen and carbon capture and storage This can be difficult to determine as while hydrogen and carbon capture and storage are complementary networks (carbon capture and storage is needed to produce low carbon hydrogen from natural gas for example) there will be some areas of the economy where they compete as routes to decarbonisation For example either hydrogen or current power sources combined with carbon capture and storage could be used to decarbonise steel production
Hydrogen networks
Hydrogen currently plays an extremely limited role in the UK energy sector However it has the potential to be used widely across the economy108
42
National Infrastructure Commission | The Second National Infrastructure Assessment Baseline Report
The UK currently produces an estimated 27 TWh of hydrogen Almost all of this is produced using fossil fuels and is used predominantly in the petrochemical sector109 Long term policies and infrastructure for hydrogen production and deployment will therefore be needed to deliver large volumes of low carbon hydrogen
The government has recently committed to a target of 1 GW of hydrogen production by 2025 and 5 GW (42 TWh) of low carbon hydrogen production by 2030 in its Hydrogen Strategy110 The strategy is an important milestone in the development of the sector The Commission welcomes the commitments made in the Strategy including the proposed development of technical standards to ensure that production of hydrogen is low carbon irrespective of the production method used
A critical question is how to drive down the costs of hydrogen production and decide what and how infrastructure networks are established Alongside the positive measures in the Strategy there needs to be greater clarity on the funding models to secure the necessary investor confidence to scale production It will also be important to consider who will foot the costs of the long term funding model and to ensure they are distributed fairly
In the second Assessment the Commission will examine the uses of hydrogen across the economy which technologies are best placed to produce it the infrastructure required and the policy and funding frameworks needed focussing on the longer term picture The Commission will evaluate the potential for hydrogen in the UK and the actions that need to be taken to maximise that potential
Carbon capture and storage networks
Carbon capture and storage networks can play a range of roles to reduce emissions across the economy for example by capturing the emissions from
z industrial processes
z electricity generation such as gas or energy from waste plants
z hydrogen production from reforming natural gas
Carbon capture and storage infrastructure is also required for engineered greenhouse gas removals which will be necessary to offset residual emissions from hard to abate sectors such as aviation and agriculture Engineered greenhouse gas removals capture carbon either through the processing of biomass or directly from air to create negative emissions Technologies to do this already exist but are not yet being used at scale in the UK or globally111 In its report Engineered greenhouse gas removals the Commission recommended that government commit to deploying a range of engineered removals at megatonne scale by 2030112
The government plans to deploy carbon capture and storage networks by 2030 It has recently increased its ambition from capturing and storing 10 MtCO2e a year by 2030 to 20-30 MtCO
2e113
In the second Assessment the Commission will assess the actions needed to meet demand for carbon capture and storage networks This will include whether the governmentrsquos current actions will deliver the capacity likely to be required The Commission will consider what actions are needed ndash where when and how infrastructure gets delivered ndash to ensure that access to transport and storage does not become a barrier to efficiently reducing emissions
43
National Infrastructure Commission | The Second National Infrastructure Assessment Baseline Report
Challenge 4 Networks for hydrogen and carbon capture and storage - the Commission will assess the hydrogen and carbon capture and storage required across the economy and the policy and funding frameworks needed to deliver it over the next 10-30 years
27 Challenges for the second AssessmentAs set out in this chapter the key challenges the Commission will consider in the second Assessment related to net zero will be
Challenge 2 Decarbonising electricity generation ndash the Commission will consider how a decarbonised secure and flexible electricity system can be achieved by 2035 at low cost
Question 8 What are the greatest risks to security of supply in a decarbonised power system that meets government ambition for 2035 and what solutions exist to mitigate these risks
Challenge 3 Heat transition and energy efficiency ndash the Commission will identify a viable pathway for heat decarbonisation and set out recommendations for policies and funding to deliver net zero heat to all homes and businesses
Question 9 What evidence do you have on the barriers to converting the existing gas grid to hydrogen installing heat pumps in different types of properties or rolling out low carbon heat networks What are the potential solutions to these barriers
Question 10 What evidence do you have of the barriers and potential solutions to deploying energy efficiency in the English building stock
Challenge 4 Networks for hydrogen and carbon capture and storage - the Commission will assess the hydrogen and carbon capture and storage required across the economy and the policy and funding frameworks needed to deliver it over the next 10-30 years
Question 11 What barriers exist to the long term growth of the hydrogen sector beyond 2030 and how can they be overcome Are any parts of the value chain (production storage transportation) more challenging than others and if so why
Question 12 What are the main barriers to delivering the carbon capture and storage networks required to support the transition to a net zero economy What are the solutions to overcoming these barriers
Details on how to respond to the call for evidence questions are set out in Chapter 5
44
National Infrastructure Commission | The Second National Infrastructure Assessment Baseline Report
Society and the economy depend on a healthy environment But the climate is changing and nature is declining at unprecedented rates Infrastructure needs to adapt to the growing risks of extreme weather and contribute to wider environmental objectives including increased biodiversity reduced waste and cleaner air and water
In the second Assessment the Commission will focus on the following key challenges
z asset management and resilience
z surface water management
z the role of the waste sector in the move to a circular economy
Alongside these the Commission will focus on reducing greenhouse gas emissions through the challenges set out in Chapter 2 and assess impacts on emissions and natural capital for all the recommendations made in the second Assessment The Commission will continue to monitor the governmentrsquos progress against its previous recommendations to improve resilience across the regulated sectors and increase resilience to drought and to river and coastal flooding
Box 31 Climate resilience and the environment are key themes for the Commission
The challenges of adapting infrastructure to climate change supporting a healthy natural environment and minimising negative impacts all closely relate to the Commissionrsquos strategic objectives which are to
z Support sustainable economic growth across all regions of the UK Resilient infrastructure supports economic growth by continuing to provide critical services including protection from natural hazards despite the growing risks of climate change Furthermore nature and the biodiversity that underpins it ultimately sustains the UK economy114 Infrastructure can therefore support growth by minimising its impact on the environment and protecting nature from pollution waste and hazards
z Improve competitiveness Resilient infrastructure supports competitiveness by providing services to businesses including access to domestic and international markets despite the growing risks from climate change It is also reasonable to expect stronger environmental standards across global supply chains in the future115 in which case higher domestic standards including for infrastructure will enable UK businesses to compete internationally
3 Climate resilience and the environment
45
National Infrastructure Commission | The Second National Infrastructure Assessment Baseline Report
z Improve quality of life A healthy natural environment is essential to quality of life116 Infrastructure can protect the environment and society from pollution waste and natural hazards It can also enhance the environment through design and help people to access nature However infrastructure can also undermine quality of life by polluting the environment and damaging habitats and biodiversity
z Support climate resilience and the transition to net zero carbon emissions by 2050 Even with ambitious efforts to reduce emissions impacts from climate change are inevitable117 Infrastructure must be resilient to current and future climate change risks including infrastructure which supports the transition to net zero
In the Commissionrsquos social research carried out in June 2021 respondents from across the UK ranked the environment as the most important factor to consider when planning for future infrastructure The number of respondents who ranked this as their top priority increased since the first Assessment in 2017 by six percentage points118
Figure 31 The public prioritise the environment as a key factor in infrastructure planning
Responses to the question The NIC is putting together a plan for what the UKrsquos infrastructure should be like in 30 yearsrsquo time When putting together this plan which of the following factors do you think are the most important to consider
Source PwC (2021) NIA2 Social Research Final Report
The Commission covers economic infrastructure within the UK governmentrsquos competence Many areas of economic infrastructure are devolved see Chapter 1 This chapter therefore focuses on areas within the UK Governmentrsquos competence
0 5 10 15 20 25 30 35
Disruption the amount of disruptionwe have to deal with
Legacy the state of infrastructure thatwe pass on to future generations
Resilience how well our infrastructure standsup to the challenges thrown at it
Investing now to save in the long term
Quality making sure that infrastructureis as good as it possibly can be
Environment the impact of our infrastructurehas on the environment
Percentage
2017 2021
46
National Infrastructure Commission | The Second National Infrastructure Assessment Baseline Report
31 Infrastructure resilience
Climate change will increase the challenge of resilience across sectors
Economic infrastructure has generally proved resilient to shocks and stresses over recent years119 Figure 32 shows the change in service interruptions over time for sectors where data is available This offers only a partial picture with fewer energy supply interruptions over time spikes in sewer flooding linked to extreme weather and increased rail cancellations
Figure 32 Levels of service interruption fluctuate over time
Change in measures of service interruption for selected infrastructure sectors for periods where data is available indexed to 2019-20
0
50
100
150
200
250
300
Inde
x 2
019
-20
= 10
0
Year
Energy - supply interruptions Water - sewer flooding Water - supply interruptions Transport - rail cancellations
Cyclone Uriah
Storms Desmondand Eva
Beastfrom the
East
Heavyrainfall events
Source Ofgem data request (2021) Average minutes lost to customer per year Ofwat (2019) Sewer Flooding flooded properties per 10000 connected to sewerage England and Wales CCW (2012-16) and Discover Water (2016-20) Average minutes of lost water access per property per year in England and Wales Office of Rail and Road (2021) Train cancellation score
However it will become harder to maintain and improve resilience in coming decades as climate change increases risks to economic infrastructure Key climate projections are for
z wetter winters and more intense summer storms which will increase the frequency of river and surface water flooding and with heavy or long term rainfall likely to increase incidences of landslides or subsidence
z rising sea levels around the UK which in combination with the increasing intensity of storms will exacerbate coastal erosion and flooding
z drier summers which will reduce the amount of water available and require between 3500 and 4000 million litres per day of extra capacity by 2050 to protect England from extreme drought (drought with a 02 per cent annual chance)
47
National Infrastructure Commission | The Second National Infrastructure Assessment Baseline Report
z heat increases with the greatest warming occurring in the South East and summer heatwaves becoming more common putting more pressure on infrastructure assets120
Figure 33 Climate change is likely to lead to hotter drier summers and warmer wetter winters in the UK
Met Office central projections of forecast changes for mean summer surface air temperature (left) summer precipitation (centre) and winter precipitation (right) for 2061-2080 relative to a 1981-2000 baseline121
Source Met Office (2018) UKCP18 Land Projections Science Report
All infrastructure sectors must adapt as the incidence of extreme weather increases The Climate Change Committeersquos 2021 Climate Change Risk Assessment describes risks to infrastructure sectors that require further action which include
z risks to infrastructure assets and services including
minus risks to transport from high and low temperatures high winds lightning slope and embankment failure
minus risks to infrastructure from coastal change including transport and waste
minus risks to infrastructure services from river and surface water flooding including transport electricity and wastewater treatment
minus risks from cascading failures in infrastructure networks including energy water transport and digital
48
National Infrastructure Commission | The Second National Infrastructure Assessment Baseline Report
z risks that infrastructure can protect society against including
minus risks to public water supplies from reduced water availability
minus risks from river and surface water flooding122
Risks to infrastructure society and public health from flooding and coastal change water scarcity and pollution are highlighted in the Environment Agencyrsquos third adaptation report to government123 The government will set out progress in responding to identified climate risks along with a monitoring and evaluation framework as part of the next National Adaptation Programme due in 2023124
Preparing for risks to infrastructure assets and services
Infrastructure owners and operators regulators and government all need to prepare for climate risks In its 2020 study Anticipate React Recover the Commission recommended
z a comprehensive set of resilience standards developed by the government for the energy water digital road and rail sectors and supported by clear duties on resilience for infrastructure regulators
z regular stress testing by operators to understand the resilience of infrastructure systems and to identify and address vulnerabilities
z long term resilience strategies developed by operators with guidance and scrutiny from the regulators125
The government published its response to the recommendations on 15 September 2021 It accepted the Commissionrsquos recommendations on standards and stress testing in principle but said that decisions on implementation will be taken as part of the forthcoming National Resilience Strategy expected in 2022126
Renewable sources of electricity like wind turbines and solar panels are reliant on the weather which means that extreme weather may present risks to generation The Commission is working with the Met Office and the Climate Change Committee to develop a data set which can help test the resilience of future electricity systems to extreme weather events127
However there remain significant resilience challenges particularly around asset management that the Commission has not yet considered
Resilience must be embedded in asset management approaches
Good asset management requires managing infrastructure assets so that they can deliver services in a cost effective and timely way128 Government regulators and infrastructure operators need to strike a balance between short term cost saving measures which could reduce resilience and providing excessive resilience at high cost This will be increasingly important for maintaining and improving resilience as pressures on assets increase And different approaches may be needed to increase resilience to low probability high impact incidents such as flooding while also responding to the risk of accelerated deterioration from more gradual changes in weather conditions
There is already concern about the condition of assets in some sectors The UK is still reliant on infrastructure built during the nineteenth century including roads railways tunnels and sewers
49
National Infrastructure Commission | The Second National Infrastructure Assessment Baseline Report
Some older components such as railway earthworks and embankments can be at greater risk of failure as they were not constructed to modern design standards of resilience to extreme weather129 In the water sector around 13 per cent of water pipes are over 100 years old130 which may increase the risk of leakages and bursts And there are concerns that maintenance and replacement is not keeping pace with the rate of deterioration for assets like water pipes and local roads131 As climate change accelerates deterioration the costs and challenges of asset management could increase
In some cases deterioration is not noticed until a failure occurs However better data and processing technologies such as sensors combined with predictive asset management models could provide more detailed information on asset condition and performance helping to prevent failures and better target maintenance interventions or renewals132
Decision making frameworks can also undervalue maintenance and disincentivise good asset management For example funding for the Environment Agencyrsquos maintenance budget has been agreed for varying periods of time from four year periods to annually133 This can make planning for and undertaking maintenance of flood assets less efficient By contrast in the regulated water sector Ofwat includes an allowance for maintenance capital expenditure over the five year Price Review period134 Approaches like this could help decision makers value maintenance needs over a longer time period
Challenge 5 Asset management and resilience ndash the Commission will consider how asset management can support resilience barriers to investment and the use of data and technology to improve the way assets are maintained
Preparing infrastructure to protect society against climate risks
Infrastructure can protect society against drought and floods While the UK currently has a water supply surplus of around 950 million litres per day above demand135 hotter drier summers will increase the risk of drought And more than five million properties in England ndash around one in every six ndash are already at risk of flooding136 with this number likely to increase due to climate change Of those properties over three million are at risk of surface water flooding which is more than the number at risk of river and coastal flooding combined137
In the first Assessment the Commission recommended action to increase resilience to drought by halving leakage by 2050 implementing compulsory metering by the 2030s and developing additional supply infrastructure and a national water transfer network138 The government endorsed the Commissionrsquos recommendation to increase drought resilience to a 1 in 500-year drought (02 per cent annual chance)139 and Ofwat required water companies to reduce water taken from the environment leakage and household water consumption between 2020 and 2025140 Ofwat has also allocated pound469 million for companies to investigate and develop proposals for new strategic infrastructure to address long term drought challenges141 In the South East Portsmouth Water is already building the Havant Thicket reservoir which will provide around 21 million litres of water per day when finished reducing drought risk in the wider region142 The Commission will continue to monitor governmentrsquos progress on these recommendations but will not undertake new work in the second Assessment
50
National Infrastructure Commission | The Second National Infrastructure Assessment Baseline Report
The Commission also made recommendations on floods in the first Assessment It recommended that government develop a flood strategy to deliver a nationwide standard of resilience to coastal and river flooding with an annual likelihood of at least 05 per cent or 01 per cent in densely populated areas supported by a rolling six year programme of funding143 The government has partially endorsed these recommendations The March 2020 budget announced an investment of about pound52 billion between 2021 and 2027 to protect against flooding in England which further announcements have brought closer to pound56 billion144 While rejecting specific standards the government committed to develop a set of indicators to measure improvements in resilience to flooding The Environment Agency has revised its National Flood and Coastal Erosion Risk Management Strategy for England and the National Planning Policy Framework has also been revised to clarify the approach to flood risk management in England145 The Commission will continue to monitor governmentrsquos progress and hold government to account for delivering on its commitments but will not undertake new work on river and coastal flooding in the second Assessment
A lack of reliable data meant that it was not possible to consider surface water flooding or wastewater in detail for the first Assessment The Commission instead recommended that all relevant organisations ensure that the necessary data be available for the second Assessment The Commission will consider surface water management as part of its upcoming work
Surface water management is a key challenge
Surface water flooding occurs when the volume of rainfall exceeds the capacity of drainage systems Water cannot quickly drain away or soak into the ground Instead it collects at low elevations causing flooding This type of flooding is often localised and is disruptive to homes and businesses It can also cause serious pollution to rivers with impacts on water and environmental quality biodiversity and public health and amenities The continued risks of surface water flooding were highlighted by incidents during the summer of 2021146
The government is making piecemeal improvements147 but the scale of the challenge may require a more fundamental review of current arrangements Multiple organisations are currently responsible for assets that impact on surface water flooding including local authorities highways authorities and water companies Water company sewers have a key role to play in providing drainage and reducing the risks of surface water flooding ndash if capacity in the sewerage system is not available then sewers overflow Seven per cent of water bodies in England such as lakes and rivers are failing good ecological status due to intermittent stormwater overflows148 While serious pollution incidents caused by water and sewerage companies decreased from 2002 they have plateaued since 2014 at an unacceptable level and further action is needed to address this149 And while properties are eight times less likely to suffer sewer flooding than they were in 1990 climate change could increase this risk150
In the second Assessment the Commission will carry out a dedicated study as requested by government in the 2021 Spending Review on reducing the risks of surface water flooding151 This will undertake analysis to gain a better understanding of the challenge and the opportunities to address it in the short and long term The Commission will determine the improvements needed to Englandrsquos drainage systems to manage and mitigate surface water flooding in urban and rural areas both now and in the future It will assess current approaches to manage surface water and consider which options provide the greatest resilience and value for money This may include improving current levels of governance performance preparedness and understanding local flood planning spatial and development planning data sharing funding and investment It will also include opportunities for
51
National Infrastructure Commission | The Second National Infrastructure Assessment Baseline Report
harnessing nature based solutions such as sustainable drainage systems blue green infrastructure and natural flood management alongside hard engineering solutions that increase sewer capacity for new and existing developments
Challenge 6 Surface water management ndash the Commission will consider actions to maximise short term opportunities and improve long term planning funding and governance arrangements for surface water management while protecting water from pollution from drainage
The Commission will deliver this as a separate study and report to government by November 2022 in advance of its other recommendations
32 Infrastructure and natural capitalAlongside climate change there is another environmental crisis Global assessments show that nature is declining at rates unprecedented in human history with accelerating rates of species extinction and severe disruption to ecosystem services152 Infrastructure contributes to this decline but can also help prevent it
The decline in nature can be measured through impacts to lsquonatural capitalrsquo This term refers to the natural assets that society and the economy depend upon including the atmosphere forests fisheries rivers biodiversity land and minerals and both the living and non-living aspects of ecosystems These provide environmental services and benefits such as food timber minerals fresh water clean air and protection from flooding drought heatwaves and landslides More detail on natural capital can be found in the Commissionrsquos discussion paper Natural Capital and Environmental Net Gain153
There is a two way relationship between infrastructure and natural capital
z infrastructure can have a negative impact on natural capital assets for example through air and water pollution damage to habitats and biodiversity or the extraction of minerals for construction
z infrastructure can deliver benefits for natural capital for example by preventing harmful waste products from entering the natural environment through the provision of protected natural habitats and connecting corridors for species along linear infrastructure and the use of sustainable drainage systems for mitigating flood risk
z changes in the environment can increase the costs of infrastructure for example if roads and railways need to withstand higher temperatures (see section 31)
z natural capital approaches can reduce the demand for infrastructure for example natural water catchment management reduces demand for flood defences
z natural capital is a prerequisite for some infrastructure such as inputs of freshwater to water supply networks ndash in these cases the resilience of a sector is linked to the environmental service which underpins it154
The governmentrsquos 25 Year Environment Plan sets out objectives to improve natural capital and ecosystem services155 The Commission considered many of these objectives in its previous recommendations as described in figure 34 Objectives on climate change are not included in this table as they are covered in Chapter 2
52
National Infrastructure Commission | The Second National Infrastructure Assessment Baseline Report
Figure 34 The Commission has made recommendations to support many of the objectives in the governmentrsquos 25 Year Environment Plan
Selected objectives in the 25 Year Environment Plan and the Commissionrsquos related recommendations and work
Selected objectives from the 25 Year Environment Plan
Commission recommendations and work
Minimising waste
National Infrastructure Assessment recommendations on a municipal waste recycling target of 65 per cent by 2030 including a plastic packaging recycling target of 75 per cent by 2030 incentivising recyclable packaging and product design restricting hard-to-recycle plastics and a consistent collections standard for municipal waste156
Clean air
National Infrastructure Assessment recommendations to prepare for 100 per cent electric vehicle sales by 2030 enable the move to highly renewable power system and support the transition to zero carbon heating157
Freight study recommendations to enable zero carbon freight by 2050158
Clean and plentiful waterNational Infrastructure Assessment recommendations on drought resilience through increasing supply and reducing demand for water159
Reducing the risk of harm from environmental hazards
National Infrastructure Assessment recommendations on a strategy to deliver a nationwide standard of flood resilience by 2050 which reduces the annual likelihood of flooding to 05 per cent and 01 per cent for densely populated areas160
Thriving plants and wildlife
Design Principles for National Infrastructure Infrastructure projects should make interventions to enrich our ecosystems seek to deliver biodiversity net gain contribute to the restoration of wildlife on a large scale and protect irreplaceable habitats161
Natural capital and environmental net gain committed the Commission to promote environmental net gain for all infrastructure projects and develop a set of natural capital principles for infrastructure to complement and expand on the Design Principles162
Using resources from nature more sustainably and efficiently
Design Principles for National Infrastructure includes consideration for using resources for construction of infrastructure more sustainably and efficiently163
Enhancing beauty heritage and engagement with the natural environment
Design Principles for National Infrastructure infrastructure should give places a strong sense of identity form part of national cultural heritage and make a positive contribution to local landscapes within and beyond the project boundary164
Source Adapted from the Commissionrsquos Natural capital and environmental net gain discussion paper
53
National Infrastructure Commission | The Second National Infrastructure Assessment Baseline Report
Natural capital in the second Assessment
In the second Assessment the Commission will assess the impact of its recommendations on natural capital as part of its cross cutting analysis (see Chapter 5) It will also develop a set of natural capital principles for infrastructure which provide guidance on how best to deliver environmental net gain
The Commission will consider specific environmental objectives through challenges in the second Assessment including
z clean air the Commission will make further recommendations to reduce the impacts on air pollution from transport and energy (see Chapters 2 and 4)
z clean and plentiful water the Commission will consider pollution from wastewater as part of challenge 6 (see above)
z reducing the risk of harm from environmental hazards the Commission will make recommendations on surface water flooding as part of challenge 6 (see above)
In the second Assessment the Commission will consider the objective on minimising waste in more detail There has been some progress on this in recent years The Commissionrsquos recycling targets from the first Assessment were partially adopted in the Resources and waste strategy for England albeit with a later target date of 2035165 The government has committed to a national standard of recycling for households and businesses by 2025 and separate food waste collection (to enable biogas production) by 2025 as recommended by the Commission and consulted on making producers responsible for the costs of managing packaging when it becomes waste Some of these measures will be implemented through the Environment Act166
However as explained in Chapter 2 the net zero target means that the Commission will need to revisit its work on waste in the second Assessment The government has also committed to move to a more circular economy which could have wider implications for the sector
The waste sector can protect the environment by enabling the move to a more circular economy
Waste infrastructure prevents harmful products from entering the natural environment by enabling the collection sorting treatment and disposal of waste Recycling plays a central role by keeping materials in productive use which reduces demand for the extraction of raw materials and the need for more carbon intensive and polluting forms of waste disposal Recycling rates have increased since 2000 with 43 per cent of local authority collected waste in England recycled in 2019 Internationally comparable data is only available for the UK rather than England but the UKrsquos recycling performance is broadly comparable with similar countries However rates have stagnated in recent years167
54
National Infrastructure Commission | The Second National Infrastructure Assessment Baseline Report
Figure 35 An international comparison of municipal recycling shows the UK lagging behind the best performers
Municipal recycling rates across comparative countries from 2008 and 2018
0
10
20
30
40
50
60
70
80
90
100
Germany South Korea Netherlands France UnitedKingdom
Spain Canada Japan
Mun
icip
al re
cycl
ing
rate
per
cent
age
Country
2008 2018
Source OECD (2021) Municipal Waste Generation and Treatment Eurostat (2021) Recycling rate of municipal waste
The government has framed its waste objectives as part of the move to a more circular economy This concept refers to systemic changes across the economy which seek to
z prevent waste by keeping products and materials in use for longer favouring activities that preserve value in the form of energy labour and materials and designing for durability repair reuse and remanufacturing
z increase recycling to keep products components and materials circulating in the economy
z conserve natural resources by avoiding the extraction and use of non-renewable resources and promoting the use of renewable ones168
The Commissionrsquos social research suggests the public supports further action Seven in ten respondents agreed that companies should take more responsibility for recycling and disposing of packaging waste even if it raises the prices of products Respondents also raised concerns around overconsumption excess packaging and the transparency of waste disposal processes169
The Commissionrsquos work will consider additional changes needed in the waste sector to enable the move to a more circular economy and reduce the environmental impacts of waste This will include looking at ways to increase recycling rates for municipal and construction waste deliver the infrastructure needed to achieve net zero and increase resilience to possible future restrictions on waste exports The Commission will also consider interdependencies with the other infrastructure sectors in its remit
55
National Infrastructure Commission | The Second National Infrastructure Assessment Baseline Report
This includes demand for energy and water and the role of energy from waste It also includes challenges and opportunities associated with construction waste from different infrastructure sectors as they take steps to improve resource efficiency and reduce waste
This will require open and transparent data for example on the capacity of recycling infrastructure The government accepted the Commissionrsquos recommendation in the first Assessment for a common data reporting framework for businesses that handle commercial and industrial waste The Environment Act includes powers to introduce a digital system to track waste movements170
Challenge 7 Waste and the circular economy ndash the Commission will examine the role of the waste sector in enabling the move towards a more circular economy
33 Challenges for the second AssessmentAs set out in this chapter the key challenges the Commission will consider in the second Assessment related to climate resilience and the environment will be
Challenge 5 Asset management and resilience ndash the Commission will consider how asset management can support resilience barriers to investment and the use of data and technology to improve the way assets are maintained
Question 13 In what ways will current asset management practice need to improve to support better infrastructure resilience Your response can cover any number of the Commissionrsquos sectors
Challenge 6 Surface water management ndash the Commission will consider actions to maximise short term opportunities and improve long term planning funding and governance arrangements for surface water management while protecting water from pollution from drainage
The Commission will carry out a separate call for evidence on this challenge as the Commission will deliver this as a separate study and report to government by November 2022 in advance of its other recommendations
Challenge 7 Waste and the circular economy ndash the Commission will examine the role of the waste sector in enabling the move towards a more circular economy
Question 14 What are the barriers to and solutions for expanding recycling capacity both now and in the future to deliver environmental and net zero targets
Question 15 What is the likely environmental impact of waste streams from construction across economic infrastructure sectors over the next 30 years and what are the appropriate measures for addressing it
Details on how to respond to the call for evidence questions are set out in Chapter 5
56
National Infrastructure Commission | The Second National Infrastructure Assessment Baseline Report
The government has set itself the ambition of lsquolevelling uprsquo outcomes across the UK reducing disparities between different towns cities and regions Infrastructure can support this goal In the second Assessment the Commission will examine the most significant unresolved infrastructure questions that relate to levelling up ndashfocusing on the challenges of urban mobility and congestion and interurban transport
Large cities and some towns outside London are not achieving their productivity potential The reasons for this are varied and many have been entrenched for decades Sustained local growth needs to be rooted in local strategies covering a range of coordinated policy areas While infrastructure is a necessary condition for economic growth it is rarely sufficient Instead infrastructure should form part of wider economic strategies alongside other areas like skills and inward investment
Before the Covid-19 pandemic many major cities suffered from congestion and poor public transport connectivity preventing goods services and people from travelling in an efficient and sustainable way Overcrowded or slow transport networks limited the ability of businesses and workers to locate in dense city centres which has been a major barrier to urban productivity and growth Addressing this would benefit not just city centres but also their wider regional area
Equally the countryrsquos interurban road and rail networks connect every city and town together enabling people and goods to travel between them ndash ensuring that these networks are prepared for the demands of the future will help maximise their economic impact in every region
Other infrastructure sectors also support productivity and wellbeing Digital infrastructure can help improve productivity by improving connectivity and new energy related industries such as greenhouse gas removals or hydrogen production may create economic opportunities for certain towns and cities which could form part of locally led wider economic strategies for those places
41 Infrastructure and levelling upThe government has set itself the ambition of lsquolevelling uprsquo outcomes between and within regions to improve opportunity and boost livelihoods171 Levelling up has a variety of interpretations Common to all of these is the aim to reduce disparities that exist between places172 These disparities are driven by a mix of economic social and political factors There is no single policy area ndash including infrastructure policy ndash that can singlehandedly lsquolevel uprsquo a place Infrastructure is necessary but not sufficient to support local economic growth and infrastructure interventions should form part of a wider economic strategy
Different places will always play different roles in the economy The productivity potential of different places varies ndash different parts of the country have different economic densities For example it would not be realistic to aim for the same productivity in rural Cumbria as in central Manchester
4 Supporting levelling up
57
National Infrastructure Commission | The Second National Infrastructure Assessment Baseline Report
But even narrowing economic disparities between places with comparable geographic characteristics would be a major success While no two places are exactly the same the Commission will look at broadly comparable places to assess their economic potential
Levelling up the country should not be seen as an alternative to improving productivity nationally The goal should be to support faster growth in lower productivity places while maintaining or improving the economic performance of high productivity places Regional rebalancing must also not come at the expense of the commitment to achieving net zero Improvements in transport connectivity must be delivered alongside reductions in carbon emissions in line with the trajectory set out by the Climate Change Committee Developments in some sectors particularly energy to deliver net zero may also provide new economic opportunities for some areas
Many areas of economic infrastructure including much of the transport sector is devolved to Northern Ireland Scotland and Wales (see Chapter 1) The Commissionrsquos role is to advise the UK Government This chapter therefore focusses on areas within the UK Governmentrsquos competence
England has a wide and longstanding variation in outcomes
England has wide variations in economic outcomes and quality of life173 Geographic variation in economic outcomes in particular is a long standing self reinforcing problem that is complex to address174 Infrastructure alone cannot address these problems
Figure 41 Regional variation in productivity has endured over time
GDP per worker by region and nation in the UK relative to the UK average 1901-2001
70
80
90
100
110
120
130
140
1901 1911 1921 1931 1941 1951 1961 1971 1981 1991 2001
Inde
x of
GD
P pe
r wor
ker
GB
= 10
0
Year
London South East East Anglia South WestWest Midlands East Midlands North West North EastYorkshire amp Humberside Wales Scotland
Note Data for 1941 is missing in the source data so a dummy value is created such that there is a constant linear change between 1931 and 1951
Source Geary and Stark (2016) What happened to regional inequality in Britain in the twentieth century
58
National Infrastructure Commission | The Second National Infrastructure Assessment Baseline Report
Productivity and wages which are closely related vary widely both within and across regions175 As similar types of people and businesses tend to cluster together some variation between places is inevitable and many other countries also face persistent economic variation between regions However the extent of regional variation within England appears to be unusually high compared to other countries176 England is also unusual in that few of its major cities apart from London have productivity above the national average177
Figure 42 English cities have productivity below the national average unlike in international comparators
GDP per worker percentage difference compared to national average in England and comparable countries
Source OECD (2021) Labour productivity Metropolitan areas OECD (2021) Level of GDP per capita and productivity for 2018 (2016 for France and Japan)
-40 -30 -20 -10 0 10 20 30 40 50
Seo
Gwangsan
Dalseong
Gimhae
Seoul
Seville
Valencia
Saragossa
Barcelona
Madrid
Bordeaux
Strasbourg
Toulouse
Lyon
Paris
Berlin
Cologne
Hamburg
Frankfurt
Munich
The Hague
Eindhoven
Rotterdam
Utrecht
Amsterdam
Okayama
Sendai
Nagoya
Osaka
Tokyo
Leeds
Liverpool
Birmingham
Manchester
London
Kore
aSp
ain
Fran
ceG
erm
any
The
Net
herl
ands
Japa
nEn
glan
d
GDP per worker percentage difference compared to national average
Co
untr
y an
d se
lect
ed c
itie
s
59
National Infrastructure Commission | The Second National Infrastructure Assessment Baseline Report
Disparities also exist within regions Rural areas often have low productivity while all regions have some hubs of manufacturing or knowledge intensive services with higher productivity such as those in Cheshire Sunderland and York178 There are disparities within cities too in Greater Manchester productivity in Trafford is over a third higher than in Oldham179
Figure 43 There are wide differences in productivity among local areas in the UK
Variation in GVA per hour worked across the UK by ITL2 subregions 2019
Source ONS (2021) Subregional productivity labour productivity indices by UK ITL2 and ITL3 subregions 2019
-30 -20 -10 0 10 20 30 40 50 60
Cornwall and Isles of ScillySouth Yorkshire
Northern IrelandWest Wales and The Valleys
Shropshire and StaffordshireLincolnshire
CumbriaDorset and Somerset
DevonTees Valley and Durham
East Yorkshire and Northern LincolnshireMerseyside
Northumberland and Tyne and WearWest Yorkshire
North YorkshireDerbyshire and Nottinghamshire
East WalesLancashire
Leicestershire Rutland and NorthamptonshireGreater Manchester
West MidlandsSouthern Scotland
East AngliaHighlands and IslandsWest Central Scotland
Herefordshire Worcestershire and WarwickshireUK average
EssexKent
Bedfordshire and HertfordshireGloucestershire Wiltshire and BathBristol area
North Eastern ScotlandCheshire
Eastern ScotlandSurrey East and West SussexHampshire and Isle of Wight
Outer London - SouthOuter London - East and North East
Berkshire Buckinghamshire and OxfordshireInner London - East
Outer London - West and North WestInner London - West
GVA per hour worked percentage difference compared to UK average
ITL2
Reg
ion
60
National Infrastructure Commission | The Second National Infrastructure Assessment Baseline Report
There are also disparities in quality of life between and within places London and the South East score highly for healthy life expectancy but London is lowest for life satisfaction In London only 26 per cent of people have a very high level of satisfaction with their life compared with consistent scores between 30 and 32 per cent in all other regions Healthy life expectancy is lowest in the regions of the North180
Box 41 The Commissionrsquos objectives and levelling up
Supporting levelling up aligns with all four of the Commissionrsquos objectives which are to
z Support sustainable economic growth across all regions of the UK By supporting growth in lower productivity places while maintaining or improving the economic performance of higher productivity places reducing disparities between places will support sustainable economic growth across all regions of the UK
z Improve competitiveness Improving access to markets labour and capital either through transport or digital connectivity can improve competitiveness And contributing to the economic transformation of places through infrastructure investment can support both levelling up and competitiveness if it leads to the development of new globally significant clusters and assets181
z Improve quality of life Infrastructure interventions to support levelling up can directly contribute to higher quality of life in places with poor provision ndash for example by connecting people to services concentrated in cities reducing air pollution and improving reliability of services Contributing to improved economic outcomes will also support improved quality of life in some places
z Support climate resilience and the transition to net zero carbon emissions by 2050 Ensuring universal provision of infrastructure such as flood defences and water supply can support both levelling up and climate resilience
The Commissionrsquos social research found that a quarter of people surveyed prioritised infrastructure driving regional growth and rebalancing growth more fairly across the country as one of the most important goals for the lsquovisionrsquo of the UKrsquos infrastructure in 30 yearsrsquo time182
Variations are caused by multiple interacting factors
There are several factors that interact to create self reinforcing cycles of economic success or deprivation in different places183 Highly skilled people and businesses tend to cluster together making individuals more productive and able to earn higher wages184 Businesses in highly skilled sectors also tend to cluster together making them more productive Highly skilled workers also attract highly skilled businesses and vice versa This effect is known as lsquoagglomerationrsquo
These clusters also attract other high end businesses that concentrate in areas where there are well paid people who can pay for their services The availability of these amenities and other services attracts other highly paid people This high demand pushes up property prices in the area further concentrating higher paid workers and pricing out people with lower incomes185
61
National Infrastructure Commission | The Second National Infrastructure Assessment Baseline Report
These effects also work in reverse People on low incomes are likely to move to areas with low property prices and more affordable shops and services clustering people on lower incomes and businesses that employ lower skilled workers186
Some cities have gained from these agglomeration effects as the economy has shifted towards highly skilled services187 while low incomes have persisted in some struggling areas188 Towns near to productive cities tend to have higher incomes than those near less productive cities189 Certain geographical characteristics can also increase the attractiveness of some places for new and growing industries For example the offshore wind industry is centred in windy coastal places near the North Sea offering opportunities to Hull Grimsby and the North East190
Current variations may not continue New technologies that lead to the development of new industries (for example the transition to decarbonised energy see Chapter 3) or changes in how work is done for example increased levels of working from home driven by digital technologies and following the Covid-19 pandemic may change current patterns of where people and businesses choose to locate191
Variations in economic outcomes also influence the quality of life of people living in these places Employment status is a strong predictor of life satisfaction192 and the economic fortunes of an area influence a wide range of outcomes that impact how happy people are193 Patterns of local productivity shape an individualrsquos quality of life view of the world (including perceptions of other regions) and opportunities which can differ profoundly between low and high productivity places194 However a good quality of life reflects a broad range of factors including relationships health education and economic outcomes195 Quality of the built environment access to green space and sense of community all influence how happy people are196 and some places such as London perform well overall on economic outcomes but poorly against some quality of life metrics197 In order to improve all areas of quality of life policymakers also need to look at other causes
Addressing these disparities is hard
Addressing variations in economic performance and quality of life is not straightforward There is a long history of government attempts to address geographical variation in economic outcomes with at best mixed success198
Sometimes interventions move economic activity from one place to another rather than increasing total activity ndash an effect known as lsquodisplacementrsquo Shifting economic activity from a relatively successful place to a less successful one might be worthwhile even if there is no net gain but evidence suggests that displacement instead often shifts activity from one struggling area to another199
There is also an element of luck in whether any particular attempt is successful Successful place based policies elsewhere have brought infrastructure decisions into wider economic strategies that include issues like skills and industrial policy200 These strategies work best with governance at the level they are intended to influence
Places also need private sector investment to successfully level up Successful long term infrastructure strategies can help attract private investment by giving investors confidence that their investments will be aligned with any new or improved infrastructure that industry may require These strategies work best when governance is at the level they are intended to influence201
62
National Infrastructure Commission | The Second National Infrastructure Assessment Baseline Report
Infrastructure can help address these disparities
The Commission has set out its view on how infrastructure can support growth and levelling up in Growth across regions202 This discussion paper identified three pathways for infrastructure to help achieve economic outcomes in different areas
z Addressing constraints to growth Enabling future growth in congested places by investing in transport capacity upgrades This allows greater clustering by facilitating greater density in these areas These interventions primarily support growth in dense places with high productivity potential (primarily cities) furthering the virtuous cycle of agglomeration although surrounding towns also benefit from increased growth in cities203
z Contributing to transformation Prioritising infrastructure investment alongside wider policies (eg skills research and development) to increase growth in low productivity places with an emphasis on promoting a positive cycle of investment and growth This could include investing in the infrastructure required to enable new and emerging industries to expand in a specific location or improving connections from towns into their nearest city204
z Universal provision This involves setting common or minimum standards for infrastructure services and working to reduce differences in access across the UK These interventions will contribute to improvements in quality of life resilience to shocks and other societal outcomes
Supporting growth across regions can also help improve quality of life as economic outcomes are one driver of quality of life outcomes205 However infrastructure interventions can also directly contribute to higher quality of life in places for example by connecting people to services concentrated in cities reducing congestion and pollution and improving reliability of services The Commission will explore this relationship further in its forthcoming discussion paper on its quality of life objective and will use this to consider infrastructurersquos role in improving quality of life outcomes in the second Assessment The Commission has already published a literature review which sets out the evidence base on the interaction of infrastructure and quality of life206
While better infrastructure can benefit both productivity and quality of life the largest and most regionally significant projects are likely to impact on outcomes primarily through improving economic opportunity The Commission will take account of where places are not reaching their economic potential to identify where interventions are likely to deliver significant benefits ndash for example identifying where growth could be unlocked by increasing capacity in congested city centres ndash and then consider how the required interventions can improve both productivity and quality of life
Infrastructure interventions are also likely to have the most impact in places where population concentration creates high demand so there is a relationship between infrastructure and housing The Commission considers the potential interactions between its infrastructure recommendations and housing supply but housing policy itself is not in its remit
Locally led infrastructure strategies should form part of wider economic plans
While infrastructure has an important role to play in supporting economic growth and quality of life and thereby reducing disparities between places207 it is not the whole solution Other factors like skills and education also have an important role in delivering economic and quality of life outcomes and therefore need to be aligned to infrastructure investment208
63
National Infrastructure Commission | The Second National Infrastructure Assessment Baseline Report
And for investments to be most effective investment decisions need to be taken at the right level and ensure all interventions work together for different places For infrastructure to best support levelling up the Commission has identified three key conditions
z infrastructure strategies should form part of wider economic strategies
z cities and towns should have devolved powers and funding to develop locally led infrastructure strategies with central government oversight reserved for only the biggest projects
z government should make expert support and advice available to help those local authorities where capacity and capability are obstacles to developing and delivering their infrastructure strategies
The first Assessment recommended that cities should have the powers and funding they need to pursue ambitious integrated strategies for transport employment and housing209 And in Infrastructure Towns and Regeneration the Commission concluded that the present funding system for local transport hinders the development of effective strategies and plans210 To address this the Commission recommended that central government simplify these funding streams and provide county councils and unitary authorities responsible for strategic transport planning with devolved five year budgets for local transport211
Improvements in the transport sector can have the greatest impact
While all infrastructure sectors support productivity and quality of life some have greater potential to play a role in reducing disparities than others
Transport is the sector with the most opportunity for helping to reduce disparities between places Transport can help address constraints to growth and with the right conditions contribute to economic transformation in particular places212 Larger cities in particular suffer from congestion and some places have poorer interurban connectivity than others213 Transport connections can increase the density of high productivity clusters of people and businesses in cities facilitate trade between cities make places more attractive to live and work in and encourage investment in places214 Effective distribution of freight is also essential to growth in any area215 However transport is not the whole solution ndash transport investment needs to come alongside other investments as part of a wider economic strategy in order to contribute to transformation
Although airports can have an impact on economic outcomes ndash they facilitate global trade provide jobs and can be globally significant assets ndash any consideration of aviation and levelling up is dependent on future demand for air travel following the Covid-19 pandemic and the approach to expanding runway capacity in the South East which is currently unclear The second Assessment will therefore not further consider airport capacity although interurban connectivity to international gateways will be included
Digital connectivity plays an increasingly important role in society and the economy by increasing the economic reach of local businesses enabling new ways of working more productively and enhancing connectivity to support quality of life216 While variations between regions exist government has a clear strategy to deliver near universal coverage of gigabit broadband and mobile 4G217 though it remains critical that this is effectively rolled out to rural areas and towns to ensure genuinely universal provision The Commission will continue to monitor progress in these areas218
64
National Infrastructure Commission | The Second National Infrastructure Assessment Baseline Report
Energy is a universal service and spatial variations are not a key driver of productivity disparities219 However new energy related industries and zero carbon infrastructure may create economic opportunities for certain towns and cities which could form part of locally led wider economic strategies for those places There may also be areas that are reliant on carbon intensive industries from which they will need to transition away from and doing this may have short or longer term impacts on their local economies
Other infrastructure sectors can be important to growth and quality of life but are not considered in this chapter
z flood resilience is vital to economic growth and quality of life but can vary by area ndash in the first Assessment the Commission recommended a nationwide standard of flood resilience ndash the government partially endorsed the Commissionrsquos recommendations (see Chapter 3 and Annex C) and the Commission will continue to monitor governmentrsquos progress
z water and waste are universal services where coverage does not vary significantly or where variation does not significantly affect productivity220
42 Transport and levelling up
Transport provision varies between places
Many cities and regions suffer from poor public transport connectivity which creates barriers to mobility and impacts on quality of life221 Before the Covid-19 pandemic many major cities suffered from congestion especially in the largest cities and at peak times222
Transport connectivity represents how quickly it is possible for people to travel from where they live to other places they might need to go The Commission has developed a metric to illustrate the effectiveness of the transport network at moving people by car and public transport both within built up areas (urban connectivity) and between them (interurban connectivity) with higher scores indicating better connectivity223 Congestion can be calculated by the ratio between peak and off peak connectivity
Larger cities tend to have worse congestion and poorer connectivity
The effect of peak time congestion means that transport connectivity is worst in the largest built up areas In towns with a population of under 100000 connectivity at peak times has typically been around 10 per cent worse than off peak travel and virtually never more than 20 per cent worse ndash illustrated by the congestion graph in figure 44 (where a score of 08 means that congestion reduces connectivity performance by around 20 per cent) It is only cities of more than about half a million people that see the most serious congestion effects with connectivity 40-50 per cent worse at peak time These congested cities are spread through the regions of the country ndash of the ten most congested cities outside London three are in the North three are in the Midlands two are in the South West and two are on the south east coast224
This urban congestion is a product of the density in population and employment required for successful cities225 This most obviously manifests on roads where delays are caused when there are too many cars for the space available Public transport is an essential alternative to car travel in places that suffer from
65
National Infrastructure Commission | The Second National Infrastructure Assessment Baseline Report
congestion but without the right infrastructure congestion also affects how transit services operate with buses stuck in traffic and trains overcrowded Freight deliveries also suffer from congestion on roads and cannot easily be replaced with off road alternatives
Figure 44 Urban transport connectivity tends to be worse in larger towns and cities due to the effects of congestion
Urban connectivity at peak time for car and public transport urban car connectivity at off peak and urban car congestion in Englandrsquos most populated built up areas 2016
Source National Infrastructure Commission (2018) Transport connectivity dataset
As cities grow transport capacity can struggle to keep pace with demand creating a constraint on further growth People are only willing to commute for a certain amount of time on average around half an hour each way per day226 The impacts of congestion on travel times in cities therefore limits both the number of jobs available to people looking for work and the number of potential employees
0
01
02
03
04
05
06
07
08
09
11 10 100 1000 10000 100000
Rati
o o
f pea
k to
off
-pea
k co
nnec
tivi
ty
Population thousands (log scale)
b) Congestion
10 largest cities other cities other places
0
02
04
06
08
1
12
1 10 100 1000 10000 100000
Con
nect
ivit
y
Population thousands (log scale)
b) Public transport
10 largest cities other cities other places
0
02
04
06
08
1
12
1 10 100 1000 10000 100000
Con
nect
ivit
y
Population thousands (log scale)
a) Car
10 largest cities other cities other places
0
02
04
06
08
1
12
14
16
1 10 100 1000 10000 100000
Con
nect
ivit
y
Population thousands (log scale)
a) Off peak connectivity
10 largest cities other cities other places
66
National Infrastructure Commission | The Second National Infrastructure Assessment Baseline Report
for businesses to recruit from Not only does this reduce the productivity and wages of people and employers directly affected ndash slowing down the positive cycle of agglomeration effects set out in section 41 ndash but its effects ripple out into the surrounding region since more productive activity within cities can create more demand for other services that can be provided from towns nearby227
Figure 45 Public transport can provide much higher transport capacity than cars enabling higher density employment in city centres even if they are congested
Typical maximum capacity per lane (inbound passengers per hour)
Source National Infrastructure Commission (2018) National Infrastructure Assessment
The Covid-19 pandemic initially reduced congestion in cities as stay at home guidance meant people made fewer trips by car Public transport use also fell by 80 to 95 per cent and government gave emergency financial assistance to avoid the collapse of transport providers228 However congestion had already returned to high levels on urban roads by the time of the latest data in February 2021229 while lockdown restrictions were still in force and is likely to have increased further as motor traffic has more recently reached close to pre pandemic levels230
Nevertheless there remains scope for more significant longer term changes and it is too early to make confident forecasts for infrastructure demand for the long term Policy proposals for public transport investments will take into account the need to plan for and remain responsive in implementation to the range of possible future scenarios
Plans for urban transport will also need to address carbon emissions In the long run this will mean full electrification of cars as well as zero emission upgrades for buses goods vehicles and trains On-street charging for cars is a particularly significant issue in cities where many people do not have a driveway The Commissionrsquos recent report Infrastructure Towns and Regeneration recommended that government publish the electric vehicle charging infrastructure strategy followed by a roadmap for the rollout of electric vehicle charging infrastructure in towns and that local infrastructure strategies include an active role for the local authority in planning and managing the rollout of on street electric vehicle charging
In the shorter term before electrification of cars is complete enabling people to use public transport or active travel as an alternative to driving provides an opportunity to reduce emissions While the switch to electric vehicles will have significant environmental benefits it will also have significant fiscal consequences due to loss of fuel duty
720Car
1800Bus
2100Bus rapid transport
2880Tram
67
National Infrastructure Commission | The Second National Infrastructure Assessment Baseline Report
Public transport and demand management can help address congestion
Increasing public transport capacity is one option to address congestion ndash either by enabling car travel to be replaced with more space efficient buses or trams or by providing more space on faster rail connections from places further out Successful cities are likely to remain congested to some degree even with the very best infrastructure as more people come and use the additional capacity and some people will always prefer to travel by car But increasing the number of people who can commute in is necessary to support the higher densities of businesses and workers in city centres and enable agglomeration benefits231
Another option to reduce crowding on roads is demand management ndash which could include congestion charging for city centres or other measures to restrict car access to certain areas These measures could reduce overall use of cars resulting in either less congestion or an opportunity to reallocate road space to other purposes Congestion charging would also provide a new source of revenue to support public transport and help to ensure motoring taxes keep pace with the transition to electric vehicles However if public transport provision does not offer a genuine alternative to driving restrictions on road use could have a negative impact on economic outcomes
Approaches to congestion charging and wider questions of lsquoroad pricingrsquo can be sensitive as there is an assumption that the public are inherently opposed to such models232 Given the challenges set out above the Commission is keen to support an evidence based discussion of the options helping to open up debate and allow proper consideration of the costs and benefits of different approaches
As a starting point the Commission has used deliberative engagements in three cities across England to explore public attitudes to tackling urban congestion see box 42 which found a higher than expected level of support for congestion charging
Box 42 Deliberative engagements on tackling congestion
In early 2020 the Commission ran three deliberative engagements on urban congestion with members of the public in Bristol Nottingham and Manchester233 The Commission assembled a panel of experts from all sides of the debate including the RAC and the Campaign for Better Transport to review an evidence pack on the causes and impacts of urban congestion The Commission also appointed an independent evaluator to assess the fairness of the exercise Participants in each location were then given two days to consider the evidence speak to experts and discuss potential packages of responses including accepting congestion congestion charging and investing in public transport
Across all three groups despite initial opposition at the end of day two congestion charging was identified as at least part of the solution by 82 per cent of participants After considering the evidence participants felt that continuing with high congestion was not an acceptable option and that investing in public transport on its own would not be sufficient to reduce congestion While this was a very small sample size it does suggest that citizens are potentially open to congestion charging as part of the solution The Commissionrsquos recent national survey of more than 6000 participants also found 40 per cent of participants were willing (compared to 30 per cent unwilling) to accept congestion charging if proceeds supported public transport investment
68
National Infrastructure Commission | The Second National Infrastructure Assessment Baseline Report
The first Assessment recommended long term locally led investment in urban transport to allow greater density in city centres The Commission also set out principles and case studies for local infrastructure strategies and the devolved governance that should enable them to happen234 and highlighted that suburban towns may experience greater economic opportunity if they were better connected into city centres235
The government has made some progress in this area committing pound57 billion for intraurban transport settlements between 2022 and 2027 in eight out of the nine mayoral combined authorities outside London236 with funding allocated on a more stable basis than before Government also wants half of all journeys in towns and cities to be made by walking or cycling by 2030 ndash although walking and cycling will be more feasible in some places than others Government has committed pound5 billion over the current parliament for bus services and cycling237 with a new inspectorate to oversee spending and standards and a second Cycling and Walking Investment Strategy due this year In addition to the reforms set out in the National Bus Strategy it has also committed to support local authorities to build business cases and develop innovative sustainable transport policies238
However governmentrsquos current commitments may not be sufficient to deliver levelling up There is currently no pipeline of urban transport projects at the scale likely to be required in coming decades to address the impacts of congestion on growth and productivity in the busiest cities with the most growth potential Previous analysis undertaken by the Commission suggests that investment in the region of tens of billions above planned investment will be needed unless transport patterns following the Covid-19 pandemic are significantly different ndash enough to fund a wave of very large transport projects such as new tram lines and more urban rail capacity across a number of cities239 Part of this would be funded from locally raised income ndash in 2019-20 around pound2 billion of local transport investment was funded in this way240
Challenge 8 Urban mobility and congestion ndash the Commission will examine how the development of at scale mass transit systems can support productivity in cities and city regions and consider the role of congestion charging and other demand management measures
There are wide variations in interurban connectivity
There are wide variations in interurban connectivity between places However it is hard to discern clear patterns in the variation or identify why they exist Figure 46 shows how interurban connectivity performance by both car and public transport varies among built up areas in comparison to their population size Variation in interurban connectivity is not neatly explained by the size of a place as it is for congestion ndash large and small settlements both show significant variation However it is clear that public transport journeys are significantly slower than those by car although scores again vary among places of similar sizes
Similarly there is not a clear regional pattern in interurban connectivity see figure 47 There is a wide variation in performance among places in all regions in England However it is clear that transport provision is poor in many places Around 30 per cent of people living in towns say that they are unsatisfied with road services where they live241 The Commission noted in its Rail Needs Assessment that rail journeys between major cities in the Midlands and the North tend to be slower than those in London and the South East and slower than those in high productivity regions in the Netherlands and Germany particularly for short rail journeys242 The study also identified issues with rail reliability and overcrowding in the Midlands and the North that need to be addressed
69
National Infrastructure Commission | The Second National Infrastructure Assessment Baseline Report
Figure 46 Variation in interurban transport connectivity is not mainly explained by the size of a built up area
Interurban connectivity for Englandrsquos most populated built up areas by car and public transport 2016
Source National Infrastructure Commission (2018) Transport connectivity dataset
Figure 47 Interurban connectivity is relatively similar across different regions except London both by car and public transport and varies more within regions
Interurban connectivity by region at peak time 2016 ndash distribution of built up areas within each English region (median indicated by cross bars interquartile range by blue box main range by extended lines and statistical outliers by dots)
Source National Infrastructure Commission (2018) Transport connectivity dataset
00
02
04
06
08
10
12
14
16
18
20
1 10 100 1000 10000 100000
Con
nect
ivit
y
Population thousands (log scale)
a) Car
10 largest cities other cities other places
000
005
010
015
020
025
030
035
040
1 10 100 1000 10000 100000
Con
nect
ivit
y
Population thousands (log scale)
b) Public transport
10 largest cities other cities other places
04
70
National Infrastructure Commission | The Second National Infrastructure Assessment Baseline Report
Improving interurban transport may also be able to support levelling up
Improving interurban transport ndash for cars public transport passengers and freight ndash can facilitate trade between cities243 It can enable businesses to source a wider range and better quality of inputs to their supply chains by reducing the cost of distance It can also increase the size of market that any one provider can access allowing successful firms to grow benefit from economies of scale and potentially specialise in higher value niche services that would be uneconomic in smaller markets ndash further supporting the potential for agglomeration in specialised clusters In turn this increases the incentives on workers to specialise and upskill244
It can also make places more attractive to live and work in and in the case of large investments such as high speed rail facilitate investment Infrastructure can act as an anchor investment signalling to the market that locations are worth investing in because other people or businesses are also likely to move there ndash for example major stations and interchanges of nationally significant infrastructure projects offer significant potential for urban regeneration These major investments should maximise the potential for urban regeneration This helps to solve coordination problems where the value of private sector investment depends on other investors making similar choices245 New infrastructure can help provide confidence that particular areas will be suitable for the changing needs of new industries
Government is making major investments in interurban transport through the Road Investment Strategy High Speed 2 and ongoing upgrades to the rail network Investment in national roads is planned to increase by more than double between 2015-16 and 2024-25 while investment in rail is planned to increase by more than half over the same period246 This makes it vitally important that there is a comprehensive and strategic understanding of what the priority objectives and projects should be within this investment
Whilst there is variation in connectivity between places it is difficult to assess the relative impact this has on productivity and quality of life in different places that all have different economic strengths The Commissionrsquos data reflects the current connectivity of the transport network but technological innovation decarbonisation and behaviour change are also transforming the sector ndash electric and autonomous vehicles create new opportunities and challenges for managing the road network while improved digital connectivity has the potential to transform patterns of commuting and service delivery The long term impacts of the Covid-19 pandemic are also uncertain
A multimodal transport strategy can improve coordination and prioritisation of investment
In transport policy governance and funding tends to be considered in siloes for the different modes of transport247 Therefore it can be difficult to determine the optimal balance of investment between different places and modes in terms of boosting growth and productivity improving quality of life and achieving net zero A multimodal transport strategy for interurban connectivity could help the country plan more effectively for sustainable growth and the shift to net zero optimising the use of different modes and covering both accessible passenger and freight transport Any multimodal transport strategy would need to be coordinated with locally led infrastructure strategies as recommended by the Commission in previous reports
71
National Infrastructure Commission | The Second National Infrastructure Assessment Baseline Report
Planning across modes and regions would help understand the priorities for improvement and how to address them including which places are underperforming most on connectivity measures and which have the greatest economic potential for infrastructure to unlock248 It would also enable a full understanding of the costs and priorities for delivering net zero including electric vehicle charging to enable rapid transition to zero emission cars emission free technology for trains coaches and goods vehicles and an understanding of the extent to which demand management may be necessary in the period before all cars are electric in order to comply with the sixth carbon budget
In the second National Infrastructure Assessment the Commission will therefore seek to better understand the long term needs of different cities and regions in terms of how interurban transport can impact on productivity and quality of life
Challenge 9 Interurban transport across modes ndash the Commission will consider relative priorities and long term investment needs including the role of new technologies as part of a strategic multimodal transport plan
43 DigitalDigital infrastructure and the use of data are important contributors to economic opportunity and quality of life through improved connectivity and new use cases which may boost local economic performance249 In some places digital connectivity may serve as a substitute for transport connectivity Digital services may be increasingly important for access to work and in determining where people choose to live if increases in working from home induced by Covid-19 endure in the long term250
In the first Assessment the Commission recommended that government should start work to ensure nationwide full fibre coverage by 2033251 To support that ambition it recommended that the government develop a national broadband plan by the end of 2018 and to subsidise full fibre rollout in areas where it may not be commercially viable
Since the first Assessment the government has set an ambitious target to reach at least 85 per cent gigabit broadband coverage by 2025252 and to move towards universal coverage as soon as possible Gigabit coverage is intended to provide a service as fast as full fibre but in some cases using alternative technologies to achieve this goal Good progress is being made so far on commercial rollout ndash over fifty per cent of premises are now able to access gigabit capable broadband253
Achieving nationwide gigabit broadband coverage is a major civil engineering challenge and will require a significant level of private investment The governmentrsquos target is achievable as long as the policy and regulatory environment remains pro investment and network operators deliver against the plans they have set out For premises in harder to reach areas the government will where necessary subsidise delivery using public funds through the Project Gigabit Programme254 The Commission will monitor progress with the rollout of gigabit capable broadband against governmentrsquos targets
On mobile coverage 92 per cent of the UK landmass is covered by at least one mobile operator with a funded plan to increase this to 95 per cent by 2025255 The Shared Rural Network agreement between government and the mobile operators should expand signal coverage and close almost all lsquopartial not spotsrsquo ndash areas where there is currently only signal from at least one but not all operators256 However data based on real user experiences suggests there may be issues with 4G availability in certain places257
72
National Infrastructure Commission | The Second National Infrastructure Assessment Baseline Report
In its recent study on Infrastructure Towns and Regeneration the Commission recommended that central government take measures to address any gaps in gigabit broadband coverage in towns and develop with Ofcom a more granular picture of mobile user experiences258 The Commission also recommended government develop a strategy to encourage the take up of new communications networks and services including supporting innovation pilots
As set out in Chapter 1 in the second Assessment the Commission will explore how the adoption of digital technologies and use of data enabled by these networks can improve the supply of and reduce demand for infrastructure across sectors
44 EnergyEnergy is a universal service which almost all areas of the country have access to
z nearly all properties are attached to the national grid for electricity259
z 85 per cent of properties are attached to the gas network260
For some areas new energy infrastructure may create new economic opportunities The transition to net zero will require investment in new industries such as greenhouse gas removals carbon capture and storage and hydrogen production This may create economic opportunities for certain towns and cities ndash especially where growing industries are clustered together as identified in the Humber local industrial strategy ndash and which could form part of locally led wider economic strategies for those places261 The development of the offshore wind sector has already created new opportunities for coastal towns close to large wind farms such as Grimsby
In the Commissionrsquos Infrastructure Towns and Regeneration report the Commission examined the impact of this potential transformation on Grimsby and made recommendations about how infrastructure policy could help similar places seize the opportunities of the energy transition However the transition away from oil and gas may have the opposite effect in places where these industries are centred such as Aberdeen or Shetland
The transition to net zero also requires individual households and businesses to take action both to improve the efficiency of their buildings and to transition to low carbon heating and cooling solutions Spatially energy efficiency varies from building to building meaning some properties will have higher energy bills than others affecting quality of life262 This means that the task of transitioning to zero carbon energy will require different interventions and generate different opportunities in different areas Areas of the country with older housing stock may need significantly more investment to retrofit energy efficiency improvements
The Commissionrsquos Infrastructure Towns and Regeneration study discussed how some areas may be able to use infrastructure planning to make the most of the opportunities of decarbonisation263 Building on this previous work the Commission will further explore energy related challenges and the transition to net zero as set out in Chapter 2 As part of this work the Commission will identify differing spatial effects and whether they could support levelling up
73
National Infrastructure Commission | The Second National Infrastructure Assessment Baseline Report
45 Challenges for the second AssessmentAs set out in this chapter the key infrastructure challenges the Commission will prioritise in the second Assessment with respect to levelling up will be
Challenge 8 Urban mobility and congestion ndash the Commission will examine how the development of at scale mass transit systems can support productivity in cities and city regions and consider the role of congestion charging and other demand management measures
Question 16 What evidence is there of the effectiveness in reducing congestion of different approaches to demand management used in cities around the world including but not limited to congestion charging and what are the different approaches used to build public consensus for such measures
Challenge 9 Interurban transport across modes ndash the Commission will consider relative priorities and long term investment needs including the role of new technologies as part of a strategic multimodal transport plan
Question 17 What are the barriers to a decision making framework on interurban transport that reflects a balanced approach across different transport modes
Details on how to respond to the call for evidence questions are set out in Chapter 5
74
National Infrastructure Commission | The Second National Infrastructure Assessment Baseline Report
51 The route to the second Assessment The second National Infrastructure Assessment will be published in the second half of 2023 and will set out long term infrastructure needs and recommendations to meet them in the next 10-30 years This Baseline Report has set out the current state of economic infrastructure identifying nine key challenges the Commission will consider for the second Assessment falling under the three strategic themes covered in chapters 2-4
The second Assessment will set out recommendations to address these key challenges This document contains call for evidence questions on the key challenges to support the Commission as it develops its work for the second Assessment Details on how to respond to the Call for Evidence are set out at the end of this chapter
In the run up to the second Assessment the Commission will use the Call for Evidence responses and evidence gathered through stakeholder engagement social research and advice from experts to inform the development of its recommendations to government
Figure 51 Timeline for the second Assessment
5 Next steps
Timeline for National Infrastructure Assessment 2
Autumn 2021
Baseline ReportSecond National
Infrastructure Assessment
Research analysis and engagement
Autumn 2021 to H1 2023 H2 2023
75
National Infrastructure Commission | The Second National Infrastructure Assessment Baseline Report
Principles
Alongside the Commissionrsquos objectives the following principles ndash based on the Process and Methodology Consultation conducted before the first Assessment ndash will underpin the Commissionrsquos work for the second Assessment
z Open transparent engaging with a wide range of stakeholders The Commission will seek to capture the expertise and opinions of people from across infrastructure providers business central and local Government academia civil society and the wider public
z Independent evidence-based objective and rigorous The Commission will seek to form a clear dispassionate assessment of the UKrsquos infrastructure needs built on extensive expertise and a robust methodology
z Forward looking challenging established thinking Rapid changes are happening in technology and peoplersquos behaviour is also changing ndash especially as a result of the Covid-19 pandemic These changes create challenges and opportunities for the UK The Commission will seek to assess the impact of technology behaviour change and other factors on the supply of and demand for infrastructure services and look to make recommendations which are affordable in and robust to multiple future scenarios
z Comprehensive taking a whole system approach understanding and studying interdependencies and feedbacks The Commission will seek to assess the UKrsquos infrastructure system as a whole looking across sectors and identifying and exploring the most important interdependencies and resilience implications
The independence of the Commission from both government and industry will enable it to develop a strategy that is in the long term interests of the UKrsquos present and future population The wide ranging engagement and evidence gathering processes that underpin the Assessment aim to increase transparency and secure a broad consensus around its recommendations including from all sides of the political spectrum
Stakeholder engagement and expert advice
The Commission will engage widely in the run up to publication of the second Assessment to inform its work on the nine challenges outlined in this report This includes engagement with industry bodies business and not for profit organisations including through responses to the Call for Evidence contained in this report The Commission will also further research the views and preferences of the public to shape its recommendations
The Commission will also hold a programme of roundtable events to explore policy questions in detail with regional and sectoral stakeholders This will involve Commissioners meeting with local businesses representative groups and politicians across the country and events bringing together a wide range of stakeholders with interests in the three strategic challenges and the sectors within the Commissionrsquos remit A second round of similar events will take place later in the policy evaluation process
To help inform the second Assessment the Commission has established three expert advisory panels ndash on net zero climate resilience and levelling up ndash that have advised on the development of this Baseline Report The panels will continue to offer expert advice support analysis contribute new ideas and insights to support recommendations challenge the Commissionrsquos thinking and offer alternative perspectives The membership of each panel can be found on the Commissionrsquos website264
76
National Infrastructure Commission | The Second National Infrastructure Assessment Baseline Report
The Commissionrsquos work for the second Assessment will also draw on the advice of the Commissionrsquos Design Group The Design Group was established in 2019 to champion design excellence in national infrastructure It published the Design Principles for National Infrastructure in February 2020 which sets out four design principles ndash climate people places and value ndash that should guide the planning and delivery of infrastructure projects265
To provide fresh thinking and ensure that the next generation will be sufficiently represented the work of the Commissionrsquos Young Professionals Panel will support and inform the second Assessment The Panel was established in 2018 to ensure a strong voice for the next generation of infrastructure leaders in the Commissionrsquos programme266
The Commissionrsquos website will be updated regularly with information on how stakeholders can engage in the process Stakeholders will also be able to register to receive updates on progress towards the second Assessment and opportunities to get involved by signing up for email alerts via the Commissionrsquos website
52 Developing recommendations
Managing uncertainty
There are several external factors that impact the supply and demand of infrastructure including the environment and climate change population and demography technological change economic growth and behaviour change following the Covid-19 pandemic In particular the long term effects of the pandemic have highlighted the uncertainty that will be present when the Commission comes to develop the second Assessment The Commissionrsquos report Behaviour change and infrastructure beyond Covid-19 describes how the spread of potential outcomes for transport ndash particularly public transport ndash is wider than for other sectors although all sectors will face challenges267
The Commission will develop scenarios for the second Assessment to explore how the key drivers may affect the future supply and demand of economic infrastructure including using those set out in Behaviour change and infrastructure beyond Covid-19 These scenarios will be published in spring 2022
The Commission takes a range of approaches to managing the uncertainty around future trends that impact infrastructure to ensure that its recommendations stand the test of time as far as possible As set out in the first Assessment these approaches include
z Balancing the risks of major investments prioritising investments where the potential costs of inaction are higher than those of action such as increasing the water supply to prepare for droughts but taking a more lsquoadaptiversquo approach where it is possible to make changes incrementally as the situation develops ndash for example in flood defences
z Making complementary recommendations such as investing in both urban transport and rural fibre to mitigate uncertainty about where people will live and work in future
z Planning for future decisions for example by trialling options for low carbon heat to improve the evidence base for decarbonising heat over the 2020s
77
National Infrastructure Commission | The Second National Infrastructure Assessment Baseline Report
The Commission will continue to follow these approaches in the second Assessment While the infrastructure industry requires as much certainty as possible sometimes plans will need to be changed as more evidence emerges Adaptive frameworks will therefore continue to be particularly important for the Commission in managing these trade offs
Analysis topics for the second Assessment
The Commission will analyse the impacts of its recommendations in six key areas
z Public spending impact the Commissionrsquos binding fiscal remit requires it to demonstrate that all its recommendations are consistent with and set out how they can be accommodated within gross public investment in economic infrastructure of between 11 and 13 per cent of GDP each year between 2025 and 2055
z Bills impact the Commissionrsquos reports must also include a transparent assessment of the impact on costs to businesses consumers government public bodies and other end users of infrastructure that would arise from implementing the recommendations The second Assessment will also show the total costs of recommendations on a household level comparing current household bills to the additional costs of the Commissionrsquos recommendations
z Distributional impacts assessing whether recommendations will have disproportionate impacts on specific groups of people
z Climate change impact assessing the impacts of economic infrastructure and the Commissionrsquos recommendations on greenhouse gas emissions
z Environmental impact assessing how economic infrastructure and the Commissionrsquos recommendations affect the UKrsquos natural capital and biodiversity
z Regional impacts assessing whether recommendations will have disproportionate impacts on regions
53 How to respond to the Call for EvidenceResponses should be no longer than 10 pages in total (not including supplementary data files) and should be emailed to NIA2CfE_Responsesnicgovuk
The deadline for submissions is 4 February 2022
Evidence will be reviewed thereafter by the Commission If further information or clarification is required the team will contact you The Commission may publish any responses received If you believe there is a reason why your response or any part of it should be considered confidential please provide details
In exceptional circumstances the Commission will accept responses in hard copy If you need to submit a hard copy please send your response to the Commission Secretariat at
National Infrastructure Commission Finlaison House 15-17 Furnival Street London EC4A 1AB
78
National Infrastructure Commission | The Second National Infrastructure Assessment Baseline Report
FOI and Privacy Statements
Information provided in response to this consultation including personal information may be subject to publication or disclosure in accordance with the Freedom of Information Act 2000 (FOIA) or other relevant legislation
If you want information that you provide to be treated as confidential please be aware that under the FOIA there is a statutory code of practice with which public authorities must comply and which deals amongst other things with obligations of confidentiality
In view of this it would be helpful if you could explain to the Commission why you regard the information you have provided as confidential If the Commission receives a request for disclosure of the information it will take full account of your explanation but cannot give an assurance that confidentiality can be maintained in all circumstances An automatic confidentiality disclaimer generated by your IT system will not of itself be regarded as binding on the Commission
The Commission will process your personal data in accordance with relevant data protection law
54 Summary of Call for Evidence questions
1 Introduction
Question 1 Do the nine challenges identified by the Commission cover the most pressing issues that economic infrastructure will face over the next 30 years If not what other challenges should the Commission consider
Question 2 What changes to funding policy help address the Commissionrsquos nine challenges and what evidence is there to support this Your response can cover any number of the Commissionrsquos challenges
Question 3 How can better design in line with the design principles for national infrastructure help solve any of the Commissionrsquos nine challenges for the next Assessment and what evidence is there to support this Your response can cover any number of the Commissionrsquos challenges
Question 4 What interactions exist between addressing the Commissionrsquos nine challenges for the next Assessment and the governmentrsquos target to halt biodiversity loss by 2030 and implement biodiversity net gain Your response can cover any number of the Commissionrsquos challenges
Question 5 What are the main opportunities in terms of governance policy regulation and market mechanisms that may help solve any of the Commissionrsquos nine challenges for the Next Assessment What are the main barriers Your response can cover any number of the Commissionrsquos challenges
Challenge 1 The digital transformation of infrastructure ndash the Commission will consider how the digital transformation of infrastructure could deliver higher quality lower cost infrastructure services
79
National Infrastructure Commission | The Second National Infrastructure Assessment Baseline Report
Question 6 In which of the Commissionrsquos sectors (outside of digital) can digital services and technologies enabled by fixed and wireless communications networks deliver the biggest benefits and how much would this cost
Question 7 What barriers exist that are preventing the widescale adoption and application of these new digital services and technologies to deliver better infrastructure services And how might they be addressed Your response can cover any number of the Commissionrsquos sectors outside digital (energy water flood resilience waste transport)
2 Reaching net zero
Challenge 2 Decarbonising electricity generation ndash the Commission will consider how a decarbonised secure and flexible electricity system can be achieved by 2035 at low cost
Question 8 What are the greatest risks to security of supply in a decarbonised power system that meets government ambition for 2035 and what solutions exist to mitigate these risks
Challenge 3 Heat transition and energy efficiency ndash the Commission will identify a viable pathway for heat decarbonisation and set out recommendations for policies and funding to deliver net zero heat to all homes and businesses
Question 9 What evidence do you have on the barriers to converting the existing gas grid to hydrogen installing heat pumps in different types of properties or rolling out low carbon heat networks What are the potential solutions to these barriers
Question 10 What evidence do you have of the barriers and potential solutions to deploying energy efficiency in the English building stock
Challenge 4 Networks for hydrogen and carbon capture and storage - the Commission will assess the hydrogen and carbon capture and storage required across the economy and the policy and funding frameworks needed to deliver it over the next 10-30 years
Question 11 What barriers exist to the long term growth of the hydrogen sector beyond 2030 and how can they be overcome Are any parts of the value chain (production storage transportation) more challenging than others and if so why
Question 12 What are the main barriers to delivering the carbon capture and storage networks required to support the transition to a net zero economy What are the solutions to overcoming these barriers
3 Climate resilience and the environment
Challenge 5 Asset management and resilience ndash the Commission will consider how asset management can support resilience barriers to investment and the use of data and technology to improve the way assets are maintained
Question 13 In what ways will current asset management practice need to improve to support better infrastructure resilience Your response can cover any number of the Commissionrsquos sectors
80
National Infrastructure Commission | The Second National Infrastructure Assessment Baseline Report
Challenge 6 Surface water management ndash the Commission will consider actions to maximise short-term opportunities and improve long term planning funding and governance arrangements for surface water management while protecting water from pollution from drainage
The Commission will carry out a separate call for evidence on this challenge as the Commission will deliver this as a separate study and report to government by November 2022 in advance of its other recommendations
Challenge 7 Waste and the circular economy ndash the Commission will examine the role of the waste sector in enabling the move towards a more circular economy
Question 14 What are the barriers to and solutions for expanding recycling capacity both now and in the future to deliver environmental and net zero targets
Question 15 What is the likely environmental impact of waste streams from construction across economic infrastructure sectors over the next 30 years and what are the appropriate measures for addressing it
4 Levelling up
Challenge 8 Urban mobility and congestion ndash the Commission will examine how the development of at scale mass transit systems can support productivity in cities and city regions and consider the role of congestion charging and other demand management measures
Question 16 What evidence is there of the effectiveness in reducing congestion of different approaches to demand management used in cities around the world including but not limited to congestion charging and what are the different approaches used to build public consensus for such measures
Challenge 9 Interurban transport across modes ndash the Commission will consider relative priorities and long term investment needs including the role of new technologies as part of a strategic multimodal transport plan
Question 17 What are the barriers to a decision making framework on interurban transport that reflects a balanced approach across different transport modes
81
National Infrastructure Commission | The Second National Infrastructure Assessment Baseline Report
The Commission would like to thank all the members of the secretariat (past and present) who contributed to or helped with this report and its analysis including
Sam Aggrey Ed Beard Katie Black Hannah Brown Anesu Bwawa Leo Camacho Joanna Campbell Jon Chappell Jen Coe Maisie Darby Christopher Durham Nick Francis Rose Galloway Green Alexandra Goodwin James Harris James Heath Verity Hillier Tom Hughes Andrew Jones Catherine Jones Charlotte Lamb Rob Mallows Kirin Mathias Greg McClymont Ryan McGowan Ben McNamee Genelva Meikle David Menzies Vasilis Papakonstantinou Jack Parker Jo Pearce James Richardson Neha Shah Dan Shotter Giles Stevens Monika Szczyrba Chris Wanzala-Ryan Simon Weaver Ben Wilson Olivia Winduss Karen Winn and Nathan Wyatt
In addition the Commission would like to thank its three expert advisory groups
Net zero Nigel Brandon Roz Bulleid Sam Fankhauser Rob Gross Neil Kenward Madeleine Kessler Cissie Liu Andrew Morlet Rain Newton-Smith Emma Pinchbeck Jill Rutter Judith Sykes Mike Thompson and Karen Turner
Climate resilience David Balmforth David Black Sharon Darcy Richard Dawson Suraje Dessai Caroline Douglass Alistair Ford Hannah Freeman Andrew Grant Jim Hall Juliet Mian Caroline Reeson and Jean Spencer
Levelling up Diane Coyle John Cridland Hanif Kara Sarah Longlands Philip McCann Henry Overman Chris Richards Jessica Rushworth Elliot Shaw Laura Shoaf Tony Venables Cecilia Wong and Ann Zhang
Acknowledgements
82
National Infrastructure Commission | The Second National Infrastructure Assessment Baseline Report
The Commission provides the government with impartial expert advice on major long-term infrastructure challenges Its remit covers economic infrastructure energy transport water and wastewater (drainage and sewerage) waste flood risk management and digital communications The Commission considers the potential interactions between its infrastructure recommendations and housing supply but housing itself is not in its remit The Commission also considers the interaction between infrastructure policy and the governmentrsquos legal target to halt biodiversity loss by 2030 Social infrastructure such as schools hospitals or prisons agriculture and land use are all also out of the Commissionrsquos scope
The Commissionrsquos objectives are to support sustainable economic growth across all regions of the UK improve competitiveness improve quality of life and to support climate resilience and the transition to net zero carbon emissions by 2050
The Commission delivers the following core pieces of work
z a National Infrastructure Assessment once in every Parliament setting out the Commissionrsquos assessment of long term infrastructure needs with recommendations to government
z specific studies on pressing infrastructure challenges as set by the government taking into account the views of the Commission and stakeholders including recommendations to government
z an Annual Monitoring Report taking stock of the governmentrsquos progress in areas where it has committed to taking forward recommendations of the Commission
The Commissionrsquos binding fiscal remit requires it to demonstrate that all its recommendations are consistent with and set out how they can be accommodated within gross public investment in economic infrastructure of between 11 and 13 per cent of GDP each year between 2025 and 2055 The Commissionrsquos reports must also include a transparent assessment of the impact on costs to businesses consumers government public bodies and other end users of infrastructure that would arise from implementing the recommendations
When making its recommendations the Commission is required to take into account both the role of the economic regulators in regulating infrastructure providers and the governmentrsquos legal obligations The Commissionrsquos remit letter also states that the Commission must ensure its recommendations do not reopen decision making processes where programmes and work have been decided by the government or will be decided in the immediate future
The Infrastructure and Projects Authority is responsible for ensuring the long term planning carried out by the Commission is translated into successful project delivery once the plans have been endorsed by government
The Commissionrsquos remit extends to economic infrastructure within the UK governmentrsquos competence Across much of the Commissionrsquos remit there is currently substantial devolution to Northern Ireland Scotland and Wales The Commissionrsquos role is to advise the UK government But the Commission works with both the UK government and the devolved administrations where responsibilities interact
The Commission
83
National Infrastructure Commission | The Second National Infrastructure Assessment Baseline Report
The Commissionrsquos remit extends to economic infrastructure within the UK governmentrsquos competence Across much of the Commissionrsquos remit there is currently substantial devolution to Northern Ireland Scotland and Wales The Commissionrsquos role is to advise the UK government But the Commission works with both the UK government and the devolved administrations where responsibilities interact
Table Devolved administration responsibilities by infrastructure sector
Sector Devolved administration responsibility
Northern Ireland Scotland Wales
Digital Reserved Reserved Reserved
Energy Devolved except nuclear
Reserved except energy efficiency
Reserved except energy efficiency
Flood risk Devolved Devolved Devolved
Transport Devolved except aviation and maritime
Largely devolved except aviation and maritime
Road transport largely devolved most rail aviation and maritime reserved
Waste Devolved Devolved Devolved
Water and wastewater
Devolved Devolved Devolved
The Commissionrsquos members
Sir John Armitt CBE (Chair) published an independent review on long term infrastructure planning in the UK in September 2013 which resulted in the National Infrastructure Commission Sir John is the Chair of National Express Group He also sits on the boards of the Berkeley Group and Expo 2020
Professor Sir Tim Besley CBE is School Professor of Economics and Political Science and W Arthur Lewis Professor of Development Economics at the LSE He served as an external member of the Bank of England Monetary Policy Committee from 2006 to 2009
Neale Coleman CBE is a co-founder of Blackstock Partnership He worked at the Greater London Authority from 2000-2015 leading the Mayorrsquos work on Londonrsquos Olympic bid the delivery of the games and their regeneration legacy Neale has also served as Policy Director for the Labour Party
Professor David Fisk CB is the Director of the Laing OrsquoRourke Centre for Systems Engineering and Innovation Research at Imperial College London He has served as Chief Scientist across several government departments including those for environment and transport and as a member of the Gas and Electricity Markets Authority
Andy Green CBE holds several Chair Non-Executive Director and advisory roles linked by his passion for how technology transforms business and our daily lives He chairs Lowell a major European credit management company and has served as Chair of the Digital Catapult an initiative to help grow the UKrsquos digital economy
84
National Infrastructure Commission | The Second National Infrastructure Assessment Baseline Report
Professor Sadie Morgan OBE is a founding director of the Stirling Prize winning architectural practice dRMM She is also Chair of the Independent Design Panel for High Speed Two and one of the Mayor of Londonrsquos Design Advocates She sits on the boards of the Major Projects Association and Homes England
Julia Prescot holds several board and advisory roles She is a co-founder and Chief Strategy Officer of Meridiam and sits on the Executive Committee of Meridiam SAS She has been involved in long term infrastructure development and investment in the UK Europe North America and Africa She is an Honorary Professor at the Bartlett School of Construction and Project Management University College London Since 2019 she has sat on the board of the Port of Tyne
Bridget Rosewell CBE is a director policy maker and economist She served as Chief Economic Adviser to the Greater London Authority from 2002 to 2012 and worked extensively on infrastructure business cases She has served as a Non-executive Director of Network Rail and Non-executive Chair of the Driver and Vehicle Standards Agency She is currently Chair of the Atom Bank and the M6 Toll Road In May 2021 she was appointed an Independent Non Executive Director at Northumbrian Water
85
National Infrastructure Commission | The Second National Infrastructure Assessment Baseline Report
Endnotes1 National Infrastructure Assessment (2018) National Infrastructure Assessment2 HM Treasury (2020) National Infrastructure Strategy 3 See for example National Infrastructure Commission (2020) Anticipate React Recover Resilient infrastructure
systems National Infrastructure Commission (2020) Net Zero Commission recommendations and the net zero target 4 National Infrastructure Commission (2019) Lessons Learnt Reviewing the process of the first National Infrastructure
Assessment5 National Infrastructure Commission (2020) Growth across regions6 National Infrastructure Commission (2020) Improving competitiveness7 Buser et al (2020) Literature review on the impacts of infrastructure on quality of life8 National Infrastructure Commission (2016) The impact of technological change on future infrastructure supply and
demand National Infrastructure Commission (2016) The impact of population change and demography on future infrastructure demand National Infrastructure Commission (2017) Economic growth and demand for infrastructure services National Infrastructure Commission (2017) The impact of the environment and climate change on future infrastructure supply and demand
9 National Infrastructure Commission (2016) The impact of technological change on future infrastructure supply and demand
10 National Infrastructure Commission (2021) Behaviour change and infrastructure beyond Covid-1911 HM Treasury (2020) National Infrastructure Strategy12 HM Treasury (2020) National Infrastructure Strategy13 Department for Business Energy amp Industrial Strategy (2021) Digest of UK energy statistics electricity table 5614 HM Government (2020) Government takes historic step towards net-zero with end of sale of new petrol and diesel
cars by 203015 Department for Environment Food amp Rural Affairs (2021) Flood and coastal erosion risk management an investment
plan for 2021 to 202716 HM Treasury (2020) Response to the National Infrastructure Assessment17 HM Treasury (2021) UK Infrastructure Bank18 HM Treasury (2020) National Infrastructure Strategy19 Ofcom (2020) Connected Nations 20 Ofgem (2017) What do energy networks do for you 21 Drinking Water Inspectorate (2021) Drinking Water 2020 CCW (2020) Water water everywhere Water amp wastewater
resilience report 201920 CCW (2020) Water Matters Highlights Report22 National Infrastructure Commission PWC (2021) NIA2 Social Research Final report 23 HM Government (2021) Net Zero Strategy Build Back Greener24 Department for Business Energy amp Industrial Strategy (2021) 2019 UK greenhouse gas emissions final figures ndash data
tables25 As of July 2021 there were around 24300 public charging points see Department for Transport and Office for Zero
Emission Vehicles (2021) Electric Vehicle Charging Device Statistics July 202126 It is estimated that between 280000 and 480000 public charging points would be needed to support 100 per cent
electric new car and van sales in 2030 see Competition amp Markets Authority (2021) Electric vehicle charging market study final report
27 Ofwat (2017) Targeted Review of Asset Health and Resilience in the Water Industry House of Commons Transport Committee (2019) Local roads funding and maintenance filling the gap
28 Environment Agency (2020) National Flood and Coastal Erosion Risk Management Strategy for England29 Environment Agency (2021) Flood and coastal erosion risk management report 1 April 2019 to 31 March 202030 Environment Agency data request (2019) Environment Agency (2021) Water and sewerage companies in England
environmental performance report for 202031 Environment Agency (2021) Water and sewerage companies in England environmental performance report for 202032 Department for Environment Food and Rural Affairs (2021) ENV23 ndash UK Statistics on Waste Department of Business
Energy amp Industrial Strategy (2021) Provisional UK greenhouse gas emissions national statistics 2020 Department for Environment Food and Rural Affairs (2021) ENV23 ndash UK Statistics on Waste
33 See Chapter 434 National Infrastructure Commission (2018) Transport connectivity dataset35 Office for National Statistics (2021) Family spending workbook 1 detailed expenditure and trends
86
National Infrastructure Commission | The Second National Infrastructure Assessment Baseline Report
36 The Intergovernmental Science-Policy Platform on Biodiversity and Ecosystem Services (2019) The global assessment report on biodiversity and ecosystem services summary for policymakers Partha Dasgupta (2021) The Economics of Biodiversity The Dasgupta Review
37 National Infrastructure Commission (2021) Behaviour change and infrastructure beyond Covid-1938 Department for Business Energy amp Industrial Strategy (2021) 2019 UK greenhouse gas emissions final figures ndash
data tables The emissions totals referenced in this report are inclusive of international aviation and shipping Unless otherwise stated emissions reported in this document are sourced from the 2019 UK greenhouse gas emissions final figures ndash data tables
39 HM Government (2021) UK enshrines new target in law to slash emissions by 78 by 203540 HM Government (2019) UK becomes first major economy to pass net zero emissions law41 HM Government (2021) Net Zero Strategy Build Back Greener42 This includes energy from waste emissions sourced from the National Atmospheric Emissions Inventory43 National Infrastructure Commission (2021) Engineered Greenhouse Gas Removals44 HM Government (2021) Net Zero Strategy Build Back Greener45 Climate Change Committee (2021) Independent Assessment of UK Climate Risk46 HM Treasury (2021) Net Zero Review Analysis exploring the key issues47 Climate Change Committee (2021) Independent Assessment of UK Climate Risk48 Jaroszweski D Wood R and Chapman L (2021) Infrastructure In The Third UK Climate ChangeRisk Assessment
Technical Report Prepared for the Climate Change Committee49 PWC (2021) NIA2 Social Research Final report 50 Department for Business Energy amp Industrial Strategy (2021) 2019 UK greenhouse gas emissions final figures ndash data
tables51 National Infrastructure Commission (2021)History Transport Dataset Railways Passenger Journeys52 Climate Change Committee (2020) Sixth Carbon Budget ndash Charts and data in the report53 National Infrastructure Commission (2018) National Infrastructure Assessment54 HM Treasury (2020) National Infrastructure Strategy55 Department for Transport and Office for Zero Emission Vehicles (2021) Electric Vehicle Charging Device Statistics July
202156 Competition amp Markets Authority (2021) Electric vehicle charging market study final report57 HM Treasury (2020) National Infrastructure Strategy page 9558 Ofgem (2021) Enabling the transition to electric vehicles The regulatorrsquos priorities for a green fair future59 National Infrastructure Commission (2019) Better Delivery The challenge for freight60 Department for Transport (2021) UK confirms pledge for zero-emission HGVs by 2040 and unveils new chargepoint
design61 Department for Transport (2021) Decarbonising Transport A Better Greener Britain62 Office of Road and Rail (2020) Rail Infrastructure and Assets 2019-2063 National Infrastructure Commission (2020) Rail Needs Assessment for the Midlands and the North64 National Infrastructure Commission (2019) Better Delivery The challenge for freight65 House of Commons Transport Committee (2021) Trains fit for the future Sixth Report of Session 2019-21 Office of
Road and Rail (2020) Rail Infrastructure and Assets 2019-2066 House of Commons Transport Committee (2021) Trains fit for the future Sixth Report of Session 2019-2167 Department for Business Energy amp Industrial Strategy (2021) 2019 UK greenhouse gas emissions final figures ndash data
tables68 Shell (2020) Decarbonising Shipping All Hands on Deck Department for Transport (2021) Jet Zero Consultation A
consultation on our strategy for net zero aviation69 Climate Change Committee (2020) Sixth Carbon Budget ndash Charts and data in the report70 Environment Agency (2021) CORSIA how to comply71 National Infrastructure Commission (2021) Engineered greenhouse gas removals72 Department for Business Energy amp Industrial Strategy (2021) 2019 UK greenhouse gas emissions final figures ndash data
tables This excludes energy from waste emissions which are included in the waste emissions reported in this chapter73 International Energy Agency (2021) Statement on recent developments in natural gas and electricity markets74 Department for Business Energy amp Industrial Strategy (2021) Digest of UK energy statistics electricity table 5675 National Infrastructure Commission (2018) National Infrastructure Assessment76 National Infrastructure Commission (2020) Renewables recovery and reaching net zero77 HM Government (2021) Net Zero Strategy Build Back Greener78 Department for Business Energy amp Industrial Strategy (2021) Digest of UK energy statistics electricity table 5679 HM Government (2020) Energy White Paper Powering our Net Zero Future
87
National Infrastructure Commission | The Second National Infrastructure Assessment Baseline Report
80 Department for Business Energy amp Industrial Strategy (2021) Smart Systems and Flexibility Plan Appendix II Monitoring Framework
81 Department for Business Energy amp Industrial Strategy (2021) Transitioning to a net zero energy system smart systems and flexibility plan 2021 Department for Business Energy amp Industrial Strategy (2021) Facilitating the deployment of large-scale and long duration electricity storage call for evidence
82 Climate Change Committee (2021) Progress in reducing emissions 2021 Report to Parliament p6083 Department for Business Energy amp Industrial Strategy (2021) 2019 UK greenhouse gas emissions final figures ndash data
tables84 Department for Business Energy amp Industrial Strategy (2020) Energy Consumption in the UK End use data tables
table U385 Climate Change Committee (2020) Sixth Carbon Budget ndash Charts and data in the report86 Department for Business Energy amp Industrial Strategy (2017) International Comparisons of Heating Cooling and Heat
Decarbonisation Policies Buildings Performance Institute Europe (2011) Europersquos Buildings Under the Microscope A country-by-country review of the energy performance of buildings Tado (2020) UK homes losing heat up to three times faster than European neighbours
87 National Infrastructure Commission (2018) National Infrastructure Assessment88 HM Treasury (2020) Response to the National Infrastructure Assessment89 Ministry of Housing Communities amp Local Government (2021) English Housing Survey Headline Report 2019-2090 Department for Business Energy amp Industrial Strategy (2021) Household Energy Efficiency Statistics headline
release (October 2021) Table 11 Climate Change Committee (2021) Progress in reducing emissions 2021 Report to Parliament Figure 34
91 Climate Change Committee (2021) Progress in reducing emissions 2021 Report to Parliament92 HM Government (2020) The Ten Point Plan for a Green Industrial Revolution93 Vivid Economics (2017) International Comparisons of Heating Cooling and Heat Decarbonisation Policies94 Vivid Economics (2017) Annex International Comparisons of Heating Cooling and Heat Decarbonisation Policies95 Vivid Economics (2017) International Comparisons of Heating Cooling and Heat Decarbonisation Policies96 Vivid Economics (2017) International Comparisons of Heating Cooling and Heat Decarbonisation Policies97 Vivid Economics (2017) International Comparisons of Heating Cooling and Heat Decarbonisation Policies98 IEA (2020) The Netherlands 2020 Energy Policy Review99 International Council on Clean Transportation (2021) Hydrogen for Heating Decarbonization Options for Households
in the Netherlands in 2050100 HM Government (2021) Heat and Buildings Strategy101 Scottish Government (2021) Heat in Buildings Strategy Welsh Government (2021) Net Zero Wales Carbon Budget 2
(2021-25)102 HM Government (2021) Heat and Buildings Strategy103 HM Government (2021) Heat and Buildings Strategy104 Energy from waste emissions are not separated out in the Final UK greenhouse gas emissions national statistics
Emissions for energy from waste plants sourced from the National Atmospheric Emissions Inventory 105 Climate Change Committee (2017) Meeting Carbon Budgets Closing the policy gap106 Department for Business Energy amp Industrial Strategy (2021) 2019 UK greenhouse gas emissions final figures ndash data
tables Department for Business Energy amp Industrial Strategy (2021) 2019 UK greenhouse gas emissions by Standard Industrial Classification
107 Water UK (2020) Net Zero 2030 Routemap108 National Infrastructure Commission (2018) National Infrastructure Assessment HM Government (2021) UK Hydrogen
Strategy Centre for Strategic and International Studies (2021) Hydrogen The Key to Decarbonizing the Global Shipping Industry Department for Transport (2021) Jet Zero Consultation A consultation on our strategy for net zero aviation National Infrastructure Commission (2019) Better Delivery the challenge for freight House of Commons Transport Committee (2021) Trains fit for the future Sixth Report of Session 2019-21
109 Energy Research Partnership (2016) Potential Role of Hydrogen in the UK Energy System110 HM Government (2021) UK Hydrogen Strategy111 National Infrastructure Commission (2021) Engineered greenhouse gas removals112 National Infrastructure Commission (2021) Engineered greenhouse gas removals113 HM Government (2021) Net Zero Strategy Build Back Greener114 Partha Dasgupta (2021) The Economics of Biodiversity The Dasgupta Review115 Partha Dasgupta (2021) The Economics of Biodiversity The Dasgupta Review116 Dieter Helm (2015) Natural Capital Valuing the Planet 117 Met Office (2021) UK Climate Projections Headline Findings
88
National Infrastructure Commission | The Second National Infrastructure Assessment Baseline Report
118 PwC (2021) NIA2 Social Research Final report119 National Infrastructure Commission (2020) Anticipate React Recover Resilient infrastructure systems120 UK Climate Risk (2021) The Third UK Climate Change Risk Assessment Technical Report Chapter 4 Infrastructure
National Infrastructure Commission (2018) Preparing for a drier future Englandrsquos water infrastructure needs Met Office (2021) UK Climate Projections Headline Findings
121 Met Office (2018) UKCP18 Land Projections Science Report122 UK Climate Risk (2021) The Third UK Climate Change Risk Assessment Technical Report Chapter 4 Infrastructure123 Environment Agency (2021) Living better with a changing climate Report to Ministers under the Climate Change Act124 HM Government (2021) Government response to the Climate Change Committee 2021 Report to Parliament ndash
Progress in adapting to climate change125 National Infrastructure Commission (2020) Anticipate React Recover Resilient infrastructure systems126 HM Government (2021) Government Response to the National Infrastructure Commission report lsquoAnticipate
React Recover Resilient Infrastructure Systemsrsquo HM Government (2021) Global Britain in a Competitive Age the Integrated Review of Security Defence Development and Foreign Policy
127 National Infrastructure Commission (2020) Adverse weather scenarios for renewable energy system testing128 International Organisation for Standardisation (2020) ISO 55000 Standards Asset Management 129 Department for Transport (2014) Transport Resilience Review130 Ofwat (2019) PR19 Model Water Database Data accounted for England only131 Ofwat (2017) Targeted Review of Asset Health and Resilience in the Water Industry House of Commons Transport
Committee (2019) Local roads funding and maintenance filling the gap132 National Infrastructure Commission (2017) Data for the public good133 HM Treasury (2015) Spending Review and Autumn Statement 2015 National Audit Office (2020) Managing flood risk134 Ofwat (2019) Technical appendix 2 Securing cost efficiency135 HR Wallingford (2020) Updated projections of future water availability for the third UK Climate Change Risk
Assessment Technical Report136 Environment Agency (2020) National Flood and Coastal Erosion Risk Management Strategy for England137 Environment Agency (2021) Flood and coastal erosion risk management report 1 April 2019 to 31 March 2020138 National Infrastructure Commission (2018) National Infrastructure Assessment139 Environment Agency (2020) Meeting our future water needs a national framework for water resources140 Ofwat (2019) PR19 final determinations Policy summary141 Ofwat (2019) PR19 final determinations Strategic regional water resource solutions appendix142 Portsmouth water (2021) Havant Thicket Reservoir 143 National Infrastructure Commission (2018) National Infrastructure Assessment144 National Audit Office (2020) Managing flood risk145 Environment Agency (2020) National Flood and Coastal Erosion Risk Management Strategy for England Ministry of
Housing Communities and Local Government (2021) National Planning Policy Framework146 London Fire Brigade (2021) Press release 147 Department for Environment Food amp Rural Affairs (2021) Surface water management A government update148 Environment Agency data request (2019) and Environment Agency (2021) Water and sewerage companies in England
environmental performance report for 2020 149 Environment Agency data request (2019) and Environment Agency (2021) Water and sewerage companies in England
environmental performance report for 2020 150 Ofwat (2020) Service delivery report 2019-20 UK Climate Risk (2021) The Third UK Climate Change Risk Assessment
Technical Report Chapter 4 Infrastructure151 HM Treasury (2021) Reducing the Risks of Surface Water Flooding Terms of Reference152 Intergovernmental Science-Policy Platform on Biodiversity and Ecosystem Services (2019) The global assessment
report on biodiversity and ecosystem services summary for policymakers Partha Dasgupta (2021) The Economics of Biodiversity The Dasgupta Review
153 National Infrastructure Commission (2021) Natural capital and environmental net gain A discussion paper154 National Infrastructure Commission (2021) Natural capital and environmental net gain A discussion paper155 HM Government (2018) 25 Year Environment Plan156 National Infrastructure Commission (2018) National Infrastructure Assessment157 National Infrastructure Commission (2018) National Infrastructure Assessment158 National Infrastructure Commission (2019) Better Delivery the challenge for freight 159 National Infrastructure Commission (2018) National Infrastructure Assessment160 National Infrastructure Commission (2018) National Infrastructure Assessment161 National Infrastructure Commission (2020) Design Principles for National Infrastructure
89
National Infrastructure Commission | The Second National Infrastructure Assessment Baseline Report
162 National Infrastructure Commission (2021) Natural capital and environmental net gain A discussion paper163 National Infrastructure Commission (2020) Design Principles for National Infrastructure164 National Infrastructure Commission (2020) Design Principles for National Infrastructure165 HM Government (2018) Our Waste Our Resources A Strategy for England 166 Department for Environment Food amp Rural Affairs Forestry Commission Environment Agency Natural England and The
Rt Hon George Eustice MP (2021) World-leading Environment Act becomes law167 Department for Environment Food amp Rural Affairs (2021) UK Statistics on Waste OECD (2021) Municipal Waste
Generation and Treatment168 Ellen Macarthur Foundation (2017) The circular economy in detail 169 PwC (2021) NIA2 Social Research Final report170 Department for Environment Food amp Rural Affairs Forestry Commission Environment Agency Natural England and The
Rt Hon George Eustice MP (2021) World-leading Environment Act becomes law171 Johnson (2021) The Prime Ministerrsquos Levelling Up speech172 Johnson (2021) The Prime Ministerrsquos Levelling Up speech Swinney (2021) So you want to level up Taylor et al (2021)
What does it take to ldquolevel uprdquo places173 Office for National Statistics (2021) Subregional productivity in the UK July 2021 Office for National Statistics (2020)
Well being index dashboard174 National Infrastructure Commission (2020) Growth across regions175 Office for National Statistics (2020) Earnings and hours worked place of residence by local authority ASHE Table 8176 International Monetary Fund (2018) IMF staff country reports ndash United Kingdom177 Commission calculations using OECD statistics see National Infrastructure Commission (2020) Rail Needs Assessment
for the Midlands and the North Interim report178 Office for National Statistics (2021) Subregional productivity in the UK July 2021 179 Commission calculations using ONS (2020) Subregional productivity labour productivity indices by local authority
district Nominal (smoothed) GVA (B) per hour worked in 2018 difference between most and least productive local authorities in the Greater Manchester Combined Authority area
180 Office for National Statistics (2019) Well being index dashboard May 2019 edition 181 National Infrastructure Commission (2020) Improving competitiveness182 PwC (2021) NIA2 Social Research Final report183 These factors have been covered in Industrial Strategy Council (2020) UK Regional Productivity Differences an
evidence review and Thisse Proost (2019) What can be learned from spatial economics and other literature on spatial economics
184 Puga (2009) The magnitude and causes of agglomeration economies185 Overman (2015) The Economic Performance of UK Cities Can Urban and Regional Policy Make a Difference to the
North-South divide186 Financial Times (2017) Left behind can anyone save the towns the economy forgot187 Overman (2013) The economic future of British cities Centre for Cities (2014) Delivering change Supporting links
between universities and high-growth firms in cities188 Institute for Fiscal Studies (2020) Catching up or falling behind Geographical inequalities in the UK and how they
have changed in recent years 189 National Infrastructure Commission (2021) Infrastructure Towns and Regeneration190 Department for Business Energy and Industrial Strategy (2020) Offshore wind sector deal191 National Infrastructure Commission (2021) Behaviour change and infrastructure beyond Covid-19192 Aysan and Aysan (2017) The Effect of Employment Status on Life Satisfaction in Europe193 Frey and Stutzer (2002) Happiness and Economics How the Economy and Institutions Affect Human Well-Being194 McCann (2019) Perceptions of regional inequality and the geography of discontent insights from the UK195 Office for National Statistics (2018) Personal well-being frequently asked questions196 Frey and Stutzer (2002) Happiness and Economics How the Economy and Institutions Affect Human Well-Being
Public Health England (2020) Improving access to greenspace A new review for 2020197 Office for National Statistics (2019) Well being index dashboard May 2019 edition 198 National Infrastructure Commission (2020) Rail Needs Assessment for the Midlands and the North Interim report
Box 21199 Creacutepon et al (2013) Do Labor Market Policies have Displacement Effects Evidence from a Clustered Randomized
Experiment The Quarterly Journal of Economics 128(2) Einiouml and Overman (2016) The (Displacement) Effects of Spatially Targeted Enterprise Initiatives Evidence from UK LEGI Spatial Economics Research Centre discussion paper 0191
200 Industrial Strategy Council (2021) What does it take to ldquolevel uprdquo places
90
National Infrastructure Commission | The Second National Infrastructure Assessment Baseline Report
201 National Infrastructure Commission (2021) Infrastructure Towns and Regeneration202 National Infrastructure Commission (2020) Growth across regions 203 Centre for Cities (2018) Talk of the Town The economic links between cities and towns204 National Infrastructure Commission (2021) Infrastructure Towns and Regeneration205 Office for National Statistics (2021) Personal and economic well-being in Great Britain May 2021 206 Buser et al (2021) Literature review on the impacts of infrastructure on quality of life 207 National Infrastructure Commission (2020) Growth across regions208 Industrial Strategy Council (2020) UK Regional Productivity Differences an evidence review209 National Infrastructure Commission (2018) National Infrastructure Assessment 210 National Infrastructure Commission (2021) Infrastructure Towns and Regeneration211 National Infrastructure Commission (2021) Infrastructure Towns and Regeneration212 National Infrastructure Commission (2021) Infrastructure Towns and Regeneration p9213 National Infrastructure Commission (2019) Transport connectivity dataset214 National Infrastructure Commission (2020) Improving competitiveness p7215 National Infrastructure Commission (2019) Better Delivery the challenge for freight 216 National Infrastructure Commission (2021) Behaviour change and infrastructure beyond Covid-19217 National Infrastructure Commission (2021) Annual Monitoring Report 2021218 National Infrastructure Commission (2021) Infrastructure Towns and Regeneration219 Department of Business Energy amp Industrial Strategy (2019) Sub-national estimates of properties not connected to the
gas network National Archives (1990) Environmental Protection Act 1990 Section 45220 Unicef (2021) Drinking water sanitation and hygiene by country 2000-2020 waste coverage stats221 National Infrastructure Commission (2019) Transport connectivity dataset222 National Infrastructure Commission (2019) Transport connectivity dataset223 National Infrastructure Commission (2019) Transport connectivity discussion paper224 National Infrastructure Commission (2018) Transport connectivity dataset225 OECD (2007) Managing Urban Congestion p10226 Marchetti (1994) Anthropological Invariants in Travel Behavior 227 National Infrastructure Commission (2020) Growth across regions228 Department for Transport (2021) Transport use during the coronavirus (COVID-19) pandemic Department for
Transport (2020) Government extends coronavirus support for buses and trams total funding tops pound700 million229 Department for Transport (2021) Road congestion and travel time 230 Department for Transport (2021) Transport use during the coronavirus (COVID-19) pandemic231 National Infrastructure Commission (2017) Congestion Capacity Carbon priorities for national infrastructure232 Ipsos MORI (2020) Road pricing timely or toxic233 National Infrastructure Commission (2021) Urban congestion deliberative engagements234 National Infrastructure Commission (2021) Cities programme235 National Infrastructure Commission (2021) Infrastructure Towns and Regeneration236 HM Treasury (2021) Autumn Budget and Spending Review 2021 p110237 Department for Transport (2020) Gear Change A bold vision for cycling Department for Transport (2021) Bus back
better 238 HM Treasury (2020) National Infrastructure Strategy239 National Infrastructure Commission (2018) National Infrastructure Assessment 240 Commission analysis and calculations based on MHCLG (2020) Capital Outturn Return (COR A1) 2019-20 HM Treasury
(2020) Analysis of central government grants by function provided to the Commission Transport for London (2020) Annual Report and Statement of Accounts 201920
241 National Infrastructure Commission (2021) PWC Towns social research study242 National Infrastructure Commission (2020)Rail Needs Assessment for the Midlands and the North p28243 National Infrastructure Commission (2020) Improving competitiveness p7 244 Thisse and Proost (2019) What can be learned from spatial economics245 Duranton and Venables (2018) Place-Based Policies for Development246 National Infrastructure Commission calculations based on Department for Transport (2020) Public expenditure on
transport by country and spending authority HM Treasury (2020) Spending Review 2020 p 76 HM Treasury (2021) GDP deflators at market prices and money GDP September 2021 (Quarterly National Accounts)
247 Department for Transport (2021) Department for Transport organisation chart248 National Infrastructure Commission (2021) Infrastructure Towns and Regeneration249 National Infrastructure Commission (2021) Infrastructure Towns and Regeneration p28250 National Infrastructure Commission (2021) Behaviour change and infrastructure beyond Covid-19
91
National Infrastructure Commission | The Second National Infrastructure Assessment Baseline Report
251 National Infrastructure Commission (2018) National Infrastructure Assessment252 HM Treasury (2020) National Infrastructure Strategy253 Ofcom (2021) Connected Nations Update Summer 2021 254 Department for Culture Media and Sport (2021) Project Gigabit Phase One Delivery Plan255 Ofcom (2021) Connected Nations Update Summer 2021 p10256 Department for Digital Culture Media amp Sport (2020) Shared Rural Network257 National Infrastructure Commission (2021) Infrastructure Towns and Regeneration p15258 National Infrastructure Commission (2021) Infrastructure Towns and Regeneration259 World Bank (2020) Access to electricity ( of population) - United Kingdom 260 Department of Business Energy amp Industrial Strategy (2019) Sub-national estimates of properties not connected to the
gas network 261 National Infrastructure Commission (2021) Infrastructure Towns and Regeneration262 Centre for Sustainable Energy (2015) Mapping energy efficiency data at the parliamentary constituency level263 National Infrastructure Commission (2021) Infrastructure Towns and Regeneration264 National Infrastructure Commission (2021) NIA2 expert advisory panels 265 National Infrastructure Commission (2020) Design Principles for National Infrastructure 266 National Infrastructure Commission (2020) Young Professionals Panel 267 National Infrastructure Commission (2021) Behaviour change and infrastructure beyond Covid-19
Finlaison House 15-17 Furnival Street London EC4A 1AB
nicorguk
NatInfraCom November 2021
- Foreword
- In brief
- Executive summary
-
- The second National Infrastructure Assessment
- The National Infrastructure Baseline Report
- Reaching net zero
- Climate resilience and the environment
- Supporting levelling up
- Next steps
-
- 1 Introduction
-
- 11 The National Infrastructure Baseline Report
- 12 Work informing the second Assessment
- 13 Assessment of the infrastructure sectors
- 14 Digital technologies present opportunities for all sectors
-
- 2 Reaching net zero
-
- 21 Infrastructure and net zero
- 22 Transport
- 23 Energy
- 24 Waste
- 25 Wastewater
- 26 New infrastructure networks to support net zero
- 27 Challenges for the second Assessment
-
- 3 Climate resilience and the environment
-
- 31 Infrastructure resilience
- 32 Infrastructure and natural capital
- 33 Challenges for the second Assessment
-
- 4 Supporting levelling up
-
- 41 Infrastructure and levelling up
- 42 Transport and levelling up
- 43 Digital
- 44 Energy
- 45 Challenges for the second Assessment
-
- 5 Next steps
-
- 51 The route to the second Assessment
- 52 Developing recommendations
- 53 How to respond to the Call for Evidence
- 54 Summary of Call for Evidence questions
-
- The Commission
- Endnotes
-

2
National Infrastructure Commission | The Second National Infrastructure Assessment Baseline Report
Foreword 3
In brief 4
Executive summary 6
1 Introduction 19
2 Reaching net zero 30
3 Climate resilience and the environment 44
4 Supporting levelling up 56
5 Next steps 74
Acknowledgements 80
The Commission 82
Endnotes 85
Contents
3
National Infrastructure Commission | The Second National Infrastructure Assessment Baseline Report
To build a long term vision for the infrastructure of the future we need to understand where we are today
This Baseline Report surveys the state of our national systems of digital energy flood resilience water and wastewater waste and transport
It enables the Commission to identify the biggest questions about the UKrsquos readiness for the challenges and opportunities of the future and to review developments since we published the first ever National Infrastructure Assessment in 2018
We acknowledge areas of tangible improvement in recent years contributing to generally good levels of public satisfaction with national infrastructure services We highlight the progress of the rollout of gigabit-capable broadband major steps in electricity decarbonisation and the establishment of the UK Infrastructure Bank as examples
But major challenges remain Carbon emissions from economic infrastructure must reduce further and fast We are not investing sufficiently in maintenance of key assets to ensure their resilience in future particularly in the face of climate change Extreme weather also heightens the risk of flooding with surface water flooding a key risk to many properties And our transport systems in many places are not good enough
Inevitably itrsquos a mixed picture but that shouldnrsquot cloud the need for decisive action and the adoption of long term plans supported by adequate funding
This is categorically not the time for complacency To underline this we have decided that the second Assessment will focus on the three strategic themes of reaching net zero climate resilience and the environment and supporting levelling up
Each pose urgent and wide ranging questions Each draw broad political and public support for their end goal Each however offer few quick wins or cheap fixes
So under the umbrella of the themes we propose to tackle nine key challenges over the next two years developing recommendations for the second Assessment due in the second half of 2023 These challenges range from how we can accelerate work to decarbonise home heating to how we can improve urban mobility and reduce congestion
We will now embark on this work ndash informed by input and insight from industry political leaders representative bodies other organisations across the country and the public ndash and formulate policy recommendations to put forward to government
We hope this report prompts discussion but also encourages optimism a confidence that working in a collaborative spirit the private and public sectors can develop infrastructure solutions to meet the challenges of the second half of this century ndash so that every part of the UK can share in the rewards of a safer cleaner better connected society
Sir John Armitt Chair
Foreword
4
National Infrastructure Commission | The Second National Infrastructure Assessment Baseline Report
This Baseline Report sets out the current state of the UKrsquos economic infrastructure and identifies key challenges for the coming decades The Commission will make recommendations to address these challenges in the second National Infrastructure Assessment to be published in the second half of 2023
Since the first Assessment there has been progress on some issues
These include full fibre rollout electricity decarbonisation drought resilience infrastructure financing ndash through the creation of the UK Infrastructure Bank ndash and design
However in other areas there is more to be done
z greenhouse gas emissions from economic infrastructure must reduce further fast
z asset maintenance issues undermine performance in some sectors
z more than three million properties in England are at risk from surface water flooding
z serious pollution incidents from water and sewerage are unacceptably high
z urban transport connectivity varies and is poor in many places
Future trends and government commitments will bring new challenges
z climate change will make it harder to make and keep infrastructure resilience
z nature is declining at unprecedented rates
z the Covid-19 pandemic may lead to long term changes in where people live and work
z new and emerging technologies will offer opportunities across sectors
Delivering on these challenges will require bold action stable plans and long term funding
The Commission has identified nine key challenges for the second Assessment
z all sectors will need to take the opportunities of new digital technologies
z the electricity system must decarbonise fast to meet the sixth Carbon Budget
z decarbonising heat will require major changes to the way people heat their homes
z new networks will be needed for hydrogen and carbon capture and storage
In brief
5
National Infrastructure Commission | The Second National Infrastructure Assessment Baseline Report
z good asset management will be crucial as the effects of climate change increase
z action is needed to improve surface water management as flood risk increases
z the waste sector must support the move to a circular economy
z improved urban mobility and reduced congestion can boost urban productivity
z a multimodal interurban transport strategy can support regional growth
The Commission welcomes views on these key challenges and encourages readers to respond to the Call for Evidence questions set out in this document The Commission will also hold events during the call for evidence period and in the run up to the second Assessment
6
National Infrastructure Commission | The Second National Infrastructure Assessment Baseline Report
Long term infrastructure policy can help address major future challenges such as reaching net zero adapting to climate change reducing environmental impacts and levelling up across regions The Commission will make recommendations to address these challenges in the second National Infrastructure Assessment to be published in the second half of 2023 This document assesses the state of economic infrastructure today and identifies the future priorities for the second Assessment
The Commission has identified three strategic themes for the second Assessment
z Reaching net zero All sectors have more to do to reach net zero particularly transport where road and rail vehicles all need to become zero emission energy where government has committed to decarbonise electricity generation by 2035 and decarbonising heat which will require major changes to the way people heat their homes
z Climate resilience and the environment While economic infrastructure has generally proved resilient to shocks and stresses over recent years climate change will only increase pressures across all sectors and infrastructure sectors have significant impacts ndash both positive and negative ndash on the environment
z Supporting levelling up There is significant variation in the quality of transport provision across England which can affect economic outcomes and peoplersquos quality of life Improving transport provision is therefore key to the governmentrsquos levelling up agenda
All sectors must also take the opportunities offered by new digital technologies
All of this will require significant levels of investment which will ultimately be funded by consumers (via bills) or taxpayers The Commission will carry out cross cutting analysis on all its recommendations for the second Assessment including considering the overall affordability of required investment the distribution of costs and savings across groups in society and who should pay
This document is the start of a conversation with the public and stakeholders about the countryrsquos infrastructure needs and how to meet them which will inform the development of the second Assessment The Commission welcomes responses to the Call for Evidence questions set out in the document and it will also hold a programme of events to gain new insights and evidence
The second National Infrastructure AssessmentThe Commission carries out a National Infrastructure Assessment once every five years These set out the Commissionrsquos assessment of long term needs in the transport energy water and wastewater flood resilience digital and waste sectors and recommendations to meet them including the right policy
Executive summary
7
National Infrastructure Commission | The Second National Infrastructure Assessment Baseline Report
regulatory and funding mechanisms The Assessments are guided by the Commissionrsquos objectives to support sustainable growth across all regions of the UK improve competitiveness and quality of life and the Commissionrsquos new objective to support climate resilience and the transition to net zero carbon emissions by 2050 The Assessments take a long term view looking ahead over the next 10-30 years
The Commission will publish the second Assessment in the second half of 2023 The second Assessment will build on the first Assessment and the Commissionrsquos wider body of work much of which is still relevant It will focus on key challenges not covered in the first Assessment areas where the Commissionrsquos recommendations need to be updated or where the Commission needs to address new issues
The Baseline Report
Progress has been made in some areas since the first Assessment
The first Assessment was published in July 2018 Since then it has shaped infrastructure policy across sectors The governmentrsquos National Infrastructure Strategy a formal response to the Assessment aligned closely with the Commissionrsquos recommendations and there has been significant progress on many of the recommendations including
z access to gigabit capable broadband the government has set out a clear vision to deliver gigabit capable broadband to at least 85 per cent of UK premises by 2025 ndash in late 2021 this was well underway reaching over 50 per cent of premises
z a shift to renewable electricity there has been a shift towards a highly renewable electricity system with almost 40 per cent of electricity generated by renewable sources in 2019
z electric vehicles government has banned the sale of new petrol and diesel cars and vans in the UK from 2030 following the Commissionrsquos recommendation that charging infrastructure should be delivered to enable this shift
z flooding the government will invest pound56 billion over the next six years to reduce the risk of flooding following Commission recommendations
z drought resilience government and the water industry in England have taken on the Commissionrsquos recommendations to increase water supply and reduce leakage
z the UK Infrastructure Bank the independent infrastructure financing institution the Commission recommended be established following the UKrsquos loss of access to the European Investment Bank was launched in June 2021
z design principles the government endorsed the Commissionrsquos design principles and recommendation for board level design champions on major infrastructure projects
Infrastructure has continued to perform well in some areas
The Commissionrsquos performance assessment has identified several areas where infrastructure is performing well including
z access to mobile connectivity 92 per cent of the UK landmass is covered by at least one mobile operator with a funded plan to increase this to 95 per cent by 2026
8
National Infrastructure Commission | The Second National Infrastructure Assessment Baseline Report
z reliable energy supply the energy sector delivers electricity and gas of reliable quality to consumers ndash loss of supply is rare and interruptions to supply are reducing over time
z access to clean water the water sector delivers water of reliable quality to homes and businesses across England with low numbers of service interruptions and customers are generally satisfied with the water and wastewater services provided
Social research
In June 2021 the Commission carried out social research with a range of respondents from across the UK nationally representative by age gender region and ethnicity
The research showed relatively high levels of confidence from respondents from across the UK that infrastructure will meet peoplersquos needs over the next 30 years with confidence increasing since the first Assessment Only two sectors ndash flood resilience and waste ndash had lower than 70 per cent confidence with the digital sector performing particularly strongly This social research will shape the Commissionrsquos approach to the second Assessment
Figure 01 Public confidence in infrastructure has improved since the first Assessment
Percentage of respondents who were confident that the sector would meet their needs in the next 30 years in 2021 vs in 2017 (ahead of the first Assessment)
Source PwC (2021) NIA2 Social Research Final report
The research also showed that the public increasingly believe that infrastructure should lead the fight against climate change and a plan for infrastructure should consider the impact of infrastructure on the environment
0 10 20 30 40 50 60 70 80 90 100
Flood management
Solid waste
Transport
Water andwastewater
Energy
Digital
Percentage
Sect
or
2017 2021
9
National Infrastructure Commission | The Second National Infrastructure Assessment Baseline Report
However in other infrastructure areas there is a lot more to be done
Nevertheless there remain major significant challenges across sectors particularly to reduce emissions Key areas where infrastructure needs to improve performance
z emissions from electricity and heat are still too high as the electricity sector will need to reduce emissions to near zero by 2035 and little progress has been made so far on heat decarbonisation although the technologies to do so already exist
z emissions from transport have not been declining despite improvements in engine efficiency and although electric vehicle charge point numbers are increasing the pace needs to pick up to enable a transition to electric vehicles in the 2020s and 2030s
z asset maintenance issues undermine performance in some sectors including ageing and leaky water pipes and potholes in local roads
z more than five million properties are currently at risk of flooding in England including more than three million at risk of surface water flooding
z serious pollution incidents from water and sewerage have plateaued at an unacceptably high level and 32 per cent of water bodies in England do not have good ecological status due to continuous discharges from sewage and seven per cent due to stormwater overflows
z recycling rates have plateaued and emissions from waste have begun to rise again while the total waste generated in England is also increasing
z urban transport connectivity is poor in many places and the largest urban areas tend to have the worst connectivity as congestion slows down journeys
z there are wide variations in interurban connectivity between similar places but with no clear regional patterns or trends
Progress is already being made in some of these areas including reducing emissions from electricity enabling the transition to electric vehicles and reducing the risks of flooding However there is still further to go More detail on the performance of each sector is set out in annexes A-F
The overall cost to households of infrastructure services has remained relatively stable over the last ten years At the same time there have been significant increases in investment in many areas Average energy bills rose from the mid-2000s until the mid-2010s and then gradually declined
However gas prices have risen significantly in recent months pushing up the price of both gas and electricity as gas remains a significant input into electricity generation Domestic consumers have been shielded from some of this volatility due to the regulated cap on energy prices introduced from 2017 But prices have risen and are expected to rise further Businesses have also been affected especially those that are energy intensive This inevitably creates serious problems for some households and firms
Current high prices appear to be mostly due to temporary factors including the effects of the Covid-19 pandemic Prices may fall again but volatility in prices is inherent in a system dependent on fossil fuels As set out below this price volatility reinforces the strategic need to transition to a low carbon energy system as soon as practicable
10
National Infrastructure Commission | The Second National Infrastructure Assessment Baseline Report
Infrastructure also faces new challenges
As well as improving current performance infrastructure must be prepared for future challenges including from a changing climate and behaviour change following the Covid-19 pandemic And it should also take the opportunities offered by new digital technologies
Infrastructure sectors are beginning to tackle the challenge of reaching net zero reducing the impact of infrastructure on the climate But the climate will also have impacts on infrastructure Sectors must prepare for the risks of a changing climate including increased incidence of flooding and drought
And alongside climate change there is another environmental crisis that must be addressed Global assessments show that nature is declining at rates unprecedented in human history with accelerating rates of species extinction and severe disruption to ecosystem services Infrastructure contributes to this decline but can also help prevent it
Finally the Covid-19 pandemic may lead to long term changes in where people live and work This in turn could lead to new patterns of infrastructure demand especially in the transport sector where there may be a change in the established levels of demand for different modes Car use has already returned to levels seen before the Covid-19 pandemic but in the longer term the way people use roads and public transport could be very different
Key challenges for the second Assessment
Bold action and stable plans will be needed to address the existing issues and prepare for the coming challenges The Commission has identified the key areas that it will develop recommendations on in the second Assessment The Commission has focussed on those that have a good fit with the Commissionrsquos remit are strategically important and are an issue where the Commission can add value considering the current policy landscape and the Commissionrsquos existing work The key challenges are set out thematically in figure 02 and in Chapters 1-3
Digital technologies present opportunities for all sectors
Higher quality digital infrastructure will present opportunities across the economy including the opportunity to make improvements in all other infrastructure sectors The adoption of digital technologies has the potential to cut costs enhance service quality improve resilience and enable better demand management across a range of infrastructure services Sensors can be deployed across infrastructure assets to monitor their condition allowing for more timely and efficient maintenance interventions Real time data on road use could facilitate better traffic management and alleviate congestion However the adoption of digital technologies in infrastructure is patchy
Challenge 1 The digital transformation of infrastructure ndash the Commission will consider how the digital transformation of infrastructure could deliver higher quality lower cost infrastructure services
11
National Infrastructure Commission | The Second National Infrastructure Assessment Baseline Report
Figure 02 Key challenges for the second assessment
Link to other theme
Challenge
Waste and the circular
economy
Decarbonising electricitygeneration
Heat transition and energy efficiency
Networks for hydrogen
and CCS
Surface water
management
Interurbantransport
across modesUrban
mobility and congestion
Digital transformation
Asset managementand resilience
C L I M AT E R E S I L I E NC
E A
ND
TH
E E
NV
I RO
NM
EN
TR
EA
CH
I NG
NE
T Z
E R O
S U P P O R T I N G L E V E L L I N G U P
12
National Infrastructure Commission | The Second National Infrastructure Assessment Baseline Report
Reaching net zeroTo meet its legally binding climate targets the UK must reduce its overall greenhouse gas emissions by 78 per cent compared to 1990 levels by 2035 and to net zero by 2050 In October 2021 the government published its Net Zero Strategy setting out how it will deliver against its commitment to reach net zero emissions by 2050
Economic infrastructure sectors generate a major part of the UKrsquos current emissions ndash in 2019 direct emissions from the energy transport and waste and wastewater sectors accounted for over 66 per cent of all UK greenhouse gas emissions Reducing emissions is important to the public the Commissionrsquos social research carried out in June 2021 found that people cited fighting climate change by reducing greenhouse gases as the top priority for the UKrsquos infrastructure in 30 yearsrsquo time
Figure 03 Energy transport and waste account for a large proportion of total UK emissions
Total UK greenhouse gas emissions split by infrastructure sector 1990 and 2019
Source Department for Business Energy amp Industrial Strategy (2020) Final Greenhouse Gas Emissions National Statistics 2019
Reaching net zero will require high levels of investment both to decarbonise existing infrastructure networks and to build new ones for example for carbon capture and storage and hydrogen This investment will ultimately need to be funded by either consumers (via bills) or taxpayers The Commission will consider funding challenges in the second Assessment including the overall affordability of required investment the distribution of costs and savings across groups in society and who should pay
Decarbonising electricity generation
Electricity has made significant progress towards net zero decarbonising faster than any other sector In 2019 total emissions from electricity were around 60 MtCO
2e a reduction of 74 per cent since 1990 But
the electricity system must now move away from fossil fuels ndash government has committed to electricity
0
100
200
300
400
500
600
700
800
900
1990 2019
MtC
O2e
Year
Energy (incl electricity and heat) Transport (incl international aviation and shipping)
Waste (incl energy from waste) Wastewater handling
Non-infrastructure
13
National Infrastructure Commission | The Second National Infrastructure Assessment Baseline Report
generation reaching nearly zero emissions by 2035 subject to being able to maintain security of supply Over the same time the electricity system will need to adapt to deliver on major increases in demand as other sectors decarbonise
A net zero electricity system must also be secure and low cost As the current energy price shock has shown the volatility inherent in gas and oil prices ndash as internationally traded commodities ndash can have serious impacts on households and businesses A low carbon electricity system based more on long-lasting capital assets like wind farms and nuclear power plants should reduce exposure to this kind of shock
Challenge 2 Decarbonising electricity generation ndash the Commission will consider how a decarbonised secure and flexible electricity system can be achieved by 2035 at low cost
Decarbonising heat and improving energy efficiency
Decarbonising heat is complex and progress has been slow Total emissions from buildings in 2019 were around 90 MtCO
2e only a 17 per cent fall on 1990 levels Most of these emissions arise from burning
fossil fuels for heating Providing zero carbon heat will likely require transitioning to a mix of electric heating and heat from hydrogen alongside improving the energy efficiency of buildings with insulation to reduce the demand for energy for heat The heat transition has so far proved difficult to implement as it directly affects individuals and causes significant disruption in homes buildings and at street level
The government has recently published its strategy for decarbonising heat via a gradual transition It contains new funding commitments to support installation of low carbon heating systems in homes with the goal that no new gas boilers will be sold by 2035 However there are still major questions to be answered including what level of insulation will be needed to efficiently operate heat pumps whether hydrogen for heating will be available as a source of heat for all homes what this means for the continuing use of the gas network and how to deliver these major changes in peoplersquos homes
Challenge 3 Heat transition and energy efficiency ndash the Commission will identify a viable pathway for heat decarbonisation and set out recommendations for policies and funding to deliver net zero heat to all homes and businesses
New networks to decarbonise hard to abate sectors
As well as transforming the existing infrastructure for electricity and heat the UK needs new infrastructure networks to decarbonise including
z hydrogen networks to help decarbonise hard to electrify sectors such as heavy industry shipping aviation heavy goods vehicles parts of the rail network and heat
z carbon capture and storage networks which will be needed to decarbonise parts of industry hydrogen production electricity generation (from sources such as waste incineration or biomass) and to enable engineered greenhouse gas removals
Challenge 4 Networks for hydrogen and carbon capture and storage - the Commission will assess the hydrogen and carbon capture and storage required across the economy and the policy and funding frameworks needed to deliver it over the next 10-30 years
14
National Infrastructure Commission | The Second National Infrastructure Assessment Baseline Report
Climate resilience and the environmentEconomic infrastructure has generally proved resilient to shocks and stresses over recent years although good asset management will be important in future Climate change will increase a variety of risks that affect economic infrastructure in the coming decades with floods and drought a key risk
Alongside climate change there is another environmental crisis Global assessments show that nature is declining at rates unprecedented in human history with accelerating rates of species extinction and severe disruption to ecosystem services Infrastructure contributes to this decline in natural capital and biodiversity but can also help prevent it The Commission supports an lsquoenvironmental net gainrsquo approach for all infrastructure projects (which includes but is wider than biodiversity net gain) ensuring that developers leave the environment in a measurably better state than they found it
There are challenges in some sectors that affect the governmentrsquos objectives from the 25 Year Environment Plan including minimising waste and ensuring clean air and clean and plentiful water The challenges under lsquoreaching net zerorsquo will help to address the clean air objective while the Commissionrsquos previous recommendations supported the objective on clean and plentiful water However the net zero target means that the Commission will need to revisit its work on waste in the second Assessment including considering how to further increase recycling The government has also committed to move to a more circular economy which could have wider implications for the sector
Resilience must be embedded in asset management approaches
Good asset management requires managing infrastructure assets so that they can deliver services in a cost effective and timely way This will be crucial to maintain resilience and performance as existing pressures increase or new ones emerge There is already concern about the condition of assets in some sectors ndash the UK is still reliant on infrastructure built during the nineteenth century including roads railways tunnels water pipes and sewers Some older components can be at greater risk of failure as they were not constructed to be resilient to extreme weather There is also a lack of data on asset condition and in some cases deterioration is not noticed until a failure occurs Furthermore decision making frameworks can undervalue maintenance and disincentivise good asset management
Challenge 5 Asset management and resilience ndash the Commission will consider how asset management can support resilience barriers to investment and the use of data and technology to improve the way assets are maintained
Surface water management is a key resilience challenge
Droughts and floods will be a key risk for infrastructure as the climate changes Government and industry are making progress on drought resilience and coastal and river flooding following the Commissionrsquos recommendations in the first Assessment However surface water flooding which the Commission has not yet considered in detail presents a risk to more than 3 million properties
Multiple organisations are currently responsible for assets that affect surface water flooding including local authorities drainage boards highways authorities and water companies Relatedly reducing sewer overflows and the pollution they cause will be a key challenge for the water and wastewater sector in the future The government is making improvements in this area but the scale of the challenge may require a more fundamental review of current arrangements In the second Assessment the
15
National Infrastructure Commission | The Second National Infrastructure Assessment Baseline Report
Commission will carry out a dedicated study as requested by government on effective approaches for managing surface water in England This will consider issues of planning funding and governance arrangements as well as the role of data and nature based solutions
Challenge 6 Surface water management ndash the Commission will consider actions to maximise short term opportunities and improve long term planning funding and governance arrangements for surface water management while protecting water from pollution from drainage
The Commission will deliver this as a separate study and report to government by November 2022 in advance of its other recommendations
The waste sector can support the move to a circular economy
Waste infrastructure helps to protect the environment by enabling the safe collection processing and disposal of municipal and industrial waste preventing harmful waste products from entering the natural environment The government has framed its waste objectives as part of the move to a more circular economy ndash one where products and materials are kept in productive use for longer and the environmental impacts from extracting raw materials are reduced In the second Assessment the Commission will consider additional changes needed in the waste sector to enable the move to a more circular economy and to reduce the environmental impacts of waste This will include looking at ways to increase recycling rates for municipal and construction waste and deliver the infrastructure needed to achieve net zero It will also look at waste processing capacity and interdependencies with other economic infrastructure sectors including energy and water and construction waste
Challenge 7 Waste and the circular economy ndash the Commission will examine the role of the waste sector in enabling the move towards a more circular economy
Supporting levelling upThe government has set itself the ambition of lsquolevelling uprsquo outcomes across the UK reducing disparities between different towns cities and regions These variations are caused by multiple interacting factors Addressing these disparities is hard Infrastructure can help address them but it cannot do so singlehandedly
Productivity potential varies as different parts of the country play different roles in the economy and different places have different economic densities ndash for example it is not realistic to have the same productivity in rural Cumbria as in central Manchester While no two places are exactly the same the Commission will look at broadly comparable places to assess economic potential
While most infrastructure sectors can have some impact on outcomes improvements in the transport sector can improve quality of life and help address constraints to growth and with the right conditions contribute to economic transformation in particular places ndash for example major rail stations and other nationally significant infrastructure projects can offer significant potential for urban regeneration and these opportunities should be maximised
The Commission has made recommendations in the past to support levelling up covering
z Devolved powers and funding for cities and towns to develop locally led infrastructure strategies Infrastructure strategies need to be developed and determined locally by people who understand the needs and strengths of the area
16
National Infrastructure Commission | The Second National Infrastructure Assessment Baseline Report
z The need for infrastructure strategies to form part of wider economic strategies While infrastructure can improve productivity and make places more liveable it is not the whole solution ndash factors like skills and education also have an important role to play and therefore need to be aligned to infrastructure investment
z The need for local capacity to deliver these strategies Government should make expert support and advice available to help those local authorities where capacity is an obstacle to developing and delivering their infrastructure strategies
In the second Assessment the Commission will take account of where places are not achieving their economic potential to identify where interventions are likely to deliver significant benefits ndash for example identifying where growth could be unlocked by increasing capacity in congested city centres ndash and consider how these interventions can improve both productivity and quality of life in the places concerned
In the energy sector the Commission will consider opportunities for major investments in new low carbon infrastructure to support levelling up by boosting growth in lower productivity places ndash the development of offshore wind energy has already created new opportunities for coastal towns close to large wind farms such as Grimsby The Commission will also analyse how each of its recommendations reduce regional differences and support improvements in national productivity
Improved connectivity and reduced congestion can boost urban productivity
Before the Covid-19 pandemic many major cities suffered from congestion and poor public transport connectivity preventing goods services and people from travelling in an efficient and sustainable way Overcrowded or slow transport networks limited the ability of businesses and workers to locate in dense city centres which has been a major barrier to urban productivity and growth
The Covid-19 pandemic may lead to new travel patterns changing the established levels of demand for different modes Car use has already returned to levels seen before the Covid-19 pandemic but in the longer term the way people use roads and public transport could be very different Urban transport strategies need to be robust to different future scenarios
The busiest cities with the most growth potential may need very large scale transport capacity projects or network extensions allowing people in nearby towns to work some days in a central location Demand management policies such as congestion charging may also be needed to maximise the benefits of transport for agglomeration and productivity
Challenge 8 Urban mobility and congestion ndash the Commission will examine how the development of at scale mass transit systems can support productivity in cities and city regions and consider the role of congestion charging and other demand management measures
A multi-modal transport strategy can support regional growth
Investment in interurban road and rail can support regional growth Transport connectivity varies significantly between places but there is not an obvious north-south or rural-urban divide in performance Furthermore technological innovation decarbonisation and behaviour change all mean that patterns of transport demand and ways to meet that demand may be very different in future
17
National Infrastructure Commission | The Second National Infrastructure Assessment Baseline Report
It is difficult to determine the optimal balance of investment between different places and modes A multi modal transport strategy could help the country plan more effectively for sustainable growth quality of life outcomes and the shift to net zero optimising the use of different accessible modes
Challenge 9 Interurban transport across modes ndash the Commission will consider relative priorities and long term investment needs including the role of new technologies as part of a strategic multimodal transport plan
Next stepsThe Commission welcomes views on the themes and challenges it has identified for the second Assessment Interested parties are encouraged to respond to the Call for Evidence questions set out in this document The Commission will also hold a programme of events during the call for evidence period and in the run up to the second Assessment to explore policy questions in detail with regional and sectoral stakeholders
The Commission will also research the views and preferences of the public to shape its recommendations The Assessment will be supported by expert panels of industry specialists academics and regulators who will assess and challenge the Commissionrsquos emerging thinking and by its Design Group and Young Professionals Panel
The Commission will take a range of approaches to manage uncertainty including that created by the Covid-19 pandemic by making recommendations which balance the risks of major investment making complementary recommendations and planning for future decisions The Commission will use a range of scenarios to be published in spring 2022
Cross-cutting analysis
The Commission will carry out cross-cutting analysis to inform the policy options and assess the impact of recommendations in the Assessment across six categories
z bills impact the second Assessment will show the total costs of recommendations that will be raised through bills including assessing the impact of the Commissionrsquos recommendations on household bills overall in line with its economic remit
z public spending impact the Commission will set out the impact of its recommendations on gross public investment in economic infrastructure in line with its fiscal remit
z distributional impacts assessing whether recommendations will have disproportionate impacts on specific groups of people
z climate change impact assessing the impacts of economic infrastructure and the Commissionrsquos recommendations on greenhouse gas emissions
z environmental impact assessing how the economic infrastructure and the Commissionrsquos recommendations affect the UKrsquos natural capital and biodiversity
z regional impacts assessing whether recommendations will have disproportionate impacts on regions
18
National Infrastructure Commission | The Second National Infrastructure Assessment Baseline Report
The Commission will look at the appropriate policy regulatory and funding mechanisms to meet the infrastructure needs covered by the recommendations in the second Assessment and will consider the most effective decision-making models for infrastructure balancing national and local needs and priorities Recommendations will also be guided by the Commissionrsquos design principles for national infrastructure climate people places and value
19
National Infrastructure Commission | The Second National Infrastructure Assessment Baseline Report
Ahead of the second National Infrastructure Assessment the Baseline Report sets out an evaluation of the performance of the six infrastructure sectors in the Commissionrsquos remit identifies nine key infrastructure challenges for the second Assessment and asks Call for Evidence questions on these topics The key challenges are grouped under three strategic themes reaching net zero climate resilience and the environment and supporting levelling up
11 The Baseline ReportThe Commission carries out a National Infrastructure Assessment once every five years setting out the Commissionrsquos assessment of long term needs in the digital energy flood resilience water and wastewater waste and transport sectors and recommendations to meet them including the right policy regulatory and funding mechanisms The Assessments are guided by the Commissionrsquos objectives to support sustainable growth across regions improve competitiveness and quality of life and its new objective to support climate resilience and the transition to net zero carbon emissions by 2050 The Assessments take a long term view looking ahead over the next 10-30 years
The Commissionrsquos remit covers economic infrastructure within the UK Governmentrsquos competence Many areas of economic infrastructure are devolved see figure 11 The Commissionrsquos role is to advise the UK Government but the Commission works with both the UK Government and the devolved administrations where responsibilities interact
Figure 11 Devolved administration responsibilities by infrastructure sector
Sector Devolved administration responsibility
Northern Ireland Scotland Wales
Digital Reserved Reserved Reserved
Energy Devolved except nuclear
Reserved except energy efficiency
Reserved except energy efficiency
Flood risk Devolved Devolved Devolved
Transport Devolved except aviation and maritime
Largely devolved except aviation and maritime
Road transport largely devolved most rail aviation and maritime reserved
Waste Devolved Devolved Devolved
Water and wastewater
Devolved Devolved Devolved
1 Introduction
20
National Infrastructure Commission | The Second National Infrastructure Assessment Baseline Report
The first Assessment was published in July 20181 Since then it has shaped infrastructure policy across the UK The governmentrsquos National Infrastructure Strategy a formal response to the Assessment aligned closely with the Commissionrsquos recommendations2
The Baseline Report has three key functions
z setting out an evaluation of the performance of the six economic infrastructure sectors
z identifying the nine key future infrastructure challenges for second Assessment which will set out recommendations to address them
z inviting views on the set of challenges it has identified through call for evidence questions
The Commission has identified the key challenges that it will consider in the second Assessment based on issues identified through the performance metrics progress that is already being made future trends and the publicrsquos priorities as identified through social research The Commission has also focussed on those that have a good fit with the Commissionrsquos remit are strategically important and are an issue where the Commission can add value considering the current policy landscape and the Commissionrsquos existing work
In October 2021 the Commission was given a new objective to support climate resilience and the transition to net zero carbon emissions by 2050 The Commission is confident that the key challenges identified are consistent with this new objective ndash the Commission has considered both climate resilience and net zero in its work to date3 and both are strategic themes in this Baseline Report Chapters 2-4 set out how each strategic theme aligns to all four of the Commissionrsquos objectives
Alongside a cross cutting digital challenge (see section 14) a further eight challenges have been identified which are grouped under three strategic themes
z reaching net zero
z climate resilience and the environment
z supporting levelling up
The key challenges the Commission has identified are set out in figure 12 overleaf
The Commission will publish the second Assessment in the second half of 2023 The Commission ndash and the Assessments ndash take a long term view making recommendations over the next 10-30 years and encouraging long term stable infrastructure policy Many recommendations from the first Assessment ndash or from the Commissionrsquos studies see box 11 ndash are therefore still relevant In addition government has made progress in implementing many of the Commissionrsquos existing recommendations where they were endorsed or its own approach where they were not The Commission will continue to monitor delivery but will not generally revisit these issues
However in some areas ndash such as the governmentrsquos commitments on the environment and climate the effects of the Covid-19 pandemic or technologies that can support infrastructure ndash the context has changed since the first Assessment Therefore while the first Assessment made recommendations across all sectors the second will focus on the remaining key challenges areas where the Commissionrsquos recommendations need to be updated or where the Commission needs to address new issues
21
National Infrastructure Commission | The Second National Infrastructure Assessment Baseline Report
Figure 12 Key challenges for the second Assessment
Following the first Assessment the Commission carried out a comprehensive engagement process with its staff and external stakeholders to gather feedback The conclusions of this were published in a paper in March 20194 The Commission has taken this feedback into account in this document and in the plans for the second Assessment
Link to other theme
Challenge
Waste and the circular
economy
Decarbonising electricitygeneration
Heat transition and energy efficiency
Networks for hydrogen
and CCS
Surface water
management
Interurbantransport
across modesUrban
mobility and congestion
Digital transformation
Asset managementand resilience
C L I M AT E R E S I L I E NC
E A
ND
TH
E E
NV
I RO
NM
EN
TR
EA
CH
I NG
NE
T Z
E R O
S U P P O R T I N G L E V E L L I N G U P
22
National Infrastructure Commission | The Second National Infrastructure Assessment Baseline Report
Box 11 Commission studies since the first Assessment
Since the first Assessment the Commission has published studies as requested by government on
z Freight The Commission found that through the adoption of new technologies and the recognition of freightrsquos needs in the planning system it is possible to decarbonise road and rail freight by 2050 and manage its contribution to congestion The government welcomed the core themes of the Commissionrsquos report and will develop these themes through the Freight Council and the Future of Freight strategic Plan
z Regulation The Commissionrsquos regulation study set out how regulators industry and government must adapt to face the coming challenges of achieving net zero ensuring resilience and increasing digitalisation The study looked at how to keep critical services affordable ensure competition and attract the right levels of investment and innovation The government has responded to the Commissionrsquos recommendations to improve regulation and will set out further details later this year
z Resilience The Commissionrsquos study examined how to improve the resilience of the UKrsquos water digital transport and energy infrastructure including the key strategic changes required to meet forthcoming challenges while maintaining levels of service for users Government has accepted the potential role for more and better resilience standards and stress testing and will set out further details in the National Resilience Strategy
z Rail Needs Assessment for the Midlands and the North To inform the governmentrsquos Integrated Rail Plan the Commission developed a menu of options for a programme of rail investments in the Midlands and the North using three different illustrative budget options The Commission recommended an adaptive approach beginning with a core set of programmes
z Engineered greenhouse gas removals The study set out that engineered greenhouse gas removals will become a major new infrastructure sector for the UK over the coming decades It recommended that government ensure the first engineered removals plants are up and running no later than 2030 delivering 5-10 MtCO
2e of removals per year The
governmentrsquos Net Zero Strategy has since set an ambition to deploy at least 5 MtCO2e of
engineered greenhouse gas removals by 2030 rising to around 23 MtCO2e by 2035 and a
plan to consult in 2022 on business models to incentivise investment
z Towns This study focused on towns and suburban centres considering the potential for both economic and quality of life benefits from infrastructure intervention in different types of towns The Commission awaits governmentrsquos response
12 Work informing the second AssessmentThe Baseline Report forms part of a wide body of work to inform the second Assessment The Commission has published a number of supplementary papers since the first Assessment aside from its studies (see above) and annual monitoring reports and more are planned in the run-up to the second Assessment
23
National Infrastructure Commission | The Second National Infrastructure Assessment Baseline Report
The Commissionrsquos interpretation of its objectives
The Commission is in the process of publishing discussion papers on its interpretation of its objectives including two discussion papers published to date covering the first two objectives
z Supporting sustainable economic growth across regions Growth across regions sets out the relationship between economic infrastructure and local growth and identifies three pathways for infrastructure investment to help achieve economic outcomes in regional areas addressing constraints to growth contributing to transformation and universal provision5
z Improve competitiveness Improving competitiveness identifies three ways in which infrastructure can contribute to competitiveness improving access to markets improving access to mobile labour and capital supporting and being a source of globally significant clusters and assets6
The Commission is planning to publish a discussion paper on its quality of life objective in spring 2022 It has also published a literature review on the impacts of infrastructure on quality of life which sets out a rapid evidence assessment of the impact of each of the Commissionrsquos six infrastructure sectors on quality of life7 The Commission has recently been given a new objective to support climate resilience and the transition to net zero carbon emissions by 2050 and will consider in due course whether to publish a discussion paper on this objective
Drivers of infrastructure supply and demand
Ahead of the first Assessment the Commission published documents on drivers of infrastructure supply and demand8 The theoretical relationships between each of these drivers and infrastructure supply and demand remain largely unchanged since the first documents were published however there are some updates
z Environment and climate change Chapter 3 sets out the Commissionrsquos up to date understanding of the impact of climate change on the infrastructure sectors and the impact of sectors on the environment
z Economy The UK is still recovering from the historic shock caused by the Covid-19 pandemic The Commission will consider the implications of this as more data emerges based on forecasts from the Office for Budget Responsibility
z Population and demography An ageing population and the impact of the UKrsquos exit from the EU mean that population projections have changed since the original paper was published The Office for National Statistics is expected to publish updated projections in December 2021 The Commission will consider the impact of these once latest projections are available
z Technological change The original paper included a horizon scan of new technologies that could impact infrastructures supply and demand9 The Commission will publish an update to this in spring 2022
z Behaviour change Since the first Assessment the Commission has published a fifth paper on a driver of infrastructure supply and demand Behaviour change and infrastructure beyond Covid-1910 The Commission will continue to monitor the impacts of behaviour change as data emerges
24
National Infrastructure Commission | The Second National Infrastructure Assessment Baseline Report
The Commission will publish updates to the drivers and publish the set of scenarios it will use to develop the second Assessment in spring 2022
13 Assessment of the infrastructure sectors
Progress has been made in some areas since the first Assessment
The first Assessment was published in July 2018 Since then it has shaped infrastructure policy across sectors The governmentrsquos National Infrastructure Strategy11 a formal response to the Assessment aligned closely with the Commissionrsquos recommendations and there has been significant progress on many of the recommendations including
z access to gigabit capable broadband the government has set out a clear vision to deliver gigabit capable broadband to at least 85 per cent of UK premises by 2025 ndash in late 2021 this was well underway reaching over 50 per cent of premises12
z a shift to renewable electricity there has been a shift towards a highly renewable electricity system with almost 40 per cent of electricity generated by renewable sources in 201913
z electric vehicles government has banned the sale of new petrol and diesel cars and vans in the UK from 203014 following the Commissionrsquos recommendation that charging infrastructure should be delivered to enable this shift
z flooding the government will invest pound56 billion over the next six years to reduce the risk of flooding following Commission recommendations15
z drought resilience government and the water industry in England have taken on the Commissionrsquos recommendations to increase water supply and reduce leakage16
z the UK Infrastructure Bank the independent infrastructure financing institution the Commission recommended be established following the UKrsquos loss of access to the European Investment Bank was launched in June 202117
z design principles the government endorsed the Commissionrsquos design principles and recommendation for board level design champions on major infrastructure projects18
Infrastructure has continued to perform well in some areas
The Commissionrsquos performance assessment has identified several areas where infrastructure is performing well including
z access to mobile connectivity 92 per cent of the UK landmass is covered by at least one mobile operator with a funded plan to increase this to 95 per cent by 202619
z reliable energy supply the energy sector delivers electricity and gas of reliable quality to consumers ndash loss of supply is rare and interruptions to supply are reducing over time20
z access to clean water the water sector delivers water of reliable quality to homes and businesses across England with low numbers of service interruptions and customers are generally satisfied with the water and wastewater services provided21
25
National Infrastructure Commission | The Second National Infrastructure Assessment Baseline Report
Social research
In June 2021 the Commission carried out social research with a range of respondents from across the UK nationally representative by age gender region and ethnicity
The research showed relatively high levels of confidence from respondents from across the UK that infrastructure will meet peoplersquos needs over the next 30 years with confidence increasing since the first Assessment Only two sectors ndash flood resilience and waste ndash had lower than 70 per cent confidence with the digital sector performing particularly strongly This social research will shape the Commissionrsquos approach to the second Assessment
Figure 13 Public confidence in infrastructure has improved since the first Assessment
Percentage of respondents who were confident that the sector would meet their needs in the next 30 years in 2021 vs in 2017 (ahead of the first Assessment)
Source PwC (2021) NIA2 Social Research Final report
The research also showed that the public increasingly believe that infrastructure should lead the fight against climate change and a plan for infrastructure should consider the impact of infrastructure on the environment22
However in other infrastructure areas there is a lot more to be done
Nevertheless there remain major significant challenges across sectors particularly to reduce emissions Key areas where infrastructure needs to improve performance
z emissions from electricity and heat are still too high as the electricity sector will need to reduce emissions to near zero by 203523 and little progress has been made so far on heat decarbonisation although the technologies to do so already exist
0 10 20 30 40 50 60 70 80 90 100
Flood management
Solid waste
Transport
Water and wastewater
Energy
Digital
Percentage
Sect
or
2017 2021
26
National Infrastructure Commission | The Second National Infrastructure Assessment Baseline Report
z emissions from transport have not been declining despite improvements in engine efficiency24 and although electric vehicle charge point numbers are increasing25 the pace needs to pick up to enable a transition to electric vehicles in 2020s and 2030s26
z asset maintenance issues undermine performance in some sectors including ageing and leaky water pipes and potholes in local roads27
z more than five million properties are currently at risk of flooding in England28 including more than three million at risk of surface water flooding29
z serious pollution incidents from water and sewerage have plateaued at an unacceptably high level30 and 32 per cent of water bodies in England do not have good ecological status due to continuous discharges from sewage and seven per cent due to stormwater overflows31
z recycling rates have plateaued and emissions from waste have begun to rise again while the total waste generated in England is also increasing32
z urban transport connectivity is poor in many places and the largest urban areas tend to have the worst connectivity as congestion slows down journeys33
z there are wide variations in interurban connectivity between similar places but with no clear regional patterns or trends34
Progress is already being made in some of these areas including reducing emissions from electricity enabling the transition to electric vehicles and reducing the risks of flooding However there is still further to go More detail on the performance of each sector is set out in annexes A-F
The overall cost to households of infrastructure services has remained relatively stable over the last 10 years35 At the same time there have been significant increases in investment in many areas Average energy bills rose from the mid-2000s until the mid-2010s and then gradually declined
However gas prices have risen significantly in recent months pushing up the price of both gas and electricity as gas remains a significant input into electricity generation Domestic consumers have been shielded from some of this volatility due to the regulated cap on energy prices introduced from 2017 But prices have risen and are expected to rise further Businesses have also been affected especially those that are energy intensive This inevitably creates serious problems for some households and firms
Current high prices appear to be mostly due to temporary factors including the effects of the Covid-19 pandemic Prices may fall again but volatility in prices is inherent in a system dependent on fossil fuels As set out below this price volatility reinforces the strategic need to transition to a low carbon energy system as soon as practicable
27
National Infrastructure Commission | The Second National Infrastructure Assessment Baseline Report
Figure 14 The overall cost to UK households of infrastructure services remains relatively stable despite increases in investment
Average annual household expenditure pound (2019-20 prices CPI deflated)
0
1000
2000
3000
4000
5000
6000
7000
8000
pound 2
019
-20
pri
ces
Year
Total Energy Water Telecoms Transport
Sources DfT ONS Ofwat Ofcom
Infrastructure also faces new challenges
As well as improving current performance infrastructure must be prepared for future challenges including from a changing climate and behaviour change following the Covid-19 pandemic And it should also take the opportunities offered by new digital technologies
Infrastructure sectors are beginning to tackle the challenge of reaching net zero reducing the impact of infrastructure on the climate But the climate will also have impacts on infrastructure Sectors must prepare for the risks of a changing climate including increased incidence of flooding and drought
And alongside climate change there is another environmental crisis that must be addressed Global assessments show that nature is declining at rates unprecedented in human history with accelerating rates of species extinction and severe disruption to ecosystem services36 Infrastructure contributes to this decline but can also help prevent it
Finally the Covid-19 pandemic may lead to long term changes in where people live and work This in turn could lead to new patterns of infrastructure demand especially in the transport sector where there may be a change in the established levels of demand for different modes Car use has already returned to levels seen before the pandemic but in the longer term the way people use roads and public transport could be very different37
28
National Infrastructure Commission | The Second National Infrastructure Assessment Baseline Report
Call for evidence questions
This document contains call for evidence questions on each of the nine challenges These are mostly set out where the challenge is identified However there are several cross cutting call for evidence questions that are relevant across all nine challenges set out below A summary of call for evidence questions and information on how to respond is set out in Chapter 5
Question 1 Do the nine challenges identified by the Commission cover the most pressing issues that economic infrastructure will face over the next 30 years If not what other challenges should the Commission consider
Question 2 What changes to funding policy help address the Commissionrsquos nine challenges and what evidence is there to support this Your response can cover any number of the Commissionrsquos challenges
Question 3 How can better design in line with the design principles for national infrastructure help solve any of the Commissionrsquos nine challenges for the next Assessment and what evidence is there to support this Your response can cover any number of the Commissionrsquos challenges
Question 4 What interactions exist between addressing the Commissionrsquos nine challenges for the next Assessment and the governmentrsquos target to halt biodiversity loss by 2030 and implement biodiversity net gain Your response can cover any number of the Commissionrsquos challenges
Question 5 What are the main opportunities in terms of governance policy regulation and market mechanisms that may help solve any of the Commissionrsquos nine challenges for the Next Assessment What are the main barriers Your response can cover any number of the Commissionrsquos challenges
14 Digital technologies present opportunities for all sectorsThe Commission made recommendations on the availability and quality of digital infrastructure in the first Assessment and the government is making good progress delivering on this as set out above The Commission will continue to monitor government progress in these areas through the Annual Monitoring Report but does not plan to undertake new work on network rollout as part of the second Assessment Instead the Commission will turn its attention to how the widespread availability of fixed and mobile networks and services can be used in other infrastructure sectors to deliver better services at lower cost
Higher quality digital infrastructure will present opportunities across the economy including the opportunity to make improvements in all other infrastructure sectors Adoption of digital technologies has the potential to cut costs enhance service quality improve resilience and enable better demand management across a range of infrastructure services Sensors can be deployed across infrastructure assets to monitor their condition allowing for more timely and efficient maintenance interventions Real time data on road use could facilitate better traffic management and alleviate congestion However the adoption of digital technologies across infrastructure sectors is patchy The second Assessment will consider barriers that are preventing the adoption of new digital technologies in infrastructure and what policy and regulatory interventions may be needed
29
National Infrastructure Commission | The Second National Infrastructure Assessment Baseline Report
Challenge 1 The digital transformation of infrastructure ndash the Commission will consider how the digital transformation of infrastructure could deliver higher quality lower cost infrastructure services
Question 6 In which of the Commissionrsquos sectors (outside of digital) can digital services and technologies enabled by fixed and wireless communications networks deliver the biggest benefits and how much would this cost
Question 7 What barriers exist that are preventing the widescale adoption and application of new digital services and technologies to deliver better infrastructure services And how might they be addressed Your response can cover any number of the Commissionrsquos sectors outside digital (energy water flood resilience waste transport)
30
National Infrastructure Commission | The Second National Infrastructure Assessment Baseline Report
The effects of climate change which are already evident in the UK and worldwide can only be mitigated by cutting greenhouse gas emissions fast In 2019 two thirds of all UK greenhouse gas emissions arose from transport energy waste and wastewater infrastructure While progress has been made in these sectors they all need to decarbonise further And the move to net zero will also require new infrastructure networks for hydrogen and carbon capture and storage
In the second Assessment the Commission will focus on the following key challenges
z decarbonising electricity generation by 2035
z the heat transition and energy efficiency
z new networks for hydrogen and carbon capture and storage
While the decarbonisation of surface transport is discussed in this chapter transport will be covered as part of the challenges outlined in Chapter 4 Similarly waste will be considered in the circular economy challenge set out in Chapter 3 The water floods and digital sectors have much lower emissions and so will not be considered as priority challenges for decarbonisation in the second Assessment although the Commission will assess the emissions impact of all the recommendations it makes
21 Infrastructure and net zeroIn 2019 UK greenhouse gas emissions stood at around 500 MtCO
2e a reduction of 40 per cent since
199038 The UK has legally binding targets to reduce greenhouse gas emissions by 78 per cent by 2035 relative to 1990 levels39 and to net zero by 205040 In October 2021 the government published its Net Zero Strategy ndash a summary of the actions it is taking and plans to take to deliver against its commitment to reach net zero emissions by 205041
Reductions in emissions have so far been concentrated largely in the electricity sector with only limited progress in most other infrastructure sectors (figure 21)
2 Reaching net zero
31
National Infrastructure Commission | The Second National Infrastructure Assessment Baseline Report
Figure 21 Total UK emissions have reduced since 1990 especially in electricity generation
Annual greenhouse gas emissions by infrastructure sector 1990 to 2019
0
100
200
300
400
500
600
700
800
900
MtC
O2e
Year
Total UK emissions Total - infrastructureTransport (incl international aviation and shipping) Electricity generationHeating Waste (incl energy from waste)Wastewater
Source Commission calculations using Department for Business Energy amp Industrial Strategy (2021) Final UK greenhouse gas emissions national statistics 1990 to 2019
In 2019 two thirds of all UK greenhouse gas emissions arose from transport energy waste and wastewater infrastructure
z transport (including surface transport aviation and shipping) emitted around 165 MtCO2e (33
per cent of all UK emissions)
z electricity generation emitted around 50 MtCO2e (11 per cent)
z heat for residential public sector and commercial buildings emitted around 90 MtCO2e (17
per cent)
z waste emitted just over 20 MtCO2e (four per cent)42
z wastewater emitted around 3 MtCO2e (less than one per cent)
In the transport sector the route to net zero is clear for cars and vans but more complicated for HGVs rail planes and ships And while cars and vans can be decarbonised by the switch to electric vehicles this needs to accelerate to meet the sixth Carbon Budget target ndash government must ensure public charge points are available to encourage take up
In the energy sector there is a clear route to decarbonise the electricity system But it needs to happen fast ndash the electricity system must be near zero emissions by 2035 In heat the challenge is different ndash the technologies to decarbonise heat exist but how to deliver the necessary changes in homes and businesses is not clear
32
National Infrastructure Commission | The Second National Infrastructure Assessment Baseline Report
To decarbonise the waste sector emissions from landfill must be reduced More detail on how the Commission will consider the waste sector in the second Assessment is set out in Chapter 3 The Commission will also look at the emissions from energy from waste plants as part of the wider electricity system
The Commission is not planning to consider process emissions from wastewater treatment as a priority in the second Assessment as these represent a very small proportion of overall emissions
The Commissionrsquos other infrastructure sectors ndash the water flood resilience and digital sectors ndash do not directly emit greenhouse gases in the way that power stations or cars do Their reliance on energy and transport infrastructure does indirectly raise emissions but as those sectors decarbonise the emissions from the water flood resilience and digital sectors will also fall The water flood resilience and digital sectors are therefore not considered in this chapter
The move to net zero will also require new infrastructure networks including for hydrogen and carbon capture and storage Government has set out strategies for both however there are still many questions to be resolved It still needs to be determined how quickly these networks can be delivered at what scale and how plans can be coordinated
Achieving net zero ndash a 100 per cent reduction in net (rather than gross) greenhouse gas emissions from 1990 levels ndash means that some sectors are still expected to emit a small amount of greenhouse gases in 2050 These will have to be offset by greenhouse gas removals which the Commission considered in its 2021 report Engineered greenhouse gas removals43
All infrastructure sectors have emissions lsquoembeddedrsquo in their construction process and in their use of materials Hydrogen and carbon capture and storage are two of the solutions to decarbonising the production of construction materials The infrastructure needed to allow for this will be considered by the Commission
All infrastructure sectors need to decarbonise further fast to meet the governmentrsquos emissions targets for 2035 and 2050 While the legally binding net zero and sixth Carbon Budget targets only refer to total UK emissions across all sectors the government has set out illustrative sectoral ranges for emissions reductions in its Net Zero Strategy44 These ranges are similar to the illustrative roadmaps produced by the Climate Change Committee to meet both the sixth Carbon Budget and net zero target The Commission uses these illustrative roadmaps as guidance for the expected decarbonisation path in its infrastructure sectors The Climate Change Committeersquos lsquobalanced pathwayrsquo scenario for each sector is shown in figure 22
Many areas of economic infrastructure are devolved see Chapter 1 The Commissionrsquos role is to advise the UK Government This chapter therefore focusses on UK Government climate targets and areas of competence
33
National Infrastructure Commission | The Second National Infrastructure Assessment Baseline Report
Figure 22 Some economic infrastructure sectors must decarbonise faster than others
Emissions reduction roadmaps for economic infrastructure in the Climate Change Committeersquos lsquobalanced pathwayrsquo scenario
0
50
100
150
200
250
300
350
400
2019 emissions 2035 scenario 2050 scenario
MtC
O2e
Year
Surface transport BuildingsElectricity generation Aviation and shippingWaste (inc wastewater and energy from waste)
Source Climate Change Committee (2020) Sixth Carbon Budget ndash Dataset Note allocation of emissions to sectors varies from the figures presented elsewhere in this report
Box 21 Reaching net zero is a key theme for the Commission
Reaching net zero supports all four of the Commissionrsquos objectives
z Support sustainable economic growth across all regions of the UK Reducing greenhouse gas emissions is vital for economic growth The scale of the productivity impacts of heatwaves and other extreme weather is likely to be in the order of billions of pounds per year45 The benefits from mitigating climate change will be felt across all regions There are likely to be some economic benefits in areas where new low carbon industries are located through jobs created in the construction and operation of these industries and through associated services However the transition away from oil and gas may have the opposite effect in places where these industries are centred
z Improve competitiveness Many of the UKrsquos existing competitive advantages are in high carbon industries Net zero means that some of these industries face uncertain futures But the UK can and should transfer its advantages ndash which lie across a broad range of professional financial and engineering and design services ndash to emerging low carbon industries such as carbon capture and storage and electric vehicle technology46 Getting ahead of this challenge now will maximise the UKrsquos future competitiveness as the global economy shifts towards net zero
34
National Infrastructure Commission | The Second National Infrastructure Assessment Baseline Report
z Improve quality of life Reducing greenhouse gas emissions is expected to help mitigate the impacts of climate change which have significant impacts on quality of life in the UK and globally47 The largest impacts are likely to be on health and availability (and therefore affordability) of food It will also impact on quality of life through affecting infrastructure and access to infrastructure services for example from flooding or overheated train tracks48
z Support climate resilience and the transition to net zero carbon emissions by 2050 Reaching emissions targets in economic infrastructure will reduce emissions not only in those sectors but also in the sectors that depend on them Reducing greenhouse gas emissions will also help mitigate climate change supporting climate resilience
The Commissionrsquos social research found that people increasingly rank reducing emissions as a priority for infrastructure Respondents cited fighting climate change by reducing greenhouse gases as the top priority for the UKrsquos infrastructure in 30 yearsrsquo time49
22 TransportIn 2019 greenhouse gas emissions from the transport sector stood at around 165 MtCO
2e or 33 per cent
of total UK emissions that year Emissions from transport broadly fall into two categories
z surface transport which emitted around 115 MtCO2e in 2019
z aviation and shipping both domestic and international which emitted around 50 MtCO2e in
2019
Figure 23 Surface transport makes up two thirds of transport emissions
Annual greenhouse gas emissions by transport mode 2019
0
20
40
60
80
100
120
140
160
180
Transport Surface transport breakdown
MtC
O2e
Sector
Surface transportAviation and shipping (incl international)
Cars and light road vehiclesHGVs coaches and busesRail
Source Commission calculations using Department for Business Energy amp Industrial Strategy (2021) Final UK greenhouse gas emissions national statistics 1990 to 2019
35
National Infrastructure Commission | The Second National Infrastructure Assessment Baseline Report
Surface transport
In 2019 emissions from surface transport made up around two thirds of all transport emissions in the UK50 These emissions have persisted at similar levels since 1990 Surface transport emissions arise from
z cars taxis light vans motorcycles and mopeds which produce just under 80 per cent of emissions from surface transport
z HGVs buses and coaches which emitted around 25 MtCO2e in 2019 around 20 per cent of
surface transport emissions with the majority coming from HGVs
z railways which emitted less than 2 MtCO2e in 2019 ndash this is close to a 15 per cent reduction
on 1990 emissions despite a 115 per cent rise in passenger journeys51
The Climate Change Committeersquos balanced pathway scenario assumes emissions from surface transport will fall to 32 MtCO
2e by 2035 and to 1 MtCO
2e by 205052
Cars taxis light vans motorcycles and mopeds
The move to electric cars and vans will eliminate the majority of emissions from surface transport In the first Assessment the Commission recommended the roll out of charging infrastructure sufficient to enable 100 per cent electric new car and van sales by 203053 Government has since committed to ending the sale of new petrol and diesel cars and vans in the UK by 2030 and to working closely with Ofgem and industry to ensure there is the charging infrastructure in place to support this54
However plans to deliver an electric vehicle charging network must accelerate if electric vehicle take up is to happen at the pace needed to meet the sixth Carbon Budget which will require a significant shift to electric vehicles over the 2020s Without available chargers drivers will not have the confidence to make the switch As of July 2021 there were around 24300 public charging points55 It is estimated that between 280000 and 480000 public charging points would be needed to support 100 per cent electric new car and van sales in 203056
In the National Infrastructure Strategy government committed to publish an electric vehicle charging infrastructure strategy by November 202157 This is urgently required to help support the delivery of charging infrastructure that will encourage drivers to make the required switch to electric vehicles It will also help both the market and local authorities plan the delivery of additional charging points Ofgem has recently published its priorities for enabling the transition to electric vehicles setting out plans to ensure that the networks are prepared for increased adoption and that network connections are timely and cost effective It also outlines how it will support off peak lsquosmart chargingrsquo using market incentives and support the sale of battery stored electricity back to the grid58
HGVs buses and coaches
Decarbonising heavy road vehicles presents a further challenge The options being considered to decarbonise HGVs are hydrogen and electrification either of which would require a change in existing fuelling infrastructure The Commission has recommended that new diesel HGV sales should end by 204059 This year the government committed to phase out the sale of new non zero emissions HGVrsquos by 204060 The governmentrsquos forthcoming lsquoFuture of Freight Planrsquo must address the need for a comprehensive assessment of the infrastructure needed to enable freight HGV decarbonisation including working with Ofgem and distribution network operators to plan any necessary infrastructure upgrades
36
National Infrastructure Commission | The Second National Infrastructure Assessment Baseline Report
In its Transport Decarbonisation Plan government committed to measures to boost zero emission bus fleets Currently only two per cent of English buses are run on lower carbon fuel such as electricity or hydrogen 61
Railways
In the rail network many of the intercity mainlines and almost all London commuter routes have already been electrified62 Further electrification of the rail network will reduce emissions The Commission has called for a rolling programme of electrification to be established but has noted that detailed work will be needed to establish which routes are the priority for early electrification63 The Commission has also recommended that government publish a detailed strategy for achieving rail freight decarbonisation by 205064 The high costs associated with installing overhead line electrification pose a challenge for decarbonising all rail routes65 for some battery or hydrogen trains may offer an alternative means of decarbonising66 Government has committed to encourage the development of battery and hydrogen trains in the Transport Decarbonisation Plan
Chapter 4 sets out the Commissionrsquos plans to look at improving urban and interurban transport As the Commission develops transport recommendations for the second Assessment it will ensure these recommendations are consistent with the governmentrsquos decarbonisation targets
Aviation and shipping
In 2019 emissions from aviation and shipping stood at around 50 MtCO2e Emissions from shipping have
declined since 1990 But international aviation emissions were on a strong upwards trend prior to the Covid-19 pandemic reaching close to 40 MtCO
2e in 2019
Figure 24 UK emissions from aviation and shipping in 201967
Aviation Shipping
Domestic 1 MtCO2e 6 MtCO
2e
International 37 MtCO2e 8 MtCO
2e
Aviation and shipping are particularly difficult to decarbonise The technologies to do so do not yet exist or are not yet mature enough to be used at scale68 The Climate Change Committeersquos balanced pathway scenario assumes that emissions from aviation and shipping will remain at 24 MtCO
2e even in 205069
Greenhouse gas removals will therefore be necessary to offset the remaining emissions in this sector The international aviation sector has committed to offset growth in emissions from 2019 levels through the UN Aviation Agencyrsquos Carbon Offsetting and Reduction Scheme for International Aviation70
The Commission has recommended that engineered greenhouse gas removals are developed in the UK to address emissions from this hard to abate sector71 The governmentrsquos Net Zero Strategy has since set an ambition to deploy at least 5 MtCO
2e of engineered greenhouse gas removals by 2030 rising to
around 23 MtCO2e by 2035 and a plan to consult in 2022 on business models to incentivise investment
The Commission will continue to promote its recommendations and monitor governmentrsquos progress in establishing an engineered removals sector in the UK The Commission does not intend to take forward any further work during the second Assessment on the infrastructure required to decarbonise aviation and shipping
37
National Infrastructure Commission | The Second National Infrastructure Assessment Baseline Report
23 EnergyIn 2019 emissions from the energy sector stood at around 140 MtCO
2e equivalent to 28 per cent of UK
emissions for that year Despite dramatic reductions in emissions from electricity generation energy infrastructure remains the largest source of emissions after transport Emissions from energy arise from
z electricity generation which emitted around 50 MtCO2e in 2019 a fall of 74 per cent since
199072
z heat for residential public sector and commercial buildings which emitted around 90 MtCO
2e in 2019 17 per cent of total emissions
Average energy bills rose from the mid 2000s until the mid 2010s before gradually declining However gas prices have risen significantly in recent months which has pushed up the price of both gas and electricity as gas remains a significant input into electricity generation Domestic consumers have been shielded from some of this volatility due to the regulated cap on energy prices introduced from 2017 But prices have risen and are expected to rise further Businesses have also been affected especially those that are energy intensive This inevitably creates serious problems for some households and firms
Oil and gas are internationally traded commodities with volatile prices determined by factors over which the UK has little control Current high prices appear to be mostly due to temporary factors including the effects of the Covid-19 pandemic73 Prices may fall again but volatility in prices is inherent in a system dependent on fossil fuels Transitioning to a low carbon energy system based on long lasting capital assets such as wind farms and nuclear power stations with less dependence on fuel should reduce exposure to price spikes like those currently being experienced
Decarbonising energy will require high levels of investment both to decarbonise existing infrastructure networks and to build new ones for example for carbon capture and storage and hydrogen This investment will ultimately need to be funded by either consumers (via bills) or taxpayers The Commission will consider funding challenges in the second Assessment including the overall affordability of required investment the distribution of costs and savings across groups in society and who should pay
Electricity generation
Electricity generation has made significant progress in reducing emissions decarbonising faster than any other sector The share of electricity generated from renewable sources has grown from less than ten per cent in 2010 to almost 40 per cent in 201974
The pathway to decarbonise electricity generation is clear electricity generation needs to primarily come from low carbon energy sources (like wind solar and nuclear) complemented by storage interconnection with other countries demand management and novel flexible low carbon generation (such as hydrogen or gas or biomass with carbon capture and storage) The transmission and distribution networks will need to be ready to support these new sources of generation and manage increased demand (such as from electric vehicles) as other sectors decarbonise
In the first Assessment the Commission recommended that government aim to deliver 50 per cent renewable generation by 203075 The Commission later increased that recommendation to 65 per cent by 2030 in light of faster than expected cost reductions in renewable technologies76 Since the Commission reached this position the government has committed to the sixth Carbon Budget and to decarbonising the electricity system by 2035 (subject to being able to maintain security of supply)77
38
National Infrastructure Commission | The Second National Infrastructure Assessment Baseline Report
Reaching near zero emissions by 2035 will require an acceleration in the current pace of decarbonisation While reliance on coal and oil has dropped significantly gas remains the largest single source of electricity generation holding around a 40 per cent share of generation in 201978
Delivering this will require significant new capacity to be deployed over the next decade The government has committed to achieving 40 GW of offshore wind generation by 2030 and is reopening Contracts for Difference auctions held approximately every two years to onshore wind and solar79 These actions are in line with the Commissionrsquos recommendations Government and industry must now focus on delivery
While the pathway to decarbonisation is clear and progress is being made the energy sector still faces a significant challenge A low cost net zero electricity system capable of meeting increased demand must be delivered without jeopardising security of supply Renewable electricity generation from solar or wind cannot be turned on when needed like a gas power plant can so flexibility including through electricity storage will be vital for a highly renewable electricity system There is some evidence that the electricity storage market is maturing Battery storage capacity exceeded 1 GW for the first time in 2021 and the pipeline of battery storage projects has expanded rapidly in the last three years80 The government and Ofgem recently updated their Smart Systems and Flexibility Plan and issued a call for evidence on facilitating the deployment of large scale and long duration electricity storage81
Challenge 2 Decarbonising electricity generation ndash the Commission will consider how a decarbonised secure and flexible electricity system can be achieved by 2035 at low cost
Heat
Decarbonising heat is complex and limited progress has been made While the technologies to decarbonise heat exist delivering the transition to zero carbon heat presents a significant challenge to policymakers as it will directly affect individuals and will cause significant disruption in homes buildings and at street level
Most of the emissions from heat arise from burning fossil fuels for heating and hot water Total emissions from buildings in 2019 were around 90 MtCO
2e only a 17 per cent fall on 1990 levels This includes a 15
per cent reduction in residential combustion emissions supported by improved efficiency of heating systems and government schemes to encourage the installation of energy efficiency measures in homes82 Reductions began to tail off in 2014 as those schemes ended or were reduced in scope and emissions have plateaued since then83
Over 75 per cent of the energy needed for heating space and water in homes is provided by natural gas with oil electricity and bioenergy providing under ten per cent each84 This reliance on fossil fuels will need to end to reach net zero ndash the Climate Change Committeersquos balanced pathway scenario sees emissions from heating falling to 47 MtCO
2e by 2035 and to 1 MtCO
2e by 205085
Providing zero carbon heat will require both
z Improving energy efficiency of buildings This will reduce the amount of heat that is lost and therefore reduce the demand for energy for heat The UK has some of the oldest and least energy efficient homes in Europe86 Improving energy efficiency will require millions of existing homes to be better insulated for example by double glazing windows or increasing insulation in walls and roofs and new homes to be built to high levels of efficiency
39
National Infrastructure Commission | The Second National Infrastructure Assessment Baseline Report
z Transitioning to a mix of electric heating and heat from hydrogen This will mean replacing fossil fuel heating systems mainly natural gas boilers with lower carbon alternatives that use electricity like heat pumps or heat networks or hydrogen or hybrid systems The appropriate balance between these sources of heat is not yet clear
In the first Assessment the Commission recognised that difficult decisions would need to be made about how and when the UKrsquos reliance on natural gas for heating will come to an end It therefore recommended a series of near term actions to build the evidence base on heat decarbonisation and improve energy efficiency including
z setting a target rate of installing 21000 energy efficiency measures per week in England by 2020 and allocating funding to enable this
z establishing an up to date evidence base on the performance of heat pumps within the building stock and getting a better understanding of the scope for future cost reductions
z establishing the safety case for hydrogen and trialling it first at community scale by 2021 and then a larger trial of at least 10000 homes by 202387
Government accepted the Commissionrsquos recommendations on gathering evidence on heat pumps and the use of hydrogen for heating It did not support setting a target for the number of energy efficiency measures Progress is lagging behind the Commissionrsquos recommended timetable88
The energy efficiency of homes in England has been gradually improving89 But government policy to date to spur action has been stop start Energy efficiency installations are therefore falling short of what is needed In 2019 the number of energy efficiency installations installed through government schemes averaged 4200 per week far below levels in the early 2010s90 Heat pump installations remain low at 36000 a year91 far below the government ambition to get installations to 600000 a year by 202892
Box 22 Heat decarbonisation in Europe
The UK is not alone in facing the challenge of heat decarbonisation But it is unusual in the degree to which it currently depends on gas boilers for heating The UK has one of the highest levels of on gas grid heating in the OECD93
Most other European countries already generate much of their energy for heating through sources other than natural gas such as electricity or biofuels and make greater use of district heating systems to transport heat It is estimated that 85 per cent of heating in Norway is provided by electricity mainly generated through hydroelectricity and 60 per cent of heating in Sweden is from district heating with electricity meeting most of the remaining demand94 Heat pumps are installed in approximately a fifth of Swedish homes95 These countries have benefitted from converting district heating systems originally powered by coal and oil to less carbon intensive sources96
The UKrsquos closest comparator in terms of heating systems is the Netherlands where in 2016 nearly 95 per cent of households were connected to the gas grid97 The Netherlands has banned new connections to its gas grid98 It has also committed to scaling up production of low carbon hydrogen by 2030 and 46 local authorities are piloting alternative heating technologies with many opting to install heat pumps99
40
National Infrastructure Commission | The Second National Infrastructure Assessment Baseline Report
The UK Government has recently published its strategy for decarbonising heat100 The Scottish and Welsh Governments are also focused on this issue101 The UK Governmentrsquos strategy sets out plans to cut emissions via a gradual transition which will start by incentivising consumers through grant funding to install heat pumps and working with industry to drive down their cost and encourage uptake It also outlines measures to promote improved efficiency to business and public sector buildings The stated ambition is that by 2035 no new gas boilers will be sold
The lack of progress to date in decarbonising heat and the legislated sixth Carbon Budget mean understanding and resolving the challenges that the UK will face in decarbonising its homes and businesses is now urgent There are still major questions to be answered as acknowledged in the Heat and Buildings Strategy102 These questions include what level of insulation will be needed in different homes to efficiently operate heat pumps whether hydrogen for heating will be available as a source of heat for all homes and what this means for the continuing use of the gas network and how to deliver these major changes in peoplersquos homes
The Commission does not yet have the answers to these questions But it will continue to work with government to build a stronger evidence base so that these important decisions can be made in time to meet carbon targets The government has committed to making a decision on the role of hydrogen for heating by 2026103 If this does not happen the risk of not achieving net zero is very real
In tackling these questions the Commission will consider how the heat transition will impact household bills Using a heat pump currently costs more than a natural gas boiler as both the upfront installation cost and running cost are higher And while hydrogen boilers are expected to have a similar cost to natural gas boilers the running costs are currently uncertain and will depend on the cost of producing hydrogen Making the change to zero carbon heat in a well planned way with appropriately targeted policy can ease the burden on the most vulnerable
Challenge 3 Heat transition and energy efficiency ndash the Commission will identify a viable pathway for heat decarbonisation and set out recommendations for policies and funding to deliver net zero heat to all homes and businesses
24 WasteIn 2019 emissions from the waste sector stood at just over 20 MtCO
2e four per cent of total UK
emissions Emissions from waste arise from
z landfill waste which represented the majority of emissions in 2019
z incineration composting anaerobic digestion and mechanical biological treatment which make up around 2 MtCO
2e
z energy from waste plants which represent around 5 MtCO2e104
These domestic figures do not account for emissions from exporting waste
Emissions from waste fell significantly from 1990 to 2014 Most of the reduction in emissions from waste to date has been due to falling methane emissions from landfill following the landfill tax ndash the UK achieved an 84 per cent reduction in biodegradable waste sent to landfill between 1990 and 2015 (see Annex C)105 However landfill emission reductions have stagnated and energy from waste emissions have grown which has caused a ten percent increase in emissions since 2015106
41
National Infrastructure Commission | The Second National Infrastructure Assessment Baseline Report
Reducing the volume of waste that is disposed of through landfill or incineration without recovery ndash or reducing emissions from treatments such as incineration with energy recovery ndash is therefore critical to reducing overall emissions in the waste sector
The net zero target means that the Commission will need to revisit its work on waste in the second Assessment More detail on how the Commission will consider the waste sector in the second Assessment is set out in Chapter 3 The Commission will consider emissions from energy from waste plants under challenge 2 (see section 23)
25 WastewaterThe wastewater sector emitted around 3 MtCO
2e in 2019 less than one per cent of total UK emissions
These emissions have been broadly stable since 1990 These emissions arise from wastewater handling
The Commission is not planning to consider process emissions from water and wastewater treatment as a priority in the second Assessment due to the low level of overall emissions and the industryrsquos ambition107
More detail on the performance of the water and wastewater sector is set out in Annex D
26 New infrastructure networks to support net zeroTackling emissions from some sectors ndash largely from harder to abate sectors such as industry aviation agriculture and shipping ndash will require new infrastructure networks These will include
z hydrogen networks to help decarbonise hard to electrify sectors such as heavy industry shipping aviation heavy goods vehicles some heating and parts of the rail network
z carbon capture and storage networks which will be needed to decarbonise parts of industry hydrogen production electricity generation (from sources such as gas waste incineration or biomass) and to enable engineered greenhouse gas removals
While government has published strategies and business models for both networks there are still many questions to be resolved It is still to be determined how quickly these networks can be delivered at what scale and how plans can be coordinated
In the second Assessment the Commission will consider the rollout of these networks The key challenge will be understanding what scale of networks will be necessary for both hydrogen and carbon capture and storage This can be difficult to determine as while hydrogen and carbon capture and storage are complementary networks (carbon capture and storage is needed to produce low carbon hydrogen from natural gas for example) there will be some areas of the economy where they compete as routes to decarbonisation For example either hydrogen or current power sources combined with carbon capture and storage could be used to decarbonise steel production
Hydrogen networks
Hydrogen currently plays an extremely limited role in the UK energy sector However it has the potential to be used widely across the economy108
42
National Infrastructure Commission | The Second National Infrastructure Assessment Baseline Report
The UK currently produces an estimated 27 TWh of hydrogen Almost all of this is produced using fossil fuels and is used predominantly in the petrochemical sector109 Long term policies and infrastructure for hydrogen production and deployment will therefore be needed to deliver large volumes of low carbon hydrogen
The government has recently committed to a target of 1 GW of hydrogen production by 2025 and 5 GW (42 TWh) of low carbon hydrogen production by 2030 in its Hydrogen Strategy110 The strategy is an important milestone in the development of the sector The Commission welcomes the commitments made in the Strategy including the proposed development of technical standards to ensure that production of hydrogen is low carbon irrespective of the production method used
A critical question is how to drive down the costs of hydrogen production and decide what and how infrastructure networks are established Alongside the positive measures in the Strategy there needs to be greater clarity on the funding models to secure the necessary investor confidence to scale production It will also be important to consider who will foot the costs of the long term funding model and to ensure they are distributed fairly
In the second Assessment the Commission will examine the uses of hydrogen across the economy which technologies are best placed to produce it the infrastructure required and the policy and funding frameworks needed focussing on the longer term picture The Commission will evaluate the potential for hydrogen in the UK and the actions that need to be taken to maximise that potential
Carbon capture and storage networks
Carbon capture and storage networks can play a range of roles to reduce emissions across the economy for example by capturing the emissions from
z industrial processes
z electricity generation such as gas or energy from waste plants
z hydrogen production from reforming natural gas
Carbon capture and storage infrastructure is also required for engineered greenhouse gas removals which will be necessary to offset residual emissions from hard to abate sectors such as aviation and agriculture Engineered greenhouse gas removals capture carbon either through the processing of biomass or directly from air to create negative emissions Technologies to do this already exist but are not yet being used at scale in the UK or globally111 In its report Engineered greenhouse gas removals the Commission recommended that government commit to deploying a range of engineered removals at megatonne scale by 2030112
The government plans to deploy carbon capture and storage networks by 2030 It has recently increased its ambition from capturing and storing 10 MtCO2e a year by 2030 to 20-30 MtCO
2e113
In the second Assessment the Commission will assess the actions needed to meet demand for carbon capture and storage networks This will include whether the governmentrsquos current actions will deliver the capacity likely to be required The Commission will consider what actions are needed ndash where when and how infrastructure gets delivered ndash to ensure that access to transport and storage does not become a barrier to efficiently reducing emissions
43
National Infrastructure Commission | The Second National Infrastructure Assessment Baseline Report
Challenge 4 Networks for hydrogen and carbon capture and storage - the Commission will assess the hydrogen and carbon capture and storage required across the economy and the policy and funding frameworks needed to deliver it over the next 10-30 years
27 Challenges for the second AssessmentAs set out in this chapter the key challenges the Commission will consider in the second Assessment related to net zero will be
Challenge 2 Decarbonising electricity generation ndash the Commission will consider how a decarbonised secure and flexible electricity system can be achieved by 2035 at low cost
Question 8 What are the greatest risks to security of supply in a decarbonised power system that meets government ambition for 2035 and what solutions exist to mitigate these risks
Challenge 3 Heat transition and energy efficiency ndash the Commission will identify a viable pathway for heat decarbonisation and set out recommendations for policies and funding to deliver net zero heat to all homes and businesses
Question 9 What evidence do you have on the barriers to converting the existing gas grid to hydrogen installing heat pumps in different types of properties or rolling out low carbon heat networks What are the potential solutions to these barriers
Question 10 What evidence do you have of the barriers and potential solutions to deploying energy efficiency in the English building stock
Challenge 4 Networks for hydrogen and carbon capture and storage - the Commission will assess the hydrogen and carbon capture and storage required across the economy and the policy and funding frameworks needed to deliver it over the next 10-30 years
Question 11 What barriers exist to the long term growth of the hydrogen sector beyond 2030 and how can they be overcome Are any parts of the value chain (production storage transportation) more challenging than others and if so why
Question 12 What are the main barriers to delivering the carbon capture and storage networks required to support the transition to a net zero economy What are the solutions to overcoming these barriers
Details on how to respond to the call for evidence questions are set out in Chapter 5
44
National Infrastructure Commission | The Second National Infrastructure Assessment Baseline Report
Society and the economy depend on a healthy environment But the climate is changing and nature is declining at unprecedented rates Infrastructure needs to adapt to the growing risks of extreme weather and contribute to wider environmental objectives including increased biodiversity reduced waste and cleaner air and water
In the second Assessment the Commission will focus on the following key challenges
z asset management and resilience
z surface water management
z the role of the waste sector in the move to a circular economy
Alongside these the Commission will focus on reducing greenhouse gas emissions through the challenges set out in Chapter 2 and assess impacts on emissions and natural capital for all the recommendations made in the second Assessment The Commission will continue to monitor the governmentrsquos progress against its previous recommendations to improve resilience across the regulated sectors and increase resilience to drought and to river and coastal flooding
Box 31 Climate resilience and the environment are key themes for the Commission
The challenges of adapting infrastructure to climate change supporting a healthy natural environment and minimising negative impacts all closely relate to the Commissionrsquos strategic objectives which are to
z Support sustainable economic growth across all regions of the UK Resilient infrastructure supports economic growth by continuing to provide critical services including protection from natural hazards despite the growing risks of climate change Furthermore nature and the biodiversity that underpins it ultimately sustains the UK economy114 Infrastructure can therefore support growth by minimising its impact on the environment and protecting nature from pollution waste and hazards
z Improve competitiveness Resilient infrastructure supports competitiveness by providing services to businesses including access to domestic and international markets despite the growing risks from climate change It is also reasonable to expect stronger environmental standards across global supply chains in the future115 in which case higher domestic standards including for infrastructure will enable UK businesses to compete internationally
3 Climate resilience and the environment
45
National Infrastructure Commission | The Second National Infrastructure Assessment Baseline Report
z Improve quality of life A healthy natural environment is essential to quality of life116 Infrastructure can protect the environment and society from pollution waste and natural hazards It can also enhance the environment through design and help people to access nature However infrastructure can also undermine quality of life by polluting the environment and damaging habitats and biodiversity
z Support climate resilience and the transition to net zero carbon emissions by 2050 Even with ambitious efforts to reduce emissions impacts from climate change are inevitable117 Infrastructure must be resilient to current and future climate change risks including infrastructure which supports the transition to net zero
In the Commissionrsquos social research carried out in June 2021 respondents from across the UK ranked the environment as the most important factor to consider when planning for future infrastructure The number of respondents who ranked this as their top priority increased since the first Assessment in 2017 by six percentage points118
Figure 31 The public prioritise the environment as a key factor in infrastructure planning
Responses to the question The NIC is putting together a plan for what the UKrsquos infrastructure should be like in 30 yearsrsquo time When putting together this plan which of the following factors do you think are the most important to consider
Source PwC (2021) NIA2 Social Research Final Report
The Commission covers economic infrastructure within the UK governmentrsquos competence Many areas of economic infrastructure are devolved see Chapter 1 This chapter therefore focuses on areas within the UK Governmentrsquos competence
0 5 10 15 20 25 30 35
Disruption the amount of disruptionwe have to deal with
Legacy the state of infrastructure thatwe pass on to future generations
Resilience how well our infrastructure standsup to the challenges thrown at it
Investing now to save in the long term
Quality making sure that infrastructureis as good as it possibly can be
Environment the impact of our infrastructurehas on the environment
Percentage
2017 2021
46
National Infrastructure Commission | The Second National Infrastructure Assessment Baseline Report
31 Infrastructure resilience
Climate change will increase the challenge of resilience across sectors
Economic infrastructure has generally proved resilient to shocks and stresses over recent years119 Figure 32 shows the change in service interruptions over time for sectors where data is available This offers only a partial picture with fewer energy supply interruptions over time spikes in sewer flooding linked to extreme weather and increased rail cancellations
Figure 32 Levels of service interruption fluctuate over time
Change in measures of service interruption for selected infrastructure sectors for periods where data is available indexed to 2019-20
0
50
100
150
200
250
300
Inde
x 2
019
-20
= 10
0
Year
Energy - supply interruptions Water - sewer flooding Water - supply interruptions Transport - rail cancellations
Cyclone Uriah
Storms Desmondand Eva
Beastfrom the
East
Heavyrainfall events
Source Ofgem data request (2021) Average minutes lost to customer per year Ofwat (2019) Sewer Flooding flooded properties per 10000 connected to sewerage England and Wales CCW (2012-16) and Discover Water (2016-20) Average minutes of lost water access per property per year in England and Wales Office of Rail and Road (2021) Train cancellation score
However it will become harder to maintain and improve resilience in coming decades as climate change increases risks to economic infrastructure Key climate projections are for
z wetter winters and more intense summer storms which will increase the frequency of river and surface water flooding and with heavy or long term rainfall likely to increase incidences of landslides or subsidence
z rising sea levels around the UK which in combination with the increasing intensity of storms will exacerbate coastal erosion and flooding
z drier summers which will reduce the amount of water available and require between 3500 and 4000 million litres per day of extra capacity by 2050 to protect England from extreme drought (drought with a 02 per cent annual chance)
47
National Infrastructure Commission | The Second National Infrastructure Assessment Baseline Report
z heat increases with the greatest warming occurring in the South East and summer heatwaves becoming more common putting more pressure on infrastructure assets120
Figure 33 Climate change is likely to lead to hotter drier summers and warmer wetter winters in the UK
Met Office central projections of forecast changes for mean summer surface air temperature (left) summer precipitation (centre) and winter precipitation (right) for 2061-2080 relative to a 1981-2000 baseline121
Source Met Office (2018) UKCP18 Land Projections Science Report
All infrastructure sectors must adapt as the incidence of extreme weather increases The Climate Change Committeersquos 2021 Climate Change Risk Assessment describes risks to infrastructure sectors that require further action which include
z risks to infrastructure assets and services including
minus risks to transport from high and low temperatures high winds lightning slope and embankment failure
minus risks to infrastructure from coastal change including transport and waste
minus risks to infrastructure services from river and surface water flooding including transport electricity and wastewater treatment
minus risks from cascading failures in infrastructure networks including energy water transport and digital
48
National Infrastructure Commission | The Second National Infrastructure Assessment Baseline Report
z risks that infrastructure can protect society against including
minus risks to public water supplies from reduced water availability
minus risks from river and surface water flooding122
Risks to infrastructure society and public health from flooding and coastal change water scarcity and pollution are highlighted in the Environment Agencyrsquos third adaptation report to government123 The government will set out progress in responding to identified climate risks along with a monitoring and evaluation framework as part of the next National Adaptation Programme due in 2023124
Preparing for risks to infrastructure assets and services
Infrastructure owners and operators regulators and government all need to prepare for climate risks In its 2020 study Anticipate React Recover the Commission recommended
z a comprehensive set of resilience standards developed by the government for the energy water digital road and rail sectors and supported by clear duties on resilience for infrastructure regulators
z regular stress testing by operators to understand the resilience of infrastructure systems and to identify and address vulnerabilities
z long term resilience strategies developed by operators with guidance and scrutiny from the regulators125
The government published its response to the recommendations on 15 September 2021 It accepted the Commissionrsquos recommendations on standards and stress testing in principle but said that decisions on implementation will be taken as part of the forthcoming National Resilience Strategy expected in 2022126
Renewable sources of electricity like wind turbines and solar panels are reliant on the weather which means that extreme weather may present risks to generation The Commission is working with the Met Office and the Climate Change Committee to develop a data set which can help test the resilience of future electricity systems to extreme weather events127
However there remain significant resilience challenges particularly around asset management that the Commission has not yet considered
Resilience must be embedded in asset management approaches
Good asset management requires managing infrastructure assets so that they can deliver services in a cost effective and timely way128 Government regulators and infrastructure operators need to strike a balance between short term cost saving measures which could reduce resilience and providing excessive resilience at high cost This will be increasingly important for maintaining and improving resilience as pressures on assets increase And different approaches may be needed to increase resilience to low probability high impact incidents such as flooding while also responding to the risk of accelerated deterioration from more gradual changes in weather conditions
There is already concern about the condition of assets in some sectors The UK is still reliant on infrastructure built during the nineteenth century including roads railways tunnels and sewers
49
National Infrastructure Commission | The Second National Infrastructure Assessment Baseline Report
Some older components such as railway earthworks and embankments can be at greater risk of failure as they were not constructed to modern design standards of resilience to extreme weather129 In the water sector around 13 per cent of water pipes are over 100 years old130 which may increase the risk of leakages and bursts And there are concerns that maintenance and replacement is not keeping pace with the rate of deterioration for assets like water pipes and local roads131 As climate change accelerates deterioration the costs and challenges of asset management could increase
In some cases deterioration is not noticed until a failure occurs However better data and processing technologies such as sensors combined with predictive asset management models could provide more detailed information on asset condition and performance helping to prevent failures and better target maintenance interventions or renewals132
Decision making frameworks can also undervalue maintenance and disincentivise good asset management For example funding for the Environment Agencyrsquos maintenance budget has been agreed for varying periods of time from four year periods to annually133 This can make planning for and undertaking maintenance of flood assets less efficient By contrast in the regulated water sector Ofwat includes an allowance for maintenance capital expenditure over the five year Price Review period134 Approaches like this could help decision makers value maintenance needs over a longer time period
Challenge 5 Asset management and resilience ndash the Commission will consider how asset management can support resilience barriers to investment and the use of data and technology to improve the way assets are maintained
Preparing infrastructure to protect society against climate risks
Infrastructure can protect society against drought and floods While the UK currently has a water supply surplus of around 950 million litres per day above demand135 hotter drier summers will increase the risk of drought And more than five million properties in England ndash around one in every six ndash are already at risk of flooding136 with this number likely to increase due to climate change Of those properties over three million are at risk of surface water flooding which is more than the number at risk of river and coastal flooding combined137
In the first Assessment the Commission recommended action to increase resilience to drought by halving leakage by 2050 implementing compulsory metering by the 2030s and developing additional supply infrastructure and a national water transfer network138 The government endorsed the Commissionrsquos recommendation to increase drought resilience to a 1 in 500-year drought (02 per cent annual chance)139 and Ofwat required water companies to reduce water taken from the environment leakage and household water consumption between 2020 and 2025140 Ofwat has also allocated pound469 million for companies to investigate and develop proposals for new strategic infrastructure to address long term drought challenges141 In the South East Portsmouth Water is already building the Havant Thicket reservoir which will provide around 21 million litres of water per day when finished reducing drought risk in the wider region142 The Commission will continue to monitor governmentrsquos progress on these recommendations but will not undertake new work in the second Assessment
50
National Infrastructure Commission | The Second National Infrastructure Assessment Baseline Report
The Commission also made recommendations on floods in the first Assessment It recommended that government develop a flood strategy to deliver a nationwide standard of resilience to coastal and river flooding with an annual likelihood of at least 05 per cent or 01 per cent in densely populated areas supported by a rolling six year programme of funding143 The government has partially endorsed these recommendations The March 2020 budget announced an investment of about pound52 billion between 2021 and 2027 to protect against flooding in England which further announcements have brought closer to pound56 billion144 While rejecting specific standards the government committed to develop a set of indicators to measure improvements in resilience to flooding The Environment Agency has revised its National Flood and Coastal Erosion Risk Management Strategy for England and the National Planning Policy Framework has also been revised to clarify the approach to flood risk management in England145 The Commission will continue to monitor governmentrsquos progress and hold government to account for delivering on its commitments but will not undertake new work on river and coastal flooding in the second Assessment
A lack of reliable data meant that it was not possible to consider surface water flooding or wastewater in detail for the first Assessment The Commission instead recommended that all relevant organisations ensure that the necessary data be available for the second Assessment The Commission will consider surface water management as part of its upcoming work
Surface water management is a key challenge
Surface water flooding occurs when the volume of rainfall exceeds the capacity of drainage systems Water cannot quickly drain away or soak into the ground Instead it collects at low elevations causing flooding This type of flooding is often localised and is disruptive to homes and businesses It can also cause serious pollution to rivers with impacts on water and environmental quality biodiversity and public health and amenities The continued risks of surface water flooding were highlighted by incidents during the summer of 2021146
The government is making piecemeal improvements147 but the scale of the challenge may require a more fundamental review of current arrangements Multiple organisations are currently responsible for assets that impact on surface water flooding including local authorities highways authorities and water companies Water company sewers have a key role to play in providing drainage and reducing the risks of surface water flooding ndash if capacity in the sewerage system is not available then sewers overflow Seven per cent of water bodies in England such as lakes and rivers are failing good ecological status due to intermittent stormwater overflows148 While serious pollution incidents caused by water and sewerage companies decreased from 2002 they have plateaued since 2014 at an unacceptable level and further action is needed to address this149 And while properties are eight times less likely to suffer sewer flooding than they were in 1990 climate change could increase this risk150
In the second Assessment the Commission will carry out a dedicated study as requested by government in the 2021 Spending Review on reducing the risks of surface water flooding151 This will undertake analysis to gain a better understanding of the challenge and the opportunities to address it in the short and long term The Commission will determine the improvements needed to Englandrsquos drainage systems to manage and mitigate surface water flooding in urban and rural areas both now and in the future It will assess current approaches to manage surface water and consider which options provide the greatest resilience and value for money This may include improving current levels of governance performance preparedness and understanding local flood planning spatial and development planning data sharing funding and investment It will also include opportunities for
51
National Infrastructure Commission | The Second National Infrastructure Assessment Baseline Report
harnessing nature based solutions such as sustainable drainage systems blue green infrastructure and natural flood management alongside hard engineering solutions that increase sewer capacity for new and existing developments
Challenge 6 Surface water management ndash the Commission will consider actions to maximise short term opportunities and improve long term planning funding and governance arrangements for surface water management while protecting water from pollution from drainage
The Commission will deliver this as a separate study and report to government by November 2022 in advance of its other recommendations
32 Infrastructure and natural capitalAlongside climate change there is another environmental crisis Global assessments show that nature is declining at rates unprecedented in human history with accelerating rates of species extinction and severe disruption to ecosystem services152 Infrastructure contributes to this decline but can also help prevent it
The decline in nature can be measured through impacts to lsquonatural capitalrsquo This term refers to the natural assets that society and the economy depend upon including the atmosphere forests fisheries rivers biodiversity land and minerals and both the living and non-living aspects of ecosystems These provide environmental services and benefits such as food timber minerals fresh water clean air and protection from flooding drought heatwaves and landslides More detail on natural capital can be found in the Commissionrsquos discussion paper Natural Capital and Environmental Net Gain153
There is a two way relationship between infrastructure and natural capital
z infrastructure can have a negative impact on natural capital assets for example through air and water pollution damage to habitats and biodiversity or the extraction of minerals for construction
z infrastructure can deliver benefits for natural capital for example by preventing harmful waste products from entering the natural environment through the provision of protected natural habitats and connecting corridors for species along linear infrastructure and the use of sustainable drainage systems for mitigating flood risk
z changes in the environment can increase the costs of infrastructure for example if roads and railways need to withstand higher temperatures (see section 31)
z natural capital approaches can reduce the demand for infrastructure for example natural water catchment management reduces demand for flood defences
z natural capital is a prerequisite for some infrastructure such as inputs of freshwater to water supply networks ndash in these cases the resilience of a sector is linked to the environmental service which underpins it154
The governmentrsquos 25 Year Environment Plan sets out objectives to improve natural capital and ecosystem services155 The Commission considered many of these objectives in its previous recommendations as described in figure 34 Objectives on climate change are not included in this table as they are covered in Chapter 2
52
National Infrastructure Commission | The Second National Infrastructure Assessment Baseline Report
Figure 34 The Commission has made recommendations to support many of the objectives in the governmentrsquos 25 Year Environment Plan
Selected objectives in the 25 Year Environment Plan and the Commissionrsquos related recommendations and work
Selected objectives from the 25 Year Environment Plan
Commission recommendations and work
Minimising waste
National Infrastructure Assessment recommendations on a municipal waste recycling target of 65 per cent by 2030 including a plastic packaging recycling target of 75 per cent by 2030 incentivising recyclable packaging and product design restricting hard-to-recycle plastics and a consistent collections standard for municipal waste156
Clean air
National Infrastructure Assessment recommendations to prepare for 100 per cent electric vehicle sales by 2030 enable the move to highly renewable power system and support the transition to zero carbon heating157
Freight study recommendations to enable zero carbon freight by 2050158
Clean and plentiful waterNational Infrastructure Assessment recommendations on drought resilience through increasing supply and reducing demand for water159
Reducing the risk of harm from environmental hazards
National Infrastructure Assessment recommendations on a strategy to deliver a nationwide standard of flood resilience by 2050 which reduces the annual likelihood of flooding to 05 per cent and 01 per cent for densely populated areas160
Thriving plants and wildlife
Design Principles for National Infrastructure Infrastructure projects should make interventions to enrich our ecosystems seek to deliver biodiversity net gain contribute to the restoration of wildlife on a large scale and protect irreplaceable habitats161
Natural capital and environmental net gain committed the Commission to promote environmental net gain for all infrastructure projects and develop a set of natural capital principles for infrastructure to complement and expand on the Design Principles162
Using resources from nature more sustainably and efficiently
Design Principles for National Infrastructure includes consideration for using resources for construction of infrastructure more sustainably and efficiently163
Enhancing beauty heritage and engagement with the natural environment
Design Principles for National Infrastructure infrastructure should give places a strong sense of identity form part of national cultural heritage and make a positive contribution to local landscapes within and beyond the project boundary164
Source Adapted from the Commissionrsquos Natural capital and environmental net gain discussion paper
53
National Infrastructure Commission | The Second National Infrastructure Assessment Baseline Report
Natural capital in the second Assessment
In the second Assessment the Commission will assess the impact of its recommendations on natural capital as part of its cross cutting analysis (see Chapter 5) It will also develop a set of natural capital principles for infrastructure which provide guidance on how best to deliver environmental net gain
The Commission will consider specific environmental objectives through challenges in the second Assessment including
z clean air the Commission will make further recommendations to reduce the impacts on air pollution from transport and energy (see Chapters 2 and 4)
z clean and plentiful water the Commission will consider pollution from wastewater as part of challenge 6 (see above)
z reducing the risk of harm from environmental hazards the Commission will make recommendations on surface water flooding as part of challenge 6 (see above)
In the second Assessment the Commission will consider the objective on minimising waste in more detail There has been some progress on this in recent years The Commissionrsquos recycling targets from the first Assessment were partially adopted in the Resources and waste strategy for England albeit with a later target date of 2035165 The government has committed to a national standard of recycling for households and businesses by 2025 and separate food waste collection (to enable biogas production) by 2025 as recommended by the Commission and consulted on making producers responsible for the costs of managing packaging when it becomes waste Some of these measures will be implemented through the Environment Act166
However as explained in Chapter 2 the net zero target means that the Commission will need to revisit its work on waste in the second Assessment The government has also committed to move to a more circular economy which could have wider implications for the sector
The waste sector can protect the environment by enabling the move to a more circular economy
Waste infrastructure prevents harmful products from entering the natural environment by enabling the collection sorting treatment and disposal of waste Recycling plays a central role by keeping materials in productive use which reduces demand for the extraction of raw materials and the need for more carbon intensive and polluting forms of waste disposal Recycling rates have increased since 2000 with 43 per cent of local authority collected waste in England recycled in 2019 Internationally comparable data is only available for the UK rather than England but the UKrsquos recycling performance is broadly comparable with similar countries However rates have stagnated in recent years167
54
National Infrastructure Commission | The Second National Infrastructure Assessment Baseline Report
Figure 35 An international comparison of municipal recycling shows the UK lagging behind the best performers
Municipal recycling rates across comparative countries from 2008 and 2018
0
10
20
30
40
50
60
70
80
90
100
Germany South Korea Netherlands France UnitedKingdom
Spain Canada Japan
Mun
icip
al re
cycl
ing
rate
per
cent
age
Country
2008 2018
Source OECD (2021) Municipal Waste Generation and Treatment Eurostat (2021) Recycling rate of municipal waste
The government has framed its waste objectives as part of the move to a more circular economy This concept refers to systemic changes across the economy which seek to
z prevent waste by keeping products and materials in use for longer favouring activities that preserve value in the form of energy labour and materials and designing for durability repair reuse and remanufacturing
z increase recycling to keep products components and materials circulating in the economy
z conserve natural resources by avoiding the extraction and use of non-renewable resources and promoting the use of renewable ones168
The Commissionrsquos social research suggests the public supports further action Seven in ten respondents agreed that companies should take more responsibility for recycling and disposing of packaging waste even if it raises the prices of products Respondents also raised concerns around overconsumption excess packaging and the transparency of waste disposal processes169
The Commissionrsquos work will consider additional changes needed in the waste sector to enable the move to a more circular economy and reduce the environmental impacts of waste This will include looking at ways to increase recycling rates for municipal and construction waste deliver the infrastructure needed to achieve net zero and increase resilience to possible future restrictions on waste exports The Commission will also consider interdependencies with the other infrastructure sectors in its remit
55
National Infrastructure Commission | The Second National Infrastructure Assessment Baseline Report
This includes demand for energy and water and the role of energy from waste It also includes challenges and opportunities associated with construction waste from different infrastructure sectors as they take steps to improve resource efficiency and reduce waste
This will require open and transparent data for example on the capacity of recycling infrastructure The government accepted the Commissionrsquos recommendation in the first Assessment for a common data reporting framework for businesses that handle commercial and industrial waste The Environment Act includes powers to introduce a digital system to track waste movements170
Challenge 7 Waste and the circular economy ndash the Commission will examine the role of the waste sector in enabling the move towards a more circular economy
33 Challenges for the second AssessmentAs set out in this chapter the key challenges the Commission will consider in the second Assessment related to climate resilience and the environment will be
Challenge 5 Asset management and resilience ndash the Commission will consider how asset management can support resilience barriers to investment and the use of data and technology to improve the way assets are maintained
Question 13 In what ways will current asset management practice need to improve to support better infrastructure resilience Your response can cover any number of the Commissionrsquos sectors
Challenge 6 Surface water management ndash the Commission will consider actions to maximise short term opportunities and improve long term planning funding and governance arrangements for surface water management while protecting water from pollution from drainage
The Commission will carry out a separate call for evidence on this challenge as the Commission will deliver this as a separate study and report to government by November 2022 in advance of its other recommendations
Challenge 7 Waste and the circular economy ndash the Commission will examine the role of the waste sector in enabling the move towards a more circular economy
Question 14 What are the barriers to and solutions for expanding recycling capacity both now and in the future to deliver environmental and net zero targets
Question 15 What is the likely environmental impact of waste streams from construction across economic infrastructure sectors over the next 30 years and what are the appropriate measures for addressing it
Details on how to respond to the call for evidence questions are set out in Chapter 5
56
National Infrastructure Commission | The Second National Infrastructure Assessment Baseline Report
The government has set itself the ambition of lsquolevelling uprsquo outcomes across the UK reducing disparities between different towns cities and regions Infrastructure can support this goal In the second Assessment the Commission will examine the most significant unresolved infrastructure questions that relate to levelling up ndashfocusing on the challenges of urban mobility and congestion and interurban transport
Large cities and some towns outside London are not achieving their productivity potential The reasons for this are varied and many have been entrenched for decades Sustained local growth needs to be rooted in local strategies covering a range of coordinated policy areas While infrastructure is a necessary condition for economic growth it is rarely sufficient Instead infrastructure should form part of wider economic strategies alongside other areas like skills and inward investment
Before the Covid-19 pandemic many major cities suffered from congestion and poor public transport connectivity preventing goods services and people from travelling in an efficient and sustainable way Overcrowded or slow transport networks limited the ability of businesses and workers to locate in dense city centres which has been a major barrier to urban productivity and growth Addressing this would benefit not just city centres but also their wider regional area
Equally the countryrsquos interurban road and rail networks connect every city and town together enabling people and goods to travel between them ndash ensuring that these networks are prepared for the demands of the future will help maximise their economic impact in every region
Other infrastructure sectors also support productivity and wellbeing Digital infrastructure can help improve productivity by improving connectivity and new energy related industries such as greenhouse gas removals or hydrogen production may create economic opportunities for certain towns and cities which could form part of locally led wider economic strategies for those places
41 Infrastructure and levelling upThe government has set itself the ambition of lsquolevelling uprsquo outcomes between and within regions to improve opportunity and boost livelihoods171 Levelling up has a variety of interpretations Common to all of these is the aim to reduce disparities that exist between places172 These disparities are driven by a mix of economic social and political factors There is no single policy area ndash including infrastructure policy ndash that can singlehandedly lsquolevel uprsquo a place Infrastructure is necessary but not sufficient to support local economic growth and infrastructure interventions should form part of a wider economic strategy
Different places will always play different roles in the economy The productivity potential of different places varies ndash different parts of the country have different economic densities For example it would not be realistic to aim for the same productivity in rural Cumbria as in central Manchester
4 Supporting levelling up
57
National Infrastructure Commission | The Second National Infrastructure Assessment Baseline Report
But even narrowing economic disparities between places with comparable geographic characteristics would be a major success While no two places are exactly the same the Commission will look at broadly comparable places to assess their economic potential
Levelling up the country should not be seen as an alternative to improving productivity nationally The goal should be to support faster growth in lower productivity places while maintaining or improving the economic performance of high productivity places Regional rebalancing must also not come at the expense of the commitment to achieving net zero Improvements in transport connectivity must be delivered alongside reductions in carbon emissions in line with the trajectory set out by the Climate Change Committee Developments in some sectors particularly energy to deliver net zero may also provide new economic opportunities for some areas
Many areas of economic infrastructure including much of the transport sector is devolved to Northern Ireland Scotland and Wales (see Chapter 1) The Commissionrsquos role is to advise the UK Government This chapter therefore focusses on areas within the UK Governmentrsquos competence
England has a wide and longstanding variation in outcomes
England has wide variations in economic outcomes and quality of life173 Geographic variation in economic outcomes in particular is a long standing self reinforcing problem that is complex to address174 Infrastructure alone cannot address these problems
Figure 41 Regional variation in productivity has endured over time
GDP per worker by region and nation in the UK relative to the UK average 1901-2001
70
80
90
100
110
120
130
140
1901 1911 1921 1931 1941 1951 1961 1971 1981 1991 2001
Inde
x of
GD
P pe
r wor
ker
GB
= 10
0
Year
London South East East Anglia South WestWest Midlands East Midlands North West North EastYorkshire amp Humberside Wales Scotland
Note Data for 1941 is missing in the source data so a dummy value is created such that there is a constant linear change between 1931 and 1951
Source Geary and Stark (2016) What happened to regional inequality in Britain in the twentieth century
58
National Infrastructure Commission | The Second National Infrastructure Assessment Baseline Report
Productivity and wages which are closely related vary widely both within and across regions175 As similar types of people and businesses tend to cluster together some variation between places is inevitable and many other countries also face persistent economic variation between regions However the extent of regional variation within England appears to be unusually high compared to other countries176 England is also unusual in that few of its major cities apart from London have productivity above the national average177
Figure 42 English cities have productivity below the national average unlike in international comparators
GDP per worker percentage difference compared to national average in England and comparable countries
Source OECD (2021) Labour productivity Metropolitan areas OECD (2021) Level of GDP per capita and productivity for 2018 (2016 for France and Japan)
-40 -30 -20 -10 0 10 20 30 40 50
Seo
Gwangsan
Dalseong
Gimhae
Seoul
Seville
Valencia
Saragossa
Barcelona
Madrid
Bordeaux
Strasbourg
Toulouse
Lyon
Paris
Berlin
Cologne
Hamburg
Frankfurt
Munich
The Hague
Eindhoven
Rotterdam
Utrecht
Amsterdam
Okayama
Sendai
Nagoya
Osaka
Tokyo
Leeds
Liverpool
Birmingham
Manchester
London
Kore
aSp
ain
Fran
ceG
erm
any
The
Net
herl
ands
Japa
nEn
glan
d
GDP per worker percentage difference compared to national average
Co
untr
y an
d se
lect
ed c
itie
s
59
National Infrastructure Commission | The Second National Infrastructure Assessment Baseline Report
Disparities also exist within regions Rural areas often have low productivity while all regions have some hubs of manufacturing or knowledge intensive services with higher productivity such as those in Cheshire Sunderland and York178 There are disparities within cities too in Greater Manchester productivity in Trafford is over a third higher than in Oldham179
Figure 43 There are wide differences in productivity among local areas in the UK
Variation in GVA per hour worked across the UK by ITL2 subregions 2019
Source ONS (2021) Subregional productivity labour productivity indices by UK ITL2 and ITL3 subregions 2019
-30 -20 -10 0 10 20 30 40 50 60
Cornwall and Isles of ScillySouth Yorkshire
Northern IrelandWest Wales and The Valleys
Shropshire and StaffordshireLincolnshire
CumbriaDorset and Somerset
DevonTees Valley and Durham
East Yorkshire and Northern LincolnshireMerseyside
Northumberland and Tyne and WearWest Yorkshire
North YorkshireDerbyshire and Nottinghamshire
East WalesLancashire
Leicestershire Rutland and NorthamptonshireGreater Manchester
West MidlandsSouthern Scotland
East AngliaHighlands and IslandsWest Central Scotland
Herefordshire Worcestershire and WarwickshireUK average
EssexKent
Bedfordshire and HertfordshireGloucestershire Wiltshire and BathBristol area
North Eastern ScotlandCheshire
Eastern ScotlandSurrey East and West SussexHampshire and Isle of Wight
Outer London - SouthOuter London - East and North East
Berkshire Buckinghamshire and OxfordshireInner London - East
Outer London - West and North WestInner London - West
GVA per hour worked percentage difference compared to UK average
ITL2
Reg
ion
60
National Infrastructure Commission | The Second National Infrastructure Assessment Baseline Report
There are also disparities in quality of life between and within places London and the South East score highly for healthy life expectancy but London is lowest for life satisfaction In London only 26 per cent of people have a very high level of satisfaction with their life compared with consistent scores between 30 and 32 per cent in all other regions Healthy life expectancy is lowest in the regions of the North180
Box 41 The Commissionrsquos objectives and levelling up
Supporting levelling up aligns with all four of the Commissionrsquos objectives which are to
z Support sustainable economic growth across all regions of the UK By supporting growth in lower productivity places while maintaining or improving the economic performance of higher productivity places reducing disparities between places will support sustainable economic growth across all regions of the UK
z Improve competitiveness Improving access to markets labour and capital either through transport or digital connectivity can improve competitiveness And contributing to the economic transformation of places through infrastructure investment can support both levelling up and competitiveness if it leads to the development of new globally significant clusters and assets181
z Improve quality of life Infrastructure interventions to support levelling up can directly contribute to higher quality of life in places with poor provision ndash for example by connecting people to services concentrated in cities reducing air pollution and improving reliability of services Contributing to improved economic outcomes will also support improved quality of life in some places
z Support climate resilience and the transition to net zero carbon emissions by 2050 Ensuring universal provision of infrastructure such as flood defences and water supply can support both levelling up and climate resilience
The Commissionrsquos social research found that a quarter of people surveyed prioritised infrastructure driving regional growth and rebalancing growth more fairly across the country as one of the most important goals for the lsquovisionrsquo of the UKrsquos infrastructure in 30 yearsrsquo time182
Variations are caused by multiple interacting factors
There are several factors that interact to create self reinforcing cycles of economic success or deprivation in different places183 Highly skilled people and businesses tend to cluster together making individuals more productive and able to earn higher wages184 Businesses in highly skilled sectors also tend to cluster together making them more productive Highly skilled workers also attract highly skilled businesses and vice versa This effect is known as lsquoagglomerationrsquo
These clusters also attract other high end businesses that concentrate in areas where there are well paid people who can pay for their services The availability of these amenities and other services attracts other highly paid people This high demand pushes up property prices in the area further concentrating higher paid workers and pricing out people with lower incomes185
61
National Infrastructure Commission | The Second National Infrastructure Assessment Baseline Report
These effects also work in reverse People on low incomes are likely to move to areas with low property prices and more affordable shops and services clustering people on lower incomes and businesses that employ lower skilled workers186
Some cities have gained from these agglomeration effects as the economy has shifted towards highly skilled services187 while low incomes have persisted in some struggling areas188 Towns near to productive cities tend to have higher incomes than those near less productive cities189 Certain geographical characteristics can also increase the attractiveness of some places for new and growing industries For example the offshore wind industry is centred in windy coastal places near the North Sea offering opportunities to Hull Grimsby and the North East190
Current variations may not continue New technologies that lead to the development of new industries (for example the transition to decarbonised energy see Chapter 3) or changes in how work is done for example increased levels of working from home driven by digital technologies and following the Covid-19 pandemic may change current patterns of where people and businesses choose to locate191
Variations in economic outcomes also influence the quality of life of people living in these places Employment status is a strong predictor of life satisfaction192 and the economic fortunes of an area influence a wide range of outcomes that impact how happy people are193 Patterns of local productivity shape an individualrsquos quality of life view of the world (including perceptions of other regions) and opportunities which can differ profoundly between low and high productivity places194 However a good quality of life reflects a broad range of factors including relationships health education and economic outcomes195 Quality of the built environment access to green space and sense of community all influence how happy people are196 and some places such as London perform well overall on economic outcomes but poorly against some quality of life metrics197 In order to improve all areas of quality of life policymakers also need to look at other causes
Addressing these disparities is hard
Addressing variations in economic performance and quality of life is not straightforward There is a long history of government attempts to address geographical variation in economic outcomes with at best mixed success198
Sometimes interventions move economic activity from one place to another rather than increasing total activity ndash an effect known as lsquodisplacementrsquo Shifting economic activity from a relatively successful place to a less successful one might be worthwhile even if there is no net gain but evidence suggests that displacement instead often shifts activity from one struggling area to another199
There is also an element of luck in whether any particular attempt is successful Successful place based policies elsewhere have brought infrastructure decisions into wider economic strategies that include issues like skills and industrial policy200 These strategies work best with governance at the level they are intended to influence
Places also need private sector investment to successfully level up Successful long term infrastructure strategies can help attract private investment by giving investors confidence that their investments will be aligned with any new or improved infrastructure that industry may require These strategies work best when governance is at the level they are intended to influence201
62
National Infrastructure Commission | The Second National Infrastructure Assessment Baseline Report
Infrastructure can help address these disparities
The Commission has set out its view on how infrastructure can support growth and levelling up in Growth across regions202 This discussion paper identified three pathways for infrastructure to help achieve economic outcomes in different areas
z Addressing constraints to growth Enabling future growth in congested places by investing in transport capacity upgrades This allows greater clustering by facilitating greater density in these areas These interventions primarily support growth in dense places with high productivity potential (primarily cities) furthering the virtuous cycle of agglomeration although surrounding towns also benefit from increased growth in cities203
z Contributing to transformation Prioritising infrastructure investment alongside wider policies (eg skills research and development) to increase growth in low productivity places with an emphasis on promoting a positive cycle of investment and growth This could include investing in the infrastructure required to enable new and emerging industries to expand in a specific location or improving connections from towns into their nearest city204
z Universal provision This involves setting common or minimum standards for infrastructure services and working to reduce differences in access across the UK These interventions will contribute to improvements in quality of life resilience to shocks and other societal outcomes
Supporting growth across regions can also help improve quality of life as economic outcomes are one driver of quality of life outcomes205 However infrastructure interventions can also directly contribute to higher quality of life in places for example by connecting people to services concentrated in cities reducing congestion and pollution and improving reliability of services The Commission will explore this relationship further in its forthcoming discussion paper on its quality of life objective and will use this to consider infrastructurersquos role in improving quality of life outcomes in the second Assessment The Commission has already published a literature review which sets out the evidence base on the interaction of infrastructure and quality of life206
While better infrastructure can benefit both productivity and quality of life the largest and most regionally significant projects are likely to impact on outcomes primarily through improving economic opportunity The Commission will take account of where places are not reaching their economic potential to identify where interventions are likely to deliver significant benefits ndash for example identifying where growth could be unlocked by increasing capacity in congested city centres ndash and then consider how the required interventions can improve both productivity and quality of life
Infrastructure interventions are also likely to have the most impact in places where population concentration creates high demand so there is a relationship between infrastructure and housing The Commission considers the potential interactions between its infrastructure recommendations and housing supply but housing policy itself is not in its remit
Locally led infrastructure strategies should form part of wider economic plans
While infrastructure has an important role to play in supporting economic growth and quality of life and thereby reducing disparities between places207 it is not the whole solution Other factors like skills and education also have an important role in delivering economic and quality of life outcomes and therefore need to be aligned to infrastructure investment208
63
National Infrastructure Commission | The Second National Infrastructure Assessment Baseline Report
And for investments to be most effective investment decisions need to be taken at the right level and ensure all interventions work together for different places For infrastructure to best support levelling up the Commission has identified three key conditions
z infrastructure strategies should form part of wider economic strategies
z cities and towns should have devolved powers and funding to develop locally led infrastructure strategies with central government oversight reserved for only the biggest projects
z government should make expert support and advice available to help those local authorities where capacity and capability are obstacles to developing and delivering their infrastructure strategies
The first Assessment recommended that cities should have the powers and funding they need to pursue ambitious integrated strategies for transport employment and housing209 And in Infrastructure Towns and Regeneration the Commission concluded that the present funding system for local transport hinders the development of effective strategies and plans210 To address this the Commission recommended that central government simplify these funding streams and provide county councils and unitary authorities responsible for strategic transport planning with devolved five year budgets for local transport211
Improvements in the transport sector can have the greatest impact
While all infrastructure sectors support productivity and quality of life some have greater potential to play a role in reducing disparities than others
Transport is the sector with the most opportunity for helping to reduce disparities between places Transport can help address constraints to growth and with the right conditions contribute to economic transformation in particular places212 Larger cities in particular suffer from congestion and some places have poorer interurban connectivity than others213 Transport connections can increase the density of high productivity clusters of people and businesses in cities facilitate trade between cities make places more attractive to live and work in and encourage investment in places214 Effective distribution of freight is also essential to growth in any area215 However transport is not the whole solution ndash transport investment needs to come alongside other investments as part of a wider economic strategy in order to contribute to transformation
Although airports can have an impact on economic outcomes ndash they facilitate global trade provide jobs and can be globally significant assets ndash any consideration of aviation and levelling up is dependent on future demand for air travel following the Covid-19 pandemic and the approach to expanding runway capacity in the South East which is currently unclear The second Assessment will therefore not further consider airport capacity although interurban connectivity to international gateways will be included
Digital connectivity plays an increasingly important role in society and the economy by increasing the economic reach of local businesses enabling new ways of working more productively and enhancing connectivity to support quality of life216 While variations between regions exist government has a clear strategy to deliver near universal coverage of gigabit broadband and mobile 4G217 though it remains critical that this is effectively rolled out to rural areas and towns to ensure genuinely universal provision The Commission will continue to monitor progress in these areas218
64
National Infrastructure Commission | The Second National Infrastructure Assessment Baseline Report
Energy is a universal service and spatial variations are not a key driver of productivity disparities219 However new energy related industries and zero carbon infrastructure may create economic opportunities for certain towns and cities which could form part of locally led wider economic strategies for those places There may also be areas that are reliant on carbon intensive industries from which they will need to transition away from and doing this may have short or longer term impacts on their local economies
Other infrastructure sectors can be important to growth and quality of life but are not considered in this chapter
z flood resilience is vital to economic growth and quality of life but can vary by area ndash in the first Assessment the Commission recommended a nationwide standard of flood resilience ndash the government partially endorsed the Commissionrsquos recommendations (see Chapter 3 and Annex C) and the Commission will continue to monitor governmentrsquos progress
z water and waste are universal services where coverage does not vary significantly or where variation does not significantly affect productivity220
42 Transport and levelling up
Transport provision varies between places
Many cities and regions suffer from poor public transport connectivity which creates barriers to mobility and impacts on quality of life221 Before the Covid-19 pandemic many major cities suffered from congestion especially in the largest cities and at peak times222
Transport connectivity represents how quickly it is possible for people to travel from where they live to other places they might need to go The Commission has developed a metric to illustrate the effectiveness of the transport network at moving people by car and public transport both within built up areas (urban connectivity) and between them (interurban connectivity) with higher scores indicating better connectivity223 Congestion can be calculated by the ratio between peak and off peak connectivity
Larger cities tend to have worse congestion and poorer connectivity
The effect of peak time congestion means that transport connectivity is worst in the largest built up areas In towns with a population of under 100000 connectivity at peak times has typically been around 10 per cent worse than off peak travel and virtually never more than 20 per cent worse ndash illustrated by the congestion graph in figure 44 (where a score of 08 means that congestion reduces connectivity performance by around 20 per cent) It is only cities of more than about half a million people that see the most serious congestion effects with connectivity 40-50 per cent worse at peak time These congested cities are spread through the regions of the country ndash of the ten most congested cities outside London three are in the North three are in the Midlands two are in the South West and two are on the south east coast224
This urban congestion is a product of the density in population and employment required for successful cities225 This most obviously manifests on roads where delays are caused when there are too many cars for the space available Public transport is an essential alternative to car travel in places that suffer from
65
National Infrastructure Commission | The Second National Infrastructure Assessment Baseline Report
congestion but without the right infrastructure congestion also affects how transit services operate with buses stuck in traffic and trains overcrowded Freight deliveries also suffer from congestion on roads and cannot easily be replaced with off road alternatives
Figure 44 Urban transport connectivity tends to be worse in larger towns and cities due to the effects of congestion
Urban connectivity at peak time for car and public transport urban car connectivity at off peak and urban car congestion in Englandrsquos most populated built up areas 2016
Source National Infrastructure Commission (2018) Transport connectivity dataset
As cities grow transport capacity can struggle to keep pace with demand creating a constraint on further growth People are only willing to commute for a certain amount of time on average around half an hour each way per day226 The impacts of congestion on travel times in cities therefore limits both the number of jobs available to people looking for work and the number of potential employees
0
01
02
03
04
05
06
07
08
09
11 10 100 1000 10000 100000
Rati
o o
f pea
k to
off
-pea
k co
nnec
tivi
ty
Population thousands (log scale)
b) Congestion
10 largest cities other cities other places
0
02
04
06
08
1
12
1 10 100 1000 10000 100000
Con
nect
ivit
y
Population thousands (log scale)
b) Public transport
10 largest cities other cities other places
0
02
04
06
08
1
12
1 10 100 1000 10000 100000
Con
nect
ivit
y
Population thousands (log scale)
a) Car
10 largest cities other cities other places
0
02
04
06
08
1
12
14
16
1 10 100 1000 10000 100000
Con
nect
ivit
y
Population thousands (log scale)
a) Off peak connectivity
10 largest cities other cities other places
66
National Infrastructure Commission | The Second National Infrastructure Assessment Baseline Report
for businesses to recruit from Not only does this reduce the productivity and wages of people and employers directly affected ndash slowing down the positive cycle of agglomeration effects set out in section 41 ndash but its effects ripple out into the surrounding region since more productive activity within cities can create more demand for other services that can be provided from towns nearby227
Figure 45 Public transport can provide much higher transport capacity than cars enabling higher density employment in city centres even if they are congested
Typical maximum capacity per lane (inbound passengers per hour)
Source National Infrastructure Commission (2018) National Infrastructure Assessment
The Covid-19 pandemic initially reduced congestion in cities as stay at home guidance meant people made fewer trips by car Public transport use also fell by 80 to 95 per cent and government gave emergency financial assistance to avoid the collapse of transport providers228 However congestion had already returned to high levels on urban roads by the time of the latest data in February 2021229 while lockdown restrictions were still in force and is likely to have increased further as motor traffic has more recently reached close to pre pandemic levels230
Nevertheless there remains scope for more significant longer term changes and it is too early to make confident forecasts for infrastructure demand for the long term Policy proposals for public transport investments will take into account the need to plan for and remain responsive in implementation to the range of possible future scenarios
Plans for urban transport will also need to address carbon emissions In the long run this will mean full electrification of cars as well as zero emission upgrades for buses goods vehicles and trains On-street charging for cars is a particularly significant issue in cities where many people do not have a driveway The Commissionrsquos recent report Infrastructure Towns and Regeneration recommended that government publish the electric vehicle charging infrastructure strategy followed by a roadmap for the rollout of electric vehicle charging infrastructure in towns and that local infrastructure strategies include an active role for the local authority in planning and managing the rollout of on street electric vehicle charging
In the shorter term before electrification of cars is complete enabling people to use public transport or active travel as an alternative to driving provides an opportunity to reduce emissions While the switch to electric vehicles will have significant environmental benefits it will also have significant fiscal consequences due to loss of fuel duty
720Car
1800Bus
2100Bus rapid transport
2880Tram
67
National Infrastructure Commission | The Second National Infrastructure Assessment Baseline Report
Public transport and demand management can help address congestion
Increasing public transport capacity is one option to address congestion ndash either by enabling car travel to be replaced with more space efficient buses or trams or by providing more space on faster rail connections from places further out Successful cities are likely to remain congested to some degree even with the very best infrastructure as more people come and use the additional capacity and some people will always prefer to travel by car But increasing the number of people who can commute in is necessary to support the higher densities of businesses and workers in city centres and enable agglomeration benefits231
Another option to reduce crowding on roads is demand management ndash which could include congestion charging for city centres or other measures to restrict car access to certain areas These measures could reduce overall use of cars resulting in either less congestion or an opportunity to reallocate road space to other purposes Congestion charging would also provide a new source of revenue to support public transport and help to ensure motoring taxes keep pace with the transition to electric vehicles However if public transport provision does not offer a genuine alternative to driving restrictions on road use could have a negative impact on economic outcomes
Approaches to congestion charging and wider questions of lsquoroad pricingrsquo can be sensitive as there is an assumption that the public are inherently opposed to such models232 Given the challenges set out above the Commission is keen to support an evidence based discussion of the options helping to open up debate and allow proper consideration of the costs and benefits of different approaches
As a starting point the Commission has used deliberative engagements in three cities across England to explore public attitudes to tackling urban congestion see box 42 which found a higher than expected level of support for congestion charging
Box 42 Deliberative engagements on tackling congestion
In early 2020 the Commission ran three deliberative engagements on urban congestion with members of the public in Bristol Nottingham and Manchester233 The Commission assembled a panel of experts from all sides of the debate including the RAC and the Campaign for Better Transport to review an evidence pack on the causes and impacts of urban congestion The Commission also appointed an independent evaluator to assess the fairness of the exercise Participants in each location were then given two days to consider the evidence speak to experts and discuss potential packages of responses including accepting congestion congestion charging and investing in public transport
Across all three groups despite initial opposition at the end of day two congestion charging was identified as at least part of the solution by 82 per cent of participants After considering the evidence participants felt that continuing with high congestion was not an acceptable option and that investing in public transport on its own would not be sufficient to reduce congestion While this was a very small sample size it does suggest that citizens are potentially open to congestion charging as part of the solution The Commissionrsquos recent national survey of more than 6000 participants also found 40 per cent of participants were willing (compared to 30 per cent unwilling) to accept congestion charging if proceeds supported public transport investment
68
National Infrastructure Commission | The Second National Infrastructure Assessment Baseline Report
The first Assessment recommended long term locally led investment in urban transport to allow greater density in city centres The Commission also set out principles and case studies for local infrastructure strategies and the devolved governance that should enable them to happen234 and highlighted that suburban towns may experience greater economic opportunity if they were better connected into city centres235
The government has made some progress in this area committing pound57 billion for intraurban transport settlements between 2022 and 2027 in eight out of the nine mayoral combined authorities outside London236 with funding allocated on a more stable basis than before Government also wants half of all journeys in towns and cities to be made by walking or cycling by 2030 ndash although walking and cycling will be more feasible in some places than others Government has committed pound5 billion over the current parliament for bus services and cycling237 with a new inspectorate to oversee spending and standards and a second Cycling and Walking Investment Strategy due this year In addition to the reforms set out in the National Bus Strategy it has also committed to support local authorities to build business cases and develop innovative sustainable transport policies238
However governmentrsquos current commitments may not be sufficient to deliver levelling up There is currently no pipeline of urban transport projects at the scale likely to be required in coming decades to address the impacts of congestion on growth and productivity in the busiest cities with the most growth potential Previous analysis undertaken by the Commission suggests that investment in the region of tens of billions above planned investment will be needed unless transport patterns following the Covid-19 pandemic are significantly different ndash enough to fund a wave of very large transport projects such as new tram lines and more urban rail capacity across a number of cities239 Part of this would be funded from locally raised income ndash in 2019-20 around pound2 billion of local transport investment was funded in this way240
Challenge 8 Urban mobility and congestion ndash the Commission will examine how the development of at scale mass transit systems can support productivity in cities and city regions and consider the role of congestion charging and other demand management measures
There are wide variations in interurban connectivity
There are wide variations in interurban connectivity between places However it is hard to discern clear patterns in the variation or identify why they exist Figure 46 shows how interurban connectivity performance by both car and public transport varies among built up areas in comparison to their population size Variation in interurban connectivity is not neatly explained by the size of a place as it is for congestion ndash large and small settlements both show significant variation However it is clear that public transport journeys are significantly slower than those by car although scores again vary among places of similar sizes
Similarly there is not a clear regional pattern in interurban connectivity see figure 47 There is a wide variation in performance among places in all regions in England However it is clear that transport provision is poor in many places Around 30 per cent of people living in towns say that they are unsatisfied with road services where they live241 The Commission noted in its Rail Needs Assessment that rail journeys between major cities in the Midlands and the North tend to be slower than those in London and the South East and slower than those in high productivity regions in the Netherlands and Germany particularly for short rail journeys242 The study also identified issues with rail reliability and overcrowding in the Midlands and the North that need to be addressed
69
National Infrastructure Commission | The Second National Infrastructure Assessment Baseline Report
Figure 46 Variation in interurban transport connectivity is not mainly explained by the size of a built up area
Interurban connectivity for Englandrsquos most populated built up areas by car and public transport 2016
Source National Infrastructure Commission (2018) Transport connectivity dataset
Figure 47 Interurban connectivity is relatively similar across different regions except London both by car and public transport and varies more within regions
Interurban connectivity by region at peak time 2016 ndash distribution of built up areas within each English region (median indicated by cross bars interquartile range by blue box main range by extended lines and statistical outliers by dots)
Source National Infrastructure Commission (2018) Transport connectivity dataset
00
02
04
06
08
10
12
14
16
18
20
1 10 100 1000 10000 100000
Con
nect
ivit
y
Population thousands (log scale)
a) Car
10 largest cities other cities other places
000
005
010
015
020
025
030
035
040
1 10 100 1000 10000 100000
Con
nect
ivit
y
Population thousands (log scale)
b) Public transport
10 largest cities other cities other places
04
70
National Infrastructure Commission | The Second National Infrastructure Assessment Baseline Report
Improving interurban transport may also be able to support levelling up
Improving interurban transport ndash for cars public transport passengers and freight ndash can facilitate trade between cities243 It can enable businesses to source a wider range and better quality of inputs to their supply chains by reducing the cost of distance It can also increase the size of market that any one provider can access allowing successful firms to grow benefit from economies of scale and potentially specialise in higher value niche services that would be uneconomic in smaller markets ndash further supporting the potential for agglomeration in specialised clusters In turn this increases the incentives on workers to specialise and upskill244
It can also make places more attractive to live and work in and in the case of large investments such as high speed rail facilitate investment Infrastructure can act as an anchor investment signalling to the market that locations are worth investing in because other people or businesses are also likely to move there ndash for example major stations and interchanges of nationally significant infrastructure projects offer significant potential for urban regeneration These major investments should maximise the potential for urban regeneration This helps to solve coordination problems where the value of private sector investment depends on other investors making similar choices245 New infrastructure can help provide confidence that particular areas will be suitable for the changing needs of new industries
Government is making major investments in interurban transport through the Road Investment Strategy High Speed 2 and ongoing upgrades to the rail network Investment in national roads is planned to increase by more than double between 2015-16 and 2024-25 while investment in rail is planned to increase by more than half over the same period246 This makes it vitally important that there is a comprehensive and strategic understanding of what the priority objectives and projects should be within this investment
Whilst there is variation in connectivity between places it is difficult to assess the relative impact this has on productivity and quality of life in different places that all have different economic strengths The Commissionrsquos data reflects the current connectivity of the transport network but technological innovation decarbonisation and behaviour change are also transforming the sector ndash electric and autonomous vehicles create new opportunities and challenges for managing the road network while improved digital connectivity has the potential to transform patterns of commuting and service delivery The long term impacts of the Covid-19 pandemic are also uncertain
A multimodal transport strategy can improve coordination and prioritisation of investment
In transport policy governance and funding tends to be considered in siloes for the different modes of transport247 Therefore it can be difficult to determine the optimal balance of investment between different places and modes in terms of boosting growth and productivity improving quality of life and achieving net zero A multimodal transport strategy for interurban connectivity could help the country plan more effectively for sustainable growth and the shift to net zero optimising the use of different modes and covering both accessible passenger and freight transport Any multimodal transport strategy would need to be coordinated with locally led infrastructure strategies as recommended by the Commission in previous reports
71
National Infrastructure Commission | The Second National Infrastructure Assessment Baseline Report
Planning across modes and regions would help understand the priorities for improvement and how to address them including which places are underperforming most on connectivity measures and which have the greatest economic potential for infrastructure to unlock248 It would also enable a full understanding of the costs and priorities for delivering net zero including electric vehicle charging to enable rapid transition to zero emission cars emission free technology for trains coaches and goods vehicles and an understanding of the extent to which demand management may be necessary in the period before all cars are electric in order to comply with the sixth carbon budget
In the second National Infrastructure Assessment the Commission will therefore seek to better understand the long term needs of different cities and regions in terms of how interurban transport can impact on productivity and quality of life
Challenge 9 Interurban transport across modes ndash the Commission will consider relative priorities and long term investment needs including the role of new technologies as part of a strategic multimodal transport plan
43 DigitalDigital infrastructure and the use of data are important contributors to economic opportunity and quality of life through improved connectivity and new use cases which may boost local economic performance249 In some places digital connectivity may serve as a substitute for transport connectivity Digital services may be increasingly important for access to work and in determining where people choose to live if increases in working from home induced by Covid-19 endure in the long term250
In the first Assessment the Commission recommended that government should start work to ensure nationwide full fibre coverage by 2033251 To support that ambition it recommended that the government develop a national broadband plan by the end of 2018 and to subsidise full fibre rollout in areas where it may not be commercially viable
Since the first Assessment the government has set an ambitious target to reach at least 85 per cent gigabit broadband coverage by 2025252 and to move towards universal coverage as soon as possible Gigabit coverage is intended to provide a service as fast as full fibre but in some cases using alternative technologies to achieve this goal Good progress is being made so far on commercial rollout ndash over fifty per cent of premises are now able to access gigabit capable broadband253
Achieving nationwide gigabit broadband coverage is a major civil engineering challenge and will require a significant level of private investment The governmentrsquos target is achievable as long as the policy and regulatory environment remains pro investment and network operators deliver against the plans they have set out For premises in harder to reach areas the government will where necessary subsidise delivery using public funds through the Project Gigabit Programme254 The Commission will monitor progress with the rollout of gigabit capable broadband against governmentrsquos targets
On mobile coverage 92 per cent of the UK landmass is covered by at least one mobile operator with a funded plan to increase this to 95 per cent by 2025255 The Shared Rural Network agreement between government and the mobile operators should expand signal coverage and close almost all lsquopartial not spotsrsquo ndash areas where there is currently only signal from at least one but not all operators256 However data based on real user experiences suggests there may be issues with 4G availability in certain places257
72
National Infrastructure Commission | The Second National Infrastructure Assessment Baseline Report
In its recent study on Infrastructure Towns and Regeneration the Commission recommended that central government take measures to address any gaps in gigabit broadband coverage in towns and develop with Ofcom a more granular picture of mobile user experiences258 The Commission also recommended government develop a strategy to encourage the take up of new communications networks and services including supporting innovation pilots
As set out in Chapter 1 in the second Assessment the Commission will explore how the adoption of digital technologies and use of data enabled by these networks can improve the supply of and reduce demand for infrastructure across sectors
44 EnergyEnergy is a universal service which almost all areas of the country have access to
z nearly all properties are attached to the national grid for electricity259
z 85 per cent of properties are attached to the gas network260
For some areas new energy infrastructure may create new economic opportunities The transition to net zero will require investment in new industries such as greenhouse gas removals carbon capture and storage and hydrogen production This may create economic opportunities for certain towns and cities ndash especially where growing industries are clustered together as identified in the Humber local industrial strategy ndash and which could form part of locally led wider economic strategies for those places261 The development of the offshore wind sector has already created new opportunities for coastal towns close to large wind farms such as Grimsby
In the Commissionrsquos Infrastructure Towns and Regeneration report the Commission examined the impact of this potential transformation on Grimsby and made recommendations about how infrastructure policy could help similar places seize the opportunities of the energy transition However the transition away from oil and gas may have the opposite effect in places where these industries are centred such as Aberdeen or Shetland
The transition to net zero also requires individual households and businesses to take action both to improve the efficiency of their buildings and to transition to low carbon heating and cooling solutions Spatially energy efficiency varies from building to building meaning some properties will have higher energy bills than others affecting quality of life262 This means that the task of transitioning to zero carbon energy will require different interventions and generate different opportunities in different areas Areas of the country with older housing stock may need significantly more investment to retrofit energy efficiency improvements
The Commissionrsquos Infrastructure Towns and Regeneration study discussed how some areas may be able to use infrastructure planning to make the most of the opportunities of decarbonisation263 Building on this previous work the Commission will further explore energy related challenges and the transition to net zero as set out in Chapter 2 As part of this work the Commission will identify differing spatial effects and whether they could support levelling up
73
National Infrastructure Commission | The Second National Infrastructure Assessment Baseline Report
45 Challenges for the second AssessmentAs set out in this chapter the key infrastructure challenges the Commission will prioritise in the second Assessment with respect to levelling up will be
Challenge 8 Urban mobility and congestion ndash the Commission will examine how the development of at scale mass transit systems can support productivity in cities and city regions and consider the role of congestion charging and other demand management measures
Question 16 What evidence is there of the effectiveness in reducing congestion of different approaches to demand management used in cities around the world including but not limited to congestion charging and what are the different approaches used to build public consensus for such measures
Challenge 9 Interurban transport across modes ndash the Commission will consider relative priorities and long term investment needs including the role of new technologies as part of a strategic multimodal transport plan
Question 17 What are the barriers to a decision making framework on interurban transport that reflects a balanced approach across different transport modes
Details on how to respond to the call for evidence questions are set out in Chapter 5
74
National Infrastructure Commission | The Second National Infrastructure Assessment Baseline Report
51 The route to the second Assessment The second National Infrastructure Assessment will be published in the second half of 2023 and will set out long term infrastructure needs and recommendations to meet them in the next 10-30 years This Baseline Report has set out the current state of economic infrastructure identifying nine key challenges the Commission will consider for the second Assessment falling under the three strategic themes covered in chapters 2-4
The second Assessment will set out recommendations to address these key challenges This document contains call for evidence questions on the key challenges to support the Commission as it develops its work for the second Assessment Details on how to respond to the Call for Evidence are set out at the end of this chapter
In the run up to the second Assessment the Commission will use the Call for Evidence responses and evidence gathered through stakeholder engagement social research and advice from experts to inform the development of its recommendations to government
Figure 51 Timeline for the second Assessment
5 Next steps
Timeline for National Infrastructure Assessment 2
Autumn 2021
Baseline ReportSecond National
Infrastructure Assessment
Research analysis and engagement
Autumn 2021 to H1 2023 H2 2023
75
National Infrastructure Commission | The Second National Infrastructure Assessment Baseline Report
Principles
Alongside the Commissionrsquos objectives the following principles ndash based on the Process and Methodology Consultation conducted before the first Assessment ndash will underpin the Commissionrsquos work for the second Assessment
z Open transparent engaging with a wide range of stakeholders The Commission will seek to capture the expertise and opinions of people from across infrastructure providers business central and local Government academia civil society and the wider public
z Independent evidence-based objective and rigorous The Commission will seek to form a clear dispassionate assessment of the UKrsquos infrastructure needs built on extensive expertise and a robust methodology
z Forward looking challenging established thinking Rapid changes are happening in technology and peoplersquos behaviour is also changing ndash especially as a result of the Covid-19 pandemic These changes create challenges and opportunities for the UK The Commission will seek to assess the impact of technology behaviour change and other factors on the supply of and demand for infrastructure services and look to make recommendations which are affordable in and robust to multiple future scenarios
z Comprehensive taking a whole system approach understanding and studying interdependencies and feedbacks The Commission will seek to assess the UKrsquos infrastructure system as a whole looking across sectors and identifying and exploring the most important interdependencies and resilience implications
The independence of the Commission from both government and industry will enable it to develop a strategy that is in the long term interests of the UKrsquos present and future population The wide ranging engagement and evidence gathering processes that underpin the Assessment aim to increase transparency and secure a broad consensus around its recommendations including from all sides of the political spectrum
Stakeholder engagement and expert advice
The Commission will engage widely in the run up to publication of the second Assessment to inform its work on the nine challenges outlined in this report This includes engagement with industry bodies business and not for profit organisations including through responses to the Call for Evidence contained in this report The Commission will also further research the views and preferences of the public to shape its recommendations
The Commission will also hold a programme of roundtable events to explore policy questions in detail with regional and sectoral stakeholders This will involve Commissioners meeting with local businesses representative groups and politicians across the country and events bringing together a wide range of stakeholders with interests in the three strategic challenges and the sectors within the Commissionrsquos remit A second round of similar events will take place later in the policy evaluation process
To help inform the second Assessment the Commission has established three expert advisory panels ndash on net zero climate resilience and levelling up ndash that have advised on the development of this Baseline Report The panels will continue to offer expert advice support analysis contribute new ideas and insights to support recommendations challenge the Commissionrsquos thinking and offer alternative perspectives The membership of each panel can be found on the Commissionrsquos website264
76
National Infrastructure Commission | The Second National Infrastructure Assessment Baseline Report
The Commissionrsquos work for the second Assessment will also draw on the advice of the Commissionrsquos Design Group The Design Group was established in 2019 to champion design excellence in national infrastructure It published the Design Principles for National Infrastructure in February 2020 which sets out four design principles ndash climate people places and value ndash that should guide the planning and delivery of infrastructure projects265
To provide fresh thinking and ensure that the next generation will be sufficiently represented the work of the Commissionrsquos Young Professionals Panel will support and inform the second Assessment The Panel was established in 2018 to ensure a strong voice for the next generation of infrastructure leaders in the Commissionrsquos programme266
The Commissionrsquos website will be updated regularly with information on how stakeholders can engage in the process Stakeholders will also be able to register to receive updates on progress towards the second Assessment and opportunities to get involved by signing up for email alerts via the Commissionrsquos website
52 Developing recommendations
Managing uncertainty
There are several external factors that impact the supply and demand of infrastructure including the environment and climate change population and demography technological change economic growth and behaviour change following the Covid-19 pandemic In particular the long term effects of the pandemic have highlighted the uncertainty that will be present when the Commission comes to develop the second Assessment The Commissionrsquos report Behaviour change and infrastructure beyond Covid-19 describes how the spread of potential outcomes for transport ndash particularly public transport ndash is wider than for other sectors although all sectors will face challenges267
The Commission will develop scenarios for the second Assessment to explore how the key drivers may affect the future supply and demand of economic infrastructure including using those set out in Behaviour change and infrastructure beyond Covid-19 These scenarios will be published in spring 2022
The Commission takes a range of approaches to managing the uncertainty around future trends that impact infrastructure to ensure that its recommendations stand the test of time as far as possible As set out in the first Assessment these approaches include
z Balancing the risks of major investments prioritising investments where the potential costs of inaction are higher than those of action such as increasing the water supply to prepare for droughts but taking a more lsquoadaptiversquo approach where it is possible to make changes incrementally as the situation develops ndash for example in flood defences
z Making complementary recommendations such as investing in both urban transport and rural fibre to mitigate uncertainty about where people will live and work in future
z Planning for future decisions for example by trialling options for low carbon heat to improve the evidence base for decarbonising heat over the 2020s
77
National Infrastructure Commission | The Second National Infrastructure Assessment Baseline Report
The Commission will continue to follow these approaches in the second Assessment While the infrastructure industry requires as much certainty as possible sometimes plans will need to be changed as more evidence emerges Adaptive frameworks will therefore continue to be particularly important for the Commission in managing these trade offs
Analysis topics for the second Assessment
The Commission will analyse the impacts of its recommendations in six key areas
z Public spending impact the Commissionrsquos binding fiscal remit requires it to demonstrate that all its recommendations are consistent with and set out how they can be accommodated within gross public investment in economic infrastructure of between 11 and 13 per cent of GDP each year between 2025 and 2055
z Bills impact the Commissionrsquos reports must also include a transparent assessment of the impact on costs to businesses consumers government public bodies and other end users of infrastructure that would arise from implementing the recommendations The second Assessment will also show the total costs of recommendations on a household level comparing current household bills to the additional costs of the Commissionrsquos recommendations
z Distributional impacts assessing whether recommendations will have disproportionate impacts on specific groups of people
z Climate change impact assessing the impacts of economic infrastructure and the Commissionrsquos recommendations on greenhouse gas emissions
z Environmental impact assessing how economic infrastructure and the Commissionrsquos recommendations affect the UKrsquos natural capital and biodiversity
z Regional impacts assessing whether recommendations will have disproportionate impacts on regions
53 How to respond to the Call for EvidenceResponses should be no longer than 10 pages in total (not including supplementary data files) and should be emailed to NIA2CfE_Responsesnicgovuk
The deadline for submissions is 4 February 2022
Evidence will be reviewed thereafter by the Commission If further information or clarification is required the team will contact you The Commission may publish any responses received If you believe there is a reason why your response or any part of it should be considered confidential please provide details
In exceptional circumstances the Commission will accept responses in hard copy If you need to submit a hard copy please send your response to the Commission Secretariat at
National Infrastructure Commission Finlaison House 15-17 Furnival Street London EC4A 1AB
78
National Infrastructure Commission | The Second National Infrastructure Assessment Baseline Report
FOI and Privacy Statements
Information provided in response to this consultation including personal information may be subject to publication or disclosure in accordance with the Freedom of Information Act 2000 (FOIA) or other relevant legislation
If you want information that you provide to be treated as confidential please be aware that under the FOIA there is a statutory code of practice with which public authorities must comply and which deals amongst other things with obligations of confidentiality
In view of this it would be helpful if you could explain to the Commission why you regard the information you have provided as confidential If the Commission receives a request for disclosure of the information it will take full account of your explanation but cannot give an assurance that confidentiality can be maintained in all circumstances An automatic confidentiality disclaimer generated by your IT system will not of itself be regarded as binding on the Commission
The Commission will process your personal data in accordance with relevant data protection law
54 Summary of Call for Evidence questions
1 Introduction
Question 1 Do the nine challenges identified by the Commission cover the most pressing issues that economic infrastructure will face over the next 30 years If not what other challenges should the Commission consider
Question 2 What changes to funding policy help address the Commissionrsquos nine challenges and what evidence is there to support this Your response can cover any number of the Commissionrsquos challenges
Question 3 How can better design in line with the design principles for national infrastructure help solve any of the Commissionrsquos nine challenges for the next Assessment and what evidence is there to support this Your response can cover any number of the Commissionrsquos challenges
Question 4 What interactions exist between addressing the Commissionrsquos nine challenges for the next Assessment and the governmentrsquos target to halt biodiversity loss by 2030 and implement biodiversity net gain Your response can cover any number of the Commissionrsquos challenges
Question 5 What are the main opportunities in terms of governance policy regulation and market mechanisms that may help solve any of the Commissionrsquos nine challenges for the Next Assessment What are the main barriers Your response can cover any number of the Commissionrsquos challenges
Challenge 1 The digital transformation of infrastructure ndash the Commission will consider how the digital transformation of infrastructure could deliver higher quality lower cost infrastructure services
79
National Infrastructure Commission | The Second National Infrastructure Assessment Baseline Report
Question 6 In which of the Commissionrsquos sectors (outside of digital) can digital services and technologies enabled by fixed and wireless communications networks deliver the biggest benefits and how much would this cost
Question 7 What barriers exist that are preventing the widescale adoption and application of these new digital services and technologies to deliver better infrastructure services And how might they be addressed Your response can cover any number of the Commissionrsquos sectors outside digital (energy water flood resilience waste transport)
2 Reaching net zero
Challenge 2 Decarbonising electricity generation ndash the Commission will consider how a decarbonised secure and flexible electricity system can be achieved by 2035 at low cost
Question 8 What are the greatest risks to security of supply in a decarbonised power system that meets government ambition for 2035 and what solutions exist to mitigate these risks
Challenge 3 Heat transition and energy efficiency ndash the Commission will identify a viable pathway for heat decarbonisation and set out recommendations for policies and funding to deliver net zero heat to all homes and businesses
Question 9 What evidence do you have on the barriers to converting the existing gas grid to hydrogen installing heat pumps in different types of properties or rolling out low carbon heat networks What are the potential solutions to these barriers
Question 10 What evidence do you have of the barriers and potential solutions to deploying energy efficiency in the English building stock
Challenge 4 Networks for hydrogen and carbon capture and storage - the Commission will assess the hydrogen and carbon capture and storage required across the economy and the policy and funding frameworks needed to deliver it over the next 10-30 years
Question 11 What barriers exist to the long term growth of the hydrogen sector beyond 2030 and how can they be overcome Are any parts of the value chain (production storage transportation) more challenging than others and if so why
Question 12 What are the main barriers to delivering the carbon capture and storage networks required to support the transition to a net zero economy What are the solutions to overcoming these barriers
3 Climate resilience and the environment
Challenge 5 Asset management and resilience ndash the Commission will consider how asset management can support resilience barriers to investment and the use of data and technology to improve the way assets are maintained
Question 13 In what ways will current asset management practice need to improve to support better infrastructure resilience Your response can cover any number of the Commissionrsquos sectors
80
National Infrastructure Commission | The Second National Infrastructure Assessment Baseline Report
Challenge 6 Surface water management ndash the Commission will consider actions to maximise short-term opportunities and improve long term planning funding and governance arrangements for surface water management while protecting water from pollution from drainage
The Commission will carry out a separate call for evidence on this challenge as the Commission will deliver this as a separate study and report to government by November 2022 in advance of its other recommendations
Challenge 7 Waste and the circular economy ndash the Commission will examine the role of the waste sector in enabling the move towards a more circular economy
Question 14 What are the barriers to and solutions for expanding recycling capacity both now and in the future to deliver environmental and net zero targets
Question 15 What is the likely environmental impact of waste streams from construction across economic infrastructure sectors over the next 30 years and what are the appropriate measures for addressing it
4 Levelling up
Challenge 8 Urban mobility and congestion ndash the Commission will examine how the development of at scale mass transit systems can support productivity in cities and city regions and consider the role of congestion charging and other demand management measures
Question 16 What evidence is there of the effectiveness in reducing congestion of different approaches to demand management used in cities around the world including but not limited to congestion charging and what are the different approaches used to build public consensus for such measures
Challenge 9 Interurban transport across modes ndash the Commission will consider relative priorities and long term investment needs including the role of new technologies as part of a strategic multimodal transport plan
Question 17 What are the barriers to a decision making framework on interurban transport that reflects a balanced approach across different transport modes
81
National Infrastructure Commission | The Second National Infrastructure Assessment Baseline Report
The Commission would like to thank all the members of the secretariat (past and present) who contributed to or helped with this report and its analysis including
Sam Aggrey Ed Beard Katie Black Hannah Brown Anesu Bwawa Leo Camacho Joanna Campbell Jon Chappell Jen Coe Maisie Darby Christopher Durham Nick Francis Rose Galloway Green Alexandra Goodwin James Harris James Heath Verity Hillier Tom Hughes Andrew Jones Catherine Jones Charlotte Lamb Rob Mallows Kirin Mathias Greg McClymont Ryan McGowan Ben McNamee Genelva Meikle David Menzies Vasilis Papakonstantinou Jack Parker Jo Pearce James Richardson Neha Shah Dan Shotter Giles Stevens Monika Szczyrba Chris Wanzala-Ryan Simon Weaver Ben Wilson Olivia Winduss Karen Winn and Nathan Wyatt
In addition the Commission would like to thank its three expert advisory groups
Net zero Nigel Brandon Roz Bulleid Sam Fankhauser Rob Gross Neil Kenward Madeleine Kessler Cissie Liu Andrew Morlet Rain Newton-Smith Emma Pinchbeck Jill Rutter Judith Sykes Mike Thompson and Karen Turner
Climate resilience David Balmforth David Black Sharon Darcy Richard Dawson Suraje Dessai Caroline Douglass Alistair Ford Hannah Freeman Andrew Grant Jim Hall Juliet Mian Caroline Reeson and Jean Spencer
Levelling up Diane Coyle John Cridland Hanif Kara Sarah Longlands Philip McCann Henry Overman Chris Richards Jessica Rushworth Elliot Shaw Laura Shoaf Tony Venables Cecilia Wong and Ann Zhang
Acknowledgements
82
National Infrastructure Commission | The Second National Infrastructure Assessment Baseline Report
The Commission provides the government with impartial expert advice on major long-term infrastructure challenges Its remit covers economic infrastructure energy transport water and wastewater (drainage and sewerage) waste flood risk management and digital communications The Commission considers the potential interactions between its infrastructure recommendations and housing supply but housing itself is not in its remit The Commission also considers the interaction between infrastructure policy and the governmentrsquos legal target to halt biodiversity loss by 2030 Social infrastructure such as schools hospitals or prisons agriculture and land use are all also out of the Commissionrsquos scope
The Commissionrsquos objectives are to support sustainable economic growth across all regions of the UK improve competitiveness improve quality of life and to support climate resilience and the transition to net zero carbon emissions by 2050
The Commission delivers the following core pieces of work
z a National Infrastructure Assessment once in every Parliament setting out the Commissionrsquos assessment of long term infrastructure needs with recommendations to government
z specific studies on pressing infrastructure challenges as set by the government taking into account the views of the Commission and stakeholders including recommendations to government
z an Annual Monitoring Report taking stock of the governmentrsquos progress in areas where it has committed to taking forward recommendations of the Commission
The Commissionrsquos binding fiscal remit requires it to demonstrate that all its recommendations are consistent with and set out how they can be accommodated within gross public investment in economic infrastructure of between 11 and 13 per cent of GDP each year between 2025 and 2055 The Commissionrsquos reports must also include a transparent assessment of the impact on costs to businesses consumers government public bodies and other end users of infrastructure that would arise from implementing the recommendations
When making its recommendations the Commission is required to take into account both the role of the economic regulators in regulating infrastructure providers and the governmentrsquos legal obligations The Commissionrsquos remit letter also states that the Commission must ensure its recommendations do not reopen decision making processes where programmes and work have been decided by the government or will be decided in the immediate future
The Infrastructure and Projects Authority is responsible for ensuring the long term planning carried out by the Commission is translated into successful project delivery once the plans have been endorsed by government
The Commissionrsquos remit extends to economic infrastructure within the UK governmentrsquos competence Across much of the Commissionrsquos remit there is currently substantial devolution to Northern Ireland Scotland and Wales The Commissionrsquos role is to advise the UK government But the Commission works with both the UK government and the devolved administrations where responsibilities interact
The Commission
83
National Infrastructure Commission | The Second National Infrastructure Assessment Baseline Report
The Commissionrsquos remit extends to economic infrastructure within the UK governmentrsquos competence Across much of the Commissionrsquos remit there is currently substantial devolution to Northern Ireland Scotland and Wales The Commissionrsquos role is to advise the UK government But the Commission works with both the UK government and the devolved administrations where responsibilities interact
Table Devolved administration responsibilities by infrastructure sector
Sector Devolved administration responsibility
Northern Ireland Scotland Wales
Digital Reserved Reserved Reserved
Energy Devolved except nuclear
Reserved except energy efficiency
Reserved except energy efficiency
Flood risk Devolved Devolved Devolved
Transport Devolved except aviation and maritime
Largely devolved except aviation and maritime
Road transport largely devolved most rail aviation and maritime reserved
Waste Devolved Devolved Devolved
Water and wastewater
Devolved Devolved Devolved
The Commissionrsquos members
Sir John Armitt CBE (Chair) published an independent review on long term infrastructure planning in the UK in September 2013 which resulted in the National Infrastructure Commission Sir John is the Chair of National Express Group He also sits on the boards of the Berkeley Group and Expo 2020
Professor Sir Tim Besley CBE is School Professor of Economics and Political Science and W Arthur Lewis Professor of Development Economics at the LSE He served as an external member of the Bank of England Monetary Policy Committee from 2006 to 2009
Neale Coleman CBE is a co-founder of Blackstock Partnership He worked at the Greater London Authority from 2000-2015 leading the Mayorrsquos work on Londonrsquos Olympic bid the delivery of the games and their regeneration legacy Neale has also served as Policy Director for the Labour Party
Professor David Fisk CB is the Director of the Laing OrsquoRourke Centre for Systems Engineering and Innovation Research at Imperial College London He has served as Chief Scientist across several government departments including those for environment and transport and as a member of the Gas and Electricity Markets Authority
Andy Green CBE holds several Chair Non-Executive Director and advisory roles linked by his passion for how technology transforms business and our daily lives He chairs Lowell a major European credit management company and has served as Chair of the Digital Catapult an initiative to help grow the UKrsquos digital economy
84
National Infrastructure Commission | The Second National Infrastructure Assessment Baseline Report
Professor Sadie Morgan OBE is a founding director of the Stirling Prize winning architectural practice dRMM She is also Chair of the Independent Design Panel for High Speed Two and one of the Mayor of Londonrsquos Design Advocates She sits on the boards of the Major Projects Association and Homes England
Julia Prescot holds several board and advisory roles She is a co-founder and Chief Strategy Officer of Meridiam and sits on the Executive Committee of Meridiam SAS She has been involved in long term infrastructure development and investment in the UK Europe North America and Africa She is an Honorary Professor at the Bartlett School of Construction and Project Management University College London Since 2019 she has sat on the board of the Port of Tyne
Bridget Rosewell CBE is a director policy maker and economist She served as Chief Economic Adviser to the Greater London Authority from 2002 to 2012 and worked extensively on infrastructure business cases She has served as a Non-executive Director of Network Rail and Non-executive Chair of the Driver and Vehicle Standards Agency She is currently Chair of the Atom Bank and the M6 Toll Road In May 2021 she was appointed an Independent Non Executive Director at Northumbrian Water
85
National Infrastructure Commission | The Second National Infrastructure Assessment Baseline Report
Endnotes1 National Infrastructure Assessment (2018) National Infrastructure Assessment2 HM Treasury (2020) National Infrastructure Strategy 3 See for example National Infrastructure Commission (2020) Anticipate React Recover Resilient infrastructure
systems National Infrastructure Commission (2020) Net Zero Commission recommendations and the net zero target 4 National Infrastructure Commission (2019) Lessons Learnt Reviewing the process of the first National Infrastructure
Assessment5 National Infrastructure Commission (2020) Growth across regions6 National Infrastructure Commission (2020) Improving competitiveness7 Buser et al (2020) Literature review on the impacts of infrastructure on quality of life8 National Infrastructure Commission (2016) The impact of technological change on future infrastructure supply and
demand National Infrastructure Commission (2016) The impact of population change and demography on future infrastructure demand National Infrastructure Commission (2017) Economic growth and demand for infrastructure services National Infrastructure Commission (2017) The impact of the environment and climate change on future infrastructure supply and demand
9 National Infrastructure Commission (2016) The impact of technological change on future infrastructure supply and demand
10 National Infrastructure Commission (2021) Behaviour change and infrastructure beyond Covid-1911 HM Treasury (2020) National Infrastructure Strategy12 HM Treasury (2020) National Infrastructure Strategy13 Department for Business Energy amp Industrial Strategy (2021) Digest of UK energy statistics electricity table 5614 HM Government (2020) Government takes historic step towards net-zero with end of sale of new petrol and diesel
cars by 203015 Department for Environment Food amp Rural Affairs (2021) Flood and coastal erosion risk management an investment
plan for 2021 to 202716 HM Treasury (2020) Response to the National Infrastructure Assessment17 HM Treasury (2021) UK Infrastructure Bank18 HM Treasury (2020) National Infrastructure Strategy19 Ofcom (2020) Connected Nations 20 Ofgem (2017) What do energy networks do for you 21 Drinking Water Inspectorate (2021) Drinking Water 2020 CCW (2020) Water water everywhere Water amp wastewater
resilience report 201920 CCW (2020) Water Matters Highlights Report22 National Infrastructure Commission PWC (2021) NIA2 Social Research Final report 23 HM Government (2021) Net Zero Strategy Build Back Greener24 Department for Business Energy amp Industrial Strategy (2021) 2019 UK greenhouse gas emissions final figures ndash data
tables25 As of July 2021 there were around 24300 public charging points see Department for Transport and Office for Zero
Emission Vehicles (2021) Electric Vehicle Charging Device Statistics July 202126 It is estimated that between 280000 and 480000 public charging points would be needed to support 100 per cent
electric new car and van sales in 2030 see Competition amp Markets Authority (2021) Electric vehicle charging market study final report
27 Ofwat (2017) Targeted Review of Asset Health and Resilience in the Water Industry House of Commons Transport Committee (2019) Local roads funding and maintenance filling the gap
28 Environment Agency (2020) National Flood and Coastal Erosion Risk Management Strategy for England29 Environment Agency (2021) Flood and coastal erosion risk management report 1 April 2019 to 31 March 202030 Environment Agency data request (2019) Environment Agency (2021) Water and sewerage companies in England
environmental performance report for 202031 Environment Agency (2021) Water and sewerage companies in England environmental performance report for 202032 Department for Environment Food and Rural Affairs (2021) ENV23 ndash UK Statistics on Waste Department of Business
Energy amp Industrial Strategy (2021) Provisional UK greenhouse gas emissions national statistics 2020 Department for Environment Food and Rural Affairs (2021) ENV23 ndash UK Statistics on Waste
33 See Chapter 434 National Infrastructure Commission (2018) Transport connectivity dataset35 Office for National Statistics (2021) Family spending workbook 1 detailed expenditure and trends
86
National Infrastructure Commission | The Second National Infrastructure Assessment Baseline Report
36 The Intergovernmental Science-Policy Platform on Biodiversity and Ecosystem Services (2019) The global assessment report on biodiversity and ecosystem services summary for policymakers Partha Dasgupta (2021) The Economics of Biodiversity The Dasgupta Review
37 National Infrastructure Commission (2021) Behaviour change and infrastructure beyond Covid-1938 Department for Business Energy amp Industrial Strategy (2021) 2019 UK greenhouse gas emissions final figures ndash
data tables The emissions totals referenced in this report are inclusive of international aviation and shipping Unless otherwise stated emissions reported in this document are sourced from the 2019 UK greenhouse gas emissions final figures ndash data tables
39 HM Government (2021) UK enshrines new target in law to slash emissions by 78 by 203540 HM Government (2019) UK becomes first major economy to pass net zero emissions law41 HM Government (2021) Net Zero Strategy Build Back Greener42 This includes energy from waste emissions sourced from the National Atmospheric Emissions Inventory43 National Infrastructure Commission (2021) Engineered Greenhouse Gas Removals44 HM Government (2021) Net Zero Strategy Build Back Greener45 Climate Change Committee (2021) Independent Assessment of UK Climate Risk46 HM Treasury (2021) Net Zero Review Analysis exploring the key issues47 Climate Change Committee (2021) Independent Assessment of UK Climate Risk48 Jaroszweski D Wood R and Chapman L (2021) Infrastructure In The Third UK Climate ChangeRisk Assessment
Technical Report Prepared for the Climate Change Committee49 PWC (2021) NIA2 Social Research Final report 50 Department for Business Energy amp Industrial Strategy (2021) 2019 UK greenhouse gas emissions final figures ndash data
tables51 National Infrastructure Commission (2021)History Transport Dataset Railways Passenger Journeys52 Climate Change Committee (2020) Sixth Carbon Budget ndash Charts and data in the report53 National Infrastructure Commission (2018) National Infrastructure Assessment54 HM Treasury (2020) National Infrastructure Strategy55 Department for Transport and Office for Zero Emission Vehicles (2021) Electric Vehicle Charging Device Statistics July
202156 Competition amp Markets Authority (2021) Electric vehicle charging market study final report57 HM Treasury (2020) National Infrastructure Strategy page 9558 Ofgem (2021) Enabling the transition to electric vehicles The regulatorrsquos priorities for a green fair future59 National Infrastructure Commission (2019) Better Delivery The challenge for freight60 Department for Transport (2021) UK confirms pledge for zero-emission HGVs by 2040 and unveils new chargepoint
design61 Department for Transport (2021) Decarbonising Transport A Better Greener Britain62 Office of Road and Rail (2020) Rail Infrastructure and Assets 2019-2063 National Infrastructure Commission (2020) Rail Needs Assessment for the Midlands and the North64 National Infrastructure Commission (2019) Better Delivery The challenge for freight65 House of Commons Transport Committee (2021) Trains fit for the future Sixth Report of Session 2019-21 Office of
Road and Rail (2020) Rail Infrastructure and Assets 2019-2066 House of Commons Transport Committee (2021) Trains fit for the future Sixth Report of Session 2019-2167 Department for Business Energy amp Industrial Strategy (2021) 2019 UK greenhouse gas emissions final figures ndash data
tables68 Shell (2020) Decarbonising Shipping All Hands on Deck Department for Transport (2021) Jet Zero Consultation A
consultation on our strategy for net zero aviation69 Climate Change Committee (2020) Sixth Carbon Budget ndash Charts and data in the report70 Environment Agency (2021) CORSIA how to comply71 National Infrastructure Commission (2021) Engineered greenhouse gas removals72 Department for Business Energy amp Industrial Strategy (2021) 2019 UK greenhouse gas emissions final figures ndash data
tables This excludes energy from waste emissions which are included in the waste emissions reported in this chapter73 International Energy Agency (2021) Statement on recent developments in natural gas and electricity markets74 Department for Business Energy amp Industrial Strategy (2021) Digest of UK energy statistics electricity table 5675 National Infrastructure Commission (2018) National Infrastructure Assessment76 National Infrastructure Commission (2020) Renewables recovery and reaching net zero77 HM Government (2021) Net Zero Strategy Build Back Greener78 Department for Business Energy amp Industrial Strategy (2021) Digest of UK energy statistics electricity table 5679 HM Government (2020) Energy White Paper Powering our Net Zero Future
87
National Infrastructure Commission | The Second National Infrastructure Assessment Baseline Report
80 Department for Business Energy amp Industrial Strategy (2021) Smart Systems and Flexibility Plan Appendix II Monitoring Framework
81 Department for Business Energy amp Industrial Strategy (2021) Transitioning to a net zero energy system smart systems and flexibility plan 2021 Department for Business Energy amp Industrial Strategy (2021) Facilitating the deployment of large-scale and long duration electricity storage call for evidence
82 Climate Change Committee (2021) Progress in reducing emissions 2021 Report to Parliament p6083 Department for Business Energy amp Industrial Strategy (2021) 2019 UK greenhouse gas emissions final figures ndash data
tables84 Department for Business Energy amp Industrial Strategy (2020) Energy Consumption in the UK End use data tables
table U385 Climate Change Committee (2020) Sixth Carbon Budget ndash Charts and data in the report86 Department for Business Energy amp Industrial Strategy (2017) International Comparisons of Heating Cooling and Heat
Decarbonisation Policies Buildings Performance Institute Europe (2011) Europersquos Buildings Under the Microscope A country-by-country review of the energy performance of buildings Tado (2020) UK homes losing heat up to three times faster than European neighbours
87 National Infrastructure Commission (2018) National Infrastructure Assessment88 HM Treasury (2020) Response to the National Infrastructure Assessment89 Ministry of Housing Communities amp Local Government (2021) English Housing Survey Headline Report 2019-2090 Department for Business Energy amp Industrial Strategy (2021) Household Energy Efficiency Statistics headline
release (October 2021) Table 11 Climate Change Committee (2021) Progress in reducing emissions 2021 Report to Parliament Figure 34
91 Climate Change Committee (2021) Progress in reducing emissions 2021 Report to Parliament92 HM Government (2020) The Ten Point Plan for a Green Industrial Revolution93 Vivid Economics (2017) International Comparisons of Heating Cooling and Heat Decarbonisation Policies94 Vivid Economics (2017) Annex International Comparisons of Heating Cooling and Heat Decarbonisation Policies95 Vivid Economics (2017) International Comparisons of Heating Cooling and Heat Decarbonisation Policies96 Vivid Economics (2017) International Comparisons of Heating Cooling and Heat Decarbonisation Policies97 Vivid Economics (2017) International Comparisons of Heating Cooling and Heat Decarbonisation Policies98 IEA (2020) The Netherlands 2020 Energy Policy Review99 International Council on Clean Transportation (2021) Hydrogen for Heating Decarbonization Options for Households
in the Netherlands in 2050100 HM Government (2021) Heat and Buildings Strategy101 Scottish Government (2021) Heat in Buildings Strategy Welsh Government (2021) Net Zero Wales Carbon Budget 2
(2021-25)102 HM Government (2021) Heat and Buildings Strategy103 HM Government (2021) Heat and Buildings Strategy104 Energy from waste emissions are not separated out in the Final UK greenhouse gas emissions national statistics
Emissions for energy from waste plants sourced from the National Atmospheric Emissions Inventory 105 Climate Change Committee (2017) Meeting Carbon Budgets Closing the policy gap106 Department for Business Energy amp Industrial Strategy (2021) 2019 UK greenhouse gas emissions final figures ndash data
tables Department for Business Energy amp Industrial Strategy (2021) 2019 UK greenhouse gas emissions by Standard Industrial Classification
107 Water UK (2020) Net Zero 2030 Routemap108 National Infrastructure Commission (2018) National Infrastructure Assessment HM Government (2021) UK Hydrogen
Strategy Centre for Strategic and International Studies (2021) Hydrogen The Key to Decarbonizing the Global Shipping Industry Department for Transport (2021) Jet Zero Consultation A consultation on our strategy for net zero aviation National Infrastructure Commission (2019) Better Delivery the challenge for freight House of Commons Transport Committee (2021) Trains fit for the future Sixth Report of Session 2019-21
109 Energy Research Partnership (2016) Potential Role of Hydrogen in the UK Energy System110 HM Government (2021) UK Hydrogen Strategy111 National Infrastructure Commission (2021) Engineered greenhouse gas removals112 National Infrastructure Commission (2021) Engineered greenhouse gas removals113 HM Government (2021) Net Zero Strategy Build Back Greener114 Partha Dasgupta (2021) The Economics of Biodiversity The Dasgupta Review115 Partha Dasgupta (2021) The Economics of Biodiversity The Dasgupta Review116 Dieter Helm (2015) Natural Capital Valuing the Planet 117 Met Office (2021) UK Climate Projections Headline Findings
88
National Infrastructure Commission | The Second National Infrastructure Assessment Baseline Report
118 PwC (2021) NIA2 Social Research Final report119 National Infrastructure Commission (2020) Anticipate React Recover Resilient infrastructure systems120 UK Climate Risk (2021) The Third UK Climate Change Risk Assessment Technical Report Chapter 4 Infrastructure
National Infrastructure Commission (2018) Preparing for a drier future Englandrsquos water infrastructure needs Met Office (2021) UK Climate Projections Headline Findings
121 Met Office (2018) UKCP18 Land Projections Science Report122 UK Climate Risk (2021) The Third UK Climate Change Risk Assessment Technical Report Chapter 4 Infrastructure123 Environment Agency (2021) Living better with a changing climate Report to Ministers under the Climate Change Act124 HM Government (2021) Government response to the Climate Change Committee 2021 Report to Parliament ndash
Progress in adapting to climate change125 National Infrastructure Commission (2020) Anticipate React Recover Resilient infrastructure systems126 HM Government (2021) Government Response to the National Infrastructure Commission report lsquoAnticipate
React Recover Resilient Infrastructure Systemsrsquo HM Government (2021) Global Britain in a Competitive Age the Integrated Review of Security Defence Development and Foreign Policy
127 National Infrastructure Commission (2020) Adverse weather scenarios for renewable energy system testing128 International Organisation for Standardisation (2020) ISO 55000 Standards Asset Management 129 Department for Transport (2014) Transport Resilience Review130 Ofwat (2019) PR19 Model Water Database Data accounted for England only131 Ofwat (2017) Targeted Review of Asset Health and Resilience in the Water Industry House of Commons Transport
Committee (2019) Local roads funding and maintenance filling the gap132 National Infrastructure Commission (2017) Data for the public good133 HM Treasury (2015) Spending Review and Autumn Statement 2015 National Audit Office (2020) Managing flood risk134 Ofwat (2019) Technical appendix 2 Securing cost efficiency135 HR Wallingford (2020) Updated projections of future water availability for the third UK Climate Change Risk
Assessment Technical Report136 Environment Agency (2020) National Flood and Coastal Erosion Risk Management Strategy for England137 Environment Agency (2021) Flood and coastal erosion risk management report 1 April 2019 to 31 March 2020138 National Infrastructure Commission (2018) National Infrastructure Assessment139 Environment Agency (2020) Meeting our future water needs a national framework for water resources140 Ofwat (2019) PR19 final determinations Policy summary141 Ofwat (2019) PR19 final determinations Strategic regional water resource solutions appendix142 Portsmouth water (2021) Havant Thicket Reservoir 143 National Infrastructure Commission (2018) National Infrastructure Assessment144 National Audit Office (2020) Managing flood risk145 Environment Agency (2020) National Flood and Coastal Erosion Risk Management Strategy for England Ministry of
Housing Communities and Local Government (2021) National Planning Policy Framework146 London Fire Brigade (2021) Press release 147 Department for Environment Food amp Rural Affairs (2021) Surface water management A government update148 Environment Agency data request (2019) and Environment Agency (2021) Water and sewerage companies in England
environmental performance report for 2020 149 Environment Agency data request (2019) and Environment Agency (2021) Water and sewerage companies in England
environmental performance report for 2020 150 Ofwat (2020) Service delivery report 2019-20 UK Climate Risk (2021) The Third UK Climate Change Risk Assessment
Technical Report Chapter 4 Infrastructure151 HM Treasury (2021) Reducing the Risks of Surface Water Flooding Terms of Reference152 Intergovernmental Science-Policy Platform on Biodiversity and Ecosystem Services (2019) The global assessment
report on biodiversity and ecosystem services summary for policymakers Partha Dasgupta (2021) The Economics of Biodiversity The Dasgupta Review
153 National Infrastructure Commission (2021) Natural capital and environmental net gain A discussion paper154 National Infrastructure Commission (2021) Natural capital and environmental net gain A discussion paper155 HM Government (2018) 25 Year Environment Plan156 National Infrastructure Commission (2018) National Infrastructure Assessment157 National Infrastructure Commission (2018) National Infrastructure Assessment158 National Infrastructure Commission (2019) Better Delivery the challenge for freight 159 National Infrastructure Commission (2018) National Infrastructure Assessment160 National Infrastructure Commission (2018) National Infrastructure Assessment161 National Infrastructure Commission (2020) Design Principles for National Infrastructure
89
National Infrastructure Commission | The Second National Infrastructure Assessment Baseline Report
162 National Infrastructure Commission (2021) Natural capital and environmental net gain A discussion paper163 National Infrastructure Commission (2020) Design Principles for National Infrastructure164 National Infrastructure Commission (2020) Design Principles for National Infrastructure165 HM Government (2018) Our Waste Our Resources A Strategy for England 166 Department for Environment Food amp Rural Affairs Forestry Commission Environment Agency Natural England and The
Rt Hon George Eustice MP (2021) World-leading Environment Act becomes law167 Department for Environment Food amp Rural Affairs (2021) UK Statistics on Waste OECD (2021) Municipal Waste
Generation and Treatment168 Ellen Macarthur Foundation (2017) The circular economy in detail 169 PwC (2021) NIA2 Social Research Final report170 Department for Environment Food amp Rural Affairs Forestry Commission Environment Agency Natural England and The
Rt Hon George Eustice MP (2021) World-leading Environment Act becomes law171 Johnson (2021) The Prime Ministerrsquos Levelling Up speech172 Johnson (2021) The Prime Ministerrsquos Levelling Up speech Swinney (2021) So you want to level up Taylor et al (2021)
What does it take to ldquolevel uprdquo places173 Office for National Statistics (2021) Subregional productivity in the UK July 2021 Office for National Statistics (2020)
Well being index dashboard174 National Infrastructure Commission (2020) Growth across regions175 Office for National Statistics (2020) Earnings and hours worked place of residence by local authority ASHE Table 8176 International Monetary Fund (2018) IMF staff country reports ndash United Kingdom177 Commission calculations using OECD statistics see National Infrastructure Commission (2020) Rail Needs Assessment
for the Midlands and the North Interim report178 Office for National Statistics (2021) Subregional productivity in the UK July 2021 179 Commission calculations using ONS (2020) Subregional productivity labour productivity indices by local authority
district Nominal (smoothed) GVA (B) per hour worked in 2018 difference between most and least productive local authorities in the Greater Manchester Combined Authority area
180 Office for National Statistics (2019) Well being index dashboard May 2019 edition 181 National Infrastructure Commission (2020) Improving competitiveness182 PwC (2021) NIA2 Social Research Final report183 These factors have been covered in Industrial Strategy Council (2020) UK Regional Productivity Differences an
evidence review and Thisse Proost (2019) What can be learned from spatial economics and other literature on spatial economics
184 Puga (2009) The magnitude and causes of agglomeration economies185 Overman (2015) The Economic Performance of UK Cities Can Urban and Regional Policy Make a Difference to the
North-South divide186 Financial Times (2017) Left behind can anyone save the towns the economy forgot187 Overman (2013) The economic future of British cities Centre for Cities (2014) Delivering change Supporting links
between universities and high-growth firms in cities188 Institute for Fiscal Studies (2020) Catching up or falling behind Geographical inequalities in the UK and how they
have changed in recent years 189 National Infrastructure Commission (2021) Infrastructure Towns and Regeneration190 Department for Business Energy and Industrial Strategy (2020) Offshore wind sector deal191 National Infrastructure Commission (2021) Behaviour change and infrastructure beyond Covid-19192 Aysan and Aysan (2017) The Effect of Employment Status on Life Satisfaction in Europe193 Frey and Stutzer (2002) Happiness and Economics How the Economy and Institutions Affect Human Well-Being194 McCann (2019) Perceptions of regional inequality and the geography of discontent insights from the UK195 Office for National Statistics (2018) Personal well-being frequently asked questions196 Frey and Stutzer (2002) Happiness and Economics How the Economy and Institutions Affect Human Well-Being
Public Health England (2020) Improving access to greenspace A new review for 2020197 Office for National Statistics (2019) Well being index dashboard May 2019 edition 198 National Infrastructure Commission (2020) Rail Needs Assessment for the Midlands and the North Interim report
Box 21199 Creacutepon et al (2013) Do Labor Market Policies have Displacement Effects Evidence from a Clustered Randomized
Experiment The Quarterly Journal of Economics 128(2) Einiouml and Overman (2016) The (Displacement) Effects of Spatially Targeted Enterprise Initiatives Evidence from UK LEGI Spatial Economics Research Centre discussion paper 0191
200 Industrial Strategy Council (2021) What does it take to ldquolevel uprdquo places
90
National Infrastructure Commission | The Second National Infrastructure Assessment Baseline Report
201 National Infrastructure Commission (2021) Infrastructure Towns and Regeneration202 National Infrastructure Commission (2020) Growth across regions 203 Centre for Cities (2018) Talk of the Town The economic links between cities and towns204 National Infrastructure Commission (2021) Infrastructure Towns and Regeneration205 Office for National Statistics (2021) Personal and economic well-being in Great Britain May 2021 206 Buser et al (2021) Literature review on the impacts of infrastructure on quality of life 207 National Infrastructure Commission (2020) Growth across regions208 Industrial Strategy Council (2020) UK Regional Productivity Differences an evidence review209 National Infrastructure Commission (2018) National Infrastructure Assessment 210 National Infrastructure Commission (2021) Infrastructure Towns and Regeneration211 National Infrastructure Commission (2021) Infrastructure Towns and Regeneration212 National Infrastructure Commission (2021) Infrastructure Towns and Regeneration p9213 National Infrastructure Commission (2019) Transport connectivity dataset214 National Infrastructure Commission (2020) Improving competitiveness p7215 National Infrastructure Commission (2019) Better Delivery the challenge for freight 216 National Infrastructure Commission (2021) Behaviour change and infrastructure beyond Covid-19217 National Infrastructure Commission (2021) Annual Monitoring Report 2021218 National Infrastructure Commission (2021) Infrastructure Towns and Regeneration219 Department of Business Energy amp Industrial Strategy (2019) Sub-national estimates of properties not connected to the
gas network National Archives (1990) Environmental Protection Act 1990 Section 45220 Unicef (2021) Drinking water sanitation and hygiene by country 2000-2020 waste coverage stats221 National Infrastructure Commission (2019) Transport connectivity dataset222 National Infrastructure Commission (2019) Transport connectivity dataset223 National Infrastructure Commission (2019) Transport connectivity discussion paper224 National Infrastructure Commission (2018) Transport connectivity dataset225 OECD (2007) Managing Urban Congestion p10226 Marchetti (1994) Anthropological Invariants in Travel Behavior 227 National Infrastructure Commission (2020) Growth across regions228 Department for Transport (2021) Transport use during the coronavirus (COVID-19) pandemic Department for
Transport (2020) Government extends coronavirus support for buses and trams total funding tops pound700 million229 Department for Transport (2021) Road congestion and travel time 230 Department for Transport (2021) Transport use during the coronavirus (COVID-19) pandemic231 National Infrastructure Commission (2017) Congestion Capacity Carbon priorities for national infrastructure232 Ipsos MORI (2020) Road pricing timely or toxic233 National Infrastructure Commission (2021) Urban congestion deliberative engagements234 National Infrastructure Commission (2021) Cities programme235 National Infrastructure Commission (2021) Infrastructure Towns and Regeneration236 HM Treasury (2021) Autumn Budget and Spending Review 2021 p110237 Department for Transport (2020) Gear Change A bold vision for cycling Department for Transport (2021) Bus back
better 238 HM Treasury (2020) National Infrastructure Strategy239 National Infrastructure Commission (2018) National Infrastructure Assessment 240 Commission analysis and calculations based on MHCLG (2020) Capital Outturn Return (COR A1) 2019-20 HM Treasury
(2020) Analysis of central government grants by function provided to the Commission Transport for London (2020) Annual Report and Statement of Accounts 201920
241 National Infrastructure Commission (2021) PWC Towns social research study242 National Infrastructure Commission (2020)Rail Needs Assessment for the Midlands and the North p28243 National Infrastructure Commission (2020) Improving competitiveness p7 244 Thisse and Proost (2019) What can be learned from spatial economics245 Duranton and Venables (2018) Place-Based Policies for Development246 National Infrastructure Commission calculations based on Department for Transport (2020) Public expenditure on
transport by country and spending authority HM Treasury (2020) Spending Review 2020 p 76 HM Treasury (2021) GDP deflators at market prices and money GDP September 2021 (Quarterly National Accounts)
247 Department for Transport (2021) Department for Transport organisation chart248 National Infrastructure Commission (2021) Infrastructure Towns and Regeneration249 National Infrastructure Commission (2021) Infrastructure Towns and Regeneration p28250 National Infrastructure Commission (2021) Behaviour change and infrastructure beyond Covid-19
91
National Infrastructure Commission | The Second National Infrastructure Assessment Baseline Report
251 National Infrastructure Commission (2018) National Infrastructure Assessment252 HM Treasury (2020) National Infrastructure Strategy253 Ofcom (2021) Connected Nations Update Summer 2021 254 Department for Culture Media and Sport (2021) Project Gigabit Phase One Delivery Plan255 Ofcom (2021) Connected Nations Update Summer 2021 p10256 Department for Digital Culture Media amp Sport (2020) Shared Rural Network257 National Infrastructure Commission (2021) Infrastructure Towns and Regeneration p15258 National Infrastructure Commission (2021) Infrastructure Towns and Regeneration259 World Bank (2020) Access to electricity ( of population) - United Kingdom 260 Department of Business Energy amp Industrial Strategy (2019) Sub-national estimates of properties not connected to the
gas network 261 National Infrastructure Commission (2021) Infrastructure Towns and Regeneration262 Centre for Sustainable Energy (2015) Mapping energy efficiency data at the parliamentary constituency level263 National Infrastructure Commission (2021) Infrastructure Towns and Regeneration264 National Infrastructure Commission (2021) NIA2 expert advisory panels 265 National Infrastructure Commission (2020) Design Principles for National Infrastructure 266 National Infrastructure Commission (2020) Young Professionals Panel 267 National Infrastructure Commission (2021) Behaviour change and infrastructure beyond Covid-19
Finlaison House 15-17 Furnival Street London EC4A 1AB
nicorguk
NatInfraCom November 2021
- Foreword
- In brief
- Executive summary
-
- The second National Infrastructure Assessment
- The National Infrastructure Baseline Report
- Reaching net zero
- Climate resilience and the environment
- Supporting levelling up
- Next steps
-
- 1 Introduction
-
- 11 The National Infrastructure Baseline Report
- 12 Work informing the second Assessment
- 13 Assessment of the infrastructure sectors
- 14 Digital technologies present opportunities for all sectors
-
- 2 Reaching net zero
-
- 21 Infrastructure and net zero
- 22 Transport
- 23 Energy
- 24 Waste
- 25 Wastewater
- 26 New infrastructure networks to support net zero
- 27 Challenges for the second Assessment
-
- 3 Climate resilience and the environment
-
- 31 Infrastructure resilience
- 32 Infrastructure and natural capital
- 33 Challenges for the second Assessment
-
- 4 Supporting levelling up
-
- 41 Infrastructure and levelling up
- 42 Transport and levelling up
- 43 Digital
- 44 Energy
- 45 Challenges for the second Assessment
-
- 5 Next steps
-
- 51 The route to the second Assessment
- 52 Developing recommendations
- 53 How to respond to the Call for Evidence
- 54 Summary of Call for Evidence questions
-
- The Commission
- Endnotes
-