the scec/usgs rupture dynamics code … dynamics ! code comparison exercise" ... cruz-atienza...
TRANSCRIPT
The SCEC/USGS ���Rupture Dynamics ���
Code Comparison Exercise Ruth A. Harris
(U.S. Geological Survey)
Harris March 2013
Presentation for March 20, 2013 SWUS GMC SSHAC Workshop #1

Harris March 2013
Acknowledgments
Thank you to the members of the SCEC Dynamic Rupture Code Verification Group:
Ralph Archuleta (UCSB), Brad Aagaard (USGS), Pablo Ampuero (Caltech), Victor Cruz-Atienza (UNAM, Mexico), Luis Dalguer (ETH, Switzerland), Steve Day (SDSU), Ben Duan (TAMU), Eric Dunham (Stanford),
Alice Gabriel (LMU, Germany), Percy Galvez (ETH, Switzerland), Yoshi Kaneko (GNS, New Zealand), Yuko Kase (AIST, Japan),
Jeremy Kozdon (NPS), Nadia Lapusta (Caltech), Shuo Ma (SDSU), David Oglesby (UCR), Kim Olsen (SDSU), Ryan Payne (TAMU),
Christian Pelties (LMU, Germany), Surendra Somala (Caltech),
and most especially, Michael Barall (Invisible Software)

how we do the test: we compare these results among the codes
Failure!Criterion!
Computer Codes!that Simulate Earthquakes as
Spontaneous Ruptures!
what we’re testing
What our Group Does: We Test Computer Codes Used to Simulate Earthquakes
Please see our website http://scecdata.usc.edu/cvws Harris March 2013
Overall Goal of our Code Verification Group
Compare the computational methods currently being used by SCEC and USGS scientists to simulate (spontaneous) earthquake rupture dynamics
Some Specific Objectives
Understand if our methods are producing the same results when using the same assumptions about friction, crustal structure, fault geometry, etc.
Funding
This project has been funded by the Southern California Earthquake Center, the U.S. Geological Survey, the U.S. Dept. of Energy, and the PG&E Company
Harris March 2013
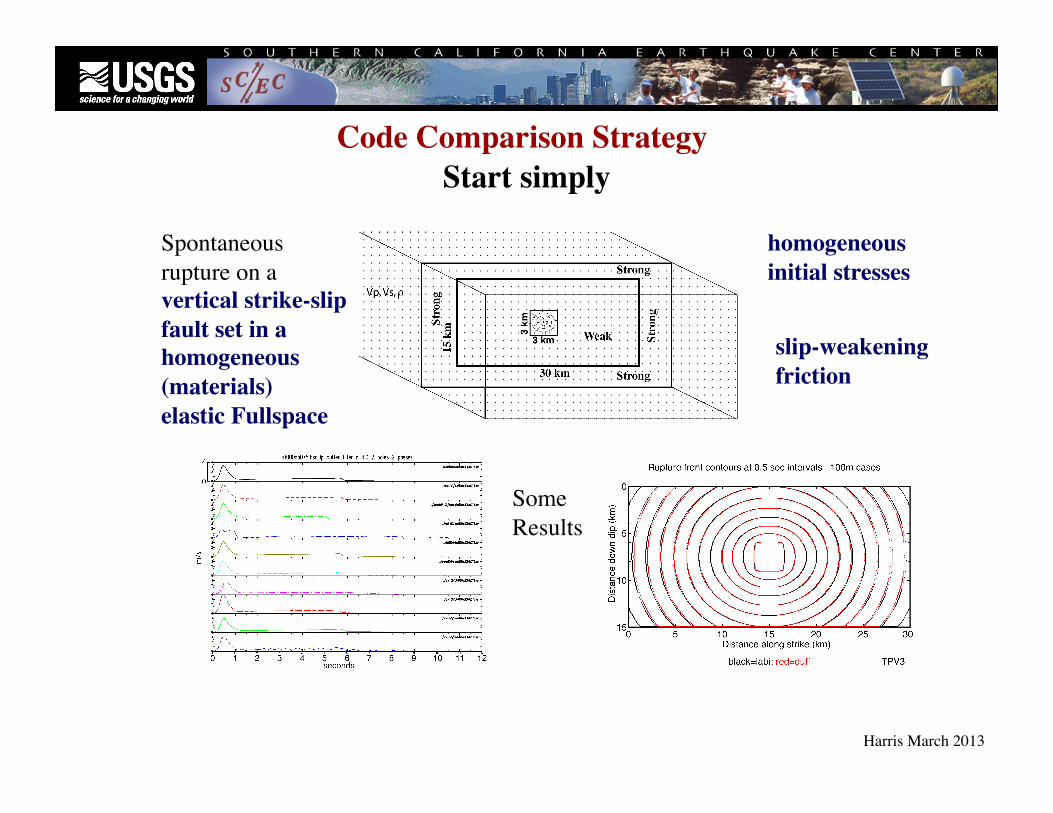
Code Comparison Strategy Start simply
Spontaneous rupture on a vertical strike-slip fault set in a homogeneous (materials) elastic Fullspace
Some Results
homogeneous initial stresses
slip-weakening friction
Harris March 2013

Harris March 2013
Code Comparison Benchmarks – Incrementally add complexity
TPV104
TPV12 TPV13 TPV10-11
Rate-state friction using a slip law with strong rate-weakening Rate-state friction using an ageing law
Slip-weakening friction
TPV103 TPV101 TPV102
TPV6-7 TPV5, 205
TPV105-2D
Thermal pressurization, rate-state friction, slip-law, strong rate-weakening
Slip-weakening friction
TPV14-15, 18-21
Slip-weakening friction
TPV16-17
Slip-weakening friction
TPV3 TPV4
TPV8 TPV9
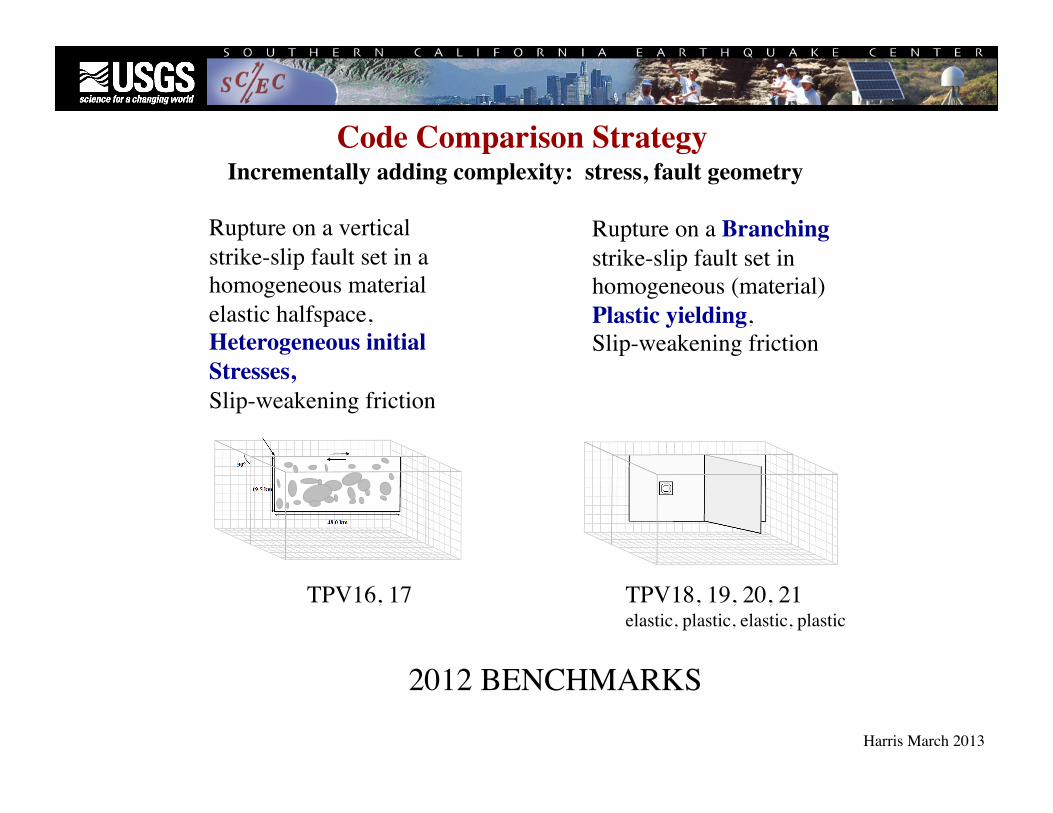
Code Comparison Strategy Incrementally adding complexity: stress, fault geometry
Rupture on a Branching strike-slip fault set in homogeneous (material) Plastic yielding, Slip-weakening friction
TPV16, 17 TPV18, 19, 20, 21 elastic, plastic, elastic, plastic
Rupture on a vertical strike-slip fault set in a homogeneous material elastic halfspace, Heterogeneous initial Stresses, Slip-weakening friction
2012 BENCHMARKS
Harris March 2013
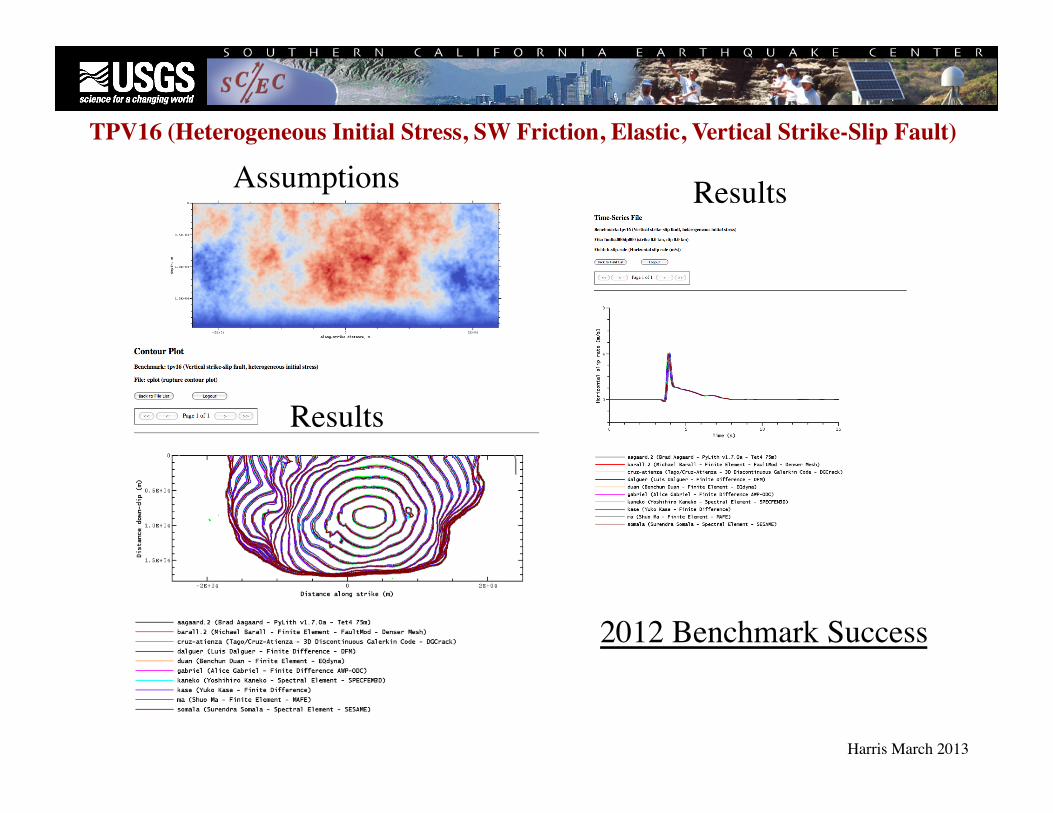
TPV16 (Heterogeneous Initial Stress, SW Friction, Elastic, Vertical Strike-Slip Fault)
Harris March 2013
Results Assumptions
Results
2012 Benchmark Success
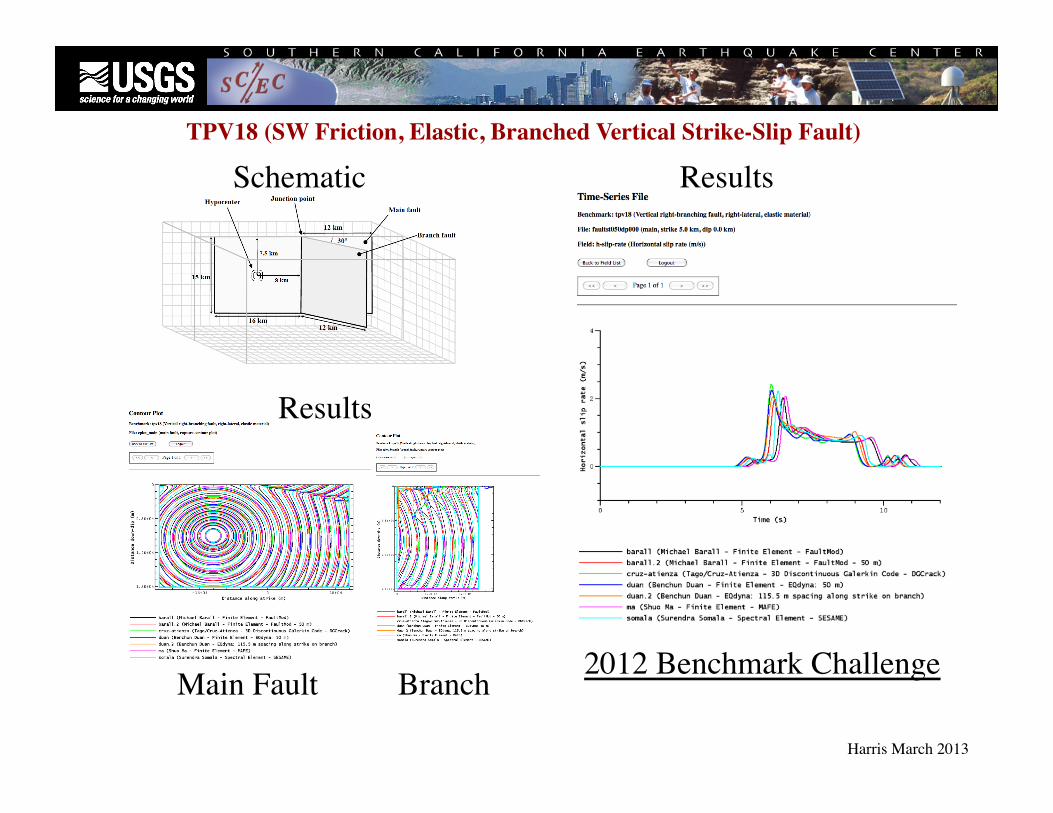
TPV18 (SW Friction, Elastic, Branched Vertical Strike-Slip Fault)
Harris March 2013
Schematic Results
Main Fault Branch
Results
2012 Benchmark Challenge
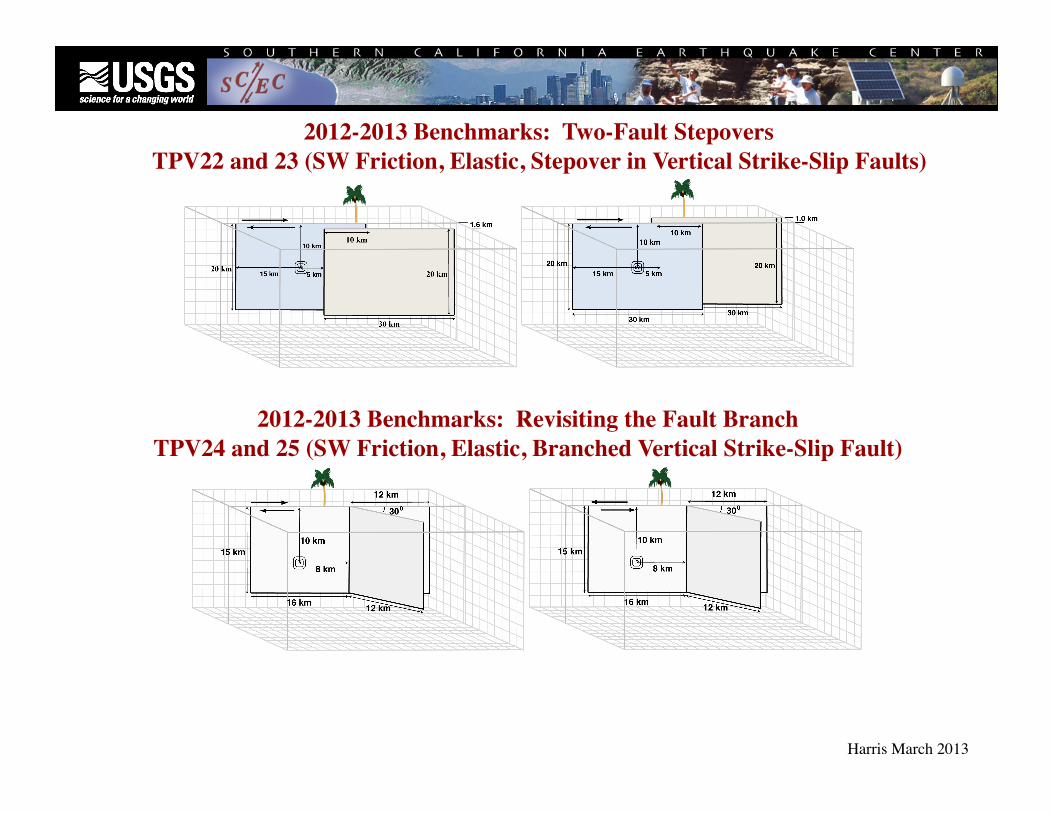
2012-2013 Benchmarks: Revisiting the Fault Branch TPV24 and 25 (SW Friction, Elastic, Branched Vertical Strike-Slip Fault)
Harris March 2013
2012-2013 Benchmarks: Two-Fault Stepovers TPV22 and 23 (SW Friction, Elastic, Stepover in Vertical Strike-Slip Faults)

Harris March 2013
Results for Benchmarks TPV22 and TPV23 (rupture-front contour plots)
TPV22 Dilational stepover
TPV23 Compressional stepover
Fault 1 Fault 2 Fault 1 Fault 2 TPV22 TPV23

Harris March 2013
Results for Benchmarks TPV22 and TPV23 (horizontal slip-rate vs. time)
TPV22 Dilational stepover
TPV23 Compressional stepover
3 hz low-pass Butterworth filter applied 3 hz low-pass Butterworth filter applied
TPV22 TPV23
On-Fault Station Location (5 km along strike at the earth’s surface, on fault 2)
15 seconds 15 seconds
3 m/s 4 m/s

Older Branch Benchmark: TPV18 (SW Friction, Elastic, Vertical Strike-Slip Faults)
Harris March 2013
Schematic Results
Main Fault Branch
Results
2012 Benchmark Challenge
Harris March 2013
Changes in Branch Fault Benchmarks from 2012 to 2013

Harris March 2013
Branch intersection definition changed, allowing for code-optimized implementations 2013: slip on the branch goes to zero at the intersection 2012: the branch ends one element away from the main fault���
Nucleation method changed 2013: smoother nucleation with fewer unwanted oscillations.���
Regional stress field changed 2013: neutral 2012: strongly extensional���
Difference between static & dynamic friction coefficients reduced, producing an easier to resolve cohesive zone 2013: µs=0.18 and µd=0.12 2012: µs=0.60 and µd=0.12���
Slip-weakening critical distance reduced 2013: 0.30 m 2012: 0.40 m���
2013: Convergence of each benchmark was tested by running 50 m and 100 m cases

New Branch Fault Benchmarks: TPV24 and TPV25
Harris March 2013
TPV24 Releasing Branch
TPV25 Restraining Branch

Results for Benchmarks TPV24 and TPV25 (rupture-front contour plots)
Harris March 2013
TPV24 TPV25
TPV24 Releasing Branch
TPV25 Restraining Branch
Main Fault Branch Fault Main Fault Branch Fault
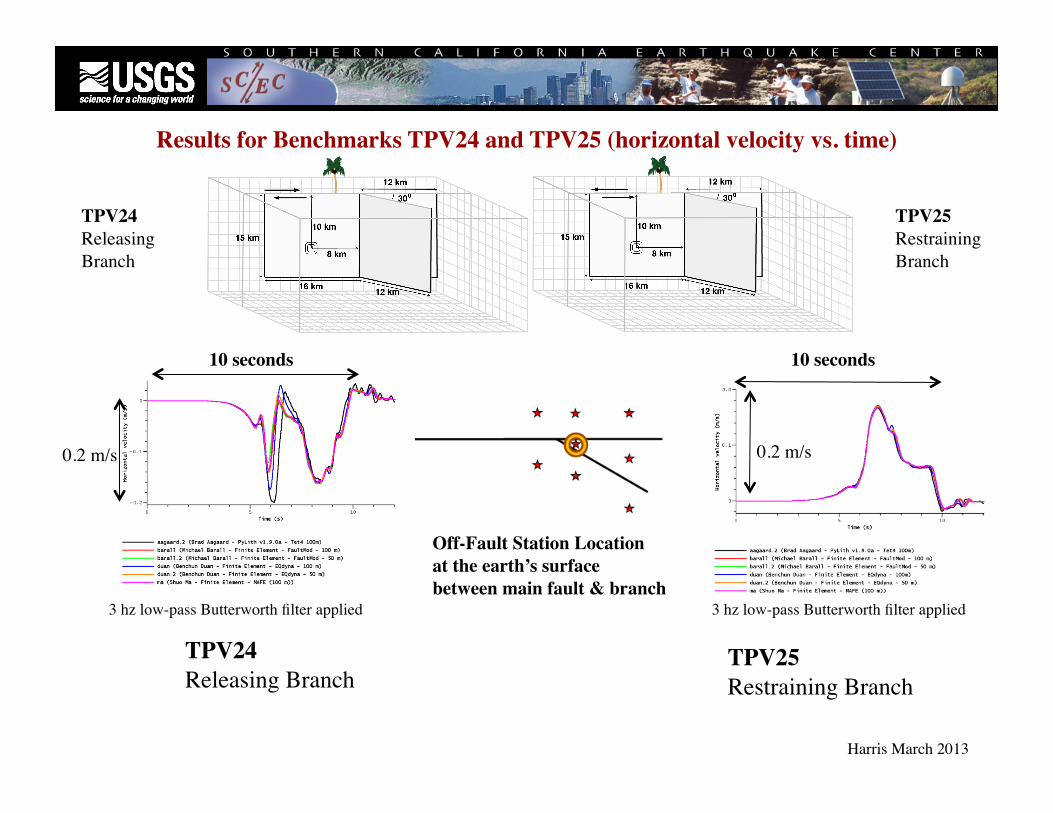
Results for Benchmarks TPV24 and TPV25 (horizontal velocity vs. time)
Harris March 2013
TPV24 Releasing Branch
TPV25 Restraining Branch
TPV24 Releasing Branch
TPV25 Restraining Branch
Off-Fault Station Location at the earth’s surface between main fault & branch
3 hz low-pass Butterworth filter applied 3 hz low-pass Butterworth filter applied
0.2 m/s 0.2 m/s
10 seconds 10 seconds

Results for Benchmarks TPV24 and TPV25 (final fault slip)
Harris March 2013
TPV24 Releasing Branch TPV25 Restraining Branch
TPV24 Releasing Branch
TPV25 Restraining Branch
Main Fault Branch Fault Main Fault Branch Fault
Final slip 0.0 0.5 1.0 1.5 2.0 2.5 m

For More Information about our group’s work, Please see our website http://scecdata.usc.edu/cvws
Our 2011 SRL article Harris, R.A., M. Barall, D.J. Andrews, B. Duan, S. Ma, E.M. Dunham,
A.-A. Gabriel, Y. Kaneko, Y. Kase, B.T. Aagaard, D.D. Oglesby, J.-P. Ampuero, T.C. Hanks, N. Abrahamson,
Verifying a Computational Method for Predicting Extreme Ground Motion, Seismological Research Letters, vol. 82, 638-644, 2011.
Our 2009 SRL article Harris, R.A., M. Barall, R. Archuleta, B. Aagaard, J.-P. Ampuero,
H. Bhat, V. Cruz-Atienza, L. Dalguer, P. Dawson, S. Day, B. Duan, E. Dunham, G. Ely, Y. Kaneko, Y. Kase, N. Lapusta, Y. Liu, S. Ma, D. Oglesby, K. Olsen, A. Pitarka, S. Song, and E. Templeton,
The SCEC/USGS Dynamic Earthquake-Rupture Code Verification Exercise, Seismological Research Letters, vol. 80, 119-126, 2009.
Harris March 2013


Harris March 2013
Notes on some of the parameters for the branching faults
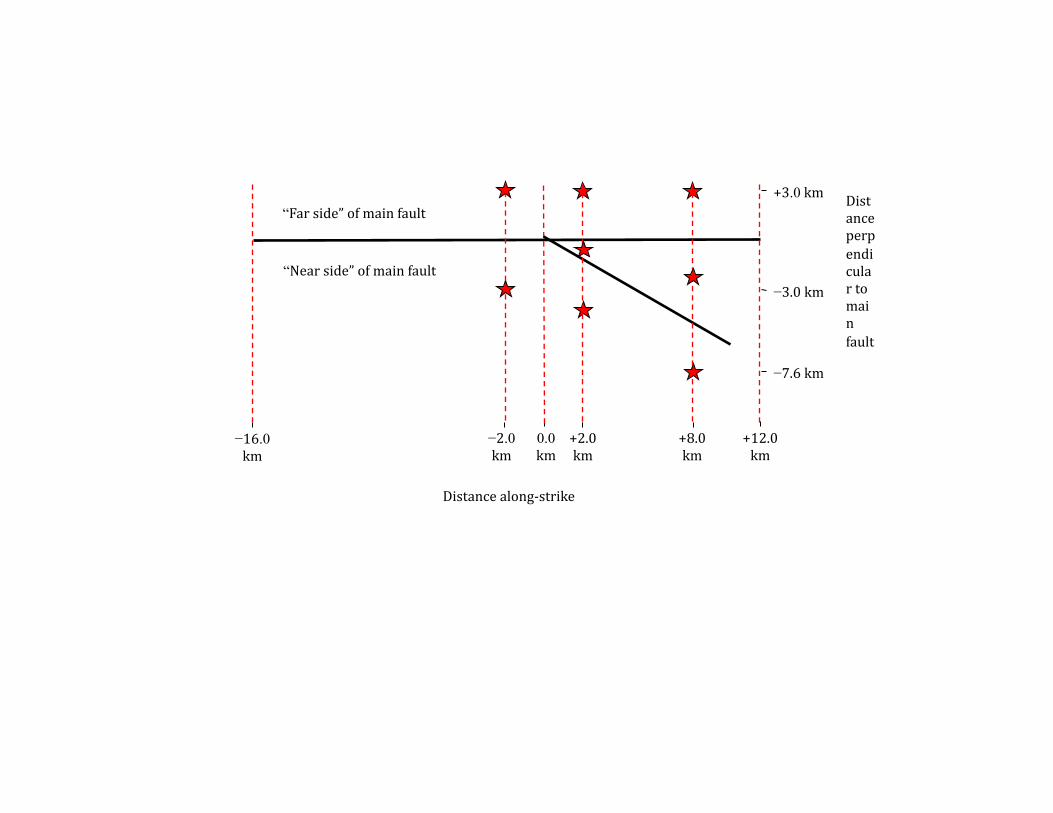
−3.0 km
+3.0 km
−7.6 km
0.0 km
+2.0 km
+8.0 km
+12.0 km
−2.0 km
−16.0 km
Distance along-‐strike
Distance perpendicular to main fault
“Far side” of main fault
“Near side” of main fault
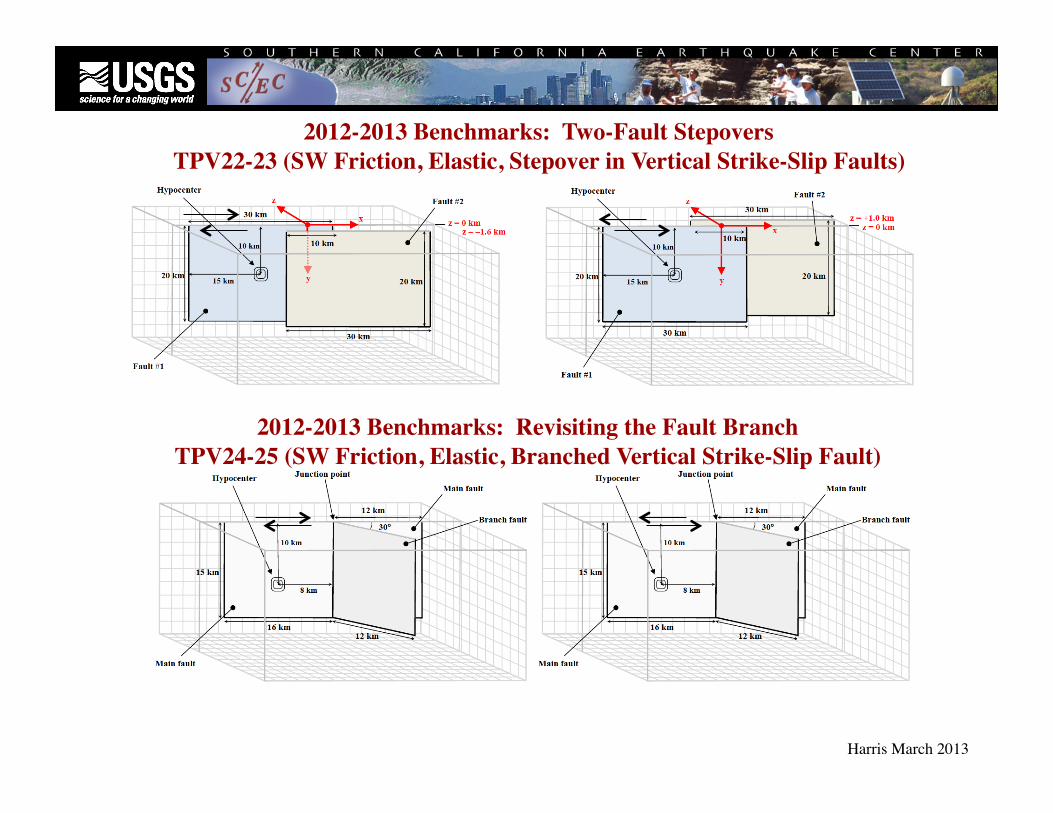
2012-2013 Benchmarks: Revisiting the Fault Branch TPV24-25 (SW Friction, Elastic, Branched Vertical Strike-Slip Fault)
Harris March 2013
2012-2013 Benchmarks: Two-Fault Stepovers TPV22-23 (SW Friction, Elastic, Stepover in Vertical Strike-Slip Faults)