the savannah river site - srscro · the savannah river site’s impact on the five-county area...
TRANSCRIPT
AUGUST 2017
THE SAVANNAH RIVER SITE: ECONOMIC IMPACT AND WORKFORCE TRANSITION

SRS COMMUNITY REUSE ORGANIZATION
IMPACT & CONSEQUENCE ANALYSIS PAGE | I
ACKNOWLEDGEMENTS TIP Strategies would like to thank the many individuals and organizations that were involved with this project, that provided us with input and feedback. Particularly, we would like to thank the SRS staff:
Thomas Johnson Associate Deputy Manager US DOE, Savannah River Operations
John Lopez Director, Office of Integration and Planning US DOE, Savannah River Operations
ABOUT US
The SRS Community Reuse Organization is a 501(c)(3) private nonprofit organization charged with developing and implementing a comprehensive strategy to diversify the economy of a five-county region in the Central Savannah River Area of Georgia and South Carolina. SRSCRO counties include Aiken, Allendale, and Barnwell in South Carolina and Richmond and Columbia in Georgia.
CONSULTING TEAM:
TIP STRATEGIES, INC. is a privately held Austin and Seattle based economic development consulting firm committed to providing quality solutions for public and private sector clients. Established in 1995, the firm's primary focus is economic development strategic planning.
CONTACT
TIP Strategies 2905 San Gabriel Street, Suite 205 Austin, Texas 78705 PH: 512.343.9113 FX: 512.343.9190 www.tipstrategies.com
CONSULTING TEAM
Tom Stellman President and CEO
Caroline Alexander Senior Consultant
SIMON MEDCALFE, AUGUSTA UNIVERSITY
Associate Professor of Finance Cree Walker Chair, Hull College of Business

SRS COMMUNITY REUSE ORGANIZATION
PAGE | II
CONTENTS EXECUTIVE SUMMARY ............................................................................................................................................ 1
FISCAL AND ECONOMIC IMPACT ....................................................................................................................... 2 IMPACT OF WORKFORCE CHANGES AND TRANSITION ................................................................................. 3 STRATEGIC CONSIDERATIONS .......................................................................................................................... 5
INTRODUCTION ........................................................................................................................................................ 6 OVERVIEW OF THE SAVANNAH RIVER SITE .................................................................................................... 6 THE LOCAL ECONOMIC CONTEXT .................................................................................................................. 10
SAVANNAH RIVER SITE TODAY ............................................................................................................................ 16 ANNUAL EXPENDITURES .................................................................................................................................. 16 ANNUAL SALARIES & EMPLOYMENT............................................................................................................... 17
ECONOMIC IMPACT ON THE LOCAL ECONOMY ................................................................................................. 19 EMPLOYMENT IMPACT ...................................................................................................................................... 19 OUTPUT IMPACT ................................................................................................................................................ 20 INCOME IMPACT ................................................................................................................................................. 21 FISCAL IMPACT ................................................................................................................................................... 22 IMPACT SUMMARY ............................................................................................................................................. 22 EMPLOYEE CONTRIBUTIONS AND COMMUNITY SUPPORT ........................................................................ 23
SCENARIOS & SENSITIVITY ANALYSIS ................................................................................................................ 25 SCENARIO 1: JOB LOSS/GAIN .......................................................................................................................... 25 SCENARIO 2: WORKFORCE TRANSITION ....................................................................................................... 25
IMPLICATIONS OF THE WORKFORCE TRANSITION ........................................................................................... 27 GENERATIONAL TRENDS .................................................................................................................................. 27 MARKET SEGMENTATION ................................................................................................................................. 29 IMPLICATIONS FOR THE REGION .................................................................................................................... 39
REGIONAL ASSET AND AMENITIES ...................................................................................................................... 40 HOUSING ............................................................................................................................................................. 40 EDUCATION......................................................................................................................................................... 41 QUALITY OF PLACE ........................................................................................................................................... 43
IMPLICATIONS FOR THE REGION......................................................................................................................... 49 CASE STUDIES ....................................................................................................................................................... 50
LOS ALAMOS, NEW MEXICO ............................................................................................................................. 50 TRI-CITIES, WASHINGTON ................................................................................................................................ 51 OAK RIDGE, TENNESSEE .................................................................................................................................. 52 CENTRAL TEXAS ................................................................................................................................................ 52
STRATEGIC CONSIDERATIONS ............................................................................................................................ 54 APPENDIX 1. METHODOLOGY AND DATA ........................................................................................................... 57
PRIMARY DATA DESCRIPTION AND ESTIMATES ............................................................................................ 58 APPENDIX 2. COMPARISON WITH THE PREVIOUS STUDY ............................................................................... 59 Image Credits: (front cover) Mixed Oxide (MOX) construction site at SRS courtesy Savannah River Site

SRS COMMUNITY REUSE ORGANIZATION
IMPACT & CONSEQUENCE ANALYSIS PAGE | 1
EXECUTIVE SUMMARY The Savannah River Site (SRS, the Site) has been a key economic driver in the surrounding region since its establishment in the early 1950s. In fact, SRS and Fort Gordon, together, are responsible for an estimated 37,000 jobs, making the federal government and its associated contractors the largest industry sector in the region.
FIGURE 1. COMPARATIVE EMPLOYMENT BY MAJOR SECTOR APPROXIMATE FIGURES, SRS IMPACT AREA
Source: EMSI 2017.1 – QCEW Employees, Non-QCEW Employees, and Self-Employed
The counties most impacted by SRS operations are Aiken, Allendale, and Barnwell Counties in South Carolina and Columbia and Richmond Counties in Georgia. Although employment has waned over time as its mission has evolved, SRS remains one of the largest employers in the area. As such, the influence of the Site extends across the entire region as many of the dollars circulating in the regional economy originate from or are related to the Site. The primary purpose of this study is to measure the impact of SRS on the surrounding five-county region and understand how SRS influences the surrounding communities.
Since changing significantly in the 1990s, SRS’s mission has been relatively stable. The outlook for SRS remains steady as the Environmental Management and National Nuclear Security Administration missions continue. Yet, a significant transition is on the horizon for the Site: the SRS workforce will change over the next five years as an estimated 3,000 workers will retire and will need to be replaced. Thus, a secondary purpose of this study is to provide insights into the possible effects this transition could have on the region.
FIGURE 2. SRS IMPACT AREA
37,000 Federal Government
30,000 Healthcare &
Social Assistance
25,000 Retail
25,000 Educational
Services 19,000
Manufacturing
SRS
SRS COMMUNITY REUSE ORGANIZATION
IMPACT & CONSEQUENCE ANALYSIS PAGE | 2
FISCAL AND ECONOMIC IMPACT The Savannah River Site’s impact on the five-county area goes beyond the number of jobs and the dollars spent in the local economy. The Site has a ripple effect in the local economy as each dollar spent circulates in the local economy and each employee spends their earnings in the local economy.
To estimate the total economic and fiscal impact of the Site on the five-county region, an economic impact analysis was conducted. The analysis estimates three types of impacts: direct, indirect, and induced.
The direct effect is the initial change in expenditures or jobs. These are associated with SRS’s direct gross receipts and include the gross industry output, workers (local employment), and labor earnings (income).
The indirect effect is the secondary impact of the Site buying goods and services from other local industries, with the cycle of spending working its way through the supply chain. In other words, the indirect effect is associated with SRS organizations spending in the local economy.
The induced effect is the response by the local economy that occurs through re-spending of income. These effects arise as SRS workers spend their income at retail, service, and other types of local establishments. This spending boosts profits at local businesses, which, in turn, leads to more spending by the businesses and their employees.
The total economic impact is the sum of the direct, indirect, and induced effects of the SRS operations.
The results of the study are summarized below.
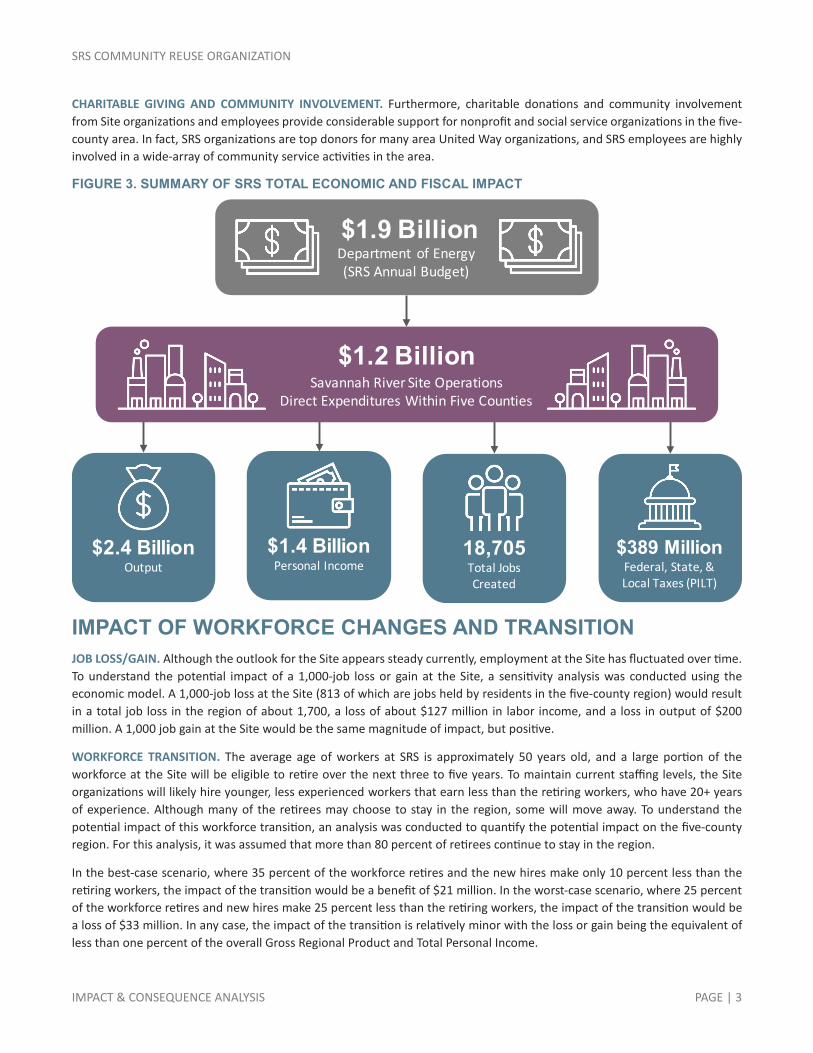
OUTPUT. The SRS budget for 2016 was $1.9 billion. Of this, SRS organizations spent $1.2 billion in the regional economy in the form of wages, benefits, and other direct expenditures. This spending by SRS organizations generated an additional $1.2 billion. In other words, for every one dollar SRS organizations spend in the local economy, an additional dollar is spent in the five counties. The total $2.4 billion in output is 11 percent of the Gross Regional Product.
EMPLOYMENT. The Site includes five federal agencies and seven contractors that employed 8,566 residents of the five-county region in 2016. The spending associated with the Site generated an additional 10,139 jobs in sectors such as restaurants, real estate, employment services, building services, and retail. Thus, for every one job at SRS, an additional 1.2 jobs were created in the five counties. In all, the Site is responsible for 18,705 jobs in the regional economy, which is 7.9 percent of the five-county region’s employment base.
JOBS AND WAGES. The Site provides a wide range of good jobs for residents in the five-county region. The Site organizations provide a range of jobs and careers requiring different skills and education. Site organizations offer jobs in business management, information technology, security, construction, management of natural resources, scientific research, and engineering. Many organizations employ craft personnel with a high school diploma while others provide entry level jobs after college and managerial opportunities after many years of experience. The average compensation (wages plus benefits) for workers at the Site who reside in the five-county area was $121,356. By comparison, the average earnings per job for the region (wages, salaries, benefits, and other compensation) is $52,159. In other words, the average job at the Site pays the equivalent of 2.3 average jobs in the five-county region.
LABOR INCOME. In all, the total labor income generated directly by the Site was $1.0 billion. This income includes all wages, salaries, profits, interest, rents, and other major forms of income earned by residents. As this income rippled through the regional economy, it generated an additional $374 million in income for a total of $1.4 billion. This $1.4 billion represents 7.0 percent of total personal income in the region. On a per capita basis, the income impact of SRS operations is $2,603 per person in the five-county area.
TAXES. In addition, activities at the Site generate local, state, and federal taxes. The Site generated $91 million in state and local taxes and $291 million in federal taxes. In addition, SRS organizations pay $6.5 million in Payments in Lieu of Taxes.
SRS COMMUNITY REUSE ORGANIZATION
IMPACT & CONSEQUENCE ANALYSIS PAGE | 3
CHARITABLE GIVING AND COMMUNITY INVOLVEMENT. Furthermore, charitable donations and community involvement from Site organizations and employees provide considerable support for nonprofit and social service organizations in the five-county area. In fact, SRS organizations are top donors for many area United Way organizations, and SRS employees are highly involved in a wide-array of community service activities in the area.
FIGURE 3. SUMMARY OF SRS TOTAL ECONOMIC AND FISCAL IMPACT
IMPACT OF WORKFORCE CHANGES AND TRANSITION JOB LOSS/GAIN. Although the outlook for the Site appears steady currently, employment at the Site has fluctuated over time. To understand the potential impact of a 1,000-job loss or gain at the Site, a sensitivity analysis was conducted using the economic model. A 1,000-job loss at the Site (813 of which are jobs held by residents in the five-county region) would result in a total job loss in the region of about 1,700, a loss of about $127 million in labor income, and a loss in output of $200 million. A 1,000 job gain at the Site would be the same magnitude of impact, but positive.
WORKFORCE TRANSITION. The average age of workers at SRS is approximately 50 years old, and a large portion of the workforce at the Site will be eligible to retire over the next three to five years. To maintain current staffing levels, the Site organizations will likely hire younger, less experienced workers that earn less than the retiring workers, who have 20+ years of experience. Although many of the retirees may choose to stay in the region, some will move away. To understand the potential impact of this workforce transition, an analysis was conducted to quantify the potential impact on the five-county region. For this analysis, it was assumed that more than 80 percent of retirees continue to stay in the region.
In the best-case scenario, where 35 percent of the workforce retires and the new hires make only 10 percent less than the retiring workers, the impact of the transition would be a benefit of $21 million. In the worst-case scenario, where 25 percent of the workforce retires and new hires make 25 percent less than the retiring workers, the impact of the transition would be a loss of $33 million. In any case, the impact of the transition is relatively minor with the loss or gain being the equivalent of less than one percent of the overall Gross Regional Product and Total Personal Income.
$2.4 BillionOutput
$1.4 BillionPersonal Income
18,705Total Jobs Created
$389 MillionFederal, State, & Local Taxes (PILT)
$1.9 BillionDepartment of Energy(SRS Annual Budget)
$1.2 BillionSavannah River Site Operations
Direct Expenditures Within Five Counties

SRS COMMUNITY REUSE ORGANIZATION
IMPACT & CONSEQUENCE ANALYSIS PAGE | 4
INFLUX OF NEW RESIDENTS. The larger potential impact on the five-county region, especially when considered with the ongoing growth at Fort Gordon, is a result of the influx of new residents into the region. Between 2,500 and 3,000 new workers could move to the area associated with SRS. In addition, Fort Gordon, located outside of Augusta, is expanding to house the Army Cyber Command. This move is expected to create 4,700 civilian and military jobs. Including family members, the Army estimates a total of 13,000 new residents in the Augusta metro area by 2020. Around 2,400 of these will be school-age children. This influx of new residents will influence the regional housing markets, the public education system, and the demand for community amenities.
The new residents will likely be millennials and a large portion of them will likely be young families with children though some will be young professionals. The various counties in the SRS Impact Area offer distinct lifestyles and amenities, from rural to urban, that appeal to a broad range of market segments. The region is rich in assets; however, there are some areas where further investments may be needed to accommodate these new residents. Research on generational trends and on the market segments that the new residents will likely represent reveals several implications for communities in the five-county region:
HOUSING. The areas of the region that are more oriented towards rural living and retirees may not be natural draws for new SRS workers relocating to the region. However, some of these communities are where the majority of current SRS workers live. On the other hand, the more urban areas of the region and newer suburban communities will likely be appealing to a range of different market segments that the new workers might represent.
Housing preferences for the likely market segments of the new workers at SRS will increase the demand for rental units in the region. The younger generation is waiting longer to buy homes and renting until they reach this milestone. The propensity for the younger generation to switch jobs in favor of better fit or better pay drives their desire for greater housing flexibility, but the levels of student loans and the fall in real wages also contributes to the delay in home buying.
The housing markets in some areas of the region are tightening and more inventory of single family homes will likely be needed to accommodate the influx of new residents to the region. Additional rental units will also likely be needed to accommodate the next generations of residents.
EDUCATION. The importance of public school quality to families moving to the area means that school district boundaries and school attendance zones will heavily influence families’ home-buying decisions.
The region’s school districts are of varied quality. Most, however, have several stand-out programs that provide exemplary educational opportunities for students with access to these programs. There are areas of the region that do not have the density of students to support this kind of programming, which will likely prove to be a barrier to attracting new residents.
QUALITY OF PLACE. The desired amenities and common activities of Millennials and Baby-Boomers do have some overlap. Community, friends, and family are important to both groups. In addition, both groups share an interest in outdoor activities and sports and embody a strong sense of volunteerism.
Communities in the region are making big investments in community assets – downtowns, town centers, park and recreation systems, and performing arts and sports venues. These projects complement existing amenities. Continually maintaining and marketing the existing amenities to new residents will be essential to leveraging their value.
SRS COMMUNITY REUSE ORGANIZATION
IMPACT & CONSEQUENCE ANALYSIS PAGE | 5
STRATEGIC CONSIDERATIONS Communities in the region can actively position themselves to attract a share of the new residents to their communities. The following lists strategies that communities could consider to strengthen their position in the region.
1. ENGAGE AND RETAIN: Engage and retain new workers at SRS as well as retirees in the five-county region.
1.1. Expand and enhance work-place programs to tie SRS employees more closely to communities in the region.
2. OUTSTANDING EDUCATIONAL OPPORTUNITIES: Ensure students across the region have access to outstanding educational opportunities.
2.1. Explore the feasibility of a regional initiative such as StriveTogether to help the school districts tackle their biggest challenges collectively.
2.2. Expand access to blue-ribbon educational programs such as magnet programs, scholarship programs, dual credit / early college high schools.
2.3. Continue to strengthen connections between educational institutions and SRS organizations.
3. NEXT-GEN HOUSING OPTIONS: Encourage the development of housing products for the next generation of residents.
3.1. Work with neighborhoods with aging housing stock or less popular “product” to identify ways to re-invent themselves as intergenerational neighborhoods.
3.2. Promote the development of new kinds of communities or housing products.
4. QUALITY OF PLACE MATTERS: Continue to invest in community assets to enhance the region’s unique quality of place.
4.1. Identify and invest in a handful of high-quality, well-maintained, character-defining amenities.
SRS COMMUNITY REUSE ORGANIZATION
IMPACT & CONSEQUENCE ANALYSIS PAGE | 6
INTRODUCTION The Savannah River Site (SRS, the Site) has been a key economic driver in the surrounding five-county region since its establishment in the early 1950s. Although employment has waned over time as its mission has evolved, SRS remains one of the largest employers in the area. As such, the influence of the Site extends across the entire region as many of the dollars circulating in the regional economy originate from or are related to the Site. The primary purpose of this study is to quantify the impact of SRS on the surrounding region.
Since changing significantly in the 1990s, SRS’s mission has been relatively stable. The outlook for SRS remains steady as the environmental management mission continues. Yet, a significant transition is on the horizon for the Site: the SRS workforce will change over the next five years as an estimated 3,000 workers will retire and will need to be replaced. Thus, a secondary purpose of this study is to provide insights into the possible effects this transition could have on the region.
The report that follows provides an overview of SRS as well as the local economy and quantifies the current impact of the Site. Then, the impact of possible scenarios involving the upcoming workforce transition are presented. Finally, the workforce transition is explored more deeply in terms of how the regional communities can plan for and respond to these changes.
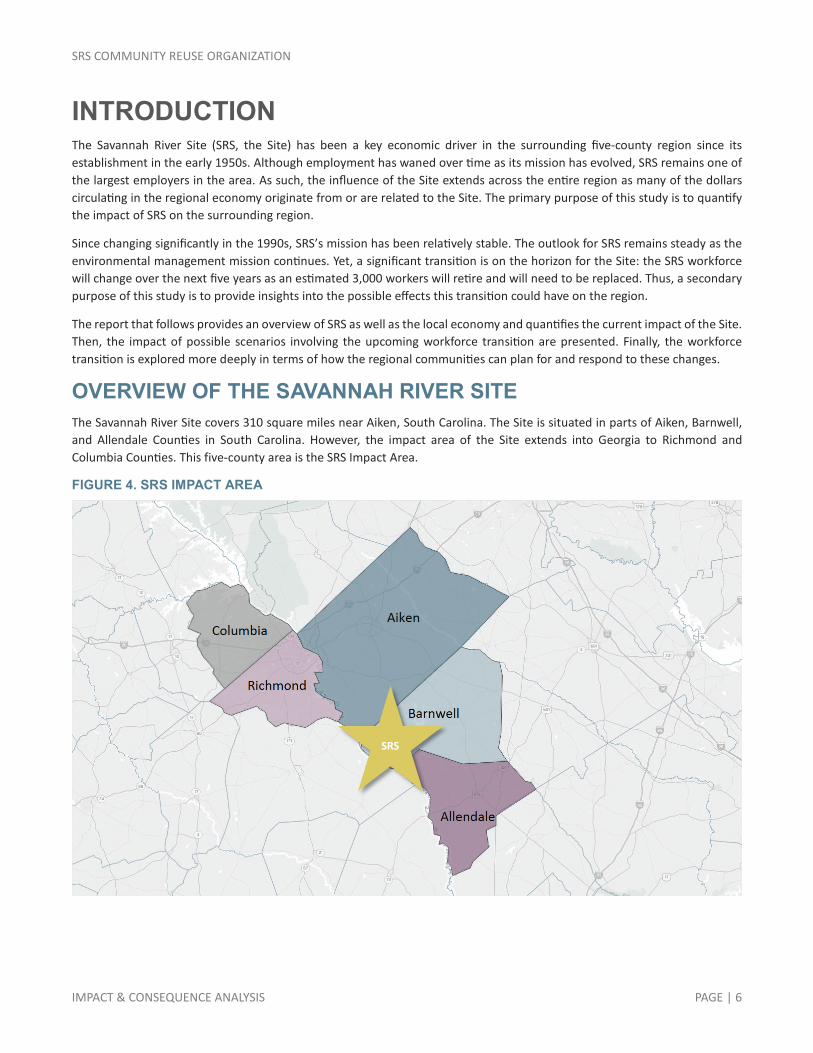
OVERVIEW OF THE SAVANNAH RIVER SITE The Savannah River Site covers 310 square miles near Aiken, South Carolina. The Site is situated in parts of Aiken, Barnwell, and Allendale Counties in South Carolina. However, the impact area of the Site extends into Georgia to Richmond and Columbia Counties. This five-county area is the SRS Impact Area.
FIGURE 4. SRS IMPACT AREA
SRS

SRS COMMUNITY REUSE ORGANIZATION
IMPACT & CONSEQUENCE ANALYSIS PAGE | 7
The Savannah River Site was constructed during the early 1950s to produce the basic materials used in the fabrication of nuclear weapons, primarily tritium and plutonium-239. Five reactors were built to produce these materials. Several support facilities were also built including two chemical separations plants, a heavy water extraction plant, a nuclear fuel and target fabrication facility, a tritium extraction facility, and waste management facilities. Between 1953 and 1988, SRS produced and shipped about 36 metric tons of plutonium.
After 50 years of producing nuclear materials for defense and non-defense uses, SRS shifted its strategic direction and resources from nuclear weapons materials production to cleanup of the nuclear waste and environmental contamination created during production. SRS now processes and stores nuclear materials in support of national defense and US nonproliferation efforts. The Site also develops and deploys technologies to improve the environment and treat solid and liquid nuclear and hazardous wastes left from the Cold War. In fact, since 2002, the Site has blended down 22 metric tons of surplus enriched uranium that has been used by the Tennessee Valley Authority in its commercial reactors to produce electricity. In addition, 36 million gallons of radioactive liquid waste are safely stored in the Site’s underground tanks.
The primary Department of Energy programs and mission areas at SRS are Environmental Management (EM) and National Nuclear Security Administration (NNSA). EM represents 68 percent of the current budget. This includes management, stabilization, and disposition of nuclear materials; management and disposition of solid, liquid and transuranic wastes; spent fuel management; and environmental remediation and cleanup. Thirty two percent of the budget is related to the NNSA including tritium operations and extraction; helium-3 recovery; nonproliferation support; mixed oxide (MOX) fuel fabrication; uranium blending and shipping; and foreign fuel receipts.
The Savannah River Site is owned by the US Department of Energy. Federal agencies at SRS include:
The Department of Energy—Savannah River Operations Office (DOE-SR);
National Nuclear Security Administration—Savannah River Field Office (NNSA-SRFO);
National Nuclear Security Administration—Office of Fissile Materials Disposition;
National Nuclear Security Administration—MOX Project Office (NNSA-MOX PMO); and
US Forest Service—Savannah River (USFS).
Throughout most of its operating history, SRS had two major organizations as the primary contractors for carrying out the Site’s missions. The Site was initially governed by the Atomic Energy Commission with DuPont as the management and operations (M&O) contractor. In 1989, Westinghouse and other successor contractors took over as the M&O contractor for the Department of Energy. Currently, to better align contracts with the current site missions, there are six “primary” contract organizations that have responsibility for different programs and project elements at SRS.
FIGURE 5. CONSTRUCTION OF REACTORS
Archive photo courtesy of Savannah River Site/DOE

SRS COMMUNITY REUSE ORGANIZATION
IMPACT & CONSEQUENCE ANALYSIS PAGE | 8
The primary contractors on site are:
Savannah River Nuclear Solutions, LLC (SRNS);
Savannah River Remediation, LLC (SRR);
CB&I AREVA MOX Services, LLC (MOX);
Parsons/Atkins;
Centerra Group, LLC;
Savannah River Ecology Lab (SREL), operated by the University of Georgia; and
Ameresco.
SRNS is responsible for the Site’s nuclear facility operations, except for the liquid waste facilities, which are the responsibility of SRR. CB&I AREVA MOX Services is building the Mixed Oxide Fuel Fabrication Facility, which will convert excess weapons-usable plutonium for use in commercial power reactors. Parsons is responsible for the salt waste processing facility and Centerra is responsible for Site security. SREL began ecological studies of plants and animals in 1951 and continues to do so today. In addition, Ameresco operates a biomass cogeneration facility on the Site.
Over the next three years, the contractors are likely to change. Currently, the liquid waste contract, held by SRR, will be re-bid, and in 2018, the M&O contract, currently held by SRNS, will be re-bid. Parsons will have until 2019 to get the SWPF operational and then will have a one-year contract to operate the facility. After that, SWPF will be part of the liquid waste contract. Regardless of who the contractor(s) are, it will not affect site missions.
FIGURE 6. SAVANNAH RIVER SITE ALIGNMENT OF DOE MISSION OWNERS AND PRIMARY CONTRACTORS
DOE-EMEnvironmental Management
(Site Landlord)
DOE-NNSANational Nuclear Security
AdministrationDefense Programs
US Forest Service
CenterraSite Security
Salt Waste Processing Facility
Parsons
Savannah River RemediationLiquid Waste Operations
Savannah River Nuclear Solutions (M&O Contractor)
• Landlord Services• EM Cleanup Activities
(Excluding Liquid Waste)• NNSA Activities• Savannah River National
Laboratory
Savannah River Ecology LabUniversity of GA
AmerescoBiomass Construction &
Operations
DOE-NNSANational Nuclear Security
AdministrationNuclear Nonproliferation
CB&I AREVA MOX ServicesMOX Construction
Federal Agency
Primary Contractor

SRS COMMUNITY REUSE ORGANIZATION
IMPACT & CONSEQUENCE ANALYSIS PAGE | 9
Over the past decade, the total headcount at the Savannah River Site has ranged from a low of 9,900 in 2008 to a high of 13,300 in 2010. Overall, employment has averaged about 11,000 between 2006 and 2016. The spike in employment between 2010 and 2012 was the result of the funding that was part of the American Recovery and Reinvestment Act. Since 2013, employment at the Site has gradually increased.
FIGURE 7. TOTAL HEADCOUNT 2006-2016
Source: US Department of Energy-Savannah River Operations Office, SRS Historical Headcount and Workforce Restructuring Data, 4th Quarter – FY 2015 Force Report, 4th Quarter – FY 2016 Force Report.
0
2,000
4,000
6,000
8,000
10,000
12,000
14,000
2006
2007
2008
2009
2010
2011
2012
2013
2014
2015
2016
Num
ber o
f Em
ploy
ees

SRS COMMUNITY REUSE ORGANIZATION
IMPACT & CONSEQUENCE ANALYSIS PAGE | 10
THE LOCAL ECONOMIC CONTEXT The SRS Impact Area has a population of 547,000. The population has grown more than 10 percent since 2006, from 494,000. Columbia County has led the region in population growth, increasing more than 33 percent over the decade. Aiken County was the next fastest growing county, followed by Richmond County. Allendale and Barnwell Counties both experienced slightly negative population growth over this period.
FIGURE 8. POPULATION ESTIMATES 2006-2016, BY COUNTY
Source: US Census Bureau, Population Estimates Program via Moody’s Analytics.
The median household incomes of each county in the region vary widely. Columbia County has the highest median household income at $71,021 and is the only county with a median income higher than the US. Aiken County has the second highest median household income in the region, though lower than the US. Allendale County has the lowest median household income at $25,327.
FIGURE 9. MEDIAN HOUSEHOLD INCOME
Source: 2015 ACS 5-year Estimates.

SRS COMMUNITY REUSE ORGANIZATION
IMPACT & CONSEQUENCE ANALYSIS PAGE | 11
Figure 10 provides an overview of the regional labor market. The five-county Savannah River Site Impact Area has a total labor force of 242,000, with 228,000 employed and 14,000 unemployed. The region’s unemployment rate was 5.6 percent in 2016, which is higher than that of the relevant states and the nation. The unemployment rates in the individual counties varied from a low of 4.7 percent in Columbia County to a high of 8.5 percent in Allendale County.
FIGURE 10. LABOR MARKET OVERVIEW 2016, IN THOUSANDS
Geography Labor Force Employment Number of Unemployed Unemployment Rate
USA 159,186 151,437 7,750 4.9%
Georgia 4,917 4,651 266 5.4%
South Carolina 2,297 2,185 112 4.9%
SRS Impact Area 242 228 14 5.6%
Richmond County, GA 86 80 6 6.7%
Aiken County, SC 75 71 4 4.9%
Columbia County, GA 70 67 3 4.7%
Barnwell County, SC 8 8 1 7.0%
Allendale County, SC 3 2 0 8.5%
Source: US Bureau of Labor Statistics
The labor force participation rates for the region vary from a low of 45.8 percent in Allendale County to a high of 65.1 percent in Columbia County. Columbia County is the only county in the region that has a higher labor force participation rate than the state and the nation. Allendale County has the lowest participation rate with more than half of the population (16 or older) not engaged in the labor force.
FIGURE 11. LABOR FORCE PARTICIPATION RATES 2015, PERCENT
Source: 2015 ACS 5-year Estimates.

SRS COMMUNITY REUSE ORGANIZATION
IMPACT & CONSEQUENCE ANALYSIS PAGE | 12
The five-county region has an employment base of almost 240,000 jobs. Over the last decade, total employment grew from 231,818 in 2006 to 236,823 in 2016.
FIGURE 12. TOTAL EMPLOYMENT 2006-2016, SRS IMPACT AREA
Source: EMSI 2017.1 – QCEW Employees, Non-QCEW Employees, and Self-Employed
Although the regional economy did not suffer quite as much as the nation during the recession, it took longer to recover. Total employment in the region fell by 3 percent between 2008 and 2009 and continued to decline slightly until 2012. The total employment in the region did not surpass pre-recession levels until 2015.
FIGURE 13. CHANGE IN TOTAL EMPLOYMENT INDEXED TO 2006, SRS IMPACT AREA () VS. US ()
Source: EMSI 2017.1 – QCEW Employees, Non-QCEW Employees, and Self-Employed

SRS COMMUNITY REUSE ORGANIZATION
IMPACT & CONSEQUENCE ANALYSIS PAGE | 13
Employment in the five-county region is a mixture of growth and decline. In Allendale County, employment fell almost 30 percent over the last decade, and in Barnwell County, employment fell almost 23 percent. Over the same period, the remaining counties experienced growth. In Richmond County, employment rose about one percent, while Aiken County and Columbia County experienced increases of 4 percent and 14 percent, respectively.
FIGURE 14. CHANGE IN TOTAL EMPLOYMENT INDEXED TO 2006, BY COUNTY
Source: EMSI 2017.1 – QCEW Employees, Non-QCEW Employees, and Self-Employed
Estimated employment at Fort Gordon is approximately 26,000 (military, civilian, and contractor) and estimated employment at SRS is approximately 11,000 (federal agencies and contractors).1 Thus, the federal government is responsible for about 37,000 jobs in the five-county region.
By comparison, the healthcare & social assistance sector employs just over 30,000, the retail sector employs 25,000, and the educational services sector employs 25,000. The manufacturing sector employs just under 20,000.
FIGURE 15. COMPARATIVE EMPLOYMENT BY MAJOR SECTOR APPROXIMATE FIGURES, SRS IMPACT AREA
Source: EMSI 2017.1 – QCEW Employees, Non-QCEW Employees, and Self-Employed
1 http://www.fortgordonalliance.com/OurHistory.html
37,000 Federal Government
30,000 Healthcare &
Social Assistance
25,000 Retail
25,000 Educational
Services 19,000
Manufacturing
SRS COMMUNITY REUSE ORGANIZATION
IMPACT & CONSEQUENCE ANALYSIS PAGE | 14
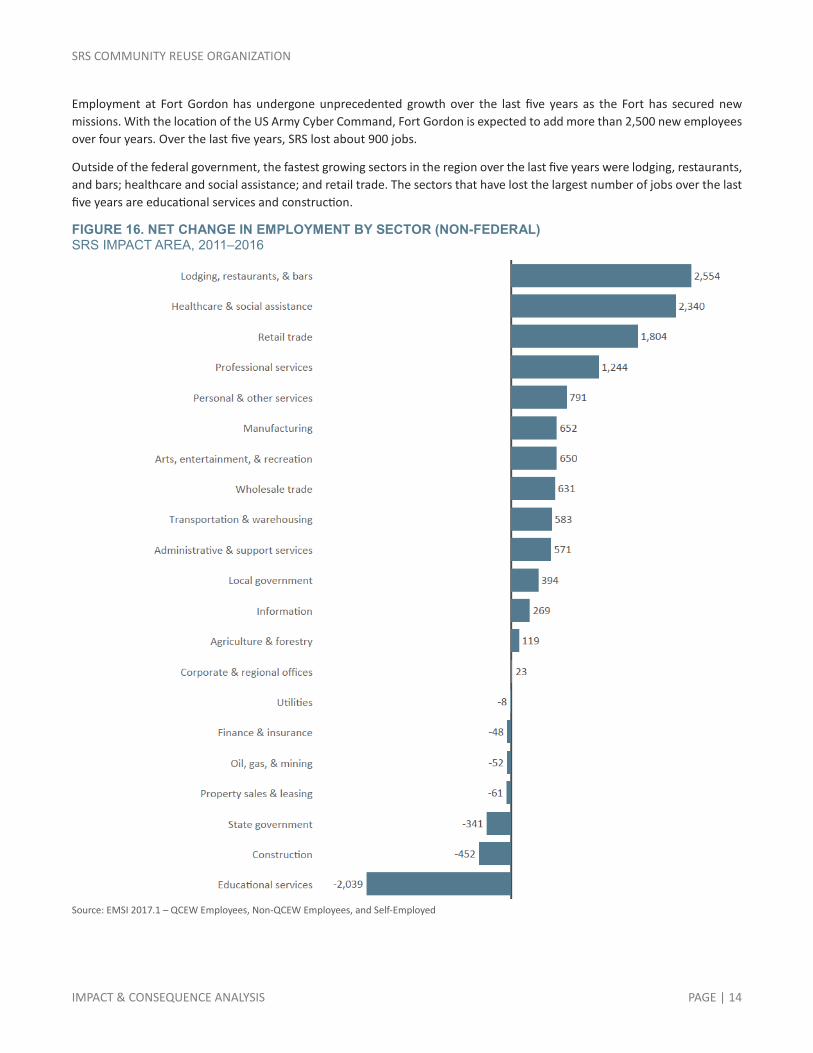
Employment at Fort Gordon has undergone unprecedented growth over the last five years as the Fort has secured new missions. With the location of the US Army Cyber Command, Fort Gordon is expected to add more than 2,500 new employees over four years. Over the last five years, SRS lost about 900 jobs.
Outside of the federal government, the fastest growing sectors in the region over the last five years were lodging, restaurants, and bars; healthcare and social assistance; and retail trade. The sectors that have lost the largest number of jobs over the last five years are educational services and construction.
FIGURE 16. NET CHANGE IN EMPLOYMENT BY SECTOR (NON-FEDERAL) SRS IMPACT AREA, 2011–2016
Source: EMSI 2017.1 – QCEW Employees, Non-QCEW Employees, and Self-Employed

SRS COMMUNITY REUSE ORGANIZATION
IMPACT & CONSEQUENCE ANALYSIS PAGE | 15
The median hourly wage for the region is $18.47, which is higher than the South Carolina average but lower than the Georgia average. The US median is $20.78. For certain occupations related to the Savannah River Site, the median hourly wage for the Impact Area is significantly higher. For example, median wages for mechanical engineers and security guards are higher in the region than in either of the states. For other occupations, the median hourly wage is somewhat elevated— information security analysts, nuclear engineers, and nuclear technicians. For occupations associated with business and operations functions, such as human resource managers and financial analysts, the wages in the impact area are lower than both the state averages.
FIGURE 17. WAGE COMPARISON MEDIAN HOURLY WAGES FOR SELECT OCCUPATIONS
SOC Description SRS Impact Area South Carolina Georgia
11-3121 Human Resources Managers $38.51 $40.90 $46.41
13-2051 Financial Analysts $27.34 $30.48 $34.31
15-1122 Information Security Analysts $38.04 $32.97 $41.63
17-2141 Mechanical Engineers $46.17 $41.45 $36.30
17-2161 Nuclear Engineers $44.82 $46.09 $42.49
19-4051 Nuclear Technicians $41.88 $40.75 $35.99
29-9012 Occupational Health and Safety Technicians $24.06 $24.09 $21.37
33-9032 Security Guards $13.76 $11.35 $11.25
49-9071 Maintenance and Repair Workers, General $16.36 $16.03 $16.51
51-4041 Machinists $18.68 $18.58 $17.81
Regional Average $18.47 $17.87 $19.73
Source: EMSI 2017.1 – QCEW Employees, Non-QCEW Employees, and Self-Employed

SRS COMMUNITY REUSE ORGANIZATION
IMPACT & CONSEQUENCE ANALYSIS PAGE | 16
SAVANNAH RIVER SITE TODAY Today, the Savannah River Site continues its national security missions and the processing and storage of nuclear materials as well as the development and deployment of technologies to improve the environment and treat solid and liquid nuclear and hazardous wastes. The 2016 actual annual budget for the Site was about $1.9 billion with two-thirds of the budget related to DOE-EM operations and one-third related to NNSA operations.2
ANNUAL EXPENDITURES Together, the employers at SRS paid out over $914 million in wages and $345 million in benefits in FY2016. Of this, an estimated 83 percent was paid to employees in the SRS Impact Area. Furthermore, they spent almost $549 million on other direct expenditures. Of this, 27 percent ($147 million) was spent in the SRS Impact Area. For comparison, SRS employers spent $1.3 billion in FY 2010 and spent 19 percent ($257 million) of this in the SRS Impact Area. The FY 2010 expenditures included funding related to the American Recovery and Reinvestment Act (ARRA).
For SRS overall, wages constituted 51 percent of total expenditures with fringe benefits accounting for 19 percent. However, in the SRS Impact Area, wages accounted for 64 percent of total expenditures with fringe benefits accounting for 24 percent.
FIGURE 18. WAGES & BENEFITS 2016, DISTRIBUTION BY GEOGRAPHY
FIGURE 19. OTHER DIRECT EXPENDITURES 2016, DISTRIBUTION BY GEOGRAPHY
FIGURE 20. EXPENDITURES BY TYPE 2016, TOTAL
FIGURE 21. EXPENDITURES BY TYPE 2016, SRS IMPACT AREA
Source: US Department of Energy-Savannah River Operations Office, as reported by SRS organizations for this study.
2 Data reported by SRS organizations for the purposes of this study totaled $1.8 billion. The discrepancy is due to unreported data and margins of error related to estimations that were made.
SRS Impact Area83%
Other17%
SRS Impact Area27%
Other73%
Wages51%Benefits
19%
Other Direct Expenditures
30%
Wages64%
Benefits24%
Other Direct Expenditures
12%

SRS COMMUNITY REUSE ORGANIZATION
IMPACT & CONSEQUENCE ANALYSIS PAGE | 17
ANNUAL SALARIES & EMPLOYMENT In 2016, the average salary for all SRS workers was $86,819 and the average level of fringe benefits for all SRS workers was $32,797, making the average overall compensation $119,615. The average salary is slightly higher at $87,978 for an SRS worker who resides in the five-county area. Fringe benefits are also slightly higher at $33,378 for a total compensation of $121,356. By comparison, the average earnings per job for the region (wages, salaries, benefits, and other compensation) is $52,159. In other words, the average job at the Site pays the equivalent of 2.3 jobs in the five-county region.
The Site organizations provide a range of jobs and careers requiring different skills and education. Site organizations offer jobs in business management, information technology, security, construction, management of natural resources, scientific research, and engineering. Many organizations employ craft personnel with a high school diploma while others provide entry level jobs after college and managerial opportunities after many years of experience.
The total employees for FY 2016, as reported by the SRS organization for the purposes of this study, was 10,532.3 Of the contractors, SRNS is the largest at the Site and accounts for 48 percent of the total employment. SRR is the next largest contractor and accounts for 20 percent. CB&I AREVA MOX Services represents 18 percent. Centerra and Parsons represent six percent and three percent, respectively. In all, federal organizations, including DOE and NNSA, account for about four percent of the total headcount at the Site (Figure 23). As of 2016, just over 80 percent of employees, or 8,566, lived in the five-county Impact Area (Figure 24).
FIGURE 23. WORKFORCE 2016, DISTRIBUTION BY EMPLOYER
FIGURE 24. WORKFORCE 2016, DISTRIBUTION BY GEOGRAPHY
Source: US Department of Energy-Savannah River Operations Office, as reported by the SRS organizations for this study. Note: Other includes SREL, and USFS.
3 The total headcount reported in the 4th Quarter – FY 2016 Force Report was 11,279. This number likely includes some non-permanent employees that were not reported by SRS organizations for the purposes of this study.
SRNS48%SRR
20%
CB&I AREVA MOX Services
18%
Centerra6%
Parsons3%
DOE3%
Other2%
SRS Impact Area81%
Other19%
FIGURE 22. AVERAGE COMPENSATION 2016, BY GEOGRAPHY
Source: US Department of Energy-Savannah River Operations Office, as reported by the SRS organizations for this study.
Total SRS Impact Area
WagesBenefits
$119,616 $121,356
SRS COMMUNITY REUSE ORGANIZATION
IMPACT & CONSEQUENCE ANALYSIS PAGE | 18
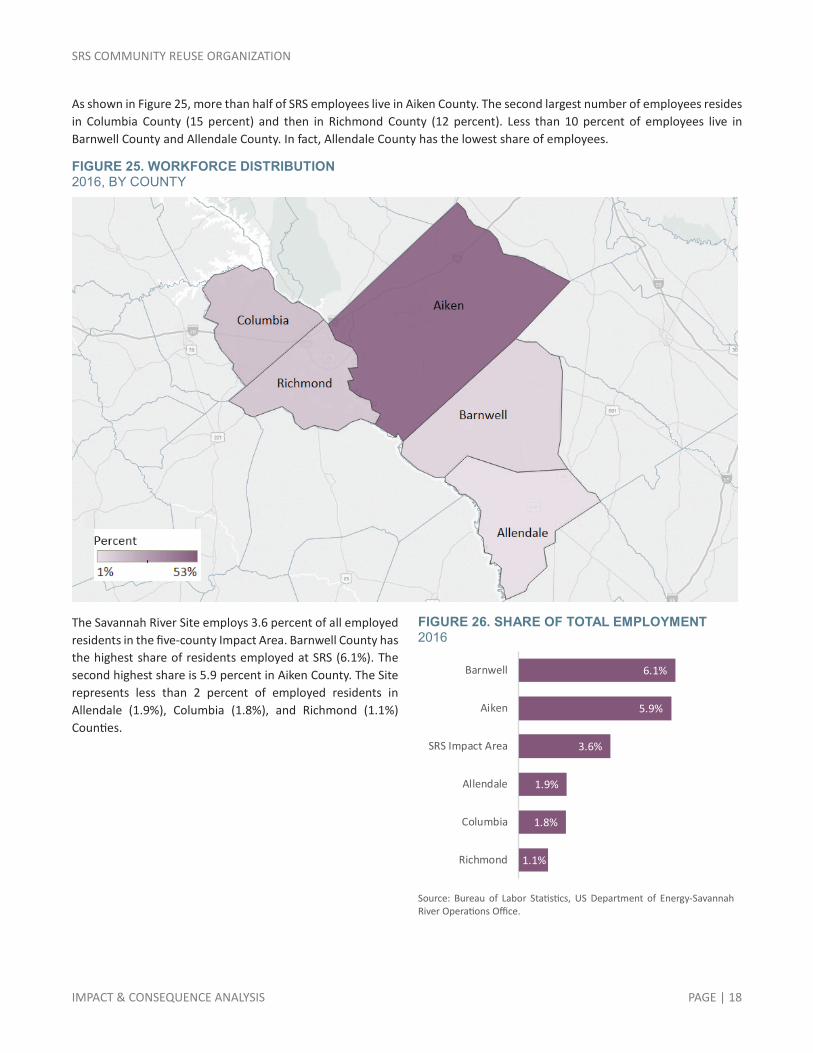
As shown in Figure 25, more than half of SRS employees live in Aiken County. The second largest number of employees resides in Columbia County (15 percent) and then in Richmond County (12 percent). Less than 10 percent of employees live in Barnwell County and Allendale County. In fact, Allendale County has the lowest share of employees.
FIGURE 25. WORKFORCE DISTRIBUTION 2016, BY COUNTY
The Savannah River Site employs 3.6 percent of all employed residents in the five-county Impact Area. Barnwell County has the highest share of residents employed at SRS (6.1%). The second highest share is 5.9 percent in Aiken County. The Site represents less than 2 percent of employed residents in Allendale (1.9%), Columbia (1.8%), and Richmond (1.1%) Counties.
FIGURE 26. SHARE OF TOTAL EMPLOYMENT 2016
Source: Bureau of Labor Statistics, US Department of Energy-Savannah River Operations Office.
6.1%
5.9%
3.6%
1.9%
1.8%
1.1%
Barnwell
Aiken
SRS Impact Area
Allendale
Columbia
Richmond
SRS COMMUNITY REUSE ORGANIZATION
IMPACT & CONSEQUENCE ANALYSIS PAGE | 19
ECONOMIC IMPACT ON THE LOCAL ECONOMY The Savannah River Site’s impact on the five-county area goes beyond the number of jobs and the dollars spent in the local economy. The Site has a ripple effect in the local economy as each dollar spent circulates in the local economy and each employee spends their earnings in the local economy.
To estimate the more comprehensive contribution of SRS to the local economy, an input-output analysis was conducted using the IMPLAN model. The model estimates three types of impacts: direct, indirect, and induced.
The direct effect is the initial change in expenditures or jobs. These are associated with SRS’s direct gross receipts and include the gross industry output, workers (local employment), and labor earnings (income).
The indirect effect is the secondary impact of the Site buying goods and services from other local industries, with the cycle of spending working its way through the supply chain. In other words, the indirect effect is associated with SRS organizations spending in the local economy.
The induced effect is the response by the local economy that occurs through re-spending of income. These effects arise as SRS workers spend their income at retail, service, and other types of local establishments. This spending boosts profits at local businesses, which, in turn, leads to more spending by the businesses and their employees.
The total economic impact is the sum of the direct, indirect, and induced effects of the SRS operations.
The analysis examines the impact of SRS on the five-county area using data for Fiscal Year 2016 (FY 2016). In the analysis, impact is measured by three different metrics—employment, output, and income. In addition, the analysis estimates the fiscal impact from federal, state, and local taxes. A complete description of the data and methodology can be found in Appendix 1.
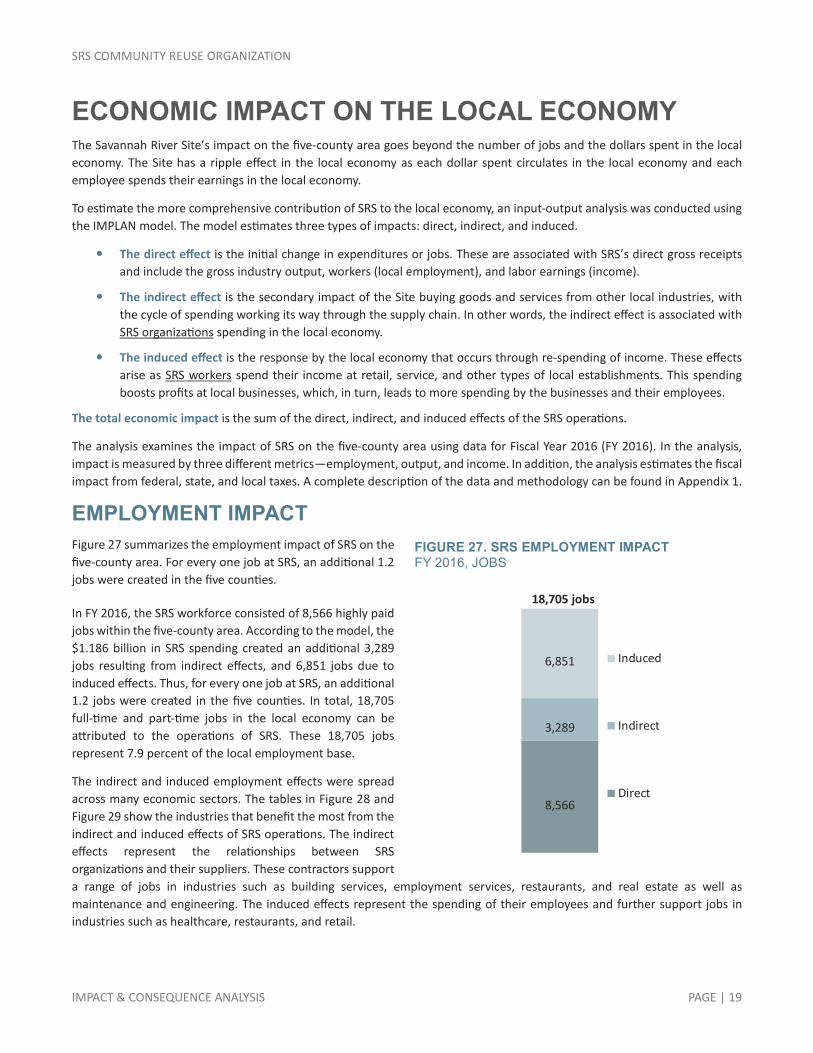
EMPLOYMENT IMPACT Figure 27 summarizes the employment impact of SRS on the five-county area. For every one job at SRS, an additional 1.2 jobs were created in the five counties.
In FY 2016, the SRS workforce consisted of 8,566 highly paid jobs within the five-county area. According to the model, the $1.186 billion in SRS spending created an additional 3,289 jobs resulting from indirect effects, and 6,851 jobs due to induced effects. Thus, for every one job at SRS, an additional 1.2 jobs were created in the five counties. In total, 18,705 full-time and part-time jobs in the local economy can be attributed to the operations of SRS. These 18,705 jobs represent 7.9 percent of the local employment base.
The indirect and induced employment effects were spread across many economic sectors. The tables in Figure 28 and Figure 29 show the industries that benefit the most from the indirect and induced effects of SRS operations. The indirect effects represent the relationships between SRS organizations and their suppliers. These contractors support a range of jobs in industries such as building services, employment services, restaurants, and real estate as well as maintenance and engineering. The induced effects represent the spending of their employees and further support jobs in industries such as healthcare, restaurants, and retail.
FIGURE 27. SRS EMPLOYMENT IMPACT FY 2016, JOBS
8,566
3,289
6,851 Induced
Indirect
Direct
18,705 jobs
SRS COMMUNITY REUSE ORGANIZATION
IMPACT & CONSEQUENCE ANALYSIS PAGE | 20
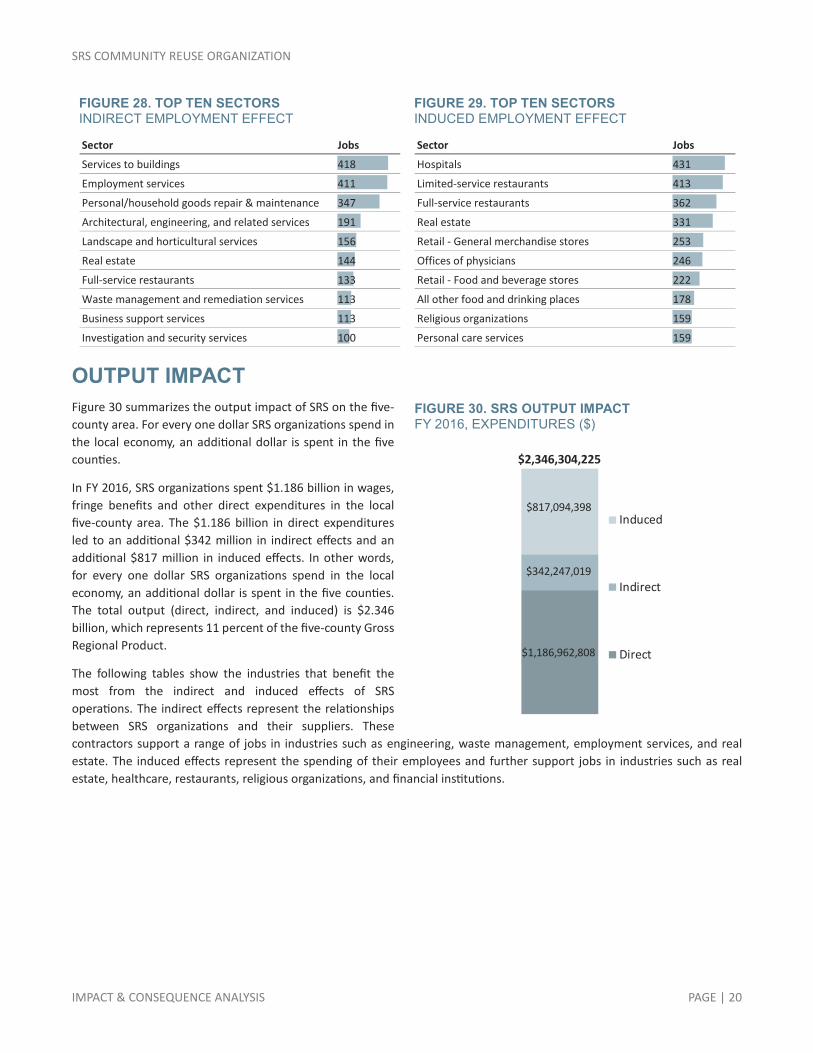
FIGURE 28. TOP TEN SECTORS INDIRECT EMPLOYMENT EFFECT
FIGURE 29. TOP TEN SECTORS INDUCED EMPLOYMENT EFFECT
OUTPUT IMPACT Figure 30 summarizes the output impact of SRS on the five-county area. For every one dollar SRS organizations spend in the local economy, an additional dollar is spent in the five counties.
In FY 2016, SRS organizations spent $1.186 billion in wages, fringe benefits and other direct expenditures in the local five-county area. The $1.186 billion in direct expenditures led to an additional $342 million in indirect effects and an additional $817 million in induced effects. In other words, for every one dollar SRS organizations spend in the local economy, an additional dollar is spent in the five counties. The total output (direct, indirect, and induced) is $2.346 billion, which represents 11 percent of the five-county Gross Regional Product.
The following tables show the industries that benefit the most from the indirect and induced effects of SRS operations. The indirect effects represent the relationships between SRS organizations and their suppliers. These contractors support a range of jobs in industries such as engineering, waste management, employment services, and real estate. The induced effects represent the spending of their employees and further support jobs in industries such as real estate, healthcare, restaurants, religious organizations, and financial institutions.
Sector Jobs
Services to buildings 418
Employment services 411
Personal/household goods repair & maintenance 347
Architectural, engineering, and related services 191
Landscape and horticultural services 156
Real estate 144
Full-service restaurants 133
Waste management and remediation services 113
Business support services 113
Investigation and security services 100
Sector Jobs
Hospitals 431
Limited-service restaurants 413
Full-service restaurants 362
Real estate 331
Retail - General merchandise stores 253
Offices of physicians 246
Retail - Food and beverage stores 222
All other food and drinking places 178
Religious organizations 159
Personal care services 159
FIGURE 30. SRS OUTPUT IMPACT FY 2016, EXPENDITURES ($)
$1,186,962,808
$342,247,019
$817,094,398Induced
Indirect
Direct
$2,346,304,225

SRS COMMUNITY REUSE ORGANIZATION
IMPACT & CONSEQUENCE ANALYSIS PAGE | 21
FIGURE 31. TOP TEN SECTORS INDIRECT OUTPUT EFFECT ($)
FIGURE 32. TOP TEN SECTORS INDUCED OUTPUT EFFECT ($)
Note: the owner-occupied dwellings sector is the imputed rental activity for owner-occupied dwellings. This sector estimates what owner/occupants would pay in rent if they rented rather than owned their homes. It creates an industry out of owning a home, and its production function represents repair and maintenance of that home.
INCOME IMPACT SRS operations significantly affect the standard of living in the five-county Impact Area. Personal income includes all wages, salaries, profits, interest, rents, and other major forms of income earned by residents. The personal income in the local economy resulting from SRS operations in FY 2016 was $1.050 billion. In addition, there are indirect linkages that account for an additional $132 million, and induced effects are another $241 million. In total, the impact of SRS operations on personal income is estimated to be $1.424 billion, which is about 7 percent of the region’s total personal income. On a per capita basis, the income impact of SRS operations is $2,603 per person in the five-county area.
Sector Dollars
Architectural, engineering, and related services $33,201,466
Waste management and remediation services $29,002,514
Employment services $28,894,685
Personal/household goods repair & maintenance $23,727,070
Real estate $15,894,863
Services to buildings $14,088,200
Wholesale trade $13,759,664
Maintenance & repair of nonresidential structures $11,342,061
Depository credit intermediation $8,672,296
Accounting, tax prep, bookkeeping, & payroll svcs $7,741,681
Sector Dollars
Owner-occupied dwellings $120,383,686
Hospitals $60,019,189
Real estate $36,683,014
Offices of physicians $33,544,865
Limited-service restaurants $30,204,926
Wholesale trade $24,314,841
Religious organizations $22,350,839
Depository credit intermediation $22,260,132
Retail - General merchandise stores $17,659,282
Electric power transmission and distribution $16,651,551
FIGURE 33. SRS INCOME IMPACT FY 2016 ($)
Direct, $1,050,476,160
Indirect, $132,456,784
Induced, $241,265,174
$1,424,198,118
SRS COMMUNITY REUSE ORGANIZATION
IMPACT & CONSEQUENCE ANALYSIS PAGE | 22
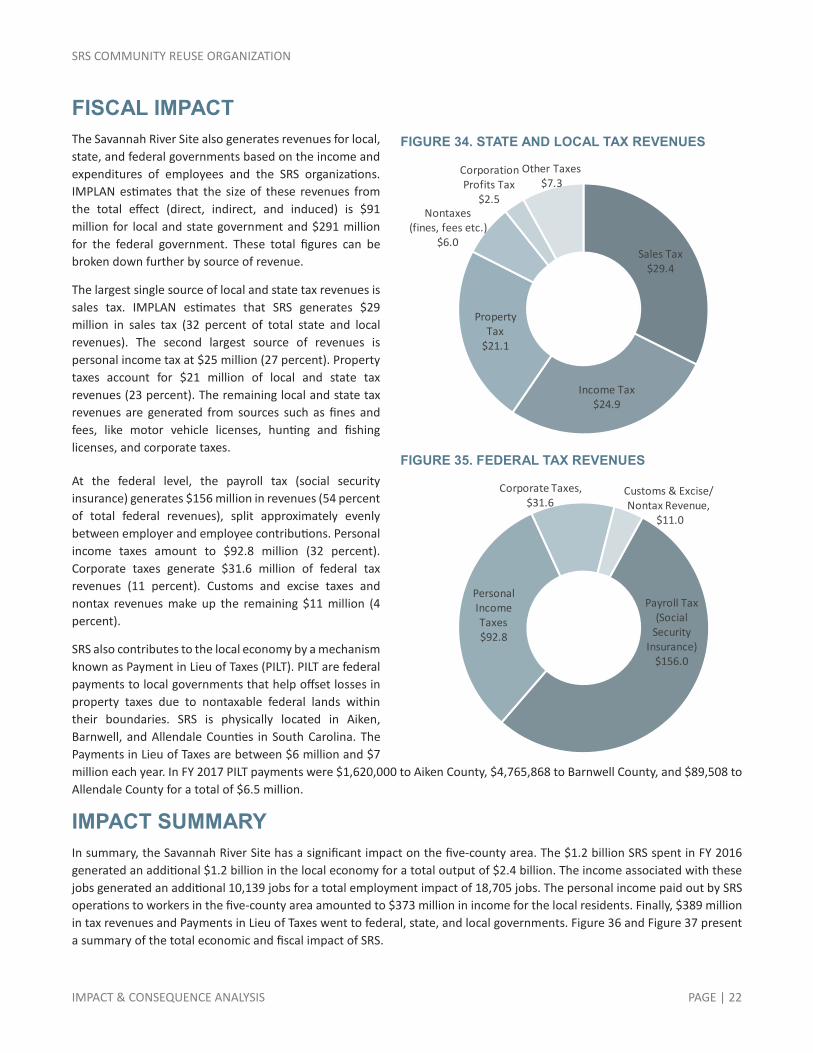
FISCAL IMPACT The Savannah River Site also generates revenues for local, state, and federal governments based on the income and expenditures of employees and the SRS organizations. IMPLAN estimates that the size of these revenues from the total effect (direct, indirect, and induced) is $91 million for local and state government and $291 million for the federal government. These total figures can be broken down further by source of revenue.
The largest single source of local and state tax revenues is sales tax. IMPLAN estimates that SRS generates $29 million in sales tax (32 percent of total state and local revenues). The second largest source of revenues is personal income tax at $25 million (27 percent). Property taxes account for $21 million of local and state tax revenues (23 percent). The remaining local and state tax revenues are generated from sources such as fines and fees, like motor vehicle licenses, hunting and fishing licenses, and corporate taxes.
At the federal level, the payroll tax (social security insurance) generates $156 million in revenues (54 percent of total federal revenues), split approximately evenly between employer and employee contributions. Personal income taxes amount to $92.8 million (32 percent). Corporate taxes generate $31.6 million of federal tax revenues (11 percent). Customs and excise taxes and nontax revenues make up the remaining $11 million (4 percent).
SRS also contributes to the local economy by a mechanism known as Payment in Lieu of Taxes (PILT). PILT are federal payments to local governments that help offset losses in property taxes due to nontaxable federal lands within their boundaries. SRS is physically located in Aiken, Barnwell, and Allendale Counties in South Carolina. The Payments in Lieu of Taxes are between $6 million and $7 million each year. In FY 2017 PILT payments were $1,620,000 to Aiken County, $4,765,868 to Barnwell County, and $89,508 to Allendale County for a total of $6.5 million.
IMPACT SUMMARY In summary, the Savannah River Site has a significant impact on the five-county area. The $1.2 billion SRS spent in FY 2016 generated an additional $1.2 billion in the local economy for a total output of $2.4 billion. The income associated with these jobs generated an additional 10,139 jobs for a total employment impact of 18,705 jobs. The personal income paid out by SRS operations to workers in the five-county area amounted to $373 million in income for the local residents. Finally, $389 million in tax revenues and Payments in Lieu of Taxes went to federal, state, and local governments. Figure 36 and Figure 37 present a summary of the total economic and fiscal impact of SRS.
FIGURE 34. STATE AND LOCAL TAX REVENUES
FIGURE 35. FEDERAL TAX REVENUES
Sales Tax$29.4
Income Tax$24.9
Property Tax
$21.1
Nontaxes(fines, fees etc.)
$6.0
Corporation Profits Tax
$2.5
Other Taxes$7.3
Payroll Tax (Social
Security Insurance)
$156.0
Personal Income Taxes$92.8
Corporate Taxes, $31.6
Customs & Excise/Nontax Revenue,
$11.0

SRS COMMUNITY REUSE ORGANIZATION
IMPACT & CONSEQUENCE ANALYSIS PAGE | 23
FIGURE 36. ECONOMIC IMPACT SUMMARY
IMPACT TYPE EMPLOYMENT LABOR INCOME OUTPUT
Direct Effect 8,566 $1,050,476,160 $1,186,962,808
Indirect Effect 3,289 $132,456,784 $342,247,019
Induced Effect 6,851 $241,265,174 $817,094,398
Total Effect 18,705 $1,424,198,118 $2,346,304,225
FIGURE 37. SUMMARY OF SRS TOTAL ECONOMIC AND FISCAL IMPACT
EMPLOYEE CONTRIBUTIONS AND COMMUNITY SUPPORT In addition to the economic and fiscal impact estimated in the previous sections, the Savannah River Site provides a great deal of community support through charitable contributions and community involvement of the organizations themselves and their employees. Most organizations on the Site participate in United Way Campaigns, encourage volunteerism among their employees, provide pro bono professional services to local organizations, and support a wide variety of educational initiatives in the region.
For example, SRNS was recently awarded the United Way’s highest honor, the Pinnacle award, recognizing the company for exceptional employee donations in 2016. SRNS employees support nine United Way agencies across the region. SRNS’s website identifies other corporate philanthropy including Toys for Tots, CSRA Heart Walk, Golden Harvest Food Bank, and Innovative Teaching Mini Grants program. SRNS employees volunteer to complete charitable projects to improve the lives of hundreds of citizens living throughout the region during initiatives such as Project Serve (Augusta, GA) and Project Care (Barnwell, SC).
$2.4 BillionOutput
$1.4 BillionPersonal Income
18,705Total Jobs Created
$389 MillionFederal, State, & Local Taxes (PILT)
$1.9 BillionDepartment of Energy(SRS Annual Budget)
$1.2 BillionSavannah River Site Operations
Direct Expenditures Within Five Counties

SRS COMMUNITY REUSE ORGANIZATION
IMPACT & CONSEQUENCE ANALYSIS PAGE | 24
SRR provides STAR grants to teachers and scholarships to families. In addition, SRR employees make charitable contributions and participate in various United Way volunteer projects such as revitalization, construction, plumbing, painting, and landscaping. SRR employees are also actively involved in K-12 schools through reading programs, teacher training and education, and provision of science, technology, engineering, and math (STEM)-related education kits.
DOE, USFS, and SREL as well as their employees make charitable contributions. SREL also participates in the University of Georgia’s United Way campaign as well as an outreach program that gives over 370 talks annually to schools and various civic groups with the goal of increasing environmental awareness and teaching the public about the flora and fauna on the Savannah River Site.
DOE organizes the Savannah River Regional Science Bowl and, in conjunction with SRNS, USFS, Ruth Patrick Science Education Science Center, and the National Audubon Society, offers the Science and Technology Enrichment Program to local teachers and students.
Overall, charitable donations and community involvement from Site organizations and employees provide considerable support for nonprofit and social service organizations in the five-county area. Conversations with representatives of the United Way suggest that this community involvement has declined as the number of employees on the Site has dropped, but that the participation of SRS organizations in the community is vital to many local nonprofits. The loss of SRS operations would be “catastrophic” for many nonprofits in the area. SRS organizations are top donors for many area United Way organizations, in particular United Way of Aiken County, United Way of the CSRA, and United Way of Barnwell County (which also represents Allendale County).

SRS COMMUNITY REUSE ORGANIZATION
IMPACT & CONSEQUENCE ANALYSIS PAGE | 25
SCENARIOS & SENSITIVITY ANALYSIS To understand the implications of changes in employment at the Site, the IMPLAN model was used to estimate the impact of two different scenarios:
Job loss or gain of 1,000
Transition of 25 to 35 percent of the workforce
SCENARIO 1: JOB LOSS/GAIN The preceding analysis has indicated the substantial impact SRS has on the local five-county area. Workforce levels have fluctuated in recent years, and it is worth conducting an analysis to understand the ramifications of these fluctuations. Specifically, if the workforce at SRS were to decrease or increase by one thousand jobs, what effect would this change have on the local economy? One thousand jobs represent 9.5 percent of the current workforce. It is assumed that the change of the one thousand jobs is distributed evenly across the current Site organizations—that each Site organization would lose an equal percentage of their workforce. However, not all those job losses would be workers who reside in the five-county area. With this assumption, direct expenditures would also decrease by 9.5 percent. The results of the IMPLAN modeling analysis of this scenario are presented in Figure 38.
FIGURE 38. ECONOMIC IMPACT SUMMARY A CHANGE OF 1,000 JOBS
IMPACT TYPE EMPLOYMENT LABOR INCOME OUTPUT Direct Effect 813 $93,843,453 $103,804,598
Indirect Effect 312 $11,832,924 $30,269,404
Induced Effect 651 $21,553,231 $73,689,048
Total Effect 1,776 $127,229,608 $207,763,050
For a job loss, the numbers presented in Figure 38 would be negative. For a job gain, the numbers would be positive. Of the 1,000-job change, 813 would be workers in the five-county area. This would cause a further 963 job change through the indirect and induced effects as spending in the five-county area decreases with a job loss or increases with a job gain. Overall, there would be a change of over $127 million of income and over $207 million of output. The job changes would be felt across the range of industries identified earlier for their indirect and induced effects. For example, a job loss of 1,000 would mean that full service restaurants would see a decrease in employment of 47, or the equivalent of a single restaurant. Similarly, 55 fewer realtors would be needed in the five-county area if jobs at the Site decreased by 1,000. Conversely, a job gain of 1,000 would mean that full service restaurants would see an increase in employment of 47, and 55 more realtors would be needed.
SCENARIO 2: WORKFORCE TRANSITION The average age of workers at SRS is approximately 50 years old, and a large portion of the workforce at the Site will be eligible to retire over the next three to five years. Already the nuclear workforce is retiring in large numbers. In 2016, the Nuclear Workforce Initiative documented that almost half of the attrition at the Site was related to retirements.4 This second scenario examines what the potential impact of this workforce transition might be: what happens when 25 to 35 percent of the workforce retires and is replaced by younger workers?
4 NWI® Staffing Committee, 2016 Employer Experience-Workforce Overview Report.

SRS COMMUNITY REUSE ORGANIZATION
IMPACT & CONSEQUENCE ANALYSIS PAGE | 26
Figure 39 shows the analysis of several scenarios: 25 to 35 percent of the workforce retires (2,633 to 3,686 workers) coupled with new hires earning 10 to 25 percent lower salaries (based on the average salary of $86,818.79) to yield a range of possible economic impact outcomes.
Several assumptions are made for each of these scenarios:
Retirees make the average salary upon their retirement and new hires make 10 to 25 percent less than this salary.
The average salary is $86,818.79 (based on FY 2016 data)
A portion of the retirees continue to live in the area and draw retirement income.
87 percent of retirees stay in the five-county area (based on SRS Retiree Association data)
Pension income formula is 1.2% x average salary x years of service = $20,836.51 (based on the income formula for the most popular SRS pension plan)
Average social security income is $16,320 (as reported by the Social Security Administration)
Average retiree income is $37,156.51 (Pension formula + Social Security)
FIGURE 39. SCENARIO MODELING BASELINE OUTPUT: $2,346,304,225
NEW HIRES SALARY
10% lower 25% lower
NU
MBE
R O
F RE
TIRE
ES
25% retire (2,633)
+$85m from retirees
-$65m from lower salaries
Net: +$20m
+$85m from retirees
-$118m from lower salaries
Net: -$33m
35% retire (3,686)
+$119m from retirees
-$98m from lower salaries
Net: +$21m
+$119m from retirees
-$136m from lower salaries
Net: -$17m
Given these assumptions, the worst-case scenario is 25 percent of workers retiring (2,633) and being replaced by a younger workforce earning 25 percent lower wages. Together, these assumptions show that the economic impact of SRS operations would fall to $2,227,955,720 or a reduction of $118 million. However, the spending of retirees recovers 72 percent of this loss for a net loss of $33 million. In the best-case scenario, 35 percent of workers retire and are replaced by workers earning just 10 percent lower salaries. This scenario has a net positive benefit for the region of $21 million.
These simple scenarios demonstrate the wide-ranging impacts that could occur as the current workforce at the Savannah River Site begins to retire. The five-county region has benefitted from the spill-over effects of these high-paying jobs, but the economic future is unclear as the SRS transitions to a younger workforce. Of course, more nuanced analysis is needed to truly anticipate the behavior of spenders and consumers in the five-county region. Individuals of different generations can have vastly different lifestyles and spending patterns, but, at times, they share the same preferences. If the five-county area would like to capitalize on the investments and contributions of these groups in the future, it needs to pay careful attention to the preferences and trends that help retain older individuals and attract younger ones.

SRS COMMUNITY REUSE ORGANIZATION
IMPACT & CONSEQUENCE ANALYSIS PAGE | 27
IMPLICATIONS OF THE WORKFORCE TRANSITION Although the exact economic impact of the transition is uncertain, there is no doubt that a significant portion of the Site’s workforce will retire and be replaced by younger workers. In addition to the possible economic impacts on the local economy explored in the previous section, the workforce transition could have broader implications for the region.
Separate from the SRS workforce transition, Fort Gordon, located outside of Augusta, is expanding to house the Army Cyber Command. This also has implications for the five-county area because this move is expected to create 4,700 civilian and military jobs. Including family members, the Army estimates a total of 13,000 new residents in the Augusta metro area by 2020. Around 2,400 of these will be school-age children.
In this section, we examine generational trends and market segmentation to draw conclusions about what implications the workforce transition, in the context of the Fort Gordon expansion, might have on the local economy.
GENERATIONAL TRENDS As Baby-Boomers reach retirement age and their children (Millennials) enter the workforce, questions arise about how these changes will influence the economy and individual communities in areas with varied consumption patterns, housing preferences, charitable giving, and workplace trends. As a result, a great deal of research has been done on these subjects. Trends relevant to the workforce transition at SRS and the communities in the SRS Impact Area are summarized on the following pages.
MILLENNIALS The Millennial Generation, which is currently between the ages 18 and 34, will be 50 percent of the workforce by 2020. As such, the majority of new hires at SRS will likely be Millennials, both young professionals and young families.
The workplace priorities of Millennials include finding a job (and employer) with a purpose and finding the right “fit” with a work environment. “Millennials want their work to have a purpose, to contribute something to the world and they want to be proud of their employer. The brands that appeal to young people as consumers, including those that stress their environmental and social record, are the same brands that appeal to them as employers.” Although Millennials are often perceived as disloyal to employers, a recent survey of Millennials revealed that they are willing to stay with an employer with the right environment. In other words, Millennials place a high priority on workplace quality and indicated that they would be willing to move to find a preferred work environment. However, about 60 percent of Millennials see their ideal career as with the same or a small number of employers and almost two-thirds say the opportunity to learn new skills is a top factor when considering a job.5
In addition, Millennials have different housing preferences and home-buying habits than previous generations. Living closer to work to avoid a commute ranks highly and even influences rent-or-buy decisions when looking for housing. Destinations around their place of resident are also very important. Millennials like having the option to travel by foot or by bike to local destinations and are more likely to select a home based on the types of transportation options available. Millennials are more likely to delay homeownership. The average age of a first-time homebuyer for Millennials is 33 years but was 29 years old a generation ago. Millennials are increasingly willing to rent rather than buy homes. Yet, when they do buy a home, Millennials tend to skip the “starter home” phase and jump to larger houses at higher prices. More than half of Millennial home-buyers prefer homes that are located in communities with many, shared amenities. In this sense, Millennials view their homes as extensions of themselves and not just financial investments. They enjoy shared spaces and like to get involved with their community or neighborhood. For those Millennials that do buy homes, 50 percent live in the suburbs and just 20 percent live
5 CBRE Research. Millennials: Myths and Realities.

SRS COMMUNITY REUSE ORGANIZATION
IMPACT & CONSEQUENCE ANALYSIS PAGE | 28
in rural areas. When looking for a home, Millennials are also likely to begin the process online and find agents and lenders online, as well.6
Spending patterns and entertainment preferences of Millennials are also distinct. Millennials spend about 50 percent of their income on leisure—going out, non-food shopping, and other non-essential items. For this group, interactive experiences define their preferences. For example, civic venues and public forums such as museums and theaters can be used “as a canvas for entertainment” to engender interactivity and participation. The types of restaurants and bars that attract Millennials differ in that they are more likely to sell services instead of goods. The emerging trend in dining is one of constant evolution (e.g. seasonal menus and visiting chefs) and new experiences (e.g. shared tables, open kitchens, and cooking classes) to continue to attract the attention of younger consumers. Finally, retail is also catering to younger audiences by shifting toward interactive activities such as classes and demonstrations in-store.
In addition to the unique lifestyle and spending patterns of Millennials, this group also differentiates itself through its charitable giving patterns. Similar to finding a job with a purpose, Millennials are known for connecting to a cause and donating their time as well as their money. In general, Millennials are more likely to donate when the impact is defined at an individual level rather than institutional, and they make giving decisions based on personal relationships. Furthermore, as they increase their donations, they also tend to increase the amount of time they volunteer. Charitable organizations that are technologically savvy connect best with Millennials because these entities can provide interactive and engaging experiences, while also offering a degree of transparency thanks to cutting-edge, online platforms. Millennials are motivated to get involved especially when they see the opportunity for personal growth and a chance to develop their own skills and areas of expertise.7
BABY BOOMERS AND RETIREMENT By 2020, almost 17 percent of the US population will be 65 years or older. As both a retiree destination and as the local population reaches retirement age, the five-county area must take into consideration post-retirement trends.
Continuing to work. Traditionally, when a person retired they were done working. However, about two-thirds of Baby-Boomers expect to continue working or do not plan to retire. While some retirees continue to work because they cannot afford to retire, as many as 29 percent will continue working in some fashion by choice. This can take the shape of a part-time job, an encore career, working in the same field, or even starting a business.8 In other words, retirees can and should be viewed as an important source of talent in the community.
The list below highlights other key findings about Baby Boomers’ choice of where to retire and what they do in retirement.
6 Zillow Group. Consumer Housing Trends Report 2016. 7 The Millennial Impact Report. Cause, Influence, and the Workplace. 8 Transamerica Center for Retirement Studies. Perspectives of Retirement: Baby Boomers, Generation X, and Millennials.
FIGURE 40. REASONS FOR WORKING IN RETIREMENT
Source: Transamerica Center for Retirement Studies.
34%
25%
7%
14%
15%
5% None of these
Enjoy what I do
Want to stay involved
Need health benefits
Want the income
Can't afford to retire/Haven'tsaved enough

SRS COMMUNITY REUSE ORGANIZATION
IMPACT & CONSEQUENCE ANALYSIS PAGE | 29
The most important criteria for choosing where to live in retirement are: 1) affordable cost of living, 2) nearby family and friends, 3) good weather, 4) low crime rate, and 5) access to excellent healthcare and hospitals.9
That having been said, only 4 percent of people 65 and older move and many more are choosing to remodel their homes so they can age in place.10
The most commonly cited retirement activities are traveling, spending more time with family and friends, pursuing hobbies and doing volunteer work.11
High rates of charitable giving indicate that retirees are generous with their time and money.12
MARKET SEGMENTATION To understand how these trends could play out in the SRS Impact Area, we analyzed the market segmentation of the region and identified what types of new segments might be representative of new residents moving into the region.
ESRI’s Tapestry Segmentation System is a tool designed to identify consumer markets. While the tool is most often used by retailers to identify where to locate stores and what product mix to offer, the tapestry segmentation system also offers a great deal of detailed information on market segments’ lifestyle and consumption patterns. This information can provide a greater understanding of what market segments are currently represented in the SRS Impact Area and how the workforce transition might influence and mesh with these existing segments.
The Tapestry Segmentation System combines consumer traits with residential characteristics to identify and classify neighborhoods based on lifestyle demography and local geographies. The classification model has resulted in the development of sixty-seven distinct, behavioral market segments. These detailed segments have been combined into 14 summary groups and aggregated by lifestyle and life stage to provide ease of use. The segments are created by performing a cluster analysis of more than sixty variables from a variety of data sources including the US Census, the American Community Survey, ESRI demographic updates, Experian’s ConsumerView database, and other consumer surveys.
EXISTING TAPESTRY SEGMENTS Figure 41 shows the top five tapestry segments currently in the five-county area and Figure 42 maps the dominant tapestry segments in the region. The dominant tapestry segment—Rustic Outposts—reflects the rural nature of many parts of the region. It describes the largest number of households and covers the largest area of land in the region. The other top tapestry segments are characteristic of urban and suburban areas and represent a diverse range of household types and ages.
Family Landscapes is the second largest segment. This segment describes portions of Columbia County and the North Augusta area.
Hometown is this third largest segment and covers areas of Richmond County and a small area in Aiken.
Midtown Singles is the fourth largest segment and is largely found in Augusta.
GenXurban is the fifth largest segment and covers portions of Aiken, North Augusta, Augusta, Martinez, and Evans.
9 Ibid. 10 Ibid. 11 https://www.nytimes.com/2016/01/16/your-money/goodbye-golf-clubs-hello-hiking-boots-and-kayaks.html 12 http://agewave.com/what-we-do/landmark-research-and-consulting/research-studies/giving-in-retirement-americas-longevity-bonus/
FIGURE 41. TOP 5 TAPESTRY SEGMENTS BY NUMBER OF HOUSEHOLDS
Source: ESRI Tapestry Segmentation.

SRS COMMUNITY REUSE ORGANIZATION
IMPACT & CONSEQUENCE ANALYSIS PAGE | 30
FIGURE 42. SRS IMPACT AREA DOMINANT TAPESTRY SEGMENTS
Source: ESRI.
SRS COMMUNITY REUSE ORGANIZATION
IMPACT & CONSEQUENCE ANALYSIS PAGE | 31
RUSTIC OUTPOSTS
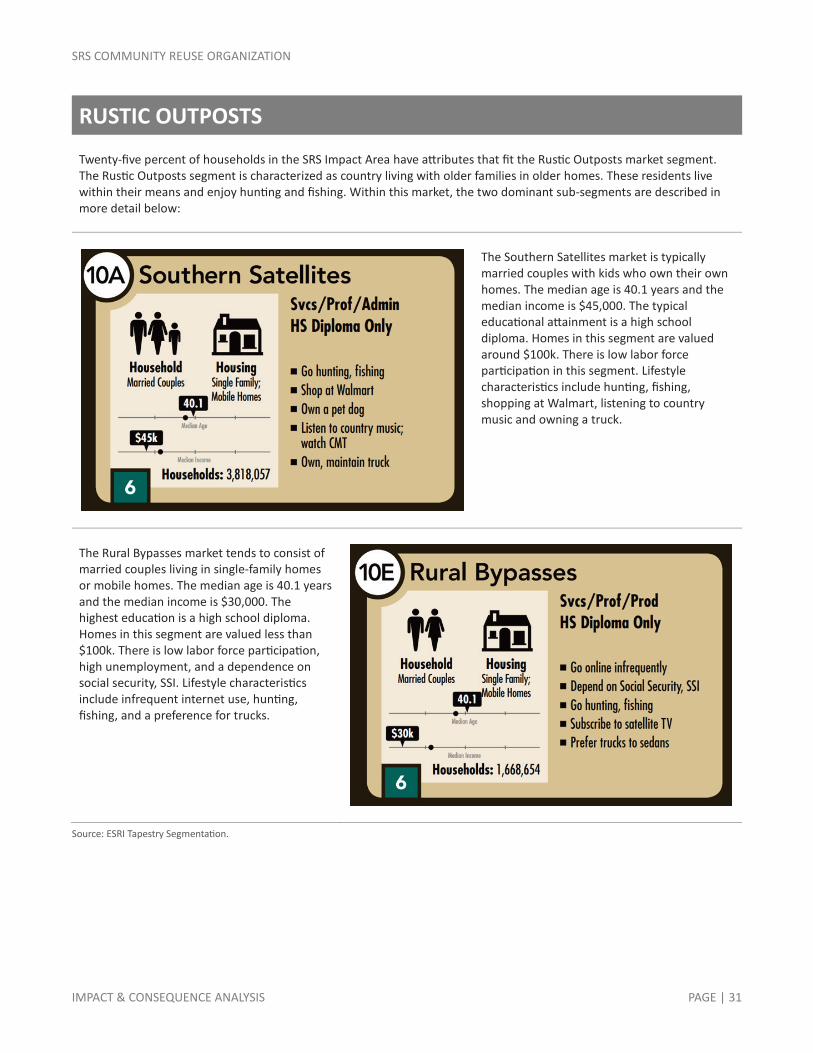
Twenty-five percent of households in the SRS Impact Area have attributes that fit the Rustic Outposts market segment. The Rustic Outposts segment is characterized as country living with older families in older homes. These residents live within their means and enjoy hunting and fishing. Within this market, the two dominant sub-segments are described in more detail below:
The Southern Satellites market is typically married couples with kids who own their own homes. The median age is 40.1 years and the median income is $45,000. The typical educational attainment is a high school diploma. Homes in this segment are valued around $100k. There is low labor force participation in this segment. Lifestyle characteristics include hunting, fishing, shopping at Walmart, listening to country music and owning a truck.
The Rural Bypasses market tends to consist of married couples living in single-family homes or mobile homes. The median age is 40.1 years and the median income is $30,000. The highest education is a high school diploma. Homes in this segment are valued less than $100k. There is low labor force participation, high unemployment, and a dependence on social security, SSI. Lifestyle characteristics include infrequent internet use, hunting, fishing, and a preference for trucks.
Source: ESRI Tapestry Segmentation.

SRS COMMUNITY REUSE ORGANIZATION
IMPACT & CONSEQUENCE ANALYSIS PAGE | 32
FAMILY LANDSCAPES
Fifteen percent of households in the SRS Impact Area have attributes that fit the Family Landscapes market segment. These residents are described as successful young families in their first homes. They are often dual-income families who eat out frequently. They enjoy a variety of family-friendly recreation and entertainment options. Within this market, the two dominant sub-segments are described in more detail below:
The Middleburg market tends to consist of married couples living in single-family homes. The median age is 35.7 years and the median income is $58,000. Homes in this segment are valued around $170k. There are high rates of home ownership and high labor force participation. The typical educational attainment is a college degree. Lifestyle characteristics include hunting, target shooting, watching country, Christian TV channels, and owning trucks/SUVs.
The Soccer Moms market tends to consist of married couples living in single-family homes. The median age is 36.8 years and the median income is $89,000. Homes in this segment are valued around $250k. There is high home ownership and high labor force participation, along with a high level of debt. The typical educational attainment is a college degree. Lifestyle characteristics include exercising, visiting amusement parks, shopping, and owning 2 or more vehicles.
Source: ESRI Tapestry Segmentation.

SRS COMMUNITY REUSE ORGANIZATION
IMPACT & CONSEQUENCE ANALYSIS PAGE | 33
HOMETOWN
Thirteen percent of households in the SRS Impact Area have attributes that fit the Hometown market segment. This market is described as a close knit urban community of young singles, many with kids. Neighborhoods are stable. Many of the residents in these neighborhoods work in healthcare and public administration. Within this market, the two dominant sub-segments are described in more detail below:
The Modest Income Homes market tends to consist of singles living in single-family homes. The median age is 36.6 years and the median income is $22,000. Homes in this segment are valued around $70k. There is low home ownership, low labor force participation and high unemployment. Households also can be multi-generational. The typical educational attainment is a high school diploma. Lifestyle characteristics include shopping at low-cost retailers, playing basketball, listening to gospel and R&B radio, and using public transportation.
The Family Foundations market tends to consist of singles living in single-family homes. The median age is 39.3 years and the median income is $41,000. Homes in this segment are valued around $110k. There is probably homeownership, low labor force participation, and high unemployment. Households also can be multi-generational. The typical educational attainment is a high school diploma. Lifestyle characteristics include shopping at low-cost retailers, purchasing baby and children products, using online entertainment, and driving 1-2 vehicles.
Source: ESRI Tapestry Segmentation.
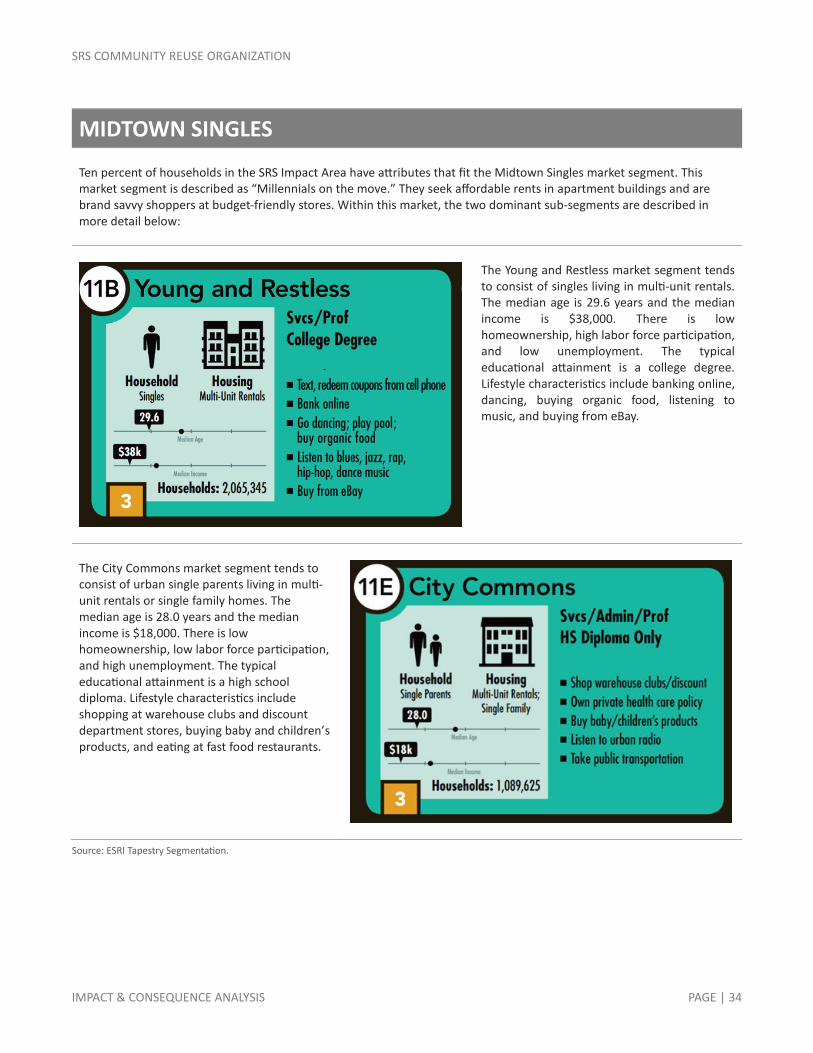
SRS COMMUNITY REUSE ORGANIZATION
IMPACT & CONSEQUENCE ANALYSIS PAGE | 34
MIDTOWN SINGLES
Ten percent of households in the SRS Impact Area have attributes that fit the Midtown Singles market segment. This market segment is described as “Millennials on the move.” They seek affordable rents in apartment buildings and are brand savvy shoppers at budget-friendly stores. Within this market, the two dominant sub-segments are described in more detail below:
The Young and Restless market segment tends to consist of singles living in multi-unit rentals. The median age is 29.6 years and the median income is $38,000. There is low homeownership, high labor force participation, and low unemployment. The typical educational attainment is a college degree. Lifestyle characteristics include banking online, dancing, buying organic food, listening to music, and buying from eBay.
The City Commons market segment tends to consist of urban single parents living in multi-unit rentals or single family homes. The median age is 28.0 years and the median income is $18,000. There is low homeownership, low labor force participation, and high unemployment. The typical educational attainment is a high school diploma. Lifestyle characteristics include shopping at warehouse clubs and discount department stores, buying baby and children’s products, and eating at fast food restaurants.
Source: ESRI Tapestry Segmentation.

SRS COMMUNITY REUSE ORGANIZATION
IMPACT & CONSEQUENCE ANALYSIS PAGE | 35
GENXURBAN
Nine percent of households in the SRS Impact Area have attributes that fit the GenXUrban market segment. This market is largely families with fewer kids—Gen X married couples. They own older single-family homes in urban areas. Within this market, the two dominant sub-segments are described in more detail below:
The Comfortable Empty Nesters market segment tends to consist of married couples living in single-family homes. The median age is 47.4 years and the median income is $70,000. Homes in this segment are valued around $200k. There is high home ownership, high labor force participation and low unemployment. The typical educational attainment is a college degree. Lifestyle characteristics include playing golf, exercising, investing money, eating at home, watching sports, and owning 1-2 vehicles.
The Midlife Constants market segment tends to consist of married couples with no kids living in single-family homes. The median age is 46.5 years and the median income is $48,000. Homes in this segment are valued around $150k. Their homeownership rates are high, and many are retired. The typical educational attainment is a college degree. Lifestyle characteristics include participating in civic organizations, utilizing social security, playing golf, watching country, Christian TV channels, and owning a truck.
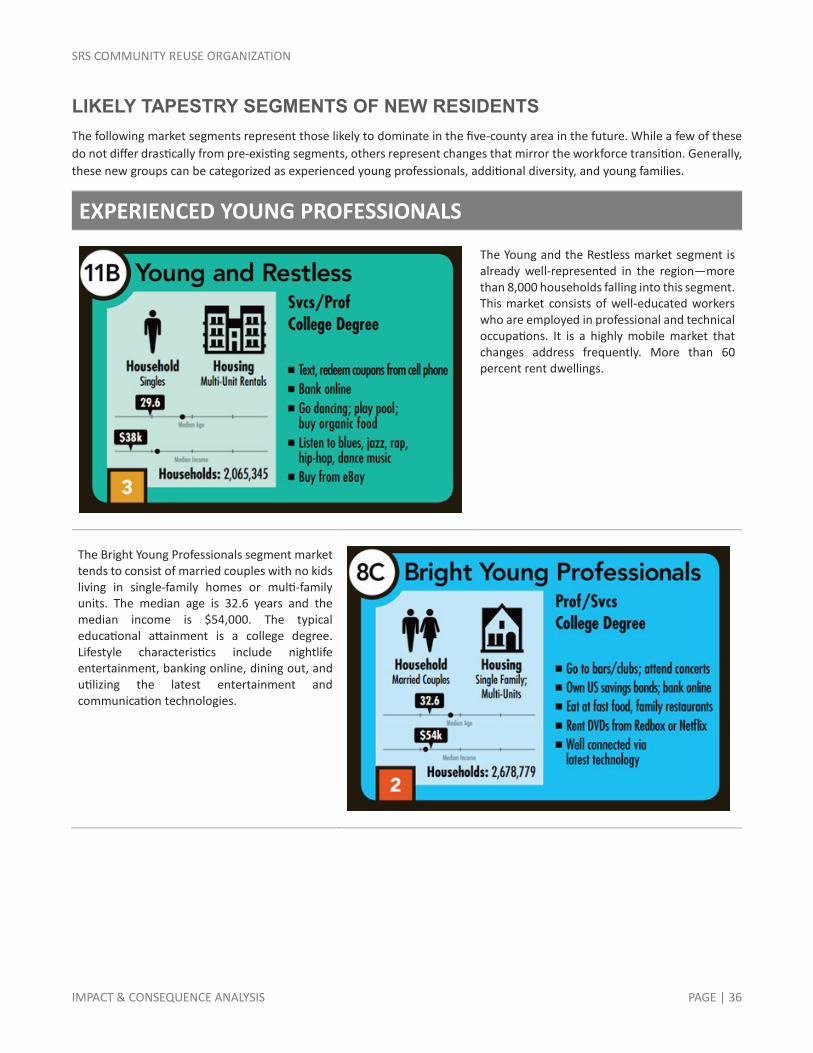
SRS COMMUNITY REUSE ORGANIZATION
IMPACT & CONSEQUENCE ANALYSIS PAGE | 36
LIKELY TAPESTRY SEGMENTS OF NEW RESIDENTS The following market segments represent those likely to dominate in the five-county area in the future. While a few of these do not differ drastically from pre-existing segments, others represent changes that mirror the workforce transition. Generally, these new groups can be categorized as experienced young professionals, additional diversity, and young families.
EXPERIENCED YOUNG PROFESSIONALS
The Young and the Restless market segment is already well-represented in the region—more than 8,000 households falling into this segment. This market consists of well-educated workers who are employed in professional and technical occupations. It is a highly mobile market that changes address frequently. More than 60 percent rent dwellings.
The Bright Young Professionals segment market tends to consist of married couples with no kids living in single-family homes or multi-family units. The median age is 32.6 years and the median income is $54,000. The typical educational attainment is a college degree. Lifestyle characteristics include nightlife entertainment, banking online, dining out, and utilizing the latest entertainment and communication technologies.

SRS COMMUNITY REUSE ORGANIZATION
IMPACT & CONSEQUENCE ANALYSIS PAGE | 37
ADDITIONAL DIVERSITY
The Up and Coming Families market tends to consist of married couples with children. The median age is 31.2 years and the median income is $68,000. The typical educational attainment is a college degree. Some debt is acquired through student loan or mortgages. Lifestyle characteristics include visiting theme parks, contracting for home services, online shopping and banking, and owning a late model car.
The Military Proximity market tends to consist of married couples with kids living in townhomes or multi-family units. The median age is 22.5 years and the median income is $43,000. The typical educational attainment is some college, but no degree. Lifestyle characteristics include participating in civic organizations, paying bills online, watching TV, and owning a minivan or SUV.

SRS COMMUNITY REUSE ORGANIZATION
IMPACT & CONSEQUENCE ANALYSIS PAGE | 38
FAMILIES
The Home Improvements market tends to consist of married couples with no children. The median age is 37.4 years and the median income is $70,000. The typical educational attainment is a college degree. Lifestyle characteristics include dining out, investing conservatively, watching the DIY network, and owning a minivan or SUV.
The Green Acres market segment tends to consist of married couples living single family homes with no children. The median age is 43.5 years and the median income is $77,000. The typical educational attainment is a college degree. Lifestyle characteristics include participating in civic organizations, paying bills online, doing home improvement projects, and owning a truck or SUV.

SRS COMMUNITY REUSE ORGANIZATION
IMPACT & CONSEQUENCE ANALYSIS PAGE | 39
Figure 43 shows a comparison of the likely new segments. A few commonalities are notable and have implications for the region as the workforce transitions.
Public school quality is important for those families moving in with children.
The younger workers are likely to prefer renting apartments over owning a home, but those who buy a house will likely prefer single family homes in the $180K to $200K range.
Outdoor activities and family-oriented entertainment are among the common interests of the different market types.
FIGURE 43. FUTURE SEGMENT COMPARISON
YOUNG PROFESSIONALS DIVERSITY FAMILIES Household Status No kids Kids Kids
Education & Schools
Public school quality important Public school quality important
Housing Apartment Rent
Single Family Rent or own $180-$200K
Single Family Own
$180-$200K
Interests Bars & clubs Concerts
Outdoor activities & sports Pilates & yoga
Outdoor activities & sports Family-oriented entertainment
Gardening Outdoor activities & sports
Home improvement Family-oriented entertainment
IMPLICATIONS FOR THE REGION The areas of the region that are more oriented towards rural living (Rustic Outposts) and retirees (Cozy Country Living) may not be natural draws for new SRS workers relocating to the region. However, some of these communities are where the majority of current SRS workers live. On the other hand, the more urban areas of the region and newer suburban communities will likely be appealing to a range of different market segments that might represent new workers.
The importance of public school quality to families moving to the area means that school district boundaries and school attendance zones will heavily influence families’ home-buying decisions.
Housing preferences for the likely market segments of the new workers at SRS will increase the demand for rental units in the region. The propensity for the younger generation to switch jobs in favor of better fit or better pay drives their desire for greater housing flexibility.
Desired amenities and common activities of Millennials and Baby-Boomers do have some overlap. Community, friends, and family are important to both groups. In addition, both groups share an interest in outdoor activities and sports and embody a strong sense of volunteerism.
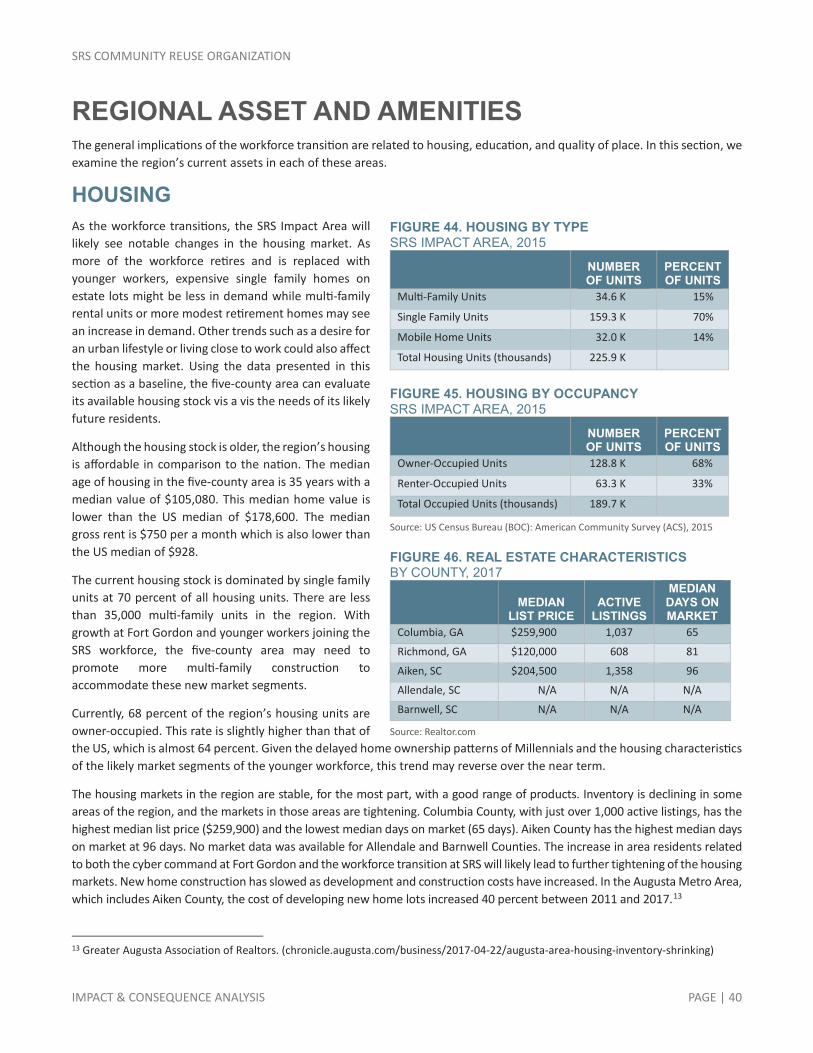
SRS COMMUNITY REUSE ORGANIZATION
IMPACT & CONSEQUENCE ANALYSIS PAGE | 40
REGIONAL ASSET AND AMENITIES The general implications of the workforce transition are related to housing, education, and quality of place. In this section, we examine the region’s current assets in each of these areas.
HOUSING As the workforce transitions, the SRS Impact Area will likely see notable changes in the housing market. As more of the workforce retires and is replaced with younger workers, expensive single family homes on estate lots might be less in demand while multi-family rental units or more modest retirement homes may see an increase in demand. Other trends such as a desire for an urban lifestyle or living close to work could also affect the housing market. Using the data presented in this section as a baseline, the five-county area can evaluate its available housing stock vis a vis the needs of its likely future residents.
Although the housing stock is older, the region’s housing is affordable in comparison to the nation. The median age of housing in the five-county area is 35 years with a median value of $105,080. This median home value is lower than the US median of $178,600. The median gross rent is $750 per a month which is also lower than the US median of $928.
The current housing stock is dominated by single family units at 70 percent of all housing units. There are less than 35,000 multi-family units in the region. With growth at Fort Gordon and younger workers joining the SRS workforce, the five-county area may need to promote more multi-family construction to accommodate these new market segments.
Currently, 68 percent of the region’s housing units are owner-occupied. This rate is slightly higher than that of the US, which is almost 64 percent. Given the delayed home ownership patterns of Millennials and the housing characteristics of the likely market segments of the younger workforce, this trend may reverse over the near term.
The housing markets in the region are stable, for the most part, with a good range of products. Inventory is declining in some areas of the region, and the markets in those areas are tightening. Columbia County, with just over 1,000 active listings, has the highest median list price ($259,900) and the lowest median days on market (65 days). Aiken County has the highest median days on market at 96 days. No market data was available for Allendale and Barnwell Counties. The increase in area residents related to both the cyber command at Fort Gordon and the workforce transition at SRS will likely lead to further tightening of the housing markets. New home construction has slowed as development and construction costs have increased. In the Augusta Metro Area, which includes Aiken County, the cost of developing new home lots increased 40 percent between 2011 and 2017.13
13 Greater Augusta Association of Realtors. (chronicle.augusta.com/business/2017-04-22/augusta-area-housing-inventory-shrinking)
FIGURE 44. HOUSING BY TYPE SRS IMPACT AREA, 2015
NUMBER OF UNITS
PERCENT OF UNITS
Multi-Family Units 34.6 K 15%
Single Family Units 159.3 K 70%
Mobile Home Units 32.0 K 14%
Total Housing Units (thousands) 225.9 K
FIGURE 45. HOUSING BY OCCUPANCY SRS IMPACT AREA, 2015
NUMBER OF UNITS
PERCENT OF UNITS
Owner-Occupied Units 128.8 K 68%
Renter-Occupied Units 63.3 K 33%
Total Occupied Units (thousands) 189.7 K
Source: US Census Bureau (BOC): American Community Survey (ACS), 2015
FIGURE 46. REAL ESTATE CHARACTERISTICS BY COUNTY, 2017
MEDIAN LIST PRICE
ACTIVE LISTINGS
MEDIAN DAYS ON MARKET
Columbia, GA $259,900 1,037 65
Richmond, GA $120,000 608 81
Aiken, SC $204,500 1,358 96
Allendale, SC N/A N/A N/A
Barnwell, SC N/A N/A N/A
Source: Realtor.com

SRS COMMUNITY REUSE ORGANIZATION
IMPACT & CONSEQUENCE ANALYSIS PAGE | 41
EDUCATION The five-county region is home to several high-ranking school districts and nationally ranked high schools, demonstrating a wide range of high-quality educational offerings. Each county has a unique mix of career-readiness, honors, college credit, and extracurricular opportunities for students.
The region has eight school districts with 140 schools and 87,000 students in all. Richmond County and Columbia County serve the most students, while Aiken County and Columbia County are ranked the highest.
FIGURE 47. FIVE-COUNTY AREA SCHOOLS, 2016 SCHOOLS, STUDENTS, AND RANKINGS
COUNTY DISTRICT NUMBER OF SCHOOLS
NUMBER OF STUDENTS
SCHOOL DIGGER RANKING
Aiken, SC Aiken 01 40 24,534 48th out of 83 SC districts
Barnwell, SC Barnwell 45 4 2,362 58th out of 83 SC districts
Barnwell 19 3 714 78th of 83 SC districts
Barnwell 29 3 917 69th out of 83 SC districts
Allendale, SC Allendale 01 4 1,322 80th out of 83 SC districts
Richmond, GA Richmond County 56 31,823 165th out of 182 GA districts
Columbia, GA Columbia County 30 25,532 17th out of 182 GA districts
Total
140 87,204
Source: SchoolDigger.com
Three high schools in the region were ranked in US News and World Report:
TOP RANKED HIGH SCHOOLS 2017
#4 Davidson Magnet School Richmond County, GA Davidson Fine Arts is a public magnet school serving around eight hundred students in grades six through twelve. The school focuses on fine arts education.
#30 Greenbrier High School Columbia County, GA Greenbrier High School is a public school serving around eighteen hundred students in grades nine through twelve. The school is an academy of advanced placement and professional studies.
#38 Johnson Magnet School Richmond County, GA Johnson Magnet school serves around five-hundred sixty students in grades seven through twelve. It has a focus on health science and engineering.
Source: US News and World Report
In addition, the school districts in the SRS Impact Area offer school programs that prepare students for college or a career. Most public high schools offer the chance for college credit in the form of dual-enrollment or advanced placement classes.
The Aiken County Public School District offers a number of programs to enhance its students college and career readiness. For example, AIKEN WORKS pairs students with local businesses to receive hands-on, paid internships. This program provides students with skill sets and the community with a capable workforce. The Aiken Scholars program pairs high-achieving

SRS COMMUNITY REUSE ORGANIZATION
IMPACT & CONSEQUENCE ANALYSIS PAGE | 42
students from the Aiken County School District with the resources of the University of South Carolina Aiken to offer college courses on USCA’s campus to the selected students at no additional cost. Lastly, Aiken County has a partnership with the University of South Carolina Aiken at the Ruth Patrick Science Education Center. Programs like STEP utilize resources at the SRS site to provide hands-on learning to students in the fields of science and mathematics.
The Allendale County Schools is home to one high school and career center, one alternative school, and one adult education program. Allendale-Fairfax High School and Technology Center offers programs in cosmetology, building construction, auto technology, business finance, accounting, and welding.
In the Barnwell 45 District, Barnwell High School offers honors and advanced placement classes. Blackville-Hilda High School partners with Barnwell County Career and Technology Center to provide vocational training to students and offers three dual-enrollment courses.
The Columbia County School District offers numerous advanced placement, International Baccalaureate Classes, and honors courses at its high schools. All elementary schools provide the Schoolwide Enrichment Model (SEM) which places each student in an area of interest at a young age. All middle schools are seeking Science, Technology, Engineering, and Math (STEM) certification. Finally, all high schools offer specialty programs ranging from STEM to Career Sciences and Professional Studies.
The Richmond County School District offers sixteen program areas and thirty-four career pathways across the eleven high schools. Program area options range from Agriculture, Food, and Natural Resources to Information Technology. The district also began the “Reaching Potential through Manufacturing” program in 2016, which partners with Textron Specialized Vehicles to increase student employability and increase the graduation rate for the district.
In addition, the SRS Impact Area has an active partnership—the Nuclear Workforce Initiative—that includes five post-secondary education institutions and SRS employers focused on workforce development and talent. Figure 48 shows the locations of these institutions in region.
FIGURE 48. EDUCATIONAL PARTNERS

SRS COMMUNITY REUSE ORGANIZATION
IMPACT & CONSEQUENCE ANALYSIS PAGE | 43
QUALITY OF PLACE The SRS Impact Area is known for a variety of historic assets, entertainment venues, and recreational opportunities. Additionally, the urban areas are seeing an influx of investment and interest in re-imaging historic downtowns. Previously underutilized downtowns and riverfronts are re-emerging as vibrant centers that cater to the needs of residents and employers. Once “nine-to-five” downtowns are intentionally transitioning to more twenty-four/seven models that feature amenities that enhance the quality of life for residents. From educational facilities to night life, cities like Augusta, North Augusta, and Aiken are playing an active role in their redevelopment. Key proposals such as the Riverside Village at Hammonds Ferry, the Downtown Augusta Revitalization, and the Aiken Renaissance Project will catalyze redevelopment and create enjoyable, memorable places for their residents because they offer the right mix of private and public cooperation.
UPCOMING DEVELOPMENTS RIVERSIDE VILLAGE AT HAMMONDS FERRY NORTH AUGUSTA, SC
Riverside Village at Hammonds Ferry, previously known as “Project Jackson,” is a $200 million, mixed-use development along the Savannah River. The project will feature a baseball stadium for the Augusta Green Jackets, a hotel, a conference center, a senior living facility, housing, restaurants, office space, retail space, and a family YMCA. Named for the founder of North Augusta, James U. Jackson, this is the largest economic proposal made in the history of the city. The baseball stadium will also be used for concerts, trade shows, and festivals. Located just across the river from downtown Augusta, this proposal will provide new amenities not just for North Augusta, but the whole region.
Source: https://bloximages.newyork1.vip.townnews.com/northaugustastar.com/content/tncms/assets/v3/editorial/f/17/f172bdce-e8b1-574c-aaef-85537ccd0b91/580a457497f97.image.jpg
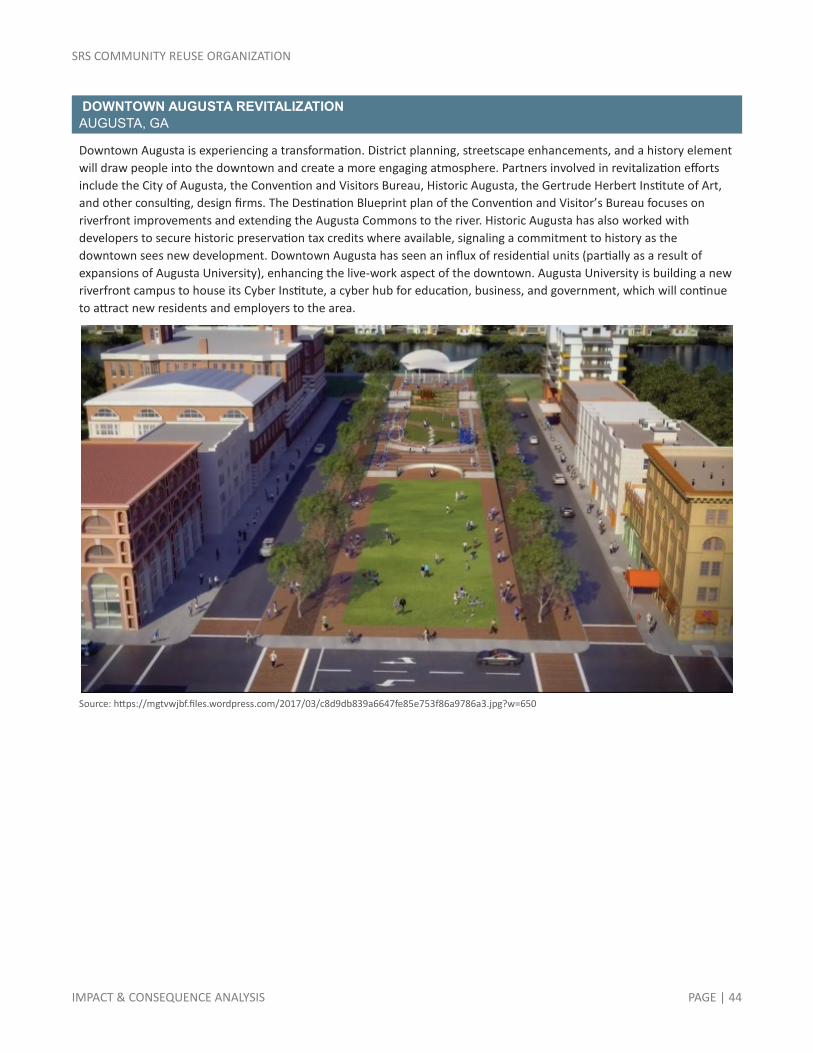
SRS COMMUNITY REUSE ORGANIZATION
IMPACT & CONSEQUENCE ANALYSIS PAGE | 44
DOWNTOWN AUGUSTA REVITALIZATION AUGUSTA, GA
Downtown Augusta is experiencing a transformation. District planning, streetscape enhancements, and a history element will draw people into the downtown and create a more engaging atmosphere. Partners involved in revitalization efforts include the City of Augusta, the Convention and Visitors Bureau, Historic Augusta, the Gertrude Herbert Institute of Art, and other consulting, design firms. The Destination Blueprint plan of the Convention and Visitor’s Bureau focuses on riverfront improvements and extending the Augusta Commons to the river. Historic Augusta has also worked with developers to secure historic preservation tax credits where available, signaling a commitment to history as the downtown sees new development. Downtown Augusta has seen an influx of residential units (partially as a result of expansions of Augusta University), enhancing the live-work aspect of the downtown. Augusta University is building a new riverfront campus to house its Cyber Institute, a cyber hub for education, business, and government, which will continue to attract new residents and employers to the area.
Source: https://mgtvwjbf.files.wordpress.com/2017/03/c8d9db839a6647fe85e753f86a9786a3.jpg?w=650

SRS COMMUNITY REUSE ORGANIZATION
IMPACT & CONSEQUENCE ANALYSIS PAGE | 45
THE PLAZA AT EVANS TOWNE CENTER EVANS, GA
The Plaza at Evans Towne Center is a retail driven, walkable, multi-use development anchored by a performing arts center in the heart of Evans. This area is currently being developed in stages with Phase I already under construction. It is across the street from the Columbia County Court House, the Evans Library and Evans Towne Center Park/Lady Antebellum Amphitheater. The 22-acre site includes three phases of retail, professional and residential developments; there are six entrances designed for this project. Phase I of the Plaza will be 96,000 square feet including 56,000 square feet of professional space and 40,000 square feet of retail space. When completed, over the next several years, this development is expected to be a $65 million infrastructure investment with 300,000 of developed square feet.
Source: http://www.meybohmcommercial.com/resources/149.pdf?PN=Community-News
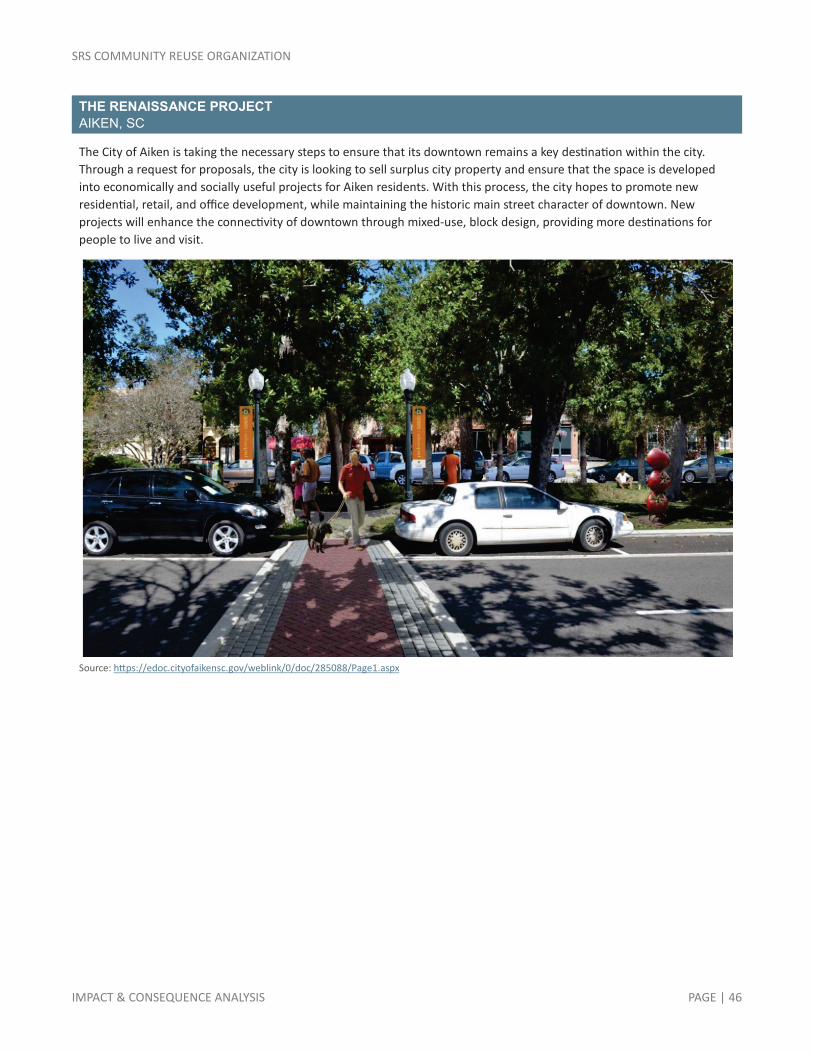
SRS COMMUNITY REUSE ORGANIZATION
IMPACT & CONSEQUENCE ANALYSIS PAGE | 46
THE RENAISSANCE PROJECT AIKEN, SC
The City of Aiken is taking the necessary steps to ensure that its downtown remains a key destination within the city. Through a request for proposals, the city is looking to sell surplus city property and ensure that the space is developed into economically and socially useful projects for Aiken residents. With this process, the city hopes to promote new residential, retail, and office development, while maintaining the historic main street character of downtown. New projects will enhance the connectivity of downtown through mixed-use, block design, providing more destinations for people to live and visit.
Source: https://edoc.cityofaikensc.gov/weblink/0/doc/285088/Page1.aspx

SRS COMMUNITY REUSE ORGANIZATION
IMPACT & CONSEQUENCE ANALYSIS PAGE | 47
THE PROMISE ZONE ALLENDALE & BARNWELL COUNTIES, SC
In April 2015, SouthernCarolina Alliance won the Promise Zone designation, making the region one of 8 in the country (and the only rural area) to receive the designation. The Promise Zone designation will provide for assistance in identifying, applying for, and implementing economic and community development programs for the next ten years. This designation increases the chances for this area to receive federal funding and other services in areas such as housing, education, and quality of place.
The Promise Zone in the southern part of South Carolina includes six counties and 90,004 people. The poverty rate in this area is 28.12% and the unemployment rate is 14.7%. The median household income for the area is $32,705, which is 25 percent lower than the rest of the state and 45 percent lower than the nation. The SouthernCarolina Alliance leads the Promise Zone with twenty-eight other supporting organizations ranging from housing authorities to workforce training institutes to local governments. Together these partners have recognized these outcomes as goals of the Promise Zone designation: create jobs, improve educational outcomes, increase economic activity, leverage private capital, expand affordable housing stock, and improve public safety. As of 2015, some of these goals have already been realized; funding for the Promise Zone has reached $13,814,450, capital investment has reached $523,450,000, 374 new jobs have been created, and $113.1million in USDA Rural Development funds have been acquired, among others.
The SC Promise Zone has identified a list of “Big Ticket Items” or projects that it hopes to realize through the Promise Zone. These projects include:
Affordable broadband access
A multipurpose facility, including a forensics lab and training center
Marketing and public relations to help establish a new image/brand for the region and celebrate the success of the Promise Zone
Redesigned K-12 educational programs, including a career academy
Removal of blight and redevelopment of vacant buildings
A plan for cost and revenue sharing that fosters collaboration and cooperation across the region
Expansion of a revolving loan fund, possibly creating a SC Promise Zone Regional Bank
Business or technology hub(s) to encourage more private industry in the region
Transportation improvements to improve mobility of the region’s residents
A regional tourist attraction to create a destination in the Promise Zone
Competitive industrial sites to attract new businesses to the Promise Zone

SRS COMMUNITY REUSE ORGANIZATION
IMPACT & CONSEQUENCE ANALYSIS PAGE | 48
RECREATIONAL, CULTURAL, AND ENTERTAINMENT AMENITIES The SRS Impact Area offers a wide range of natural, historic, cultural, and urban amenities. Below, are some of the highlights.
AIKEN COUNTY, SC Aiken County is known for outdoor recreational activities and numerous opportunities for equestrian-related activities. Notable facilities include the Rye Patch and programs at Hopelands Garden, the Smith Hazel Recreation Center, Ceramics, the H.O. Weeks Activity Center, Citizens Park complex, Aiken Thoroughbred Racing Hall of Fame, AECOM Center for Performing Arts, the USC Aiken Convocation Center, Community Parks & Playgrounds and the Aiken Visitors Center. Equestrian activities include fox hunting, steeplechase, polo, equestrian competitions, and recreational riding. Hitchcock Woods is located near Aiken and is one of the largest urban forests in the country. With 2,100 acres of forestland and over 70 miles of walking and horseback riding trails, this is a unique and distinguishing feature. The Woods are home to historic markers and ecological sites. Lastly, the county is also home to the Aiken State Park on the Edisto River. Aiken State Park spans 1,067 acres and includes a 1.7-mile canoe/kayak trail.
ALLENDALE COUNTY, SC The county is home to a wide array of recreational venues that offer hunting, fishing, boating, and golf year-round. In addition, the recently-restored, art-deco Carolina Theater hosts community events and performances, and the Salk Arts Center provides a venue for local artists to display their works.
BARNWELL COUNTY, SC The 307-acre Barnwell State Park is known for fishing. The park includes three lakes, cabins, and campgrounds. There is also a nine-hole disc golf course at Fuller Park in Barnwell County and traditional golf at Sweetwater Country Club. The county is part of the South Carolina National Heritage Corridor and part of the Tourism Region of Thoroughbred Country.
COLUMBIA COUNTY, GA Columbia County is home to many recreational amenities, including an indoor water gymnasium, disc golf courses, softball complex, dog park, and other parks spread throughout the county. Clarks Hill Lake provides a wide range of different outdoor recreational activities. Mistletoe State Park provides opportunities for camping and fishing beside Clarks Hill Lake, Bartram Trail is an 18-mile trail along the lake for hiking and mountain biking, and the International Disc Golf Center at Wildwood Park has three different professional courses. The county is also home to the Laurel and Hardy Museum. In addition, the Lady Antebellum Pavilion and the Jabez S. Hardin Performing Arts Center host various high profile concerts and events.
RICHMOND COUNTY, GA Most famously, Richmond County is home to the Master’s Tournament, one of the four major championships in professional golf. Each year, over two-hundred and fifty thousand people visit the tournament.14 In addition, the Augusta Canal, a National Heritage Area, is the only fully intact American industrial canal in continuous operations. It offers a variety of recreational opportunities—hiking, biking, or paddling. The Augusta Riverwalk runs along the Savannah River in Downtown Augusta; it includes scenic overlooks, event plazas, an amphitheater, and Japanese Gardens. Richmond County has over 70 park sites and 1,500 acres of parkland that features a wide variety of facilities with family oriented leisure activities.
14 https://wallethub.com/blog/masters-facts/2965/
FIGURE 49. CAROLINA THEATER
Photo courtesy of USC-Salkehatchie

SRS COMMUNITY REUSE ORGANIZATION
IMPACT & CONSEQUENCE ANALYSIS PAGE | 49
IMPLICATIONS FOR THE REGION The various counties in the SRS Impact Area offer distinct lifestyles and amenities, from rural to urban, that appeal to a broad range of market segments. The region is rich in assets; however, there are some areas where further investments may be needed.
Housing. The housing markets in some areas of the region are tightening and more inventory of single family homes will likely be needed to accommodate the influx of new residents to the region. Additional rental units will also likely be needed to accommodate the next generations of residents.
Education. The region’s school districts are of varied quality. Most, however, have several stand-out programs that provide exemplary educational opportunities for students with access to these programs. There are areas of the region that do not have the density of students to support this kind of programming, which will likely prove to be a barrier to attracting new residents.
Quality of Place. Communities in the region are making big investments in community assets – downtowns, town centers, park and recreation systems, and performing arts and sports venues. These projects complement existing amenities. Continually maintaining and marketing the existing amenities to new residents will be essential to leveraging their value.

SRS COMMUNITY REUSE ORGANIZATION
IMPACT & CONSEQUENCE ANALYSIS PAGE | 50
CASE STUDIES The experiences of other communities with large federal facilities can provide best practices and lessons learned for the communities in the SRS Impact Area. In this report, four communities are profiled:
Los Alamos, New Mexico (Los Alamos National Labs)
Tri-Cities, Washington (Pacific Northwest National Laboratory)
Oak Ridge, Tennessee (Oak Ridge National Laboratory)
Central Texas (Fort Hood)
Each of these communities has struggled to attract or retain talent in their regions and have implemented innovative initiatives to do so. The initiatives include actively promoting new housing development, cultivating innovation around the federal facility, and collaborating higher quality educational opportunities.
LOS ALAMOS, NEW MEXICO Located in Los Alamos, New Mexico, Los Alamos National Labs (LANL) is a US Department of Energy (DOE) laboratory established during World War II as part of Manhattan Project. The lab’s original mission was to help design America’s first nuclear weapons. Today, LANL has a more diverse national security mission that involves nuclear security, intelligence, defense, emergency response, nonproliferation, counterterrorism, energy security, emerging threats, and environmental management.
In 2016, LANL had a total budget of $2.54 billion and a workforce of 11,200. Approximately 10,800 LANL employees work at the lab’s primary campus in Los Alamos, which encompasses over 1,000 buildings and 40 square miles. LANL reports that only 43 percent of its workforce lives in Los Alamos County; the remainder commute from Santa Fe, Española, Taos, and Albuquerque. According to the 2016 Census estimate, the population of Los Alamos County is 18,147.
LANL estimates that 30-40 percent of its workforce will retire over the next five years. Such a turnover will necessitate the hiring of 2,400 replacement jobs over the period. Los Alamos County officials hope that many of these new employees and their families, as well as the retirees they are replacing will choose to reside in Los Alamos. The County would like the population to reach the 20,000 threshold in order to attract new national retail stores and outlets to the community. However, accommodating new individuals and families will require the community to invest in new housing, schools, recreational, and cultural amenities.
The lack of appealing and affordable housing is the county’s greatest challenge. Half of the county’s housing units were built between 1940 and 1969. Almost 10 percent of housing units were constructed between 1940 and 1949. Moreover, the majority of rental apartment housing in Los Alamos is 50-60 years old. There were 15 new residential building permits issued in the county in 2015, which is the highest figure since 2007 by almost double. Due to the age of the existing housing stock, County officials report that Los Alamos suffers from both a deficiency of high quality units as well as a lack of diversity of housing types. Consequently, the housing stock in Los Alamos struggles to meet the needs of either young residents or retirees.
In addition to a lack of supply, the cost of housing in Los Alamos County is a challenge. Los Alamos County is the most expensive housing market in New Mexico. According to American Community Survey (2010-2014), the estimated home value in Los Alamos County is $280,700, which is 176 percent higher than the home value for the state.
To expand the quality, diversity, and affordability of the housing stock, Los Alamos County has begun working with developers to construct new housing on County-owned land. The County has identified three sites near the downtown area in the Town of Los Alamos for potential new housing development. In addition, the County has designated zoning for those sites as mixed-use to allow for housing alone or a combination of housing and other development. Los Alamos County is also exploring the establishment of incentives to promote the development of affordable and workforce housing on County land, including the creation of an affordable housing fund.

SRS COMMUNITY REUSE ORGANIZATION
IMPACT & CONSEQUENCE ANALYSIS PAGE | 51
Beyond housing, Los Alamos County is also making investments in community amenities to help retain and attract new residents. County residents recently approved a bond referendum to pay for new recreational assets and amenities. The items voters approved funding for include an indoor recreation center, an ice rink, golf course improvements, and new sports fields.
TRI-CITIES, WASHINGTON The Pacific Northwest National Laboratory (PNNL) is a Department of Energy (DOE) Office of Science lab that has its main campus located in the Tri-Cities region of Washington state. The three major cities of the region include Richland (home to the PNNL main campus), Kennewick, and Pasco and have a combined population of about 250,000. PNNL scientists conduct basic and applied research and development toward four primary missions:
• Science – strengthening US innovation in chemistry, data analytics, and environmental science; • Energy – improving energy efficiency and increasing the use of renewable energy and storage; • Environment – reducing the effects of human activities and creating sustainable solutions; and • National security – preventing the proliferation of weapons of mass destruction.
In 2016, PNNL managed a total workforce of 4,485; 84 percent of whom reside in the Tri-Cities. Overall employment at the lab has increased by 27 percent since 2000. Total FY16 funding at the lab totaled $1.08 billion. DOE provides 65 percent of PNNL funding. Other federal agencies that provide funding include the Department of Defense, the Nuclear Regulatory Commission, the Department of Health and Human Services, and the Department of Homeland Security.
For many years of its existence, many in the Tri-Cities region did not feel as though the surrounding communities were sufficiently leveraging the personnel and facilities at PNNL to spur additional economic growth and development. In response, the City of Richland developed an economic development strategic plan in 2006 that focused on building the physical, educational, and entrepreneurial environment around PNNL to transform it into a dynamic economic driver for the region’s economy. The goal was to establish other companies in and around PNNL to provide economic diversification for the region resulting in less reliance on the Hanford Nuclear Site.
The blue-ribbon initiative that emerged from the strategic plan was the Tri-Cities Research District (TCRD). Tri-Cities is a 1,700-acre research park that houses five major property owners: PNNL, the US Department of Energy, the Port of Benton, Washington State University Tri-Cities (WSU TC), and a private developer. The TCRD is a 501(c)(6) nonprofit corporation managed by a 15-member board of directors that includes the cities of Kennewick, Pasco, Richland, Columbia Basin College, WSU TC, PNNL, Lockheed Martin, US Department of Energy, and State of Washington Workforce development.
The vision of the TCRD is to create an entrepreneurship and innovation ecosystem that connects federal R&D, higher education, and private businesses and entrepreneurs by facilitating new partnerships, technologies, and products. TCRD sought to achieve this vision by creating a long-range master plan designed to create a sense of “place” within TCRD. The master plan encompasses 325 acres of property that is available for R&D, education, commercial office, residential, entertainment, hospitality, and recreational uses. It is intended to foster a creative and inviting atmosphere where students, faculty, researchers, and companies can collaborate.
Since its inception, the TCRD has experienced many successes. These include a substantial expansion of the PNNL campus, the physical and academic growth of WSU TC, and the development of both the Port of Benton and the City of Richland’s Horn Rapids Business and Industrial Parks. It also includes new commercial and residential development, the designation of the district as a Washington State Innovation Partnership Zone (IPZ), the launching of the Mid-Columbia Energy Initiative, and the transfer of 1,341 acres from the Department of Energy to the City of Richland and Port of Benton, and its incorporation into the TCRD boundaries.
TCRD has recently adopted a 2017 action plan. Going forward, key goals include the development of new student housing and a student union building; establishing a MakerSpace facility; and promoting new neighborhood development such as a 24-hour gym, preschool, and a hotel.

SRS COMMUNITY REUSE ORGANIZATION
IMPACT & CONSEQUENCE ANALYSIS PAGE | 52
OAK RIDGE, TENNESSEE Oak Ridge National Laboratory (ORNL) is a US DOE multiprogram science and technology national laboratory located in Oak Ridge, Tennessee. ORNL is the largest DOE science and energy national laboratory by surface and by annual budget. In 2016, ORNL registered expenditures of $1.4 billion and employed 4,750, including 1,100 staff scientists and engineers. ORNL’s two primary mission areas are clean energy and global security. Additionally, the lab’s core research areas include advanced materials and nanotechnology, computational sciences, biotechnology, energy and environment, and homeland security.
The Oak Ridge Reservation encompasses five campuses: The National Laboratory, the Y-12 National Security Complex, the East Tennessee Technology Park (formerly the Oak Ridge Gaseous Diffusion Plant), the Oak Ridge Institute for Science and Education, and the developing Oak Ridge Science and Technology Park. The total area of the reservation is 58 square miles, of which the lab accounts for seven square miles.
The city of Oak Ridge has a population of 29,300 residents. The wider Oak Ridge-Knoxville region, which supports a population of 861,000, is served by a regional economic development partnership branded as Innovation Valley. Raising awareness of the technology assets and partnerships available at ORNL is one of the key objectives of Innovation Valley. The partnership is also heavily invested in increasing the focus on talent development and retention in the region.
A specific talent development initiative, Innovation Valley, supports the Knox County Schools Career Magnet Academy at Pellissippi State Community College (CMA). The goal of CMA is to offer students a chance to graduate with a rich educational curriculum that entails "hard-skills," "soft-skills," and coursework that counts toward an associate’s degree. Students enrolled in the academy choose one of four career paths at CMA - Homeland Security, Advanced Manufacturing, Teacher Preparation, or Sustainable Living. As they progress through CMA, scholars will transition from being solely a Knox County Schools student to becoming dually enrolled in both the Knox County Schools and Pellissippi State Community College.
CENTRAL TEXAS Fort Hood is the largest military installation in the world in terms of total land area (215,000 acres). The US Army Post is home to 45,414 assigned soldiers or airmen and 8,909 civilian employees, making it the most populous US military installation and the largest single site employer in Texas. The Post directly inserts nearly $3 billion annually into the Texas economy. Fort Hood is located in the Central Texas, about halfway between Austin and Waco. Central Texas boasts a growing regional population of 335,000 and includes the cities of Killeen, Copperas Cove, Temple, and Belton.
While the Central Texas region has grown and prospered in large part due to the presence of Fort Hood, it has also faced substantial challenges associated with the impact of the Army population on the communities. The biggest challenge has been adapting to the changing demographics among the military personnel stationed at Fort Hood. Between WWII and the early 2000s, Soldiers tended to be younger and single. For many personnel that did have a family, spouses and children often remained in the home community during their term of service rather than moving around to different communities.
However, in the post-9/11 era, the Army and the other service branches have placed a greater emphasis on retaining their personnel over multiple tours of duty. As a consequence, Soldiers are staying in longer and therefore are increasingly likely to have families. The families are also accompanying them more often to the communities where they are stationed. In response, communities surrounding military installations have launched efforts to integrate military families into the fabric of the community. By doing so, communities hope that personnel retiring or separating from service are more likely to remain in the community after their service ends, allowing them to capture their talents and economic impacts beyond their military service. Communities have an additional incentive of keeping military families happy should Congress authorize a future Base Realignment and Closure (BRAC) process.
Toward these purposes, Central Texas engaged in a strategic planning process in 2007 to identify strategies and initiatives the region could take to retain and engage veterans and their families, as well as to make it more competitive for outside talent, especially young professionals.
SRS COMMUNITY REUSE ORGANIZATION
IMPACT & CONSEQUENCE ANALYSIS PAGE | 53
A major finding of the planning process was the need to enhance the spectrum of educational opportunities available to Army personnel and their families in Central Texas. Regional officials and educational leaders subsequently committed to developing new academic offerings in an effort to make the region a more desirable place for military members and their families, both during and after their service. The center piece of their efforts was the establishment of Texas A&M Central Texas (TAMUCT), which is focused on serving the military community. The university was founded in 2009 on 672 acres deeded from Fort Hood through the Department of the Army. Almost half of its students are military-affiliated.
TAMUCT, the Killeen Independent School District (KISD), and Central Texas College (CTC) have partnered to develop a program that makes a seamless and affordable pathway from an associate’s degree to a bachelor’s degree for active duty soldiers, veterans, and military spouses. The institutions have aligned their programs to make it easier for military-related residents to work toward an associate’s, bachelor’s, or master’s degree for less than $20,000 in many cases. In recognition of the region’s education efforts, the Central Texas region was named by the Association of Defense Communities (ADC) as a 2017 Great American Defense Community.
SRS COMMUNITY REUSE ORGANIZATION
IMPACT & CONSEQUENCE ANALYSIS PAGE | 54
STRATEGIC CONSIDERATIONS As the communities in the SRS Impact Area prepare for the workforce transition at the Site and the influx of residents associated with Fort Gordon, there are four opportunity areas where deliberate and coordinated efforts could better position each community to attract its share of new workers. These four areas are detailed below:
1. ENGAGE AND RETAIN: Engage and retain new workers at SRS as well as retirees in the five-county region.
Both SRS and the community of Aiken have launched initiatives to identify strategies to attract, develop, and retain new workers. At the Site, the initiative is called Compelling Place to Work. In Aiken, it is called Compelling Place to Live. The intent of these programs should be extended across the region to ensure that workers associated with SRS are engaged in the community through opportunities for personal growth and fulfillment. This will help new residents establish roots in the region and help retirees find reasons to stay.
1.1. Expand and enhance work-place programs to tie SRS employees more closely to communities in the region.
The Savannah River Site is proactively leading programs to engage employees and prepare for the future of its workforce. The LEAP, AMP, and READY programs are examples of career development and community engagement programs that help the SRS workforce achieve goals inside and outside the workplace. The Leaders Emerging Among Professionals (LEAP) program organizes events such as lunch-and-learns, volunteer days, and employee social events to provide opportunities for continuing education and giving back at no cost to SRS employees. The Advancing Mid-Career Professionals (AMP) program provides guidance to mature professionals by helping to identifying career goals and planning professional development workshops. Finally, the Reaching Engineers at the Development Years (READY) program is aimed specifically at younger employees in engineering fields. This program has six foundational pillars: job rotation, training and development, mentoring and coaching, professional development, site visibility, and social networking. This type of engagement ensures a dynamic workplace with many opportunities for personal and professional growth. This is a good foundation for retaining quality employees and attracting new ones.
Other programs that could be considered are:
Employees on loan —programs such as Encore Fellowships encourage employees to take on discreet projects with nonprofit community organizations to build capacity or help address a challenge. Both the employee-on-loan and the host organization find great value in the relationship. Older workers who are nearing retirement and new employees waiting for security clearance could participate in these programs to build skills, give back to the community, and have a meaningful work experience.
SRS Explore! —an Explore! program would be an orientation program for new employees (but open to all employees) that offers opportunities to experience different activities, amenities, and communities across the region while cultivating friendships with other workers and residents in the region. Examples could be a trip to a Greenjackets game, a paddling excursion on the Edisto River, a horseback ride through the Hitchcock Woods, attending an event at the Carolina Theater or Lady Antebellum Amphitheater, or hosting a farm-to-table dinner at a small-scale farm. This program could be organized in partnership with regional chambers of commerce and could be opened up to other employers in the region.
SRS For Good! —this program would be a way of connecting SRS employees with volunteer opportunities in the area. An online platform such as VolunteerMatch.org or GivePulse.com provides a way for community organizations to list volunteer opportunities and volunteers can shop for opportunities. Volunteer hours can be tracked through these systems. This information could be used for rewarding and recognizing employees or retirees who give back and even having a friendly competition between organizations at the Site or between employers in the region.
SRS COMMUNITY REUSE ORGANIZATION
IMPACT & CONSEQUENCE ANALYSIS PAGE | 55
2. OUTSTANDING EDUCATIONAL OPPORTUNITIES: Ensure students across the region have access to outstanding educational opportunities.
The region has nine different school districts of varying quality. The high likelihood of families with school-aged children being one of the dominant market segments of new workers at the Site means that school district quality and student access to educational opportunities are important drivers of home-buying decisions. For communities to successfully attract a share of the new families moving to the area, they will need to provide access to exceptional educational programs. This does not mean that every school district must be (or even can be) highly ranked, but it does mean that the districts must have, or have access to, innovative programs that provide students with opportunities to excel.
2.1. Explore the feasibility of a regional initiative such as StriveTogether to help the school districts tackle their biggest challenges collectively.
2.2. Expand access to blue-ribbon educational programs such as magnet programs, scholarship programs, dual credit / early college high schools.
Career Academy in Allendale/Barnwell —one of the project ideas for the Promise Zone is a Career Academy that would give students from multiple districts in the Promise Zone area access to early college or dual-credit programs. Through these programs, students would be able to graduate from high school with both a diploma and an associate’s degree or industry-recognized certificate. The career pathways at the academy would be closely tied to employers in the region who need talent.
Savannah River Scholars —scale-up the Aiken Scholars model to reach more students.
2.3. Continue to strengthen connections between educational institutions and SRS organizations.
Nuclear Science Week —a program of the Nuclear Workforce Initiative, Nuclear Science Week exposes students across the region to careers in the nuclear industry. During Nuclear Science Week, SRS organizations host site visits and participate in various activities that help build awareness of the Site, career opportunities at the Site, and educational opportunities in the region to prepare for careers in the nuclear industry. This program is a great example of how to align industry and education through closer collaboration. Continue to expand this collaboration to more educational institutions and school districts to reach more regional students.
Volunteer activities —the Site organizations are already heavily involved in many different volunteer activities at school districts around the five-county region. Expanding these volunteer efforts into work-based learning activities and experiential learning opportunities can also strengthen the alignment of the region’s nuclear industry with the educational system.
3. NEXT-GEN HOUSING OPTIONS: Encourage the development of housing products for the next generation of residents.
The influx of new workers associated with the Savannah River Site and with Fort Gordon is likely to transform the regional housing markets to some degree. The region needs additional inventory and more rental units to meet the demand from these two events. However, communities in the region will have to work with existing neighborhoods and communities to help them evolve and meet the needs of the next generations of residents.
3.1. Work with neighborhoods with aging housing stock or less popular “product” to identify ways to re-invent themselves as intergenerational neighborhoods.
Revitalize Workshops —Hold workshops with struggling HOAs, communities, or neighborhood associations to share research on market trends in housing development and intergenerational planning to help them come up with ideas and formulate a plan that could revitalize their communities. Urban Land Institute could be a good partner in organizing these workshops.

SRS COMMUNITY REUSE ORGANIZATION
IMPACT & CONSEQUENCE ANALYSIS PAGE | 56
3.2. Promote the development of new kinds of communities or housing products.
Live/Work Pilot Program —Work with Allendale and Barnwell Counties to explore the feasibility of establishing a community for professionals and providing incentives for relocation and housing (as recommended in the Promise Zone strategic framework).
Multi-Family —Encourage communities to develop more high-quality multi-family rental units in mixed-use, amenity-rich projects.
4. QUALITY OF PLACE MATTERS: Continue to invest in community assets to enhance the region’s unique quality of place.
Many communities in the region are making big investments in quality of place assets. These investments complement and enhance existing assets, creating or reinforcing strong, vibrant centers of gravity that define the character of the individual communities in the region. At the same time that communities invest in these catalytic new projects, they must continually invest in their existing assets to ensure they are also well-maintained.
4.1. Identify and invest in a handful of high-quality, well-maintained, character-defining amenities.
For each county, create a list of catalytic projects and amenities that define the communities, and identify the value of investment needed to update or complete the project or amenity.
Prioritize these projects and amenities based on cost, feasibility, and available funding.
Engage Community Foundations and community leaders in legacy projects to expand regional funding resources available to support projects —many civic leaders and successful community members around the country are investing in legacy projects that markedly improve their communities. These examples can be found in revitalized downtowns including Fort Worth, TX; Las Vegas, NV; Fargo, ND; and Fort Collins, CO. Working with Community Foundations and individuals to engage them in legacy projects to promote community development can potentially attract more investment into these types of catalytic projects and community assets.
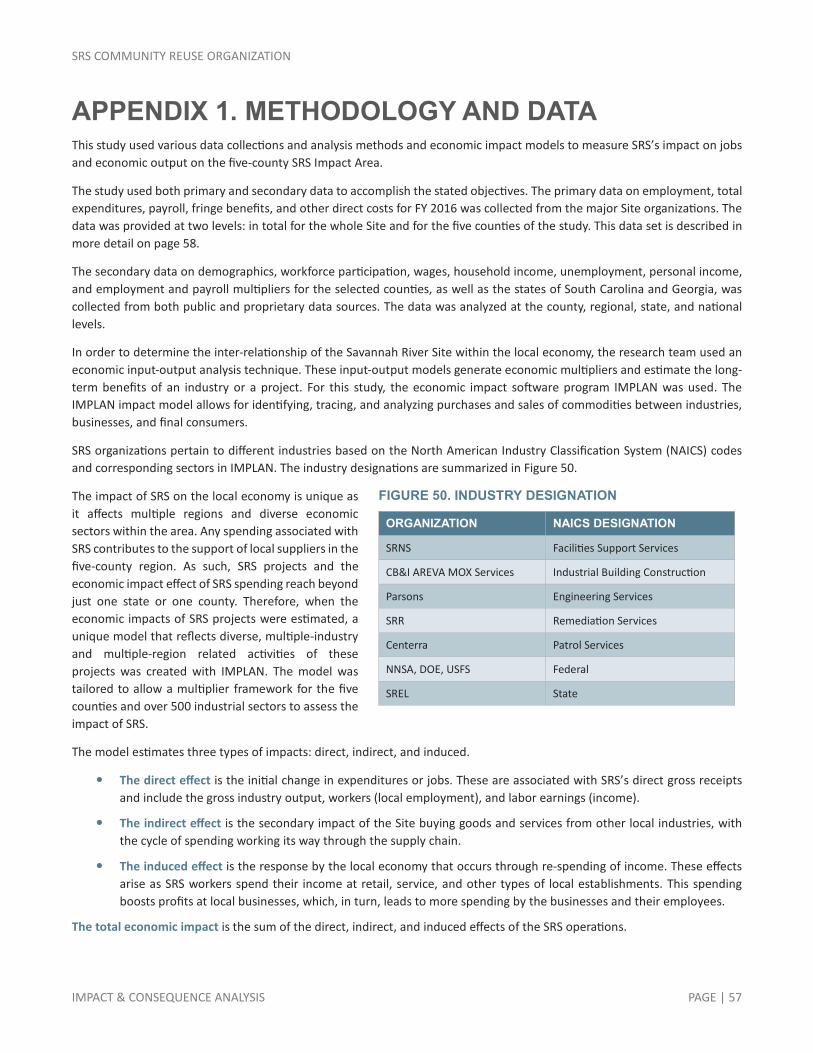
SRS COMMUNITY REUSE ORGANIZATION
IMPACT & CONSEQUENCE ANALYSIS PAGE | 57
APPENDIX 1. METHODOLOGY AND DATA This study used various data collections and analysis methods and economic impact models to measure SRS’s impact on jobs and economic output on the five-county SRS Impact Area.
The study used both primary and secondary data to accomplish the stated objectives. The primary data on employment, total expenditures, payroll, fringe benefits, and other direct costs for FY 2016 was collected from the major Site organizations. The data was provided at two levels: in total for the whole Site and for the five counties of the study. This data set is described in more detail on page 58.
The secondary data on demographics, workforce participation, wages, household income, unemployment, personal income, and employment and payroll multipliers for the selected counties, as well as the states of South Carolina and Georgia, was collected from both public and proprietary data sources. The data was analyzed at the county, regional, state, and national levels.
In order to determine the inter-relationship of the Savannah River Site within the local economy, the research team used an economic input-output analysis technique. These input-output models generate economic multipliers and estimate the long-term benefits of an industry or a project. For this study, the economic impact software program IMPLAN was used. The IMPLAN impact model allows for identifying, tracing, and analyzing purchases and sales of commodities between industries, businesses, and final consumers.
SRS organizations pertain to different industries based on the North American Industry Classification System (NAICS) codes and corresponding sectors in IMPLAN. The industry designations are summarized in Figure 50.
The impact of SRS on the local economy is unique as it affects multiple regions and diverse economic sectors within the area. Any spending associated with SRS contributes to the support of local suppliers in the five-county region. As such, SRS projects and the economic impact effect of SRS spending reach beyond just one state or one county. Therefore, when the economic impacts of SRS projects were estimated, a unique model that reflects diverse, multiple-industry and multiple-region related activities of these projects was created with IMPLAN. The model was tailored to allow a multiplier framework for the five counties and over 500 industrial sectors to assess the impact of SRS.
The model estimates three types of impacts: direct, indirect, and induced.
The direct effect is the initial change in expenditures or jobs. These are associated with SRS’s direct gross receipts and include the gross industry output, workers (local employment), and labor earnings (income).
The indirect effect is the secondary impact of the Site buying goods and services from other local industries, with the cycle of spending working its way through the supply chain.
The induced effect is the response by the local economy that occurs through re-spending of income. These effects arise as SRS workers spend their income at retail, service, and other types of local establishments. This spending boosts profits at local businesses, which, in turn, leads to more spending by the businesses and their employees.
The total economic impact is the sum of the direct, indirect, and induced effects of the SRS operations.
FIGURE 50. INDUSTRY DESIGNATION
ORGANIZATION NAICS DESIGNATION
SRNS Facilities Support Services
CB&I AREVA MOX Services Industrial Building Construction
Parsons Engineering Services
SRR Remediation Services
Centerra Patrol Services
NNSA, DOE, USFS Federal
SREL State
SRS COMMUNITY REUSE ORGANIZATION
IMPACT & CONSEQUENCE ANALYSIS PAGE | 58
PRIMARY DATA DESCRIPTION AND ESTIMATES Data was collected and provided by the Department of Energy for FY 2016. All Site organizations used October 1, 2015 through September 30, 2016 for FY 2016. There are four categories of data: number of employees, wages, fringe benefits, and other direct expenditures. The category ‘other direct expenditures’ includes subcontracts, materials, equipment, leases, corporate fee, power, utilities, personnel support, etc. This information was requested at two levels: 1) total, and 2) for the five-county Impact Area (Aiken, Barnwell, and Allendale in South Carolina, and Columbia and Richmond in Georgia) of the study. In addition, where the organizations were able, they provided information on their charitable contributions.
Unfortunately, not all organizations were able to provide the complete information requested so some assumptions and estimates had to be made.
1. EMPLOYEES All contractors provided total employees. Parsons and USFS did not distinguish between the number of employees who were residents in the five counties and those who were not. For all other site organizations, the average number of employees who were residents in the five-county area was 81 percent. Therefore, 81 percent was used to estimate this number for Parsons and USFS.
2. WAGES All Site organizations provided total wages for their employees. Only four provided this information with a county designation (SRNS, SRR, DOE, Centerra). For the remaining Site organizations, the percentage of total wages attributable to the five-county area residents was estimated by multiplying total wages for all employees by the percentage of employees at each organization who were residents of the five-county area (actual or estimated).
3. FRINGE BENEFITS Seven Site organizations provided information on fringe benefits (SRNS, MOX, DOE, Centerra, SRR, USFS and SREL). For these organizations, total fringe benefits divided by total wages resulted in a benefits to wage ratio of 38 percent. This ratio was used to estimate the amount of fringe benefits for non-reporting organizations. For SRR, USFS and SREL, the total fringe benefits were reported as 17, 35, and 25 percent of total wages, respectively. These percentages were used to calculate five-county fringe benefits as a percentage of five-county wages (which themselves were estimates).
4. OTHER DIRECT Not all contractors provided information regarding other direct spending. The two NNSA entities provided no data on spending other than wages and fringe benefits. There was no way to estimate this information so it is left as $0.00 in this analysis.
Of the contractors that did provide this information, local spending represented 27 percent of all spending. SRR, MOX, and USFS provided total spending but no data on spending in the five-county area. Therefore, 27 percent was used to estimate the direct spending of non-reporting organizations in the five-county area.
Based on the data received and the estimates made above, the total expenditures of the Site totaled $1.8 billion, approximately the same as the DOE budget of $1.9 billion. The difference is likely due to the lack of information about other direct expenditures at the two NNSA entities.

SRS COMMUNITY REUSE ORGANIZATION
IMPACT & CONSEQUENCE ANALYSIS PAGE | 59
APPENDIX 2. COMPARISON WITH THE PREVIOUS STUDY The previous economic impact study was completed in 2011 and used FY 2010 data. The previous study estimated the economic impact of the site on the five-county region and explored possible new mission areas and their potential impact. This study followed the same methodology to conduct the economic impact analysis, performed a sensitivity analysis to estimate the potential impact of job losses or gains as well as the workforce transition, and added additional research components to identify how communities in the SRS Impact Area can prepare for the workforce transition at the site. A comparison of the two studies and the economic impact analysis is provided below.
FIGURE 51. STUDY COMPARISON
2011 STUDY 2017 STUDY Scope • Economic impact
• Possible new mission areas • Economic impact • Sensitivity analysis • Implications of workforce transition
SRS Data FY 2010 (includes ARRA funding)
FY 2016
Methodology Economic impact analysis Economic impact analysis
Economic Model IMPLAN IMPLAN
SRS Employment Total Five-County Region
12,505 10,378 (83%)
10,532 8,566 (81%)
SRS Wages Total Five-County Region
$1,037,638,929 $875,766,813 (84%)
$914,375,507 $753,660,806 (82%)
SRS Benefits Total Five-County Region
$252,529,299 $205,163,018 (81%)
$345,414,060 $285,935,687 (83%)
SRS Other Direct Expenditures Total Five-County Region
$1,348,516,646 $257,680,865 (19%)
$548,986,231 $147,366,339 (27%)
SRS Total Expenditures Total Five-County Region
$2,638,684,874 $1,338,610,696 (51%)
$1,808,775,798 $1,186,962,833 (65%)
IMPACT SUMMARY (DIRECT, INDIRECT, & INDUCED)
Total Employment 23,262 18,705
Total Output $2.386 billion $2.346 billion
Total Labor Income $853 million $1.424 billion
Total Taxes $323 million $388 million
SUMMARY STATISTICS
Employment multiplier 2.5 2.2
Average SRS Wages (in Five-County Region) $85,031 $87,978