the royal society.rspb.royalsocietypublishing.org/content/royprsb/106/741/1.full.pdf · to prepare...
TRANSCRIPT

*
P R O C E E D I N G S OF
T H E ROYAL SOCI ETY.
S ection B .— B iological S ciences.
576 .8 .097 .39 : 616.931
T'he Composition o f Diphtheria Toxin— Antitoxin Floccules.By J. R. Marrack and F. Campbell Smith.
(Communicated by Sir Charles J. Martin, F.R.S.—Received November 6, 1929.)
(From the Hale Clinical Laboratory, London Hospital.)
The work of Ramon on the flocculation of mixtures of diphtheria toxin and antitoxin has given us a new measure of toxin—the L ; this is defined as the amount of toxin which with a unit of antitoxin flocculates in minimum time. Practically all the toxin and antitoxin in such an indicating mixture are carried down in the precipitate, and we may therefore consider that one L o f toxin combines with one unit of antitoxin to form a balanced compound of minimum solubility. From mixtures containing excess of toxin or antitoxin precipitates are formed containing an excess of one of these constitutents, the precipitation is delayed, and when the ratio is altered too far, altogether prevented.
Since practically all the toxin and antitoxin in an indicator mixture are precipitated, a study of the precipitate should shed some light on the nature of antitoxin, and possibly of toxin as well, unless these constituents are hidden among non-specific substances precipitated with them. With this end in view we have applied some new methods, particularly the ultra-violet absorption curve, to the study of the composition of the precipitate, and have investigated the effect of different conditions, particularly the presence of varying concentrations of non-specific proteins, on the amount of precipitate. *
* For a discussion of the flocculation method and bibliography, see Bayne-Jones (1928). VOL. CVI.— B. B
on September 16, 2018http://rspb.royalsocietypublishing.org/Downloaded from

2 J. R. Marrack and F. C. Smith.
Methods.
The antitoxic sera and toxins were kindly supplied to us by Dr. O’Brien, of the Wellcome Physiological Research Laboratories ; they were as follows :—
Antitoxic serum A .......... 920 units per 1 c.c.„ 2737... . 910 55
1664... . 2730 55
„ 2902... 17 55
„ 1876... 49 55
Cow serum ................... . 480 55
Antitoxic serum 2885... . About 700 55
220 55
„ 293... 40 55
“ Original ” pseudoglobulin 1700 55
Pseudoglobulin I* ........ . 890 55
II* ........ . 177 55
Toxin TX 397 .............. 14 units per 1 c.c.„ TX 422 ................ • 24 „
Protein 10*3 per cent.„ 15-6 55
In vivo.
Lower zone, “ non-specific.” Protein 7 • 3 per cent.
„ 18-5 „5 > 6 „5 J 2 , ,
A pseudoglobulin solution (Pseudoglobulin 2737) containing 8*15 per cent, of protein and 910 units per 1 c.c. was made from serum 2737.
Unless otherwise stated the titres of antitoxins and toxins were measured by the flocculation method. The titre in these in vitro units does not necessarily agree with the titre in Ehrlich units determined in vivo (see Glenny and Wallace, 1925).
To prepare floccules we either heated the mixture of toxin and antitoxin at 46° C. for 1-| hours after flocculation began and kept in the ice chest over night, or froze the mixture solid and left it surrounded by freezing mixture in the ice chest over night, a method of obtaining floccules described to us by Mr. C. G. Pope. The mixture was then centrifuged, the supernatant fluid pipetted off, 0-9 per cent. NaCl solution added, the fluid again centrifuged and the supernatant pipetted off. This washing was repeated twice. Hartley (1926) has shown that only slight reduction of the nitrogen content of the precipitate results from such washing. The resulting precipitate was then dissolved by adding hydrochloric acid to about 3-0, at which reaction *
* These two solutions were prepared by Mr. Pope from “ original pseudoglobulin ” by electrodialysis. They would not flocculate with toxin and were titrated by blending with antitoxin 2737.
on September 16, 2018http://rspb.royalsocietypublishing.org/Downloaded from
a solution was obtained which was clear by transmitted light but very slightly hazy when viewed against a dark background.
Crude toxin 422 was used in all experiments except I, I I I and XVII.Except where otherwise stated wTe studied the floccules from mixtures of
toxin and antitoxin in the proportion of one L / to one u n it; such a mixture we have called a balanced mixture. In all cases we have estimated these proportions for the actual toxin and antitoxin under consideration to 5 per cent., except in the case of antitoxic serum 2885, which is mentioned later. The amount of nitrogen found in the floccules is expressed as the amount per unit of antitoxin in the mixture used ; except in the unbalanced mixtures this will be the same as the amount per L/.
Nitrogen was estimated either colorimetrically by direct Nesslerisation, using an amount of solution containing some 0*16 mg. N, or by distillation and titration, using amounts containing some 3 mgm. N ; the second method was considerably more accurate.
I t has been shown by one of us (Smith, 1929) that the method of absorption spectrometry is of value for characterising a protein. This depends on the shape of the absorption curve which is obtained on plotting the values of the extinction coefficient* against a series of wave-lengths. Also, since the amount of absorption is not the same for different kinds of protein, it is necessary to know the nitrogen concentration of the protein solution under test. The protein is then characterised both by the shape of the curve and by the values of the extinction coefficients for a given concentration of nitrogen.
In the same paper (Smith, 1929) it was also pointed out that the ratioextinction coefficient at head of curve . , ,——— -------- ------------- - or Eft/E f could be taken as an index ofextinction coefficient at foot of curvethe purity of the sample. In the case of serum pseudoglobulin, which had been treated with alcohol and ether to remove lipoids, the value of this ratio was 3. Since the toxin-antitoxin floccules used by us were not so extracted, they, were compared with pseudoglobulins which were also untreated. The ratio EA/E of these was about 2 • 5, the change in value being due to E / becoming greater, whilst Eft remained the same. All the serum globulins, comprising those of four different species (horse, goat, rabbit and man) so far examined, have shown the same typical absorption curve already described by one of us.
It follows from the above that the method will detect the presence of
The extinction coefficient (log I —log I')/d (where I is intensity of light entering solution and I' the intensity of that leaving, and d is the thickness of the layer) is directly proportional to the concentration of the substances under test.
Diphtheria Toxin— Antitoxin. 3 on September 16, 2018http://rspb.royalsocietypublishing.org/Downloaded from

4 J. R. Marrack and F. C. Smith.
nitrogenous impurities in such globulins if they are present in sufficient amount. For example, if 10 per cent, of serum albumin were present in a sample of serum pseudoglobulin it would be detectable, since the extinction coefficient (Eh) of albumin is only about half that of globulin. Again, ammonium salts usually cause but little absorption, and hence if these were present as an impurity the absorption would be small compared with nitrogen content.
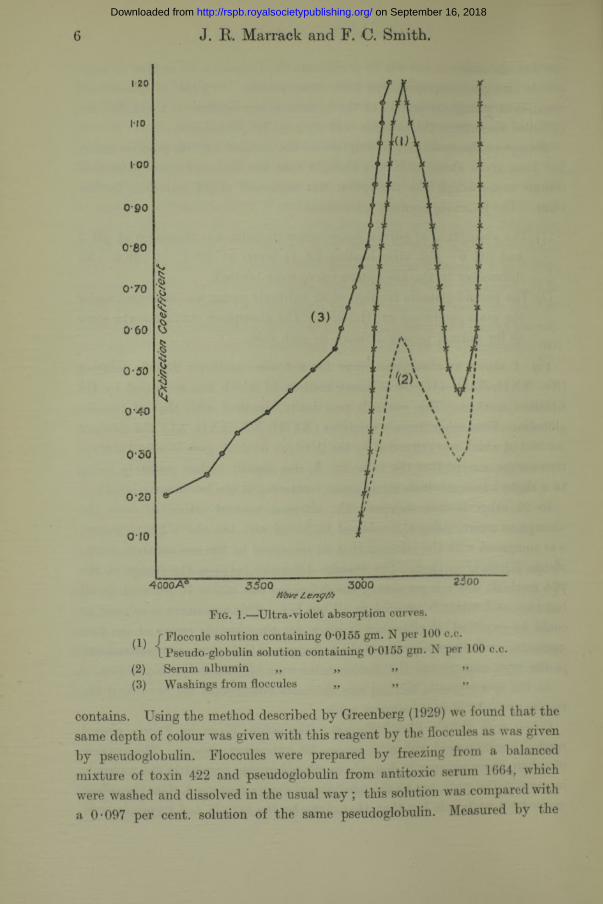
In order to be certain that error was not introduced by the presence of nitrogenous substances other than the floccules themselves it was necessary to ensure that they were washed sufficiently with saline before dissolving them. They were usually obtained from mixtures made with crude toxin broth, and this contained nitrogen containing compounds having a very high absorptive power at the wave-lengths with which we were concerned. The curve (3) in fig. 1 shows the absorption curve of the saline used for the first wash of one of our precipitates, about 40 c.c. of saline being used for the process. We found that saline used for the third washing showed no absorption. We therefore washed the precipitate three times in all cases.
The intrinsic error of the method itself is an absolute one of about 0-04 in the value of the extinction coefficient (von Halban and Eisenbrand, 1927). This would correspond to about 4 per cent, of the extinction coefficients with which we were dealing.
The solutions of toxin-antitoxin floccules and of the various pseudoglobulins with which their absorption spectra were compared contained 0*015 per cent. N. The absorption curves were measured with a Hilger quarter-plate spectrometer and rotating sector. The condensed spark between tungsten steel electrodes was used as the source of radiation.
Pseudoglobulin was prepared from antitoxic and normal horse sera by precipitation, thrice, by half-saturation with ammonium sulphate, followed by dialysis to remove salts and precipitate the euglobulin. Whole globulin also was prepared from normal serum, according to the method of Svedberg and Sjogren (1928), except that no toluol was added, bacterial changes being avoided by storing and dialysing in the cold. Hydrogen-ion concentrations were measured with the glass electrode (Kerridge, 1925).
1. Composition of Floccules.Absence of Inorganic Nitrogen.—-Flossner and Kutscher (1924) found that
86 per cent, of their floccules consisted of ammonium magnesium phosphate. The presence of such inorganic nitrogen would invalidate both our qualitative and quantitative conclusions. Actually we have found that the nitrogen in
on September 16, 2018http://rspb.royalsocietypublishing.org/Downloaded from

5
our floccule solutions was wholly precipitated by tungstic acid, so that no such simple nitrogen compounds can have been present. Crystals of ammonium magnesium phosphate settled at the bottom of our bottles of toxin, but we excluded them from the samples that we used for flocculation.
Absorption Spectrum.—A description of the method and its possible errors has been given above. I t was thought that the various experimental conditions under which the absorption was measured might introduce further error. The following controls were made :—
(1) The absorption of normal horse-serum globulin was measured at pH 3and pH 6 ; also after heating for 1-| hours at 46° C. at pH 6. No differences in the absorption curve were noticed.
(2) The pseudo-globulin fraction of an antitoxic serum was measured underthe same conditions as (1) above. The absorption curve was the same as for normal pseudo-globulin in each case.
Fig. 1 shows an absorption curve for a toxin—antitoxin floccule solution (No. XXII, Table III) the nitrogen content of which was measured by the titration method. This curve is practically identical with that of pseudoglobulin. Four other floccule solutions (XVIII, XX, XXII, XL), the nitrogen content of which was estimated by the titration method, gave identical absorption curves, except that the value for was slightly higher, probably owing to a slight haziness which would cause scattering at the lower wave-length.
In 25 other floccule solutions the nitrogen content estimated from the absorption curve, using the value of E h found with the above five solutions, was compared with the nitrogen content measured by the less accurate colorimetric Kjeldahl method. The average difference between the results of the two methods was 1*8 per cent. ; the difference was within 10 per cent, in all but two, and within 5 per cent, in all but five. This agreement is as good as could be expected, if allowance is made for the possible errors of the two methods ; with improvements of the technique of the colorimetric estimations in the later experiments the discrepancies were reduced below 5 per cent.
As the spectrometric method was the more trustworthy we have used the results given by it in subsequent work.
Colour with Folin’s Phenol Reagent.—The colour given by Folin’s phenol reagent has been used with some success for estimating proteins. The amount of colour given apparently depends on phenol groups present in the molecule in some special state, not on the total phenol groups contained, since the colour given by a protein is less than that given by the tyrosin and tryptophane it
Diphtheria, Toxin—Antitoxin. on September 16, 2018http://rspb.royalsocietypublishing.org/Downloaded from
6 J. R. Marrack and F. C. Smith.
Fig. 1.—Ultra-violet absorption curves.
rFloccule solution containing 0-0155 gm. N per 100 c.c.\ Pseudo-globulin solution containing 0 0155 gm. N per 100 c.c.
(2) Serum albumin „ „ » »>(3) Washings from floccules „ „ >»
contains. Using the method described by Greenberg (1929) we found that the same depth of colour was given with this reagent by the floccules as was given by pseudoglobulin. Floccules were prepared by freezing from a balanced mixture of toxin 422 and pseudoglobulin from antitoxic serum 1664, which were washed and dissolved in the usual way ; this solution was compared with a 0-097 per cent, solution of the same pseudoglobulin. Measured by the
on September 16, 2018http://rspb.royalsocietypublishing.org/Downloaded from
Diphtheria Toxin—Antitoxin. 7
extinction coefficient the floccule solution contained 0-0136 per cent, of nitrogen; by the phenol reagent it contained 0-0133 per cent, of nitrogen. The floccules therefore give the same amount of colour per gram of nitrogen with this reagent as does pseudoglobulin.
I t might be supposed that this colorimetric method measured the same property of proteins as the ultra-violet absorption, since both depend on phenol groups. This, however, is not the case, for serum albumin, which gives about the same amount of colour per gram of nitrogen as globulin, has only half the absorptive power.
Lipoid.—We have found only very small traces of ether or chloroform soluble substances in our floccules (Experiments XXI and XXIa). Flossner and Kutscher (1924), however, found 18-5 per cent, of the organic matter in their floccules to be soluble in alcohol and ether, and of this two-thirds was soluble in chloroform. This point is important in view of the significance attached to lipoids in immunity reactions, and particularly the fact that Hartley (1925, 2) found that diphtheria antitoxin extracted with alcohol and ether would not flocculate with toxin, although it still retained its protective power for animals. Flossner and Kutscher washed their floccules with distilled water, in which the floccules disperse, and it seems to us probable that they washed away the greater part of the specific precipitate. If the toxin they used was of moderate strength, they should have got about 0-13 gm. of organic nitrogen in their fioccules ; this would make the ratio lipoid/organic N equal to 0-035*/0-13, which is of the same order as that found by us in Experiment XXIa. I t is very possible that these small quantities are accidental contaminations which cannot be removed by washing with salt solution.
Experiment X X I .—250 c.c. of toxin 422 were mixed with 3-5 c.c. of “ original pseudoglobulin ” and frozen. Next day the floccules were centrifuged off, washed three times with saline, suspended in distilled water and brought to pH 3 • 0 with 0 • 04 N . HC1. The resulting clear solution was made up to 12 c.c. To 8-5 c.c. of this were added 35 c.c. of absolute alcohol. The precipitate was centrifuged down and the supernatant pipetted off, 80 c.c. of absolute alcohol were added, the precipitate again centrifuged down and the supernatant pipetted off ; this was repeated. The final precipitate was dried in vacuo, and extracted with hot chloroform ; the chloroform was evaporated down and no detectable residue obtained. From the supernatant alcohol washings 0-3 mgm. of ether-soluble material was obtained ; dissolved in chloroform this material gave with acetic anhydride and sulphuric acid a very doubtful greenish colour, very faint compared with that given by 0-016 mgm. of cholesterol.
The total nitrogen in the precipitate was 10-8 mgm., corresponding to 69-3 mgm. of protein, so that the alcohol and ether-soluble substances were less than 1 per cent, of the whole. The smallness of the amount of lipoid found might have been due to the use of purified pseudoglobulin as antitoxin.
on September 16, 2018http://rspb.royalsocietypublishing.org/Downloaded from

8 J. R. Marrack and F. C. Smith.
Experiment X X I a .—The intention in this experiment was to provide more lipoid for precipitation. To 100 c.c. of toxin 422 were added 2-4 c.c. of antitoxic serum A.T. 2737, 25 c.c. of normal horse serum containing 0 • 095 per cent, of cholesterol, and 15 c.c. of human serum containing 0-20 per cent, of cholesterol. The mixture was frozen and washed as before, suspended in 1 • 5 c.c. of distilled water and added gradually to 60 c.c. of a mixture of alcohol 3 parts and ether 1 part, as in the method of Bloor, Pelkan, and Allen (1922) for estimating cholesterol in blood. The mixture was boiled, cooled, made up to 100 c.c. with alcohol-ether mixture and filtered; 80 c.c. of the filtrate were evaporated and the residue extracted with hot chloroform ; this on evaporation gave 0 • 6 mgm. of residue, which on redissolving in chloroform gave with acetic anhydride and sulphuric acid a very doubtful greenish colour, much less than that given by 0-016 mgm. of cholesterol.
The nitrogen in these floccules should correspond to about 25 mgm. of protein, so that the chloroform soluble part did not exceed 3 per cent, of the total precipitate.
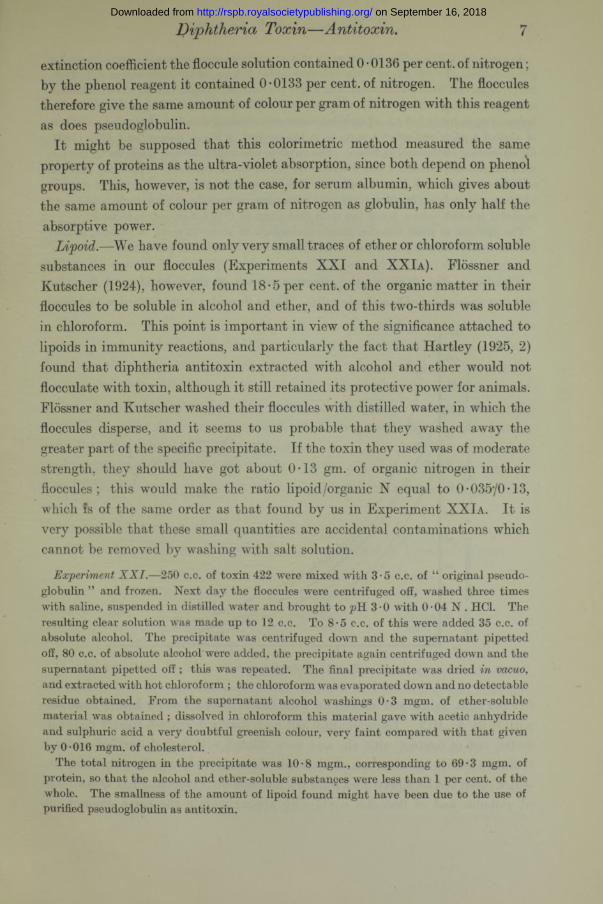
Titration.—Fig. 2 shows the titration curves of three batches of floccules and two specimens of pseudoglobulin. These floccules were washed with boiled
J) 100.
F/occu/es____Fsec/c/oy/odi/Z/f?
Serifs??s4/jbvmen ̂ 7 0_
Fig. 2.—Titration curves.
0-9 per cent, saline and shaken up with boiled distilled water before titration with 0-04 N . HC1. The globulins had been dialysed against freshly distilled water, out of contact with air, and were diluted with boiled distilled water ; sodium chloride solution was also added, approximately equal to the amount which could not be pipetted off from the floccules after centrifuging. Quantities of globulin and of floccules containing approximately the same amount of
on September 16, 2018http://rspb.royalsocietypublishing.org/Downloaded from
D i p h t h e r i a Toxin—Antitoxin. 9
nitrogen were used. To obtain the amount of HC1 combined, the free HC1 calculated from the cH, using the activity coefficients of Scatchard (1925), was subtracted from the total HC1 added. The figures below pH 3-5 are unreliable, since the free HC1 becomes of the same order as the combined at this level and small errors in pH measurements and in the activity coefficients used make a large difference in the result.
The pH at which the curves start varies owing to the varying degree to which base was removed in washing the floccules. If the acid-binding powers of the floccules and globulins were the same, the vertical distances between the curves should remain the same throughout their length. Actually the floccule curves are steeper, that is the acid-combining power of the floccules is higher ; but the difference is slight, as is shown by comparison of the curve for serum albumen.
Re-dispersion of Floccules.—It was found that if the floccules obtained by freezing were washed with distilled water and centrifuged down, and the deposit so obtained shaken up with more distilled water, it dispersed completely, giving a solution clear by transmitted light but slightly hazy when viewed against a dark background. Salt solutions were added to samples of this solution to bring about the concentrations shown in Table I. The results show that this “ solution ” is reprecipitated like a negatively charged hydrophobe colloid according to Hardy’s rule. As the pH of the solution is between 7 and 8 the behaviour is what would be expected from a denatured globulin.
Table I.—Molar Concentrations of Salts required to produce opacity and flocculation of Toxin-Antitoxin floccules dispersed in Distilled Water.
Salt. Opacity. Floccules.NaCl .......................................... 0-0075 0-03Na2S04 ...................................... 0-01 0-05CaCl2 ..................................... .*..... 0-0005 0-00125Ce(Ac)3 ...................................... 0-00006 0-0003
I t was noted by Madsen and Schmidt (1926) that high concentrations of .salts delayed or checked the flocculation of toxin and antitoxin, and that the effect of halogen anions was in the order I > Br > Cl. With floccules which had been left at 46° C. for | hour after formation and then centrifuged down, freed from supernatant fluid and tested at once, we obtained the results shown in Table II. The anions appeared to follow the order I > SCN> B r> Ac> NO;} while there was no appreciable difference between the salts of different kations with the same anion.
on September 16, 2018http://rspb.royalsocietypublishing.org/Downloaded from

10 J. R. Marrack and F. C. Smith.
Table II.—Dispersion of Toxin-Antitoxin floecules in concentratedSalt Solutions.
Li. Na. n h 4. K, Rb. Cs.
NO. .............................. _ _ 2N§ 2 N§B r .................................. — — — 4 Nf — —
2 Nf — —
CHjCOO ...................... — 2 N f 4 Nf 4 Nf — —
1 Nf 2 Nf 2 Nf — —
SCN .............................. — 2 N* 2 N* 2 N* — —
1 Nf 1 Nf 1 Nf — —
I .................................. 1 Nf 2 N* 2 N* 2 N* — —
1 Nf 1 Nf 1 Nf 1 Nf 1 NfSalicylate .................. 1 Nf 1 N* — — — —
0-5N f 0-5 Nf — — —
* Dispersed completely, f Dispersed incompletely.X Amount of precipitate reduced.§ Amount of precipitate unaffected.
This effect of strong salt solutions resembles that on serum albumin coagulated by heat, described by Wilheim (1929).
As a result of these investigations we can say that the floecules consist mainly of a protein which has the properties of a denatured pseudoglobulin, and in absence of evidence to the contrary we feel justified in concluding that it actually is pseudoglobulin.
11.—Quantitative.Non-specific proteins may be carried down with the antigen and antibody
in the floecules ; but it is probable that protein, which did not actually combine with the toxin, would not be denatured, and would be removed on washing. If, however, an appreciable amount resisted removal, it would be expected that this amount of absorbed protein wrould vary with the conditions under which flocculation took place, and, particularly, would be increased by the addition of non-specific proteins to the flocculating mixture. We have therefore measured the amount of protein in the floecules found under varying conditions.
Constancy of Results.—Seven pairs of estimations were made on the mixtures of toxin and antitoxin treated in the same way but at different times (Table III). The agreement between these pairs was good, except in the pair XXVIII and XXXII, in which the discrepancy between the two results (14 per cent.) was not excessive for a process of this kind ; some discrepancies may be expected from losses during wTashing.
on September 16, 2018http://rspb.royalsocietypublishing.org/Downloaded from

Diphtheria Toxin—Antitoxin.
Table III.—Duplicate Estimations.
11
Floccules(mgm. N per
ExperimentNo.
unit X 104).
Antitoxin. Process.2 d
+ 3 .pHo woQ 2 W
A .......................... Heat ....... /1 6 -7 \16-0 = > Toxin TX 397 used.III J
VIII \ Pseudo 2737 ....... Heat ....... /1 5 -6 15-7x y \15-6 14-3
XXI t “ Original pseudo Frozen .... J18-7 18-0XXII / globulin” \ 18-0 17-7
XXIII t Heat ....... /1 7 -4 16-3L / 9 9 \ 18-1 —
XXVIII \ XXXII / 2737 ...................... Frozen .... /1 5 -4
\ 17-615017-6
XXXIV \ XLVII / 1664 ...................... Heat ....... /1 5 -0
\ 15-4——
IX \ Pseudo 2737 in ex Heat ....... /1 3 -8 —XIII / cess \ 13-0 13*5
Effect of Heat or Freezing (Table IV).—There was little difference in the amount of precipitate obtained by the two methods when the toxin and antitoxin are nearly balanced. In the unbalanced mixtures more was obtained by the freezing method ; probably because flocculation is slower in unbalanced mixtures and is not complete in the time allowed in the heating process.
Table IV.—Comparison of Heating and Freezing Methods.
ExperimentNo.
VIII \ XVIII /
XII \ XV /
XIII \ XVI
XXIII L
XXI XXII
XIV XXVIIIXXXII
Antitoxin. Process.
Flo (mgm
• unit :
i l8.1m
ccules . N per X 104).
p-;132W
Pseudo 2737 ........... /H ea t .... /Frozen....
15-615-7
15-715-4
Pseudo 2737, toxin /H ea t .... 130- 11*3in excess /Frozen.... 15-0 15-3
Pseudo 2737, anti / Heat .... 13-0 13-5toxin in excess / Frozen.... 141 13-5
f Heat 'J'17-4 16-3“ Original pseudo J neat 18<1
—
globulin ” Proton •/1 8 - 7 18-0
1 A v J / jK s l l . . . . \ 18-0 17-7fHeat .... 16-2 17-4
2737 ...................... F rozen.... | /1 5 -4 15-0%\17-6 17-6
on September 16, 2018http://rspb.royalsocietypublishing.org/Downloaded from

12 J. R. Marrack and F. C. Smith.
Effect of Dilution and Salt Concentration (Table V).—In the process of freezing the toxin-antitoxin mixtures, the toxin, antitoxin and electrolytes are greatly concentrated in the unfrozen liquid, owing to the separation of water crystals (see Freundlich, 1922). Since the amount of precipitate obtained by freezing was approximately the same as that obtained by heating it is probable that the amount is independent of the concentration of the mixture and of the electrolytes in it. This is borne out by experiments LI and XLVIII. The chloride concentration in the toxin was only 0*019 N and the conductivity equal to that of a 0-033 N sodium chloride solution, so that the electrolyte concentration was at the lower level of that found necessary to bring about reprecipitation of the dispersed floccules (Table I), but an increase of the electrolyte concentration by 0 • 2 N did not affect the amount of precipitate.
Table Y.—Effect of Dilution, Salt Concentration and Reaction.
ExperimentNo.
XXIIIL
LI
XXXIVXLVII
XLVIII
XXVIIIXXXII
XXXIIIXX
Floccules (mgm. N per unit X 104).
Antitoxin. Process.
Spec
tro-
met
ric.
Kje
ldah
l.
“ Original pseudo- globulin ” Heat .......
r i 7 - 4 1 18-1 C18 • 1
16-3
1664 ........................... Heat .......f l5 -0 1 5 0
\ l 5 - 4 —
2737 ........................... Frozen ....f 15-4 J 17-6 "j 17-4l -
15-017-61 7 117-7
•
Undiluted.Undiluted.Toxin diluted with an equal
volume of broth.\ Approximately 0*033 nor- / mal salt.2*75 c.c. of 2N . NaCl solu
tion added to 25 c.c. of toxin.
pH of mixture 8 • 3. pH of mixture 8*3. pH of mixture 7*07. pH of mixture 6*5; nitrogen
estimated by titration method.
Effect of pH (Table Y).—Changes of pH from 6*4 to 8*4 make no difference to the titration of toxin by flocculation (Bayne-Jones, 1928). Experiments XXVIII, XXXII, XXXIII, XX show that variations within this range made no difference to the amount of precipitate obtained.
Addition of Non-specific Protein (Table YI).—It is generally supposed that the amount of precipitate in an immunity reaction is increased by the addition of non-specific proteins. However, we have found no difference in the amount of precipitate per unit antitoxin when pseudoglobulin prepared from serum
on September 16, 2018http://rspb.royalsocietypublishing.org/Downloaded from

Diphtheria Toxin—Antitoxin. 13
was used instead of the original serum; nor on the other hand when normal horse serum, or pseudoglobulin prepared from normal horse serum, was added at the time of mixing the toxin and antitoxin, although the total protein in the mixture was thereby increased to six times and the pseudoglobulin to four times that present when the antitoxic pseudoglobulin was used alone. Nor was there any appreciable increase of the protein in the precipitate when fresh guinea-pig serum was added at the time of mixing, although absorption of complement was shown to have taken place.
Experiment X X X I . Absorption of Complement.—15 c.c. of toxin 422 were mixed with 1-2 c.c. of fresh guinea-pig serum. Decreasing quantities of this mixture were added to 0-5 c.c. of sensitised 5 per cent, sheep corpuscles suspension, and the volume made up to 2 c.c. with 0 • 9 per cent, saline. Haemolysis was complete in 20 minutes in the tube containing 0-3 c.c. of the mixture, but incomplete in the tube containing 0*2 c.c. ; so that haemolysis was complete with the complement diluted 1 /83 ; without the toxin haemolysis occurred with the complement diluted 1 /240.
To 13*5 c.c. of the mixture of toxin and guinfea-pig serum were added 0-3 c.c. of antitoxin 2737 to form a balanced mixture ; this was frozen solid and kept in the ice chest overnight. Next day the floccules were separated and treated as usual, and the supernatant fluid tested for complement. Decreasing quantities from 1*5 c.c. were mixed with sensitised corpuscles as before ; no haemolysis occurred in any of the tubes in 1 hour.
Table VI.—Effect of Non-specific Proteins.
ExperimentNo. Antitoxin. Process.
Floccules (mgm. N per unit x 104).
Spec
tro-
met
ric.
Kje
ldah
l.
XIV 2737 .................. \ Heat /1 6 -2 17-4VIII Pseudo 2737 ......./ 1 15-6 15-7
XXVIII 2737 alone ........... Frozen .... 15-4 1 5 -0 \ Antitoxin contained 0*113XXXII 99 .............. 99 ......... 17-6 1 7 -6 / mgm. protein per unit.XVIII Pseudo 2737 alone 99 ......... 15-7 15-7 0*090 mgm. protein per unitXXX 2737 + normal 99 ......... 16-3 16-3 0 • 22 mgm. of normal pseudo
pseudoglobulin globulin added per unit.XXXI 2737 + guinea pig 9 9 ......... — 16-5 0*0033 c.c. of guinea-pig
serum serum added per unit.XXIII \ “ Original pseudo LXAn f / 17-4 16-3 Antitoxin contained 0*109
L J globulin ” alone near ....... \1 8 -1 — mgm. protein per unit.XXIV “ Original pseudo - n 17-9 18-3 0 • 23 mgm. of normal pseudo
globulin” + nor globulin added per unit.mal pseudoglobulin
XXV “ Original pseudo 9 9 ......... 17-1 16-8 0*0083 c.c. of normal serumglobulin ” -f- nor = 0*58 mgm. of protein,mal serum added per unit.
XVII 2737 ...................... Frozen .... — 19-0 Purified toxin used.
on September 16, 2018http://rspb.royalsocietypublishing.org/Downloaded from

14 J. R. Mar-rack and F. C. Smith.
Purified Toxin.— In experiment XVII toxin containing 10 X 10-4 mgm. N per L f,prepared from toxin 422 by precipitation at pH 5-2 and solution in alkali, was used ; this preparation should be free from bacterial proteins other than toxin (Locke and Main, 1928) ; the solution contained 350 Lf in 1 c.c. The floccules obtained were redissolved with acid, but did not form a sufficiently clear solution for spectrophotometry to be possible. From this experiment it appears that the non-toxic constituents of crude toxin do not add to the floccule nitrogen, when an antitoxic serum of high titre is used.
This experiment gave a striking example of a non-specific substance which is not absorbed by the floccules. In attempts to purify toxin it is extremely difficult to remove a red pigment which is precipitated with i t ; the purified toxin used in this experiment was bright pink, but the floccules obtained from it were white and formed a colourless solution. This pigment is also present when crude toxin is used, but the way in which the toxin is freed from it in the process of flocculation is then less* obvious.
These quantitative experiments indicate that the amount of protein per unit of antitoxin in the floccules obtained from balanced mixtures is constant for a given serum or the pseudoglobulin prepared from that serum.
Ratio of Antitoxin to Toxin (Table VII).—We have so far considered only the amount of precipitate obtained from balanced mixtures of toxin and antitoxin. Table VII shows that when the ratio of antitoxin to toxin is increased the amount of precipitate per L/ is increased while the amount of precipitate per unit of antitoxin is maximum when the ratio is 1*0 but remains near this level from ratio 0-75 to 1*5. Flocculation could not be obtained when the ratio was below 0 • 6 or above 1*6. These results are very similar to those found
Table VII.—Effect of Ratio Antitoxin/Toxin.
ExperimentNo.
Floccules (mgm. N per unit X 104).
Floccules (mgm. N per
L, X 104).
Antitoxin. Process.
Spec
tro-
met
ric.
Kje
ldah
l.
Spec
tro-
met
ric.
Kje
ldah
l.
•
XXXVII 2737 ...................... Frozen .... 1-87 1*77 M 2 1-06 Ratio = 0-60.XV Pseudo 2737 ........... 15*0 15-3 11-3 11-5 Ratio = 0-75.
XVIII 2737 ...................... 15-7 15-4 15-7 15-4 Ratio = 1-00. BalancedXVIII 2737 ...................... 14*4 14-0 18-7 18-2 Ratio = 1-30.
XVI Pseudo 2737 ........... 9 9 ................ 14*1 13-5 21-1 20-3 Ratio = 1-50.
on September 16, 2018http://rspb.royalsocietypublishing.org/Downloaded from

Diphtheria Toxin—Antitoxin. 15
with a precipitin reaction by Dean and Webb (1926), although the range over which they found flocculation was much wider. The spectroscopic results agree with the nitrogen estimations as well in the unbalanced as in the balanced floccules.
Amount of Precipitate with Different Antitoxins (Table VIII).—The first five antitoxins were sera of high titre or pseudoglobulins prepared from these ; the agreement is very close except for X X III, and in this case the difference is hardly significant when the possible differences between amounts of precipitate found with the same toxin, and the possible errors in standardising the antitoxin, are taken into account. Hartley (1925, 1926) with similar antitoxins obtained from 11-4 X 10“4 to 24-9 X 10⁻⁴ mgm. of floccule nitrogen per u n it; it is possible that, as his mixtures stood much longer than ours, he may have had some ammonia nitrogen in his floccules which would account for the higher figures ; apart from this it is possible that the titres of the sera employed by Hartley were given in in vivo units and are therefore not strictly comparable with ours ; if this was the case the agreement between his results and ours ^s as good as could be expected.
Table V III.—Different Antitoxic Sera.
ExperimentNo.
Floccules (mgm. N per unit X 104).
Floccules (mgm. N per
Lf X 104).
Antitoxin. Process.
Spec
tro-
met
ric.
Kje
ldah
l.
Spec
tro-
met
ric.
Kje
ldah
l.
I l lXIV
A ..................... •....2737 ......................
Heat ....... 16-016-2
15-217*4
16-016-2
15-217-4
XXXV 2737,150 units with pseudoglobulin I, 450 units
)> ....... 15-7 15*7 15-7 15-7
XXXVI
XXXIV
2737, 150 units with pseudoglobulin II, 450 units
1664 ......................
9 y ....... 15-5
15-0
15-5
150
15-5
150
15-5
15-0XXIII “ Original pseudo
globulin ”99 ................ 17-4 17-4 17-4 17-4 *
XLI 2885, 0-75 c.c. to 600 L/
Frozen .... 17-0 17-0 17-0 17-0'tMgm. N per unit doubt
XLII 2885, 1 • 12 c.c. to 600 Lf
99 -----— — 17-6 18-3 J ful.
XXXIX 2885,2-7 c.c. to 600 L/
99 • • • •— — 32 32
XLIII 2931 ...................... Heat ....... _ 31-0 31-5XLII 2902 ...................... _ _ 25
XXXVIII 1876 ...................... 99 • • • •— — — 50-5
on September 16, 2018http://rspb.royalsocietypublishing.org/Downloaded from
16 J. II. Marrack and F. C. Smith.
Serum 2885 was peculiar; not only did it give two zones, but also in the upper zone we were unable to select the indicator mixture, as several tubes flocculated simultaneously while others between remained clear, as though there were several sub-zones in this upper zone. We therefore measured the amount of floccules with quantities of antitoxin corresponding to 533 and to 800 units per 1 c.c., values calculated from the extremes of this doubtful zone. We cannot calculate the floccule N per unit as we are uncertain of the titre of the serum ; the floccule nitrogen per is but little higher than that found with the first four sera. This serum flocculated very slowly, taking 4 hours at 46° C. with toxin 422, while the previous sera flocculated in about 25 minutes. Glenny and Wallace (1925) were of the opinion that slowly flocculating sera give larger precipitates ; this was not borne out in this case.
In the lower zone of serum 2885, which if it were a toxin-antitoxin flocculation would correspond to 220 units per 1 c.c. of serum, the floccules contained 32 X 10-4 mgm. N per Lf of toxin added. This was a “ non-specific ” zone, that is a zone in which a reaction is taking place between a bacterial protein other than toxin and its antibody ; the antigen and antibody wer§ not those with which we are dealing and the results are of no significance.
Serum 2931, which had a very low titre, also gave high floccule nitrogen. In this case the flocculation was specific ; when the serum was blended with another of high titre knowp to be specific, the titre of the mixture was found to be equal to the sum of the titres of the components, showing that serum 2931 and the high titre serum reacted with the same antigen. However, it is possible that antibodies to bacterial proteins other than toxin were present in this and in other sera in small quantities. With the high titre sera such antibodies would have no effect on the precipitate, as their amount wrould be too small in relation to the antitoxin; but when the antitoxin titre was low, as with serum 2931, they might be present in sufficient concentration to increase the total precipitate ; this also applies to serum 2962.
The value of experiment XXXVIII is doubtful as the serum was contaminated and smelt decomposed, but we got the usual amount of floccule with another serum 1664 when it was contaminated ; the precipitate in experiment XXXVIII, however, is probably “ non-specific.’’
I t is possible that the simultaneous precipitation with bacterial proteins other than toxin is not the correct explanation of the larger amount of floccule nitrogen per unit antitoxin and per L/ with sera 2931 and 2901; for Dean and Webb (1926) found a larger amount of precipitate per unit of antigen from antisera of low titre than from those of high titre. But here also there may be
on September 16, 2018http://rspb.royalsocietypublishing.org/Downloaded from

17
two substances precipitating, since they used foreign serum as their antigen and it is possible that the antisera of low titre precipitated both albumin and globulin, while those of high titre precipitated only globulin.
Our previous experiments (Table VI) dispose of the possibility that the larger amount of floccule nitrogen is due to the larger amount of non-specific serum protein present.
Discussion.
We conclude from the investigations in the first part of this paper that the floccules consist almost entirely of denatured pseudoglobulin. I t is probable that the toxin contributes only a small fraction of the floccules. The work of Welsh and Chapman (1906) indicated that the greater part of the precipitate in an immunity reaction came from the antiserum. Wu, Chang, and Li (1928), using haemoglobin as antigen, found that the antigen formed only one-tenth of the precipitate ; and Dean and Webb (1926), using foreign serum as antigen, found very similar proportions when the conditions were such that all the antigen was precipitated. Diffusion experiments indicate that toxin molecules are only one-tenth the size of antitoxin molecules (Arrhenius, 1908); according to Locke and Main (1928) toxin can be prepared containing only 8 X 10~4 mgm. N per L/5 and there is no reason to suppose that such a preparation, contaminated as it certainly is with pigment, is pure. I t is quite conceivable that the very active antigen, diphtheria toxin, differs from such poor antigens as haemoglobin and serum proteins in having a large part of its relatively small molecule made up of antibody binding groups, so that a much smaller amount is required to precipitate an antibody molecule and that the antigen forms a much smaller proportion of the precipitate. The floccules therefore probably consist mainly of pseudoglobulin derived from the antiserum.
This pseudoglobulin might be made up mainly of non-specific proteins carried down with the specific substances. However we have found in the second part of this paper that the pseudoglobulin flocculated per unit of antitoxin of a given serum, when mixed with an equivalent amount of toxin, is independent of the conditions under which flocculation took place, and that there was no evidence that non-specific proteins were carried down with the floccules. We conclude that this constant amount of pseudoglobulin is related to the toxin-binding properties of the serum in a special way. Although it is possible that antitoxin may exist free from protein, it seems more reasonable to suppose that this pseudoglobulin is the actual antitoxin, and differs from normal pseudoglobulin in the structure of its molecule. That such differences of structure, without differences in the ordinary physical and chemical properties,
VOL. c v i . — B.
Diphtheria Toxin— A ntitoxins.
c
on September 16, 2018http://rspb.royalsocietypublishing.org/Downloaded from

18 J. R. Marrack and F. C. Smith.
can occur, is shown by the immunological reactions of the pseudoglobulins of difference species.
If this supposition is correct we can deduce from our results a standard of purity of antitoxin, viz., about 15 X 10-4 mgm. N per unit, which is of about the same order as that of the preparations of Ramon (1923) and Locke and Main (1926).
If we do not consider that the larger amounts of floccule N per unit found with the sera of low titre are due to simultaneous precipitation from a bacterial protein-precipitin reaction, we must suppose that the number of toxin-binding groups per antitoxic globulin molecule may vary in different sera, and possibly in the same serum, so that our figure is only an average. In the process of immunisation an increase of serum globulin occurs, much greater than the antibody formed will account for, supposing the excess were antitoxin. I t is possible that globulins with varying numbers of toxin-binding groups are formed, and that animals which immunise badly differ from those that form potent sera, not in producing fewer antitoxic globulin molecules, but in forming new molecules with few or no binding groups; not, that is, in the quantity but in the quality of the antitoxic globulin they produce.
Since the same results are obtained when toxin-antitoxin mixtures are frozen as when they are heated to 46° C. we cannot consider that the combination of toxin and antitoxin depends on the state of aggregation of the antitoxic globulin. Unpublished experiments of Marrack and Hewitt on osmotic pressures show that globulins are more aggregated at lower temperatures, this increased aggregation accounting for the increased viscosity with falling temperature found by Chick (1914).
Summary.
1. The floccules formed by diphtheria toxin and antitoxin closely resemble serum pseudoglobulin.
2. The ultra-violet absorption curves of the floccules and pseudoglobulin are identical.
3. The amount of precipitate obtained from a balanced mixture of a given toxin and antitoxin is to a large extent independent of the conditions under which flocculation takes place, particularly of the amount of non-specific protein present.
4. Lipoid material forms a very small fraction of the floccules.5. We consider that the floccules consist mainly of antitoxin, and infer that
on September 16, 2018http://rspb.royalsocietypublishing.org/Downloaded from
antitoxin is not merely carried down in the pseudoglobulin fraction but actually is pseudoglobulin.
We wish to express our thanks to Dr. O’Brien for the generous supply of material, without which this work would not have been possible, and to members of the Staff of the Wellcome Physiological Research Laboratories for their advice.
We also take this opportunity to thank Prof. H. E. Roaf for the provision of accommodation for the spectrophotometer in the Physiological Department of the London Hospital Medical School.
One of us (F.C.S.) was working under the auspices of the Freedom Research Fund.
Diphtheria Toxin—Antitoxins. 19
REFERENCES.
Arrhenius (1908). “ Immunochemistry ” (MacMillan & Co.), p. 25.Bayne-Jones (1928). “ Newer Knowledge of Bacteriology and Immunity.” (‘ University
of Chicago Press ’), p. 759.Bloor, Pelkan and Allen (1922). ‘ J. Biol. Chem.,’ vol. 52, p. 191.Chick (1914). ‘ Biochem. Jl.,’ vol. 8, p. 261.Dean and Webb (1926). ‘ Jl. of Path, and Bact.’Flossner and Kutscher (1924). ‘ Munch. Med. Woch.,’ vol. 71, p. 576.Freundlich (1922). “ Colloid and Capillary Chemistry” (Methuen & Co.), p. 475. Glenny and Wallace (1925). ‘ Jl. of Path, and Bact.,’ vol. 28, p. 317.Greenberg (1929). ‘ Jl. Biol. Chem.,’ vol. 82, p. 545.von Halban and Eisenbrand (1927). ‘ Roy. Soc. Proc.,’ A, vol. 116, p. 153.Hartley (1925, 1). * Brit. Jl. Exp. Path.,’ vol. 6, p. 112.Hartley (1925, 2). ‘ Brit. Jl. Exp. Path.,’ vol. 6, p. 189.Hartley (1926). ‘ Brit. Jl. Exp. Path.,’ vol. 7, p. 55.Kerridge (1925). ‘ Biochem. Jl.,’ vol. 19, p. 611.Locke and Main (1926). ‘ Jl. Inf. Dis.,’ vol. 39, p. 482.Locke and Main (1928). ‘ Jl. Inf. Dis.,’ vol. 43, p. 41.Madsen and Schmidt (1926). ‘ Ann. Inst. Pasteur,’ vol. 40, p. 300.Ramon (1923). ‘ Compt. Rend. Soc. Biol.,’ vol. 88, p. 167.Scatchard (1925). ‘ Jl. Am. Chem. Soc.,’ vol. 47, p. 6.Smith (1929). ‘ Roy. Soc. Proc.,’ B, vol. 104, p. 198.Svedberg and Sjogren (1928). ‘ Jl. Am. Chem. Soc.,’ vol. 50, p. 3318.Welsh and Chapman (1906). ‘ Roy. Soc. Proc.,’ B, vol. 80, p. 161.Wilheim (1929). ‘ Koll. Zeit.,’ vol. 48, p. 217.Wu, Chang and Li (1928). ‘ Proc. Soc. Exp. Biol. & Med.,’ vol. 25, p. 853.
on September 16, 2018http://rspb.royalsocietypublishing.org/Downloaded from