the root causes of construction project...
TRANSCRIPT

Scientia Iranica A (2018) 25(1), 93{108
Sharif University of TechnologyScientia Iranica
Transactions A: Civil Engineeringhttp://scientiairanica.sharif.edu
The root causes of construction project failure
V. Shahhosseinia;�, M.R. Afshara, and O. Amirib
a. Department of Civil and Environmental Engineering, Amirkabir University of Technology, Tehran, Iran.b. Department of Civil Engineering, Islamic Azad University, Science and Research Branch, Tehran, Iran.
Received 21 October 2015; received in revised form 17 May 2016; accepted 26 September 2016
KEYWORDSConstruction projectfailure;Decision making;Fault tree analysis;Interval type-2 fuzzysets;Uncertainty.
Abstract. Construction projects play an important role in the economic development ofevery country. Nevertheless, review of projects' documents indicates that, in most cases,the projects are not �nished on assigned budget as scheduled, such that they sometimesloss their economic justi�cation and simply fail. Consequently, devising suitable solutionsis essential to the prevention of such failures. This is impossible without identifying theforemost causes of failure. In this study, �rst, all factors of failure are identi�ed usingFault Tree Analysis (FTA). FTA as a diagnostic tool allows us to e�ciently isolate rootcauses of failure. To rank these factors, dedicated specialists are requested to assess therisk of each cause using linguistic terms; thereby, relevant calculations are carried outusing the Linguistic Weighted Average (LWA). Undeniably, considering the complexity ofconstruction projects and incomplete expert knowledge, judgments must not be made usingcrisp value conception. Hence, fuzzy theory is utilized to achieve more accurate results.Results indicate that the majority of problems in projects stem from �nancial concernsand shortcomings of bidding process. In the last section, an actual case study is used tovalidate our results.© 2018 Sharif University of Technology. All rights reserved.
1. Introduction
Construction projects play a signi�cant role in theeconomic development of every nation. In most coun-tries, construction projects absorb large sums of thecapital asset investment from the state budget, andthe construction industry in Iran is no exception [1].According to Iran o�cial statistics published in 2015,a total sum of 597 thousand billion Rials was investedexclusively in construction projects [2]. Though, re-grettably, the majority of these projects failed to �nish,and many others incurred cost and time overruns.Furthermore, the Research Center of the parliament of
*. Corresponding author. Tel.: +98 21 64543058;Fax: +98 21 66414213E-mail addresses: [email protected] (V.Shahhosseini); [email protected] (M.R. Afshar);[email protected] (O. Amiri)
doi: 10.24200/sci.2017.4178
the Islamic Republic of Iran reported that no bene�tsgained from the current un�nished projects; this hasnot only damaged the national economy annually, butit has also cost the state over 200 thousand billionRials (i.e., more than one-third of the country's annualdevelopment budget) [2]. Therefore, considering suchoutcomes, it is obvious that identifying, and subse-quently, circumventing project failure in the construc-tion industry is of utmost importance for the Iranianeconomy.
We should note that in this study, project failureis de�ned as follows:
1. Time and cost overrun such that the project losseseconomic justi�cation, or;
2. The project is not completed.
In order to solve any special problem, the �rst stepis to identify the main factors leading to that problem.This is only possible if e�ective tools are in place. The
94 V. Shahhosseini et al./Scientia Iranica, Transactions A: Civil Engineering 25 (2018) 93{108
aim of this study is to emphasize the main causes ofconstruction project failure using two di�erent tools:1) FTA and 2) LWA.
2. Literature review
In the literature, many researchers have recognized themain causes of project failure by applying di�erentapproaches. We address some of the recently publishedones.
Han et al. [3] assessed challenges, obstacles,and performances of the Korea Train eXpress (KTX)project. First, critical sections in the railway routethat incurred considerable delays to project completionwere recognized. After that, the causes of these criticalsections were examined carefully. Analysis revealed �vemajor delay causes for the KTX project: lack of owner'sabilities and strategies to manage hi-tech-orientedmega projects; frequent changes of routes caused by thestruggles between public agencies and growing publicopposition derived from environmental concerns; anunsuitable project delivery system; lack of suitablescheduling tools customized for a linear mega project;redesigning and changing orders of the main structuresand tunnels for high-speed railways, which is essen-tially unlike traditional railway structures. Abdul-Rahman et al. [4] addressed the matters pertaining to�nancial-related delays in construction projects. Theyrecognized the core causes and studied the appropriatealleviation actions required to remedy �nancial-relatedproject delays. Primary data were composed by meansof an initial interview, questionnaire survey, and in-depth structured interviews. A total of 110 responseswere acquired from a group of clients, contractors, con-sultants, and bankers. Results exposed poor cash owmanagement as the most important factor that leads toa project's delay followed by late payments, inadequate�nancial resources, and volatility in �nancial markets.Yang and Wei [5] found 35 delay factors. Fifteen factorswere related to the planning phase, and 20 others wererelated to the design phase. Using the importance-frequency matrix, they concluded that the change inowner's project requirements is the predominant causeof project delay. Soliman [6] recognized 29 causes ofdelay in construction projects in Kuwait, and thencharacterized them in six groups. The causes weregraded based on the Relative Importance Index (RII).He demonstrated that �nancial and design problemsare the main factors behind delay. Hasseb et al. [7]scrutinized the dynamics behind delay of constructionprojects in Pakistan. First, they identi�ed 37 delayfactors. To rank these factors, they distributed 200questionnaires among construction �rms and inquiredabout the importance of each factor. Lastly, the factorswere weighed by critical assessment criteria. Theresults indicate that client factors are the key sources
of delay. Doli et al. [8] explored the delay causes ofconstruction projects in India. Using a selected setof 45 attributes, this study identi�ed the key factorsa�ecting delay in the Indian construction industry, andthen established the relationship between the criticalattributes to develop prediction models for measuringthe impacts of these factors on delay. A questionnaireand personal interviews formed the foundation of thisresearch. Factor analysis and regression modellingwere employed to study the implications of the delayfactors. From the factor analysis, the major criticalfactors of construction delay were identi�ed as (1)lack of commitment; (2) ine�cient site management;(3) poor site coordination; (4) improper planning;(5) lack of clarity in project scope; (6) lack of com-munication; and (7) substandard contracts. Theregression model speci�ed that owner's slow decision-making process, poor labor productivity, architects'reluctance for change and rework due to mistakes inconstruction are the reasons which signi�cantly a�ectthe overall delay of the project. Ezeldin and Abdel-Ghany [9] found the main reasons of delay throughinterview with stakeholders; thereafter, for each reason,they determined one party responsible. The latterwas conducted using a modi�ed questionnaire. Basedon their results, the leading �ve categories led to thecauses of delay: 1) construction; 2) managerial; 3)political; 4) �nancial; and 5) technical factors. Rahsidet al. [10] identi�ed the causes of delay using struc-tured questionnaires distributed among construction�rms. To �nd the main causes, they used severalstatistical instruments including reliability test, factoranalysis, and regression. Their conclusions indicatethat the existing problems correspond to contractor,client, consultant, material, and equipment factors.Marzouk and El-Rasas [11] analyzed causes of delayin Egyptian construction projects. They o�ered alist of construction delay causes retrieved from theliterature. The feedback of construction experts wasacquired through interviews. Next, a questionnairesurvey was prepared and distributed between thirty-three construction experts who represent owners, con-sultants, and contractor organizations. FrequencyIndex, Severity Index, and Importance Index werecalculated, and according to the highest values, the topten causes of delay in construction projects in Egyptwere determined. Similarly, a case study was analyzedand compared to the most important delay causesin their research. Statistical analysis was conductedusing analysis of variance ANOVA to test delay causesobtained from the survey. Ruqaishi and Bashir [12]explored the factors behind failure in the oil and gasindustry in Oman. They circulated 59 questionnairesamong project managers to �nd the major causes ofproject delay. They concluded that poor interactionwith vendors is the central cause of delay.

V. Shahhosseini et al./Scientia Iranica, Transactions A: Civil Engineering 25 (2018) 93{108 95
Remon and Abdel-Hakam [13] studied the causesof delay in road construction projects in Egypt. Theydistributed 500 questionnaires among constructioncompanies. They employed RII in order to rankthe delay factors, and the top twenty factors wererecognized. A real case study was used to con�rm theresults.
As can be observed, all the mentioned studiesinvestigated the causes of delay through crisp valueconceptions. However, due to the complexity of con-struction projects and de�ciencies of expert knowledge,using crisp values cannot be correct. In this condi-tion, fuzzy theory aids us to acquire more accurateresults. In this course, Gunduz et al. [14] exploredthe key dynamics of failure using the Fuzzy Type-1(FT1) approach. They initially found 83 delay factorsand classi�ed them into nine groups through a �eldstudy. Then, the experts were requested to providean answer for the importance of each factor. Lastly,the related calculation was conducted by Fuzzy Type-1 Sets (FT1Ss).
Yet, in group decision making, due to the lack ofagreement on linguistic terms among experts, FuzzyType-2 (FT2) performs better than its predecessor.Thus, in this paper, we employed the FT2 approach.
3. Methodology
In order to ascertain the key causes of project failure,the proposed framework is presented in Figure 1 in-cluding three main steps:
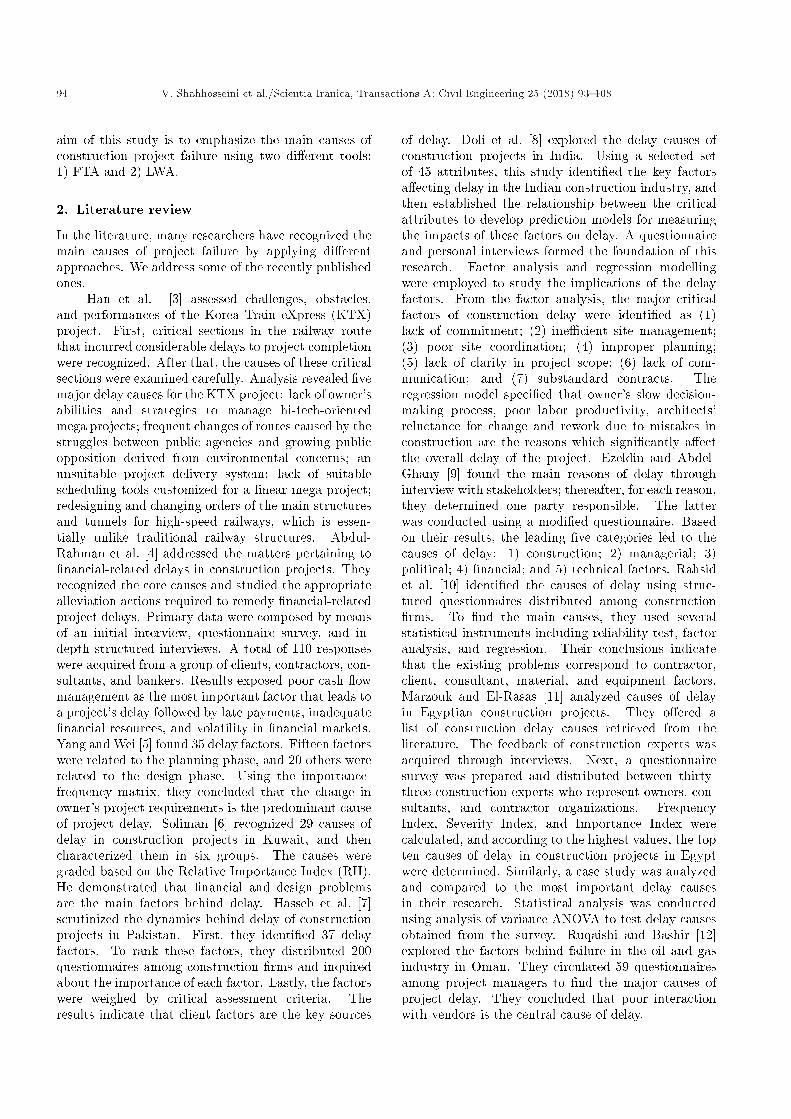
- Step 1. Identi�cation of basic events. In thispaper, FTA is proposed to identify the root causesof failure. This analysis is carried out via interviewwith experts and reviews of literature. FTA as adiagnostic tool enables us to �nd the main causes ofdi�erent problems more e�ciently using hierarchicalanalysis. Additionally, understanding a problem iseasy since the results of FTA are demonstrated ingraphical form within a fault tree diagram. Thefault tree diagram is a graphical model of variousparallel and sequential arrangements of faults that
can result in incidence of undesired events. Thefaults may comprise human errors, software errors,or any other errors, which can lead to undesiredevents [15]. In fault tree diagram, the undesiredevent is called top event, and the immediate causesof top events are called gate events. The analysis ofa fault tree diagram should be continued to reachprimary events, namely basic events. The basicevents are not further developed, and by using logicalgates (AND or OR gates), the basic events areconnected to the top event [16]. When the \ANDgate" is utilized, the upper event cannot follow unlessall of its lower events occur. The \OR gate" speci�esthat the incidence of any of lower events is su�cientfor the upper event to occur. The gates and theirrepresentative shapes are presented in Table 1 [16].
Using the existing literature and interview withexperts, the fault tree diagram for constructionprojects is drawn (see Figure 2). As can be seen,the factors of failure have been categorized in fourgroups:
(a) Contractor-related factors;(b) Client-related factors;(c) Consultant-related factors;(d) External factors.
Then, in each group, three phases of a projecthave been independently surveyed through FTA.
In Figure 2, contractor, client, consultant,and external factors are gate events, and regardingthe gate events, 75 basic events have been found.These rudimentary events are the core factors behindconstruction project failure.
- Step 2. Evaluation of basic events. In this step,the experts were requested to assess the risk of eachbasic event through linguistic terms de�ned in nine
Table 1. The related shapes for \AND gate" and \ORgate" in fault tree diagram.
AND gate
OR gate
Figure 1. The proposed framework for �nding the key causes of project failure.
96 V. Shahhosseini et al./Scientia Iranica, Transactions A: Civil Engineering 25 (2018) 93{108
Figure 2. Fault tree diagram for construction project failure.
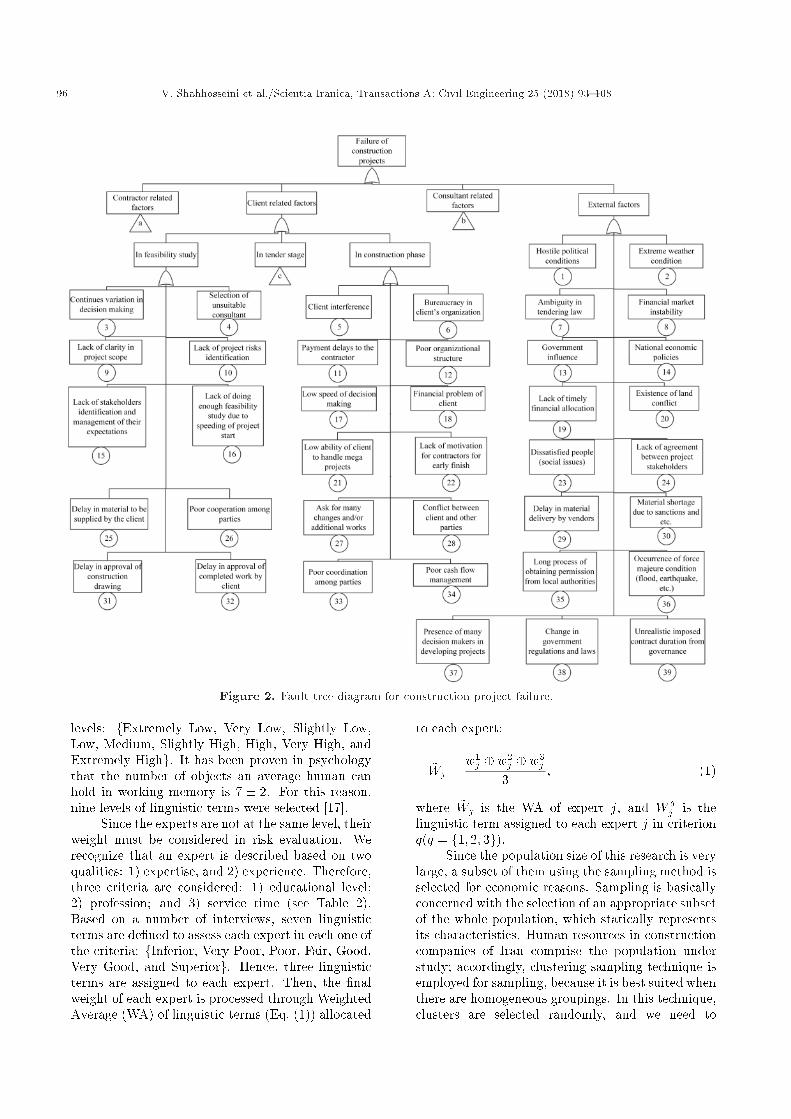
levels: fExtremely Low, Very Low, Slightly Low,Low, Medium, Slightly High, High, Very High, andExtremely Highg. It has been proven in psychologythat the number of objects an average human canhold in working memory is 7 � 2. For this reason,nine levels of linguistic terms were selected [17].
Since the experts are not at the same level, theirweight must be considered in risk evaluation. Werecognize that an expert is described based on twoqualities: 1) expertise, and 2) experience. Therefore,three criteria are considered: 1) educational level;2) profession; and 3) service time (see Table 2).Based on a number of interviews, seven linguisticterms are de�ned to assess each expert in each one ofthe criteria: fInferior, Very Poor, Poor, Fair, Good,Very Good, and Superiorg. Hence, three linguisticterms are assigned to each expert. Then, the �nalweight of each expert is processed through WeightedAverage (WA) of linguistic terms (Eq. (1)) allocated
to each expert:
~Wj =w1j � w2
j � w3j
3; (1)
where ~Wj is the WA of expert j, and W qj is the
linguistic term assigned to each expert j in criterionq(q = f1; 2; 3g).
Since the population size of this research is verylarge, a subset of them using the sampling method isselected for economic reasons. Sampling is basicallyconcerned with the selection of an appropriate subsetof the whole population, which statically representsits characteristics. Human resources in constructioncompanies of Iran comprise the population understudy; accordingly, clustering sampling technique isemployed for sampling, because it is best suited whenthere are homogeneous groupings. In this technique,clusters are selected randomly, and we need to

V. Shahhosseini et al./Scientia Iranica, Transactions A: Civil Engineering 25 (2018) 93{108 97
Figure 2. Fault tree diagram for construction project failure (continued).
98 V. Shahhosseini et al./Scientia Iranica, Transactions A: Civil Engineering 25 (2018) 93{108
Table 2. Linguistic terms for di�erent experts.
Constitution Classi�cation Linguistic terms
Educational level
PhD Professor SuperiorAssistant Professor Very Good
Associated Professor GoodMSc FairBSc Poor
Junior college level Very PoorSchool level Inferior
Profession
Project Manager With more than ten times experience SuperiorWith between �ve times and nine times experience Very GoodWith between two times and four times experience Good
With one time experience FairEngineer Poor
Technician Very PoorLaborer Inferior
Service time
> 30 years Superior25-30 Very Good20-25 Good15-20 Fair10-15 Poor5-10 Very Poor< 5 Inferior
apply it for selecting construction companies. Then,experts within responsive companies are surveyed.In addition to the ease of implementation, this tech-nique is more economical. The correct combinationand estimation of sample size have a pivotal role inminimizing sampling bias. There are di�erent waysto calculate appropriate sample size. These includeusing a census for small populations, imitating asample size of similar studies, using published tables,and applying formulas to calculate a sample size.In this study, the sample size is estimated by theformula developed by Cochran [18] (Eq. (2)):
n =NZ2
�=2P (1� P )"2(N � 1) + Z2
�=2P (1� P ); (2)
where n is the sample size, N is the size of popula-tion, P is the estimated proportion of an attributethat is present in the population, Z is a standardnormal quantile, � is the con�dence level, and �nally" is the level of precision.
The �rst stage of clustering involves choosinga subset of the �rst-rate construction companies ac-cording to strategic planning and monitoring sectionof government. Size of the population (N) in thisstage is 235. The companies holding the �rst rank inthe �elds of construction, roads, and transportationand water transmission are desired (23 companies).
As a result, the desired proportion of attribute (P )equals 23/235. The con�dence level is considered95%. The level of precision is equal to 10%. Thevalue of Z according to 95% con�dence level isequal to 1.96. Finally, the sample size (n) basedon Cochran formula is estimated to be 8. It is worthmentioning that the result indicates the minimumrequired number of responses. To achieve at least8 responses, more than 20 inquiries were made, butonly 10 inquiries were answered, which is the samplesize of this study.
- Step 3. Combination of experts' judgments. Thejudgments made by di�erent experts need to becombined into a single judgement in order to obtainthe risk of each basic event. LWA is used for thispurpose (Eq. (3)):
~Ri =
10Pj=1
~Wj � ~Xij
10Pj=1
~Wj
; (3)
in which ~Ri is the overall risk of basic event i, ~Wj
is the WA of expert j, and ~Xij is the response ofexpert j to the risk of basic event i.
Nonetheless, we cannot use Eqs. (1) and (3)until the inputs are the linguistic terms. Therefore,

V. Shahhosseini et al./Scientia Iranica, Transactions A: Civil Engineering 25 (2018) 93{108 99
Figure 3. Fuzzy engine.
the fuzzy engine is utilized for this purpose. As canbe seen in Figure 3, the linguistic terms are initiallyconverted to fuzzy sets. Then, the associatedcalculations are carried out; lastly, the output fuzzysets are once again transformed into linguistic terms.Using these outputs, we can decide reliability.
4. Interval type-2 fuzzy sets
Considering the complexity of construction projectsand extensive interaction of events, using precise nu-merical evaluations is inconsistent [19] and evaluationsare conducted based on linguistic terms, although anatural language is imprecise, uncertain, and partiallytrue [20]. To evaluate basic events, it is crucialto convert linguistic terms into mathematical con-cepts. T2FSs are selected for this purpose. Withthis selection, the ambiguity inherent in a naturallanguage is minimized [21]. In the literature, FT1 iscommonly suggested to answer these problems. Yet,linguistic words of experts are very unclear, and thus,it is very hard to handle and estimate them usingT1FSs, because type 1 representation is a reductionistapproach and its Membership Functions (MFs) aretotally crisp rather than fuzzy [21]. Furthermore,Mendel [22] established that employing T1FSs to modellinguistic words is scienti�cally inappropriate. T2FSshave elucidated this problem by o�ering us moredegrees of freedom for handling uncertainties. T2FSsare `fuzzy fuzzy' sets (i.e., they are T1FSs whose gradesof membership are also T1FSs). As the computationalcomplexity of general T2FSs is severe, the IntervalType-2 Fuzzy Set (IT2FS) is used, which is a specialcase of generalized T2F. In [17], Wu and Mendel o�ereda technique using the LWA and IT2FSs by which theviews of experts are aggregated. In this paper, Wu andMendel's [17] approach is used to rank the core factorsof construction project failure.
This section o�ers the de�nition of the mathemat-ics behind IT2FSs, including calculation of fuzzy setsby means of �-cuts and WA. Fundamentally, T2FSsare fuzzy sets that exhibit uncertainty in their MFs.These types of sets are convenient in conditions wherede�ning a precise �tness function is hard or impossible.The mathematical de�nitions of the T1FSs and T2FSsand their arithmetic are as follows.
De�nition 1. A T1FS ~A in a universe of discourse,X, is characterized by Membership Function (MF)
� ~A(x). This MF denotes the membership value ofmember x in set ~A and takes values in the interval[0, 1] [23].
De�nition 2. �-cut of a T1FS ~A is a crisp setthat contains all the elements in X whose membershipvalues are greater than or equal to �, i.e.:
A(�) = fxj�A(x) > �g ; 8X 2 X; 0 � � � 1: (4)
In order to calculate the addition, subtraction,multiplication, and division of a type 1 fuzzy number,it is necessary to obtain �-cut of fuzzy numbers. Then,calculations are implemented as in De�nition 3 [23].
De�nition 3. Suppose that [a; b] and [d; e] are �-cutof FT1Ss ~A1 and ~A2, respectively (for 0 � � � 1), andmultiplication and division of �-cut of fuzzy sets ~A1and ~A2 will be de�ned as follows [24]:
~A1 � ~A2 = [a; b] + [d; e] = [a+ d; b+ e] ; (5)
~A1 � ~A2 = [a; b]� [d; e] =�min(a� d; b� e);
max(a� d; b� e)�; (6)
~A1 ~A2 = [a; b] : [d; e] =�min(ad; ae; bd; be);
max(ad; ae; bd; be)�; (7)
~A1= ~A2 = [a; b] = [d; e] =�min(a=d; a=e; b=d; b=e);
max(a=d; a=e; b=d; b=e)�: (8)
De�nition 4. Eq. (6) is one of the defuzzi�cationmethods for T1FSs and is used to �nd the centroid ofa T1FS [24]:
c(A) =
NPi=1
xi�A(x)
NPi=1
�A(x): (9)
De�nition 5. A general type-2 fuzzy set ~~A in theuniverse of discourseX can be presented by type-2 MFs� ~~A
, shown as follows [24]:

100 V. Shahhosseini et al./Scientia Iranica, Transactions A: Civil Engineering 25 (2018) 93{108
~~A =�
( (x; u); � ~~A(x; u))
��� 8x 2 X; 8u 2 Jx � [0; 1] ;
0 � � ~~A(x; u) � 1
�; (10)
where x is a primary variable, Jx is a primary MF,u is a secondary variable, and � ~~A
(x; u) is a secondaryMF [24].
Another representation form of a T2FS is asfollows:
~~A =Z
x2X
Zu2Jx
� ~~A(x; u)
(x; u); (11)
where Jx � [0; 1] ands
denote the union over allpermissible x and u.
De�nition 6. When � ~~A(x; u) = 1, 8� 2 Jx � [0; 1],
we have an IT2FS, shown as follows:
~~A(x; u) =Z
x2X
Zu2Jx
1(x; u)
: (12)
Although the third dimension of IT2FSs, whichis the value of the secondary MF, always equals one(i.e., the third dimension is ignored), it is still powerfulenough to accurately cover uncertainty of words [24].
As can be seen in Figure 4, the union of all theprimary memberships of an IT2FS is represented by atwo-dimensional domain, which is called the FootprintOf Uncertainty (FOU) of ~~A:
FOU( ~~A) =[x2X
Jx; (13)
~~A =1
FOU( ~~A): (14)
Figure 4. FOU, LMF, and UMF of a T2FS [24].
In other words, the FOU is completely describedby its two bounding functions. The upper bound iscalled Upper Membership Function (UMF), denoted as�� ~~A
(x), and the lower bound is called Lower Member-ship Function (LMF), denoted as � ~~A
(x), i.e.:
�� ~~A(x) = FOU( ~~A); (15)
� ~~A(x) = FOU( ~~A): (16)
In the following, some of the arithmetic operationsbetween IT2FSs are presented. To start, suppose that~~A1 and ~~A2 are two IT2FSs:
~~A1 =( ~~AU1 ;~~AL1 ) = ((aU11; a
U12; a
U13; a
U14;hU11; h
U12);
(aL11; aL12; a
L13; a
L14;hL11; h
L12));
~~A2 =( ~~AU2 ;~~AL2 ) = ((aU21; a
U22; a
U23; a
U24;hU21; h
U22);
(aL21; aL22; a
L23; a
L24;hL21; h
L22)):
De�nition 7. In IT2Fs, the aforesaid calculations forT1FSs in De�nition 3 are separately carried out for itsupper and lower bounds, and the result of addition,subtraction, multiplication, or division is found. Forexample, the addition operation between the IT2FSsabove is de�ned as follows [17]:
~~A1 � ~~A2 =((aU11 + aU21; aU12 + aU22; a
U13 + aU23; a
U14
+ aU24; min(hU11; hU21);min(hU12; h
U22);
(aL11 + aL21; aL12 + aL22; a
L13 + aL23; a
L14 + aL24;
min(hL11; hL21);min(hL12; h
L22)): (17)
De�nition 8. Crisp value, �, is multiplied by anIT2FS as in the following equation [17]:
� ~~A1 =((�aU11; �aU12; �a
U13; �a
U14;hU11; h
U12);
(�aL11; �aL12; �a
L13; �a
L14;hL11; h
L12)): (18)
De�nition 9. To obtain the centroid of IT2FS ~~A,the average centroid between the centroids of UMF andLMF can be used [17]:
c( ~A) =c(UMF ( ~A)) + c(LMF ( ~A))
2: (19)
4.1. MFs de�nitionFor the purpose of determining the MFs of linguistic
V. Shahhosseini et al./Scientia Iranica, Transactions A: Civil Engineering 25 (2018) 93{108 101
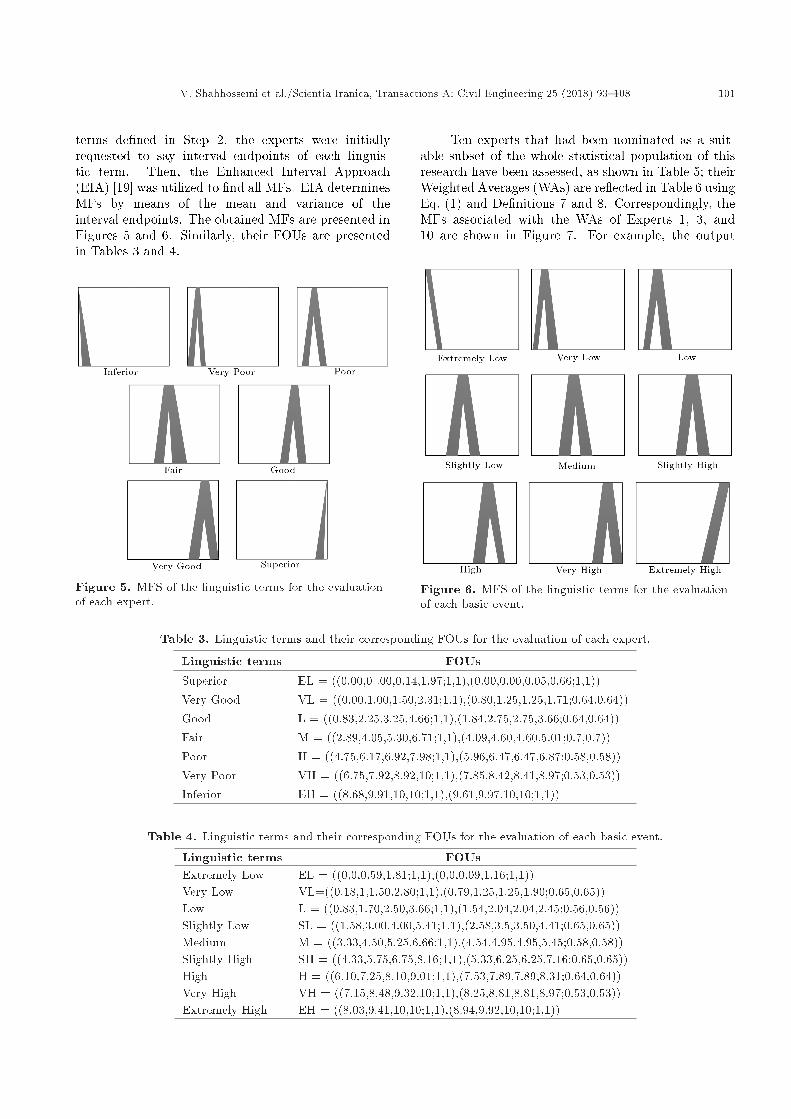
terms de�ned in Step 2, the experts were initiallyrequested to say interval endpoints of each linguis-tic term. Then, the Enhanced Interval Approach(EIA) [19] was utilized to �nd all MFs. EIA determinesMFs by means of the mean and variance of theinterval endpoints. The obtained MFs are presented inFigures 5 and 6. Similarly, their FOUs are presentedin Tables 3 and 4.
Figure 5. MFS of the linguistic terms for the evaluationof each expert.
Ten experts that had been nominated as a suit-able subset of the whole statistical population of thisresearch have been assessed, as shown in Table 5; theirWeighted Averages (WAs) are re ected in Table 6 usingEq. (1) and De�nitions 7 and 8. Correspondingly, theMFs associated with the WAs of Experts 1, 3, and10 are shown in Figure 7. For example, the output
Figure 6. MFS of the linguistic terms for the evaluationof each basic event.
Table 3. Linguistic terms and their corresponding FOUs for the evaluation of each expert.
Linguistic terms FOUs
Superior EL = ((0.00,0 .00,0.14,1.97;1,1),(0.00,0.00,0.05,0.66;1,1))Very Good VL = ((0.00,1.00,1.50,2.31;1,1),(0.80,1.25,1.25,1.71;0.64,0.64))Good L = ((0.83,2.25,3.25,4.66;1,1),(1.84,2.75,2.75,3.66;0.64,0.64))Fair M = ((2.89,4.05,5.30,6.71;1,1),(4.09,4.60,4.60,5.01;0.7,0.7))Poor H = ((4.75,6.17,6.92,7.98;1,1),(5.96,6.47,6.47,6.87;0.58,0.58))Very Poor VH = ((6.75,7.92,8.92,10;1,1),(7.85,8.42,8.41,8.97;0.53,0.53))Inferior EH = ((8.68,9.91,10,10;1,1),(9.61,9.97,10,10;1,1))
Table 4. Linguistic terms and their corresponding FOUs for the evaluation of each basic event.
Linguistic terms FOUsExtremely Low EL = ((0,0,0.59,1.81;1,1),(0,0,0.09,1.16;1,1))Very Low VL=((0.18,1,1.50,2.80;1,1),(0.79,1.25,1.25,1.90;0.65,0.65))Low L = ((0.83,1.70,2.50,3.66;1,1),(1.54,2.04,2.04,2.45;0.56,0.56))Slightly Low SL = ((1.58,3.00,4.00,5.41;1,1),(2.58,3.5,3.50,4.41;0.65,0.65))Medium M = ((3.33,4.50,5.25,6.66;1,1),(4.54,4.95,4.95,5.45;0.58,0.58))Slightly High SH = ((4.33,5.75,6.75,8.16;1,1),(5.33,6.25,6.25,7.16;0.65,0.65))High H = ((6.10,7.25,8.10,9.01;1,1),(7.53,7.89,7.89,8.31;0.64,0.64))Very High VH = ((7.15,8.48,9.32,10;1,1),(8.25,8.81,8.81,8.97;0.53,0.53))Extremely High EH = ((8.03,9.41,10,10;1,1),(8.94,9.92,10,10;1,1))

102 V. Shahhosseini et al./Scientia Iranica, Transactions A: Civil Engineering 25 (2018) 93{108
Figure 7. MFs of the WAs of Experts 1, 5, and 10.
MF of Expert 1 (the left picture of Figure 7) showsthat he has satisfactory expertise and experience in theconstruction project.
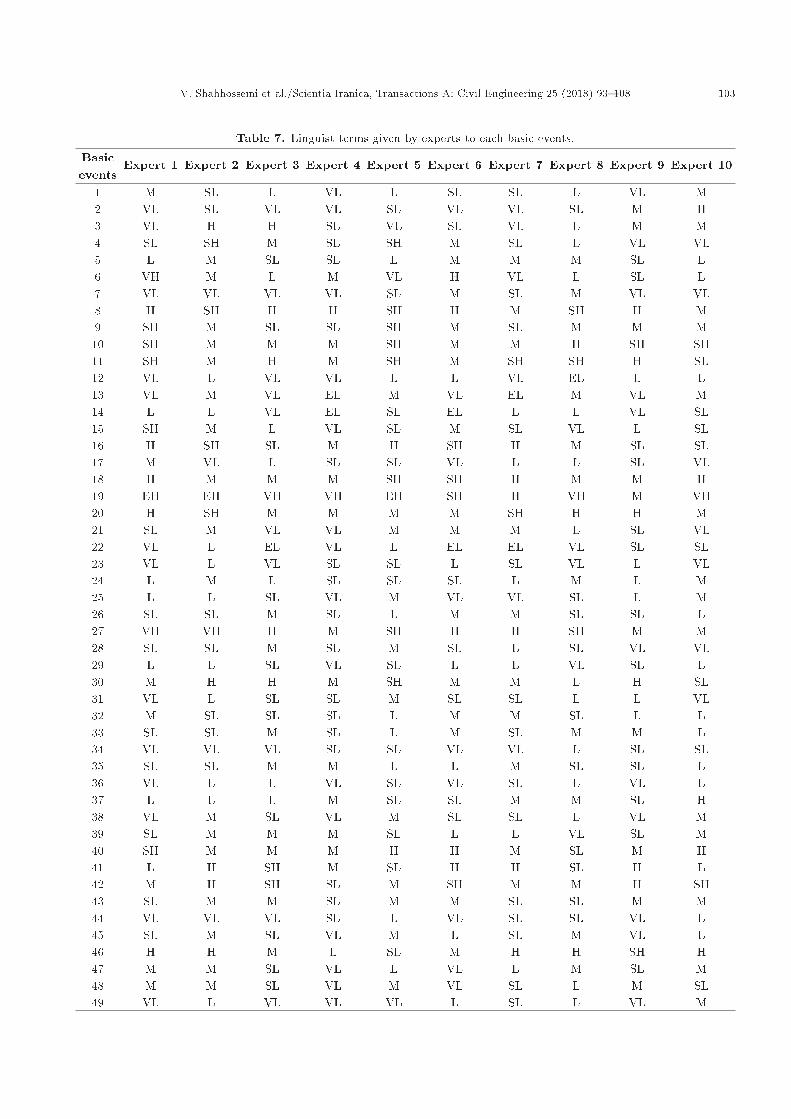
On the other hand, the judgments of expertsabout the risk of each basic event are re ected inTable 7. As can be seen in this table, nearly all experts(except Expert 9) have considered that basic event 19is the most signi�cant factor of project failure, and theyconsidered further risk for this basic event. This issuepresents that there is no suitable planning for allocationof �nancial resources. Thus, the project will stop andfailure occurs.
Table 5. Attributed scores to each expert based onhis/hers knowledge and experiment.
Experts WeightsEL VL L M H VH EH
1 0 0 0 0 0 0 32 0 0 0 0 0 2 13 0 0 0 0 1 1 14 0 0 0 0 0 1 25 0 0 0 0 1 2 06 0 0 0 0 2 1 07 0 0 0 0 1 0 28 0 0 0 0 0 3 09 0 0 0 0 0 3 010 0 0 0 0 3 0 0
5. Results and discussion
Established on the stated descriptions of Step 3, therisk of each basic event is calculated. Then, the averagecentroid ranking method (Eq. (19)) is used to obtainthe centroid of all risks. The results are revealed inTable 8.
The most important factors have the bigger cen-troid. MFs associated with the top ten most importantfactors of failure are shown in Figure 8. As can be
Figure 8. Overall risks of the top ten causes of projectsfailure.
Table 6. FOUs result for WAs of experts.
Experts Final IT2FS of weights((aUi1, aUi2, aUi3, aUi4; HU
i1, HUi2), (aLi1, aLi2, aLi3, aLi4; HL
i1, HLi2))
1 (8.68, 9.91, 10.00, 10.00; 1.00, 1.00), (9.61, 9.970, 10.00, 10.00; 1.00, 1.00)
2 (7.39, 8.58, 9.28, 10.00; 1.00, 1.00), (8.44, 8.94, 8.94, 9.31; 0.53, 0.53)
3 (6.73, 8.00, 8.61, 9.33; 1.00, 1.00), (7.81, 8.29, 8.29, 8.61; 0.53, 0.53)
4 (8.04, 9.25, 9.64, 10.00; 1.00, 1.00), (9.02, 9.45, 9.47, 9.66; 0.58, 0.58)
5 (6.08, 7.34, 8.25, 9.33, ; 1.00, 1.00), (7.22, 7.77, 7.76, 8.27; 0.53, 0.53)
6 (5.42, 6.75, 7.59, 8.65; 1.00, 1.00), (6.59, 7.12, 7.12, 7.57; 0.58, 0.58)
7 (7.37, 8.66, 8.97, 9.33; 1.00, 1.00), (8.39, 8.80, 8.82, 8.96; 0.58, 0.58)
8 (6.75, 7.92, 8.92, 10; 1.00, 1.00), (7.85, 8.42, 8.41, 8.97; 0.64, 0.64)
9 (6.75, 7.92, 8.92, 10; 1.00, 1.00), (7.85, 8.42, 8.41, 8.97; 0.64, 0.64)
10 (4.75, 6.17, 6.92, 7.98; 1.00, 1.00), (5.96, 6.47, 6.47, 6.87; 0.64, 0.64)
V. Shahhosseini et al./Scientia Iranica, Transactions A: Civil Engineering 25 (2018) 93{108 103
Table 7. Linguist terms given by experts to each basic events.
Basicevents
Expert 1 Expert 2 Expert 3 Expert 4 Expert 5 Expert 6 Expert 7 Expert 8 Expert 9 Expert 10
1 M SL L VL L SL SL L VL M2 VL SL VL VL SL VL VL SL M H3 VL H H SL VL SL VL L M M4 SL SH M SL SH M SL L VL VL5 L M SL SL L M M M SL L6 VH M L M VL H VL L SL L7 VL VL VL VL SL M SL M VL VL8 H SH H H SH H M SH H M9 SH M SL SL SH M SL M M M10 SH M M M SH M M H SH SH11 SH M H M SH M SH SH H SL12 VL L VL VL L L VL EL L L13 VL M VL EL M VL EL M VL M14 L L VL EL SL EL L L VL SL15 SH M L VL SL M SL VL L SL16 H SH SL M H SH H M SL SL17 M VL L SL SL VL L L SL VL18 H M M M SH SH H M M H19 EH EH VH VH EH SH H VH M VH20 H SH M M M M SH H H M21 SL M VL VL M M M L SL VL22 VL L EL VL L EL EL VL SL SL23 VL L VL SL SL L SL VL L VL24 L M L SL SL SL L M L M25 L L SL VL M VL VL SL L M26 SL SL M SL L M M SL SL L27 VH VH H M SH H H SH M M28 SL SL M SL M SL L SL VL VL29 L L SL VL SL L L VL SL L30 M H H M SH M M L H SL31 VL L SL SL M SL SL L L VL32 M SL SL SL L M M SL L L33 SL SL M SL L M SL M M L34 VL VL VL SL SL VL VL L SL SL35 SL SL M M L L M SL SL L36 VL L L VL SL VL SL L VL L37 L L L M SL SL M M SL H38 VL M SL VL M SL SL L VL M39 SL M M M SL L L VL SL M40 SH M M M H H M SL M H41 L H SH M SL H H SL H L42 M H SH SL M SH M M H SH43 SL M M SL M M SL SL M M44 VL VL VL SL L VL SL SL VL L45 SL M SL VL M L SL M VL L46 H H M L SL M H H SH H47 M M SL VL L VL L M SL M48 M M SL VL M VL SL L M SL49 VL L VL VL VL L SL L VL M
104 V. Shahhosseini et al./Scientia Iranica, Transactions A: Civil Engineering 25 (2018) 93{108
Table 7. Linguist terms given by experts to each basic events (continued).
Basicevents
Expert 1 Expert 2 Expert 3 Expert 4 Expert 5 Expert 6 Expert 7 Expert 8 Expert 9 Expert 10
50 M VL L SL SL M SL SL VL SL51 M M M M SL L SL VL L M52 SL L VL VL VL L L SL SL L53 SL L SL VL VL SL L VL M VL54 SH H SL M H H H H VL M55 M M SL SL SL M M SL SL L56 H SL M SL M M M SL SL L57 L M VL L L L VL SL M M58 SH M M M SH M M VL L SL59 SL M L VL M M M SL L VL60 SL M M M M M M SL SL L61 SL SL SH M SL H M SH M M62 L M L VL L L L M SL L63 L M L VL SL M M L SL VL64 M M M SL L M SL L SL L65 L VL EL VL EL EL L EL L M66 VL L VL VL SL L L SL L SL67 VL M M SL SL M M SL L M68 M H M M SH M M H SH SH69 VL L VL VL SL VL VL L SL L70 M SL SL SL L M M SL M VL71 M VL L VL VL M M VL L SL72 VH VH EH VH VH H M M VH SH73 VL VL L M M M SL L SL SL74 SL VL L VL L L SL SL L VL75 SH H SH M H SH H M M H
seen in this �gure, the acquired results exemplify moreinformation about the uncertainties of linguistic words.Hence, by making use of the additional informationprovided by IT2FSs from the beginning of the calcula-tions up to the time when �nal results are obtained, ourproposed procedure bene�ts decision-makers in makingmore reliable choices.
The top ten most important causes of failure arediscussed as follows: Basic events 19, 8, 18, and 11are related to �nancial problems. It is clear that thisproblem leads to delay in work progress, because therewill be insu�cient cash ow to support constructionexpenditures. This issue increases �nancial problemsof the contractor. In particular, in Iran, �nancial prob-lems of contractors are more than other countries, sincemost Iranian contractors are small and independent,and they have limited access to credit facilities.
Basic events 72 and 75 are about the contractorselection process. We know that every construc-tion project comprises initial planning, design, and
construction stages. In terms of expenditure, theconstruction stage is the most outstanding one, becauseabout 90 percent of total project funding is expendedthroughout the construction stage. Consequently,choosing a suitable contractor de�nitely helps achieveoverall success and good performance. In Iran andmany other countries, contracts are normally awardedto the lowest bid price. It is understandable that theobjectives, such as construction time and �nal qualityof a project, are likely to be overlooked with the simpleselection of cost minimization, while these objectivesare generally more desirable and appropriate. Thus,the lowest bidder is not always the most economicchoice, and so the risk of poor performance rises withit. With the accurate selection of pre-quali�ed contrac-tors, the above-mentioned problem will be signi�cantlyreduced. In the prequali�cation method, �rst, thepool of contractors is examined, and then the shortlist of contractors is requested to contribute to thebidding process. If this process is conducted properly,
V. Shahhosseini et al./Scientia Iranica, Transactions A: Civil Engineering 25 (2018) 93{108 105
Table 8. The obtained centroid for overall risk of each basic event.Basic event Centroid Basic event Centroid Basic event Centroid
1 2.9 26 3.6 51 3.72 2.8 27 6.3 52 2.33 3.8 28 3.2 53 2.54 3.7 29 2.3 54 5.95 3.6 30 5.7 55 3.96 3.9 31 2.8 56 4.47 2.4 32 3.5 57 2.98 6.7 33 3.8 58 4.49 4.7 34 2.2 59 3.310 5.7 35 3.6 60 4.211 5.9 36 2.0 61 4.912 1.6 37 3.8 62 2.713 2.5 38 3.0 63 3.114 1.9 39 3.6 64 3.715 3.3 40 5.6 65 1.616 5.6 41 5.3 66 2.217 2.6 42 5.7 67 3.718 6.0 43 4.3 68 5.719 8.1 44 2.1 69 2.020 6.1 45 3.2 70 3.821 3.3 46 6.0 71 2.822 1.6 47 3.4 72 7.623 2.2 48 3.5 73 3.124 3.3 49 2.1 74 2.225 2.6 50 3.2 75 6.8
the selected contractor likely completes the projectsatisfactorily.
Basic event 27, as the third important factor offailure, is justi�ed as follows.
Changes and/or additional works stem from un-certainties, faults, and discrepancies in speci�cationsand drawings. The order of changes has remarkablee�ect on the �nancial performance of a constructionproject. These change orders can be reduced if thefollowing conditions are considered:
(a) Carrying out precise preliminary studies of theproject by consultants;
(b) Allocation of adequate time for preliminary stud-ies;
(c) Clear and continuous discussion about the ob-jectives of a project between the consultant andclient;
(d) Establishment of correct descriptions of clientrequirements by consultants.
6. Case study
In order to validate the results of the current study,in this section, a real case study causing failure isinvestigated.
The project in question is the construction of thesecond lane of Miandoab-Kermanshah highway that islocated in three di�erent provinces: West Azarbayjan,
Kurdestan, and Kermanshah. With a length of 440 km,it was divided into eleven parts, such that each part wasawarded to one independent contractor. Furthermore,it has a width of 7.30 meters. The main objectiveof this project is to increase transportation capacity.Safety improvement and reduction of accidents are theother aims of this project. The longest part of thisproject belongs to part 11 with allotted time of 30months in the related contract. Since construction ofdi�erent parts is independent, the construction of allparts must be completed in 30 months. Conversely,after 12 years, the construction of this project is yetto reach completion, and construction cost has reached�ve times the estimated sum, such that the project haslost its economic justi�cation.
In order to survey the causes of failure, elevenproject managers of the case study were asked to helpus �nd the key factors of failure. First, through FTAand interview with the project managers, forty-twobasic events were identi�ed. Twenty-one identi�edbasic events are basic events 2, 5, 6, 8, 11, 15, 19,20, 24, 27, 31, 35, 37, 42, 45, 50, 52, 53, 55, 56, and57 of Figure 2. Other identi�ed basic events are listedin Table 9. As it can be seen, the risks of rows 1 and4 in this table are only related to road constructionprojects and other risks can occur in each constructionproject.
To rank the basic events, the project managerswere asked to respond to the risk of each basic event.
106 V. Shahhosseini et al./Scientia Iranica, Transactions A: Civil Engineering 25 (2018) 93{108
Table 9. Some of the basic events related to the case study failure.
1 Incensement of tar price2 Asphalt batching plant stopping3 Subsoil conditions4 Tra�c control and restrictions on the job site5 Machines stopping6 Increment of material and laborer price (except tar)7 Lack of coordination among di�erent governmental organization (stakeholders)8 Lack of timely equipment and material procurement9 Lack of suitable planning and scheduling for used machines10 Lack of selection of unsuitable construction method11 Prolongation of con ict resolution12 Con icts in work schedules of subcontractors13 Mistake in design14 Design changes15 Inappropriate design16 Late inspection17 Insu�cient inspectors18 Ambiguities, mistakes, and inconsistencies in contract speci�cations and drawings19 Severe weather conditions on the job site20 incapable inspectors21 Poor quali�cation of the contractor's technical sta�
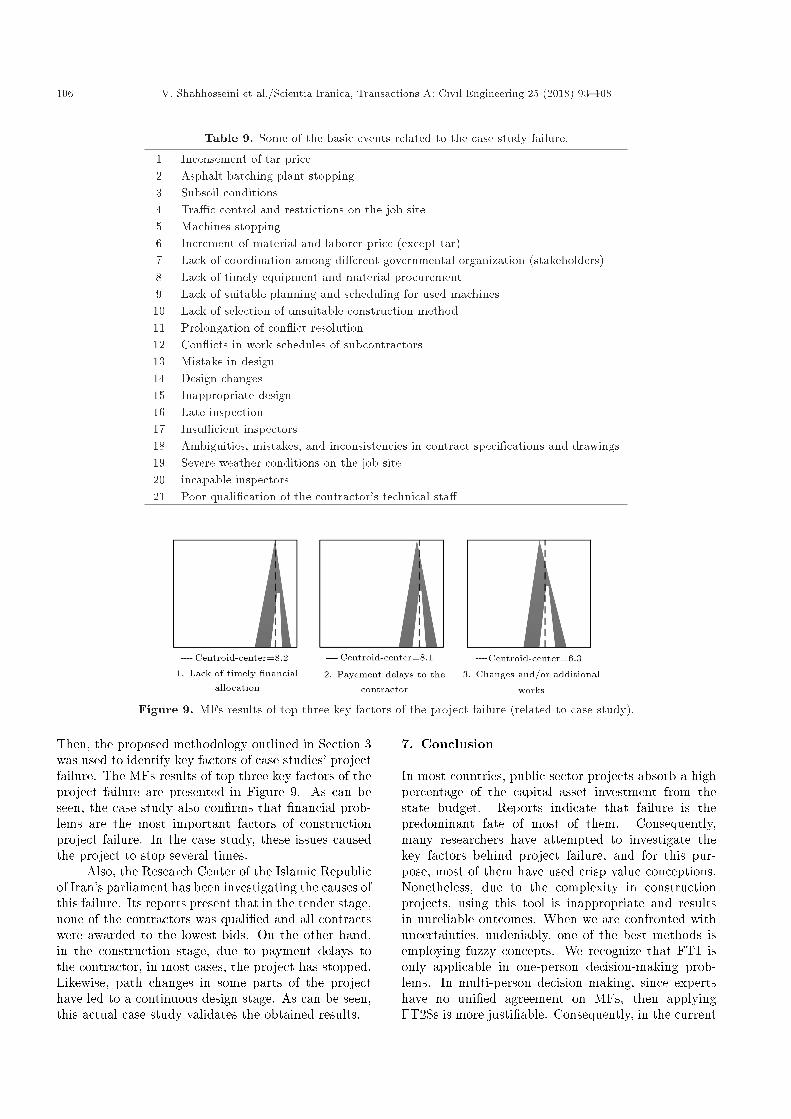
Figure 9. MFs results of top three key factors of the project failure (related to case study).
Then, the proposed methodology outlined in Section 3was used to identify key factors of case studies' projectfailure. The MFs results of top three key factors of theproject failure are presented in Figure 9. As can beseen, the case study also con�rms that �nancial prob-lems are the most important factors of constructionproject failure. In the case study, these issues causedthe project to stop several times.
Also, the Research Center of the Islamic Republicof Iran's parliament has been investigating the causes ofthis failure. Its reports present that in the tender stage,none of the contractors was quali�ed and all contractswere awarded to the lowest bids. On the other hand,in the construction stage, due to payment delays tothe contractor, in most cases, the project has stopped.Likewise, path changes in some parts of the projecthave led to a continuous design stage. As can be seen,this actual case study validates the obtained results.
7. Conclusion
In most countries, public sector projects absorb a highpercentage of the capital asset investment from thestate budget. Reports indicate that failure is thepredominant fate of most of them. Consequently,many researchers have attempted to investigate thekey factors behind project failure, and for this pur-pose, most of them have used crisp value conceptions.Nonetheless, due to the complexity in constructionprojects, using this tool is inappropriate and resultsin unreliable outcomes. When we are confronted withuncertainties, undeniably, one of the best methods isemploying fuzzy concepts. We recognize that FT1 isonly applicable in one-person decision-making prob-lems. In multi-person decision making, since expertshave no uni�ed agreement on MFs, then applyingFT2Ss is more justi�able. Consequently, in the current

V. Shahhosseini et al./Scientia Iranica, Transactions A: Civil Engineering 25 (2018) 93{108 107
study, the root factors of project failure were initiallyidenti�ed through FTA. Then, we ranked them usingthe T2FSs approach. In the last section, a case studywas provided to validate our results.
Future studies could focus on exploring inade-quacies of construction bidding procedures of publicsector projects. Furthermore, proposing a decision-making model for contractor prequali�cation usingT2FSs could be another topic for future studies.
Nomenclature
FTA Fault Tree AnalysisLWA Linguistic Weighted AverageIT2FSs Interval Type-2 Fuzzy SetsKTX Korea Train eXpressRII Relative Importance IndexFT1 Fuzzy Type-1FT1Ss Fuzzy Type-1 SetsFT2 Fuzzy Type-2
AND gate
OR gateWA Weighted Average~Wj Weighted average of expert jwqj Linguistic term assigned to each expert
j in criterion qN The sample sizeN The population sizeZ Standard normal quantileA The con�dence levelP The estimated proportion of an
attribute that is present in thepopulation
" The level of precision~Ri The overall risk of basic event i~Xij The response of expert j about the risk
of basic event iMFs Membership FunctionsMF Membership Function~A A type-1 fuzzy set
� ~A(x) MF of ~Ac(A) Centroid of a T1FS~~A A general type-2 fuzzy set� ~~A
(x; u) Type-2 MFs
FOU Footprint Of UncertaintyUMF Upper Membership FunctionLMF Lower Membership Function
c( ~A) Centroid of a T1FS
c(UML( ~A)) Centroid of UMF
c(LMF( ~A)) Centroid of LMFEIA Enhanced Interval ApproachWAs Weighted Averages
References
1. Shahhosseini, V. and Sebt, M.H. \Competency-basedselection and assignment of human resources to con-struction projects", Scientia Iranica, 18(2), pp. 163-180 (2011).
2. http://www.entekhab.ir/fa/news/257038.
3. Han, S.H., Yun, S., Kim, H., Kwak, Y.H., Park,H.K. and Lee, S.H. \Analyzing schedule delay of megaproject: lessons learned from Korea train express",IEEE Transactions on Engineering Management, 56,pp. 243-256 (2009).
4. Abdul-Rahman, H., Takim, R. and Min, W.S.\Financial-related causes contributing to project de-lays", Journal of Retail & Leisure Property, 8, pp. 225-238 (2009).
5. Yang, J.B. and Wei, P.R. \Causes of delay in theplanning and design phases for construction projects",J. Architect. Eng., 16(2), pp. 80-83 (2010).
6. Soliman, E.M. \Delay causes in Kuwait construc-tion projects", in: AICSGE7, Proceedings of SeventhAlexandria International Conference on Structural andGeotechnical Engineering, pp. 57-67 (2010).
7. Hasseb, M., Bibi, A., Dyian, M. and Rabbani, W.\Problems of projects and e�ects of delays in theconstruction industry of Pakistan", Austr. J. Bus.Manage. Res., 1(5), pp. 41-50 (2011).
8. Doloi, H., Sawhney, A., Iyer, K.C. and Rentala,S. \Analysing factors a�ecting delays in Indian con-struction projects", International Journal of ProjectManagement, 30, pp. 479-489 (2012).
9. Ezeldin, A. and Abdel-Ghany, M. \Causes of con-struction delays for engineering projects: an Egyptianperspective", AEI, pp. 54-63 (2013).
10. Rahsid, Y., Haq, S. and Aslam, M. \Causes of delay inconstruction projects of Punjab-Pakistan: an empiricalstudy", J. Basic Appl. Sci. Res., 3(10), pp. 87-96(2013).
11. Marzouk, M.M. and El-Rasas, T.I. \Analyzing delaycauses in Egyptian construction projects", Journal ofAdvanced Research, 5(1), pp. 49-55 (2014).
12. Ruqaishi, M. and Bashir, H. \Causes of delay inconstruction projects in the oil and gas industry inthe gulf cooperation council countries: a case study",J. Manage. Eng., 31(3), pp. 5014-5017 (2013).

108 V. Shahhosseini et al./Scientia Iranica, Transactions A: Civil Engineering 25 (2018) 93{108
13. Remon, F.A. and Abdel-Hakam, A.A. \Exploringdelay causes of road construction projects in Egypt",Alexandria Engineering Journal, 55(2), pp. 1515-1539(2016).
14. Gunduz, M., Nielsen, Y. and Ozdemir, M. \Quanti�ca-tion of delay factors using Relative Importance Index(RII) method for construction projects in Turkey", J.Manage. Eng., 29(2), pp. 133-139 (2013).
15. Ferdous, R. \Methodology for computer aided fuzzyfault tree analysis", Thesis presented to the MemorialUniversity of Newfoundland in Partial Ful�llment ofthe Requirement for Master Degree (2006).
16. Johnson, P.A. \Fault tree analysis of bridge failure dueto scour and channel instability", J. Infrastruct. Syst.,ASCE, 5(1), pp. 35-41 (1999).
17. Wu, D. and Mendel, J.M. \A comparative study ofranking methods, similarity measures and uncertaintymeasures for interval type-2 fuzzy sets", InformationSciences, 179(8), pp. 1169-1192 (2009).
18. Cochran, W.G., Sampling Techniques, 3rd Ed., NewYork: John Wiley & Sons (1977).
19. Gilan, S.S., Sebt, M.H. and Shahhosseini, V. \Com-puting with words for hierarchical competency basedselection of personnel in construction companies",Applied Soft Computing, 12, pp. 860-871 (2012).
20. Nasirzadeha, F., Rouhparvarb, M., MazandaraniZadehc, H. and Rezaie, M. \Integrating system dynam-ics and fuzzy bargaining for quantitative risk allocationin construction projects", Scientia Iranica A, 22(3),pp. 668-678 (2015).
21. Levy, P.S. and Lemeshow, S., Sampling of Populations:Methods And Applications, 3rd Ed., New York, Wiley-Interscience (1999).
22. Mendel, J.M. \Fuzzy sets for words: a new beginning",In: Proceeding of IEEE International Conference onFuzzy Systems, St. Louis, MO, pp. 37-42 (2003).
23. Mendel, J.M., John, R.I. and Liu, F.L. \Intervaltype-2 fuzzy logical systems made simple", 5 IEEETransactions on Fuzzy Systems, 14(6), pp. 808-821(2006).
24. Chen, S.M. and Lee, L.W. \Fuzzy multiple criteriahierarchical group decision-making based on intervaltype-2 fuzzy sets", IEEE Transactions on Systems,
Man and Cybernetics, Part A: Systems and Humans,40(5), pp. 1120-1128 (2012).
Biographies
Vahid Shahhosseini is an Assistant Professor in theDepartment of Civil and Environmental Engineeringat Amirkabir University of Technology. He receivedhis PhD in Construction Engineering and Managementfrom Amirkabir University of Technology, Iran. Heteaches Project Management, Construction EquipmentManagement, and Project Planning and Control. Hisresearch interests include construction management,project management, resource allocation, optimization,computer simulations, expert systems, and fuzzy logicand adaptive intelligent systems. He has publishedseveral research papers in national and internationaljournals and conference proceedings.
Mohammad Reza Afshar obtained his BS degreein Civil Engineering from Zanjan University, Iran. Hereceived his MS degree in Civil Engineering, Construc-tion Engineering and Management from AmirkabirUniversity of Technology. He is also top one graduatedstudent in this course. His research interests are relatedto construction management, risk analysis, projectscheduling problem, optimization and fuzzy logic. Hehas published 12 research papers in international andnational conference proceedings and national journals.
Omid Amiri obtained his BS degree in Civil Engineer-ing from Shahrood University, Iran. He received his MSdegree in Civil Engineering, Construction Engineeringand Management from Amirkabir University of Tech-nology. Every year, He holds di�erent seminars aboutthe tender stage, price list, and causes of constructionproject failure in di�erent areas of Iran. His researchinterests are related to risk analysis, project manage-ment, and construction contractor prequali�cation. Hehas published 98 research papers in international andnational conference proceedings, national journals, andseveral books.