the role of upper troposphere water vapor and cloud in
TRANSCRIPT
The role of upper troposphere The role of upper troposphere water vapor and cloud in water vapor and cloud in global warming in GCMglobal warming in GCM
- first step analysis
04.07.04.07.1133 SOWER Galapagos MeetingSOWER Galapagos MeetingYoko Tsushima*, Yoko Tsushima*, TomooTomoo OguraOgura++ , , SeitaSeita EmoriEmori ++
and members of Kand members of K--1 group1 group*the Frontier Research System for Global Change (FRSGC)++ the National Institute for Environmental Studies (NIES)
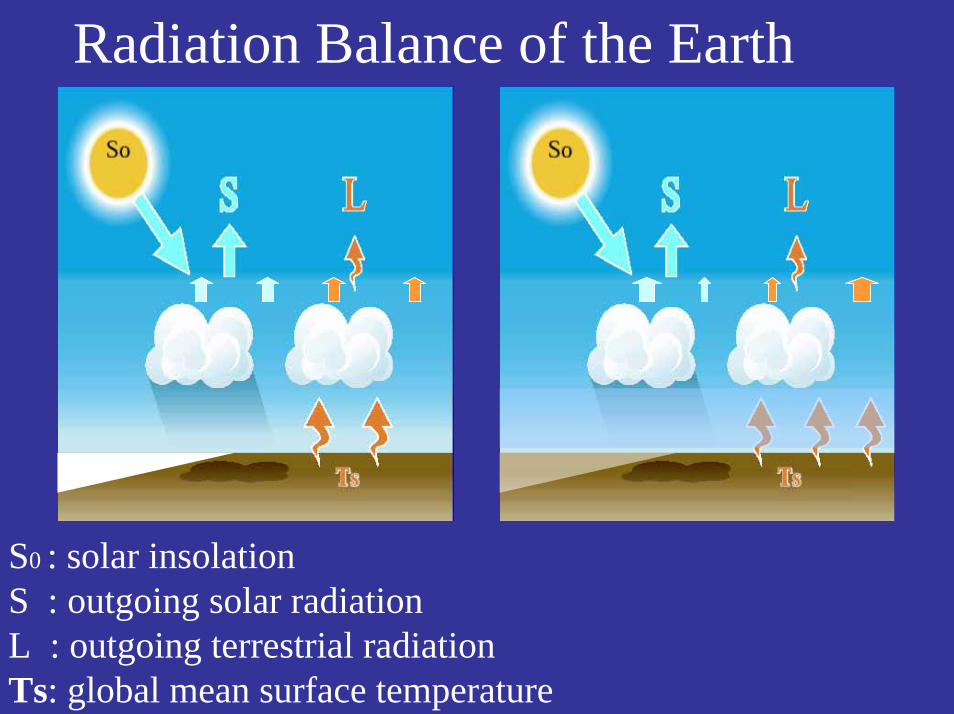
Radiation Balance of the Earth
S0 : solar insolation S : outgoing solar radiation L : outgoing terrestrial radiationTs: global mean surface temperature
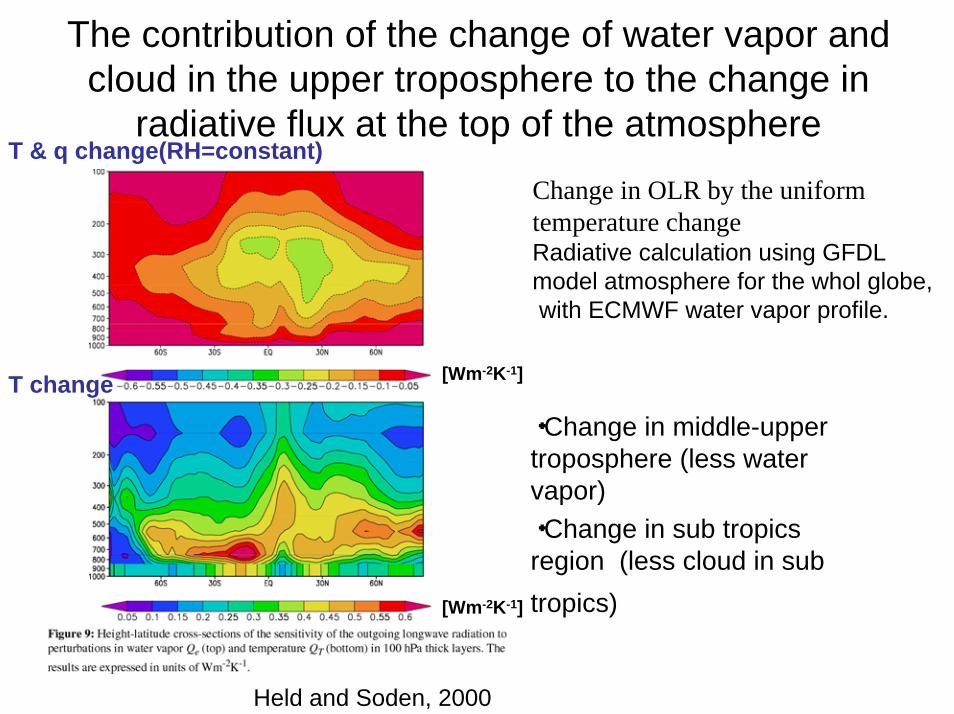
• ・Change in middle-upper troposphere (less water vapor)
• ・Change in sub tropics region (less cloud in sub tropics)
Change in OLR by the uniform temperature change Radiative calculation using GFDLmodel atmosphere for the whol globe,with ECMWF water vapor profile.
The contribution of the change of water vapor and cloud in the upper troposphere to the change in
radiative flux at the top of the atmosphere
Held and Soden, 2000
[Wm-2K-1]
[Wm-2K-1]
T & q change(RH=constant)
T change

Climate Sensitivity in IPCC TARClimate Sensitivity in IPCC TAR
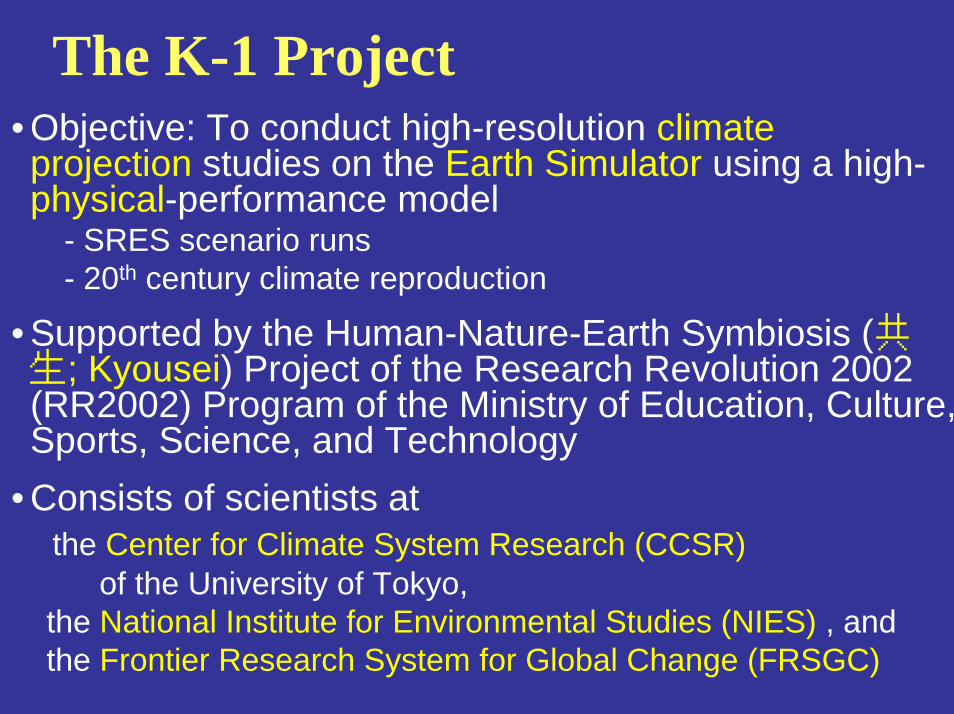
The K-1 Project• Objective: To conduct high-resolution climate projection studies on the Earth Simulator using a high-physical-performance model
- SRES scenario runs- 20th century climate reproduction
• Supported by the Human-Nature-Earth Symbiosis (共生; Kyousei) Project of the Research Revolution 2002 (RR2002) Program of the Ministry of Education, Culture,Sports, Science, and Technology
• Consists of scientists at the Center for Climate System Research (CCSR)
of the University of Tokyo,the National Institute for Environmental Studies (NIES) , andthe Frontier Research System for Global Change (FRSGC)
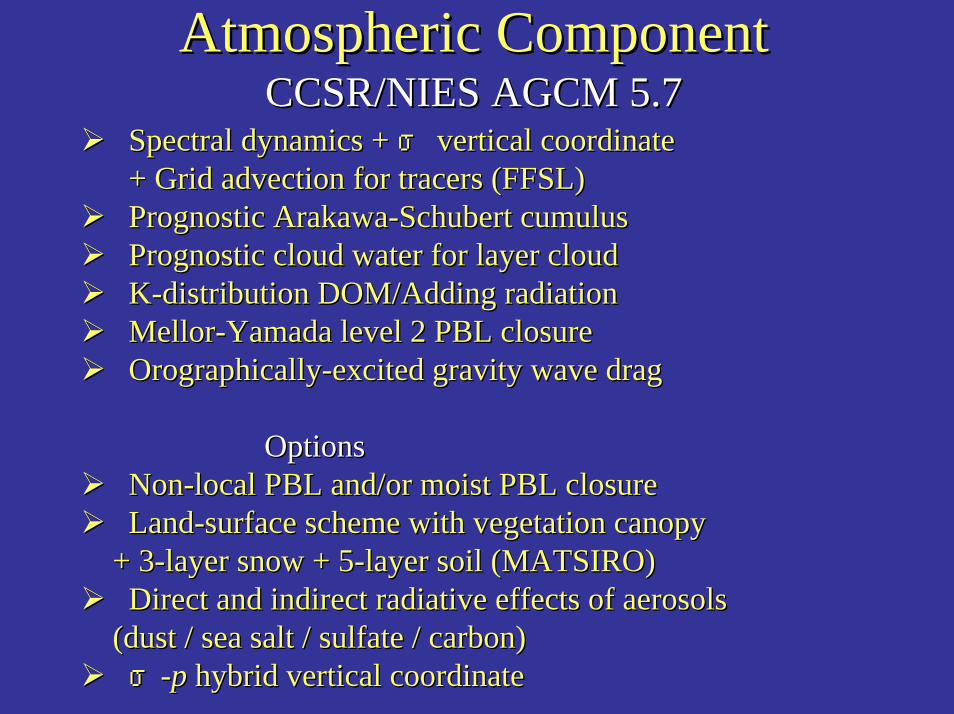
Atmospheric ComponentAtmospheric ComponentCCSR/NIES AGCM 5.7CCSR/NIES AGCM 5.7
Spectral dynamics + Spectral dynamics + σσ vertical coordinatevertical coordinate+ Grid advection for tracers (FFSL)+ Grid advection for tracers (FFSL)Prognostic ArakawaPrognostic Arakawa--Schubert cumulusSchubert cumulusPrognostic cloud water for layer cloudPrognostic cloud water for layer cloudKK--distribution DOM/Adding radiationdistribution DOM/Adding radiationMellorMellor--Yamada level 2 PBL closureYamada level 2 PBL closureOrographicallyOrographically--excited gravity wave dragexcited gravity wave drag
OptionsOptionsNonNon--local PBL and/or moist PBL closurelocal PBL and/or moist PBL closureLandLand--surface scheme with vegetation canopysurface scheme with vegetation canopy
+ 3+ 3--layer snow + 5layer snow + 5--layer soil (MATSIRO)layer soil (MATSIRO)Direct and indirect radiative effects of aerosolsDirect and indirect radiative effects of aerosols
(dust / sea salt / sulfate / carbon)(dust / sea salt / sulfate / carbon)σσ--pp hybrid vertical coordinatehybrid vertical coordinate
Sensitivity experiments
Purpose: Find out factors controlling climate sensitivity in the global warming in GCMs.
Slab ocean experiments are conducted by the same version of GCM for the IPCC FAR experiment, but with lower resolution.

Experimental Design & Data for the analysis
• Resolution: T42 (~2.8°) 20 levels
• Slab ocean experiment for control(1xCO2) & 2xCO2 climate
• Climatology of last 20 years of 75 years’ run• Two versions of models with different climate sensitivity

Result of 1xCO2 climate


Jan.
Cloud fraction
Cloud cover seems to be larger in GCM.Because of the RH bias/optically thin cloud ??

ISCCP simulator (Klein and Jakob 1999; Webb et al. 2001)
• A code that can be used to take cloud and atmosphere information from atmospheric models and convert it into something that is comparable to data from the ISCCP.
– It samples the subgrid distibution of clouds within a model gridbox using a pseudo-random sampling process.
– It emulates the ISCCP retrieval using the profiles extracted from the GCM gridbox.(τ>0.3)

Jan. ISCCP high, middle low cloud fraction
ISCCP D2
LOW.CONTROLGCM(CONTROL)
Pc<330hPa 330hPa<Pc<680hPa Pc>680hPa

Jan.
ISCCP D2
LOW.CONTROL
optical thickness
Pre
ssur
e[hP
a]

Result of 2xCO2 climate
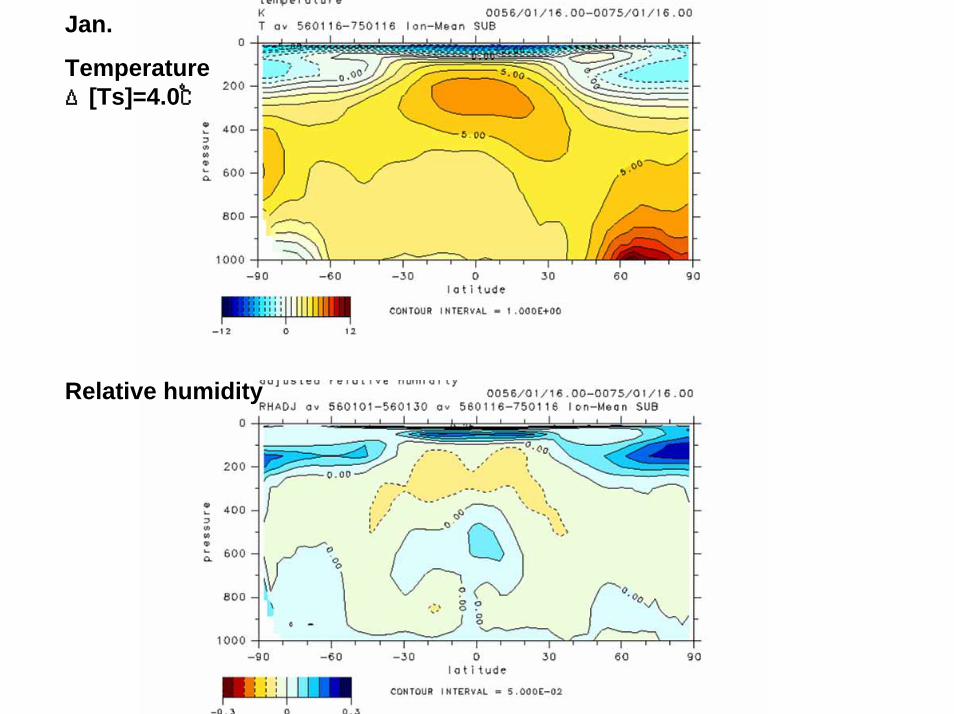
Jan.
TemperatureΔ[Ts]=4.0℃
Relative humidity

Jan.
Relative humidity
Cloud fraction
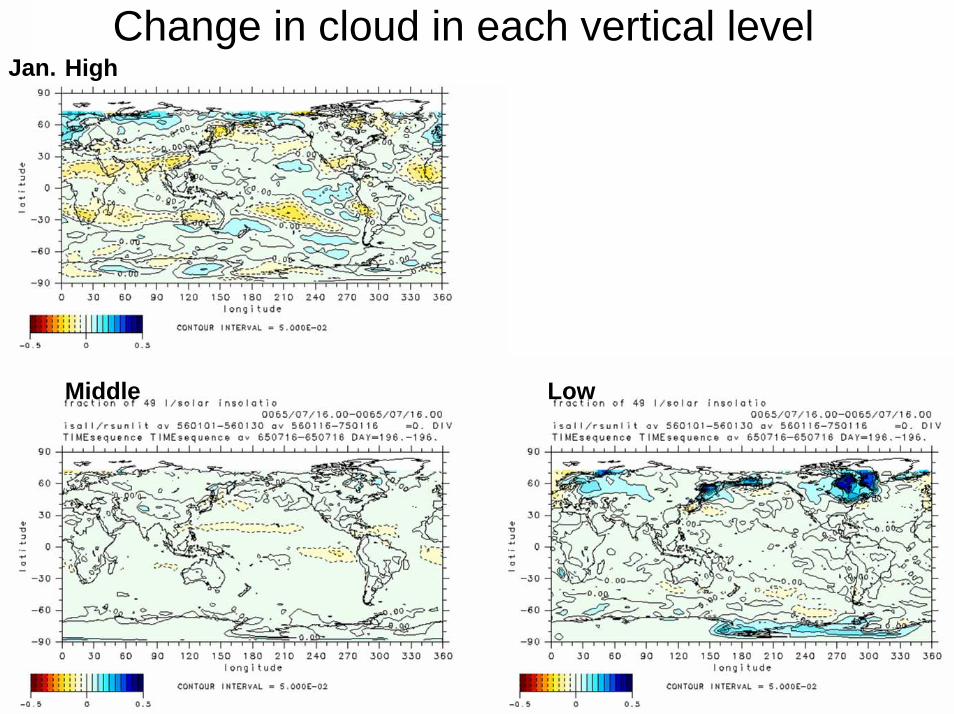
Change in cloud in each vertical levelJan.
Middle
High
Low

Comparison with high sensitivity version
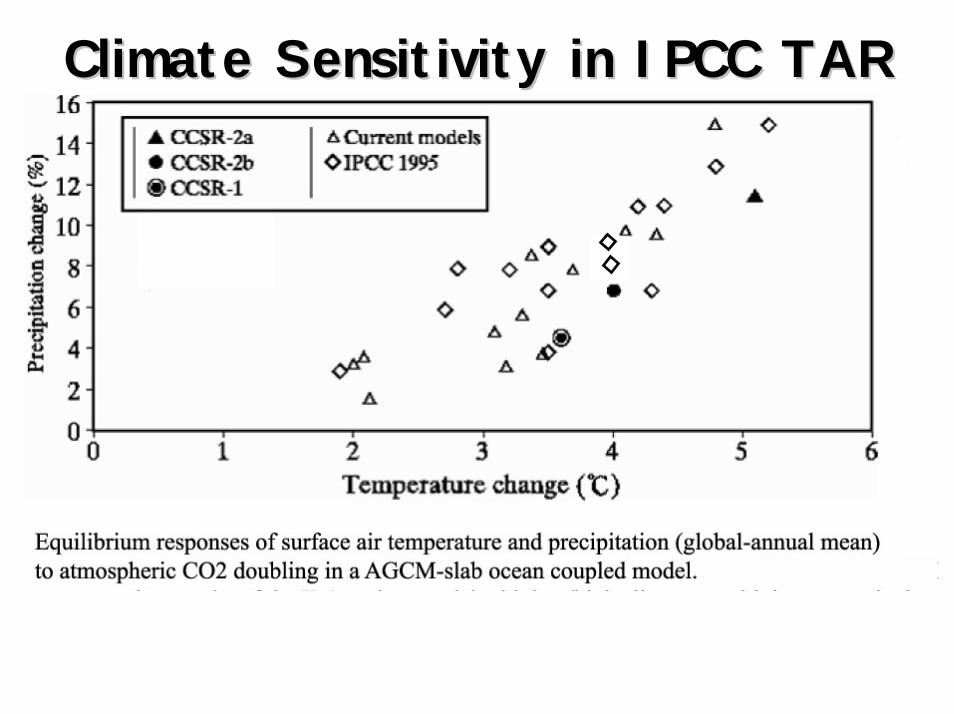
Climate Sensitivity in IPCC TARClimate Sensitivity in IPCC TAR

Climate SensitivityClimate Sensitivity

Climate SensitivityClimate Sensitivity

Two versions of GCM for the sensitivity experiment
Difference between the two model:• Empirical function of temperature which
determines the phase (ice or liquid) of cloud water.
• Treatment of cloud ice in the mixed phase
• Fall speed of ice• Aerosol indirect effect (time scale that
water cloud changes into rain)

Cloud distribution in “low” & “high” versionJan. CONTROL
HIGH
optical thickness
Pre
ssur
e[hP
a]
LOW

Difference in cloud distribution between “high” & “low” version
Tau_Pc
Cloud fraction
Jan. CONTROL
-0.5 0 0.5
optical thickness
Pre
ssur
e[hP
a]
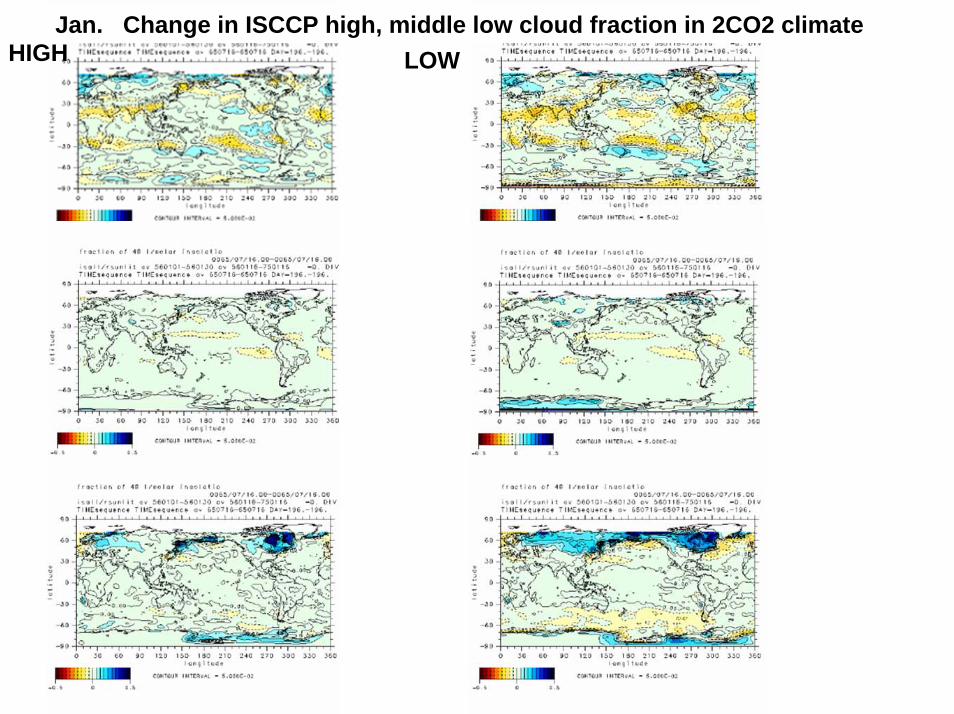
HIGH LOWJan. Change in ISCCP high, middle low cloud fraction in 2CO2 climate

Cloud distribution in “low” & “high” versionJan. CONTROL
HIGH
optical thickness
Pre
ssur
e[hP
a]
LOW
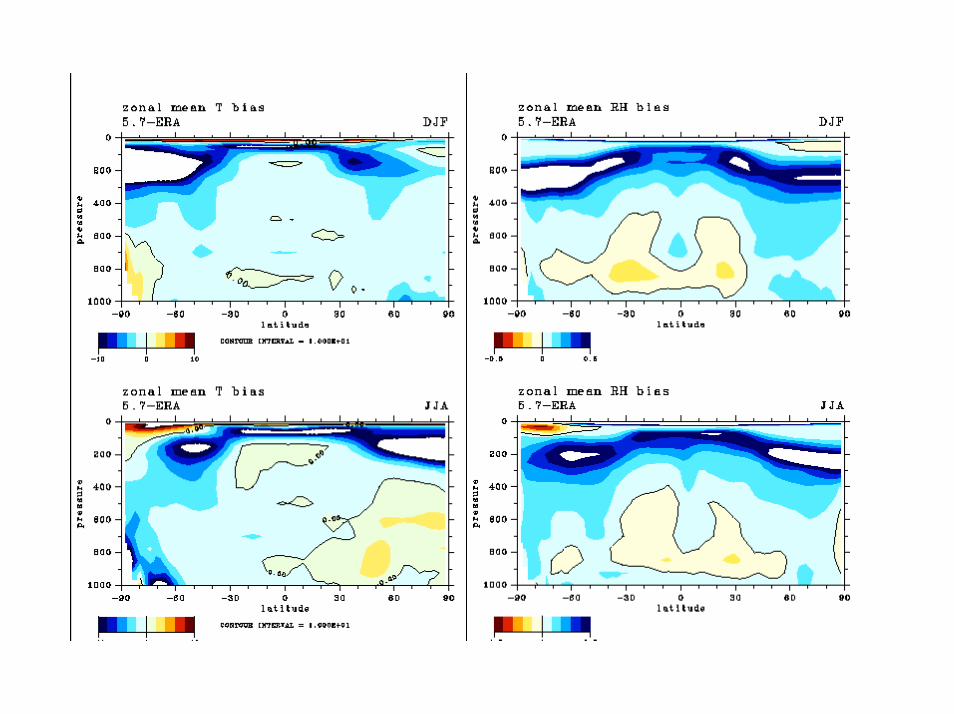
Summary• Current version of GCM simulates the basic
characteristics of the atmosphere well, but there is a cooling and warming bias in the UTーLS. This region has humid bias, too.
• Cloud cover in the upper troposphere is too much.
• In global warming, high cloud with optically opaque thickness decreases in subtroipcs.
• Because it has enough thickness optically, this decrease can work as positive feedback to the global warming.

Summary• Comparison with two versions of GCM, which have
different cloud parameterization has been made.• Although both of them reproduce the basic atmospheric
characteristics in the current climate, there is a difference in the distribution of cloud. – In “high” version, high cloud cover is less, and more thicker cloud
than the “low” version. (Closer to the observation, slightly, though)
• In global warming, high cloud decrease is more significant in “high” version. It may contribute more to the positive feedback to the global warming than the “low”version.
Future Study
• Find out the mechanisms to cause the difference in high level clouds.
• Quantitative estimate of feedback effect of high cloud by radiative calculations.
• Detailed comparison of upper troposphere clouds with observational data