the role of tcr specificity in the regulation of the
TRANSCRIPT

Washington University in St. LouisWashington University Open Scholarship
All Theses and Dissertations (ETDs)
January 2010
The Role of TCR Specificity in the Regulation ofthe Immune Response to Self and CommensalAntigensStephanie LathropWashington University in St. Louis
Follow this and additional works at: https://openscholarship.wustl.edu/etd
This Dissertation is brought to you for free and open access by Washington University Open Scholarship. It has been accepted for inclusion in AllTheses and Dissertations (ETDs) by an authorized administrator of Washington University Open Scholarship. For more information, please [email protected].
Recommended CitationLathrop, Stephanie, "The Role of TCR Specificity in the Regulation of the Immune Response to Self and Commensal Antigens"(2010). All Theses and Dissertations (ETDs). 194.https://openscholarship.wustl.edu/etd/194

WASHINGTON UNIVERSITY IN ST. LOUIS
Division of Biology and Biomedical Sciences
Program in Immunology
Dissertation Examination Committee: Chyi-Song Hsieh, Chair
Paul Allen John Atkinson Mark Miller
Robert Schreiber Thaddeus Stappenbeck
THE ROLE OF TCR SPECIFICITY IN THE REGULATION OF THE IMMUNE
RESPONSE TO SELF AND COMMENSAL ANTIGENS
by
Stephanie Kay Lathrop
A dissertation presented to the Graduate School of Arts and Sciences
of Washington University in partial fulfillment of the
requirements for the degree of Doctor of Philosophy
August 2010
Saint Louis, Missouri

-ii-
ACKNOWLEDGEMENTS
Foremost, I must thank my mentor, Chyi Hsieh, for freely giving of his time,
ideas and knowledge and being patient as I’ve made my journey here. He has always
been available to lend an ear, advice, or to provide a laugh or a cup of coffee.
The members of the laboratory are the people you rely on every day for ideas,
reagents, and sanity. I heartily thank all the members of the Hsieh lab. In particular I want
to single out the immeasurable assistance and friendship provided by Nicole Bogacki
Santacruz and Chan-Wang “Jerry” Lio. My friend and collaborator Seth Bloom, in the
laboratory of Thad Stappenbeck, has always been very generous with his time and
brilliant ideas, and thereby made the final portion of my thesis work possible. He
received excellent assistance from Nicole Malvin. Another collaborator who has been of
invaluable assistance is Dan Peterson, who as post-doctoral fellow in the laboratory of
Jeff Gordon, and now as an assistant professor at the University of Nebraska, has
generously provided his time, knowledge, ideas and reagents.
I give many thanks to my thesis committee members who have given selflessly of
their time and ideas, and put up with my much-too-long thesis updates. I must especially
thank Thad Stappenbeck for letting me invade his lab and take up his time and that of his
graduate students.
The administrative support staff of the Department of Biology and Biomedical
Sciences, in particular Melanie Puhar, have always been a wonderful resource and given
freely of their time. I also thank Donna Lewis for helping with the unavoidable
paperwork, Jerri Smith who has always taken time for a friendly word and gone out of
her way to lend a hand, Madonna Bogacki and Lorraine Schwartz, wonderful

-iii-
administrative assistants in Rheumatology who have been of additional help to me when I
needed it.
I greatly appreciate Ken Murphy, Teresa Murphy, and the members of the
Murphy Lab for being generous with their time and equipment any time I needed it, and
always making me feel welcome.
The wonderful friends I have made here at Wash U have been and will continue
to be an amazing source of strength to me, and the close-knit community here is a unique
and valuable resource. I particularly want to thank my “girls”, you know who you are,
and you get me through the rough times.
I must thank John F. Kearney at the University of Alabama in Birmingham for
taking me on as a “4th rotation” so many years ago, and setting me on the path of
immunology. I am indebted to David Parker at Oregon Health and Sciences University
for hiring me and then generously continuing my training for the five years I worked in
his laboratory. A large part of my immunology foundation was gleaned from him, as he
never felt it was a waste of time to teach a technician.
My family, though maybe at times bewildered by what I was doing, has always
been unwaveringly supportive, and it is this that has made it possible for me to achieve
my goals. And finally, I dedicate this work to Scott Wetzel, for without him I never
would have believed in myself enough to undertake this journey in the first place.

-iv-
TABLE OF CONTENTS
ACKNOWLEDGEMENTS................................................................................................ii
TABLE OF CONTENTS...................................................................................................iv
LIST OF FIGURES AND TABLES...................................................................................v
LIST OF ABBREVIATIONS...........................................................................................vii
ABSTRACT.......................................................................................................................ix
CHAPTER 1.......................................................................................................................1
INTRODUCTION CHAPTER 2 ....................................................................................................................31
ANTIGEN-SPECIFIC PERIPHERAL SHAPING OF THE NATURAL REGULATORY T CELL POPULATION Preface....................................................................................................................32 Abstract..................................................................................................................34 Introduction............................................................................................................35 Materials and Methods...........................................................................................38 Results....................................................................................................................42 Discussion..............................................................................................................87 CHAPTER 3....................................................................................................................92
THE COLONIC FOXP3+ REGULATORY T CELL REPERTOIRE IS SHAPED BY RECOGNITION OF COMMENSAL GUT BACTERIA Preface....................................................................................................................93 Abstract..................................................................................................................94 Introduction............................................................................................................95 Materials and Methods...........................................................................................99 Results..................................................................................................................106 Discussion............................................................................................................141 CHAPTER 4...................................................................................................................145
SUMMARY AND FUTURE DIRECTIONS REFERENCES...............................................................................................................155

-v-
LIST OF FIGURES AND TABLES
Chapter Two Page Figure 2.1 Generation of the peripheral TCR database................................................43
Figure 2.2 Analysis of the most frequent TCR from each phenotype/location.............45
Figure 2.3 The natural Treg and memory CD44hi TCR repertoires vary by anatomical location............................................................................................47
Table 2.1 Distribution of top TCRs from Foxp3+, CD44lo, and CD44hi populations...50
Figure 2.4 Frequencies of the top TCR from the Foxp3+, CD44hi, and CD44lo
populations.........................................................................................................52
Figure 2.5 The CD44hi, CD44lo, and Foxp3+ Treg repertoires show little overlap.......54
Figure 2.6 Statistical analysis of similarity between different populations..................56
Figure 2.7 Cluster analysis of the total peripheral TCR dataset....................................59
Figure 2.8 Peripheral conversion in nonlymphopenic hosts is infrequent....................62
Figure 2.9 Peripheral conversion of CD4 SP thymocytes vs. CD4+ peripheral T cells.....................................................................................................................65
Figure 2.10 Peripheral conversion resulting from transfer of Foxp3–CD4+ T cells into lymphopenic hosts..............................................................................68
Table 2.2 Comparison of the normal dataset with TCRs found after adoptive transfer of Foxp3– cells into T cell-deficient hosts............................................71
Figure 2.11 TCR specificity is important for peripheral conversion in lymphopenic hosts..................................................................................................................72
Table 2.3 TCRα distribution after lymphopenia-induced proliferation and conversion..........................................................................................................74
Figure 2.12 Reproducibility of TCR-dependent conversion.........................................76
Figure 2.13 TCRs that faciliate peripheral conversion are found in the normal peripheral and thymic Treg cell TCR repertoires...............................................78
Figure 2.14 Recirculation of peripheral CD4+ T cells to the thymus............................81
Figure 2.15 TCRs that facilitate peripheral conversion are found in the normal peripheral and thymic Treg TCR repertoires......................................................85

-vi-
Chapter Three Page Table 3.1 TCR sequences from experiments using pooled animals............................107
Figure 3.1 Foxp3+ Treg TCRs from the colon are unequally distributed....................109
Figure 3.2 Statistical analysis of similarity between populations from different anatomical locations.........................................................................................111
Table 3.2 TCR sequencing of colon T cells from individual animals.........................113
Figure 3.3 Comparison of the colonic TCR repertoire of five individual mice..........114
Table 3.3 TCRs selected to screen for bacterial reactivity..........................................118
Figure 3.4 Examples of screening results of CT7- and G57-expressing hybridoma cells................................................................................................120
Figure 3.5 Screening of hybridoma cells expressing prevalent colon TCRs against a panel of bacterial antigen pools and cecal/colon content preparations......................................................................................................122
Figure 3.6 Reactivity to individual bacterial isolates by hybridomas expressing the CT2, CT6, or CT7 T cell receptors............................................................124
Figure 3.7 Hybridoma reactivity to bacterial antigens is dependent upon presentation of antigen on MHC class II by APC...........................................126
Table 3.4 Summary of reactivity observed for each colon Treg TCR hybridoma tested..............................................................................................128
Table 3.5 Identification of selected bacterial isolates by 16S rRNA sequencing.......130
Table 3.6 TCRs used in thymic development studies.................................................131
Figure 3.8 Foxp3 expression by thymocytes expressing selected Treg TCRs. or a naïve control TCR.....................................................................................133
Figure 3.9 Foxp3 expression by T cells expressing the CT2 TCR in mixed retroviral bone marrow chimeras.....................................................................136
Figure 3.10 Foxp3 expression by T cells expressing the CT6 TCR in mixed bone marrow chimeras.....................................................................................138

-vii-
LIST OF ABBREVIATIONS
ACE abundance coverage estimator
ACP autoclaved cecum/colon content preparation
ALDH1A1 aldehyde dehydrogenase family 1, subfamily A1
ALDH1A2 aldehyde dehydrogenase family 1, subfamily A2
APC antigen presenting cell
APRIL a proliferation inducing ligand
cAMP cyclic adenosine monophosphate
CD Crohn’s disease
CD4 SP CD4 single positive
CDR3 complimentarity determining region 3
CFSE Carboxyfluorescein succinimidyl ester
CLN cervical LN
CTLA-4 cytotoxic T-lymphocyte-associated gene 4
DC dendritic cell
DT diphtheria toxin
EDTA ethylenediaminetetraacetic acid
FACS fluorescence activated cell sorting
Flt3L FMS-like tyrosine kinase 3 ligand
GALT gut-associated lymphoid tissue
GFP green fluorescent protein
GITR glucocorticoid induced TNF receptor
iNKT invariant natural killer T
IBD inflammatory bowel disease
IDO indolamine 2,3-dioxygenase
IEC intestinal epithelial cell
IEL intra-epithelial lymphocyte
IFA incomplete Freund’s adjuvant
IgA immunoglobulin A
IL interleukin
ILF isolated lymphoid follicles

-viii-
IPEX immune dysregulation, polyendocrinopathy, enteropathy, X-linked
IRES internal ribosome entry site
LP lamina propria
LN lymph node
MadCAM1 mucosal addressin cell adhesion molecule 1
MLN mesenteric LN
MAIT mucosal associated invariant T
MHC major histoincompatibility complex
NF-κB nuclear factor-kappaB
NLR nucleotide-binding oligomerization domain (NOD)-like receptors
NOD2 nucleotide-binding oligomerization domain 2
ODN CpG oligodeoxynucleotides
OVA ovalbumin
PBS phosphate buffered saline
PGE2 prostaglandin E2
PRR pattern recognition receptors
RA retinoic acid
rRNA ribosomal ribonucleic acid
SIGIRR single-immunoglobulin-domain-containing interleukin-1 receptor-related
protein
SPF specific pathogen free
TCR T cell receptor
Teff effector T cell
TGFβ tumor growth factor beta
TLR toll-like receptors
TNF tumor necrosis factor
Treg regulatory T cell
TSLP thymic stromal lymphopoietin
UC ulcerative colitis

-ix-
ABSTRACT OF THE DISSERTATION
The immune system must be able to fight potentially pathogenic microbial
invaders without mounting an attack on its own tissues, food antigens, and harmless or
beneficial commensal species. Despite the elimination of many self-reactive T cells in the
thymus, some T cells with the ability to recognize self and potentially cause autoimmune
disease are present in the periphery. The population of CD4+ regulatory T cells (Treg)
expressing the transcription factor Foxp3 are required to actively maintain homeostasis of
the immune system, but it is uncertain whether their function is antigen-specific. These
studies address the repertoire of the variable T cell receptor expressed on each T cell, in
an attempt to understand the role of specificity in the maintenance of tolerance. By
sequencing of the TCRα chain on cells expressing a fixed TCRβ chain, we are able to
compare the repertoire of TCRs on T cells from different populations.
These studies revealed that Treg use a repertoire of TCRs distinct from that of the
CD4+CD44hi activated/memory or CD44lo naïve T cell subsets, and that it varies
considerably depending upon the location of the cells. This data suggests that Treg home
to and/or develop in areas in which they recognize antigen, presumably self antigens on
the tissues which they protect. Most Treg develop their regulatory phenotype in the
thymus; however, it is known that mature T cells can develop into Treg outside of the
thymus, a process termed peripheral conversion. While we see evidence of a very small
amount of contribution by peripheral conversion to the Treg repertoire of the spleen and
lymph nodes, it has been proposed that the gut immune system is a major site of
conversion. Therefore we studied the TCR repertoire of the colon, and indeed find that

-x-
the colonic Treg TCRs are very unique, and many of them recognize commensal bacterial
antigens. We further show that thymocytes expressing these TCRs do not upregulate
Foxp3 expression in the thymus, and for two of these TCRs, we show that Foxp3
expression depends upon the composition of the intestinal microbiota. Therefore, our data
supports a model in which Foxp3+ regulatory cells show antigen specificity for the tissues
they protect, and in some cases develop in situ, allowing for tolerance to antigens that are
not thymically presented.

- 1 -
CHAPTER ONE: INTRODUCTION
CD4+ Foxp3+ Regulatory T Cells Maintain Immune Homeostasis

-2-
The need for T cell regulation
An essential feature of the adaptive immune system is the potential of T cells to
recognize virtually any antigen. While this allows for the development of an immune
response to a wide and constantly changing range of pathogens, it leaves open the
possibility of T cells reactive to antigens derived from the self, as well as non-harmful
foreign antigens derived from food, non-pathogenic, and beneficial commensal
organisms. Therefore, there must exist mechanisms by which an immune response to
these antigens is prevented, while still allowing for a response to potentially harmful
organisms; the ability to discern self from non-self.
Central tolerance is the first line of defense against self-reactivity. Developing T
cells in the thymus express a unique T cell receptor whose amino acid sequence is the
product of gene segment rearrangement as well as random nucleotide addition and
subtraction. The newly created receptor expressed by the developing T cell is then tested
for the ability to recognize self-peptides presented by a major histocompatility complex
(MHC). Those T cells expressing a receptor unable to productively interact with
available pepetide and MHC complexes (pMHC) do not survive, ensuring that only
potentially useful T cells are contributed to the mature T cell pool. However, those T
cells whose TCR reacts too strongly to these complexes are eliminated, in a process
coined negative selection. This ensures that most T cells released from the thymus do not
react strongly to self antigens.
In spite of this process, however, there are T cells in the periphery capable of
recognizing self-antigens and contributing to the development of autoimmune diseases
[1]. This is attributed to the limitations of thymic negative selection; it is impossible for a

-3-
developing T cell to encounter every potential self-peptide/MHC complex that it might
later encounter in the body, and not all self peptides are present in the thymus. Therefore,
other mechanisms are required to keep these potentially self-reactive T cells in check.
These self-reactive T cells can be rendered unresponsive, a state termed anergic, in the
periphery or may be sequestered from their cognate antigen and therefore remain ignorant
[1].
In addition to these mechanisms, the existence of a “dominant” form of regulation
mediated by a population of dedicated regulatory cells was proposed in the early 1970s
[2, 3]. Several groups observed that T cells could not only augment but also dampen
immune responses, and it was believed that this regulation was mediated by a unique
population of T cells coined “suppressor T cells”. These cells gained quick acceptance
and a flurry of reports on the nature of these cells and their functions were published in
the 1970’s and early 1980’s. However, the development of new molecular biology
techniques in the 1980’s began to cast doubt on the findings of these reports, particularly
as some current beliefs about the structure of the MHC locus were proved to be incorrect
[4]. Consequently, the field of “suppressor” T cells lost momentum and the support of
most immunologists. However, studies in the 1990’s again began to report about a subset
of T cells with suppressive capabilities, and to avoid the stigma of the earlier studies
these were eventually coined “regulatory” T cells [2, 3]. It is now thought that these cells
are one in the same with the suppressor cells of the 1970s, but improvements in
technology that allow for better characterization of these cells have led to their wide
acceptance, and much has been discovered about their nature.

-4-
Foxp3+ CD4+ regulatory T cells
Attempts to identify the population of regulatory T cells grew out of studies of the
autoimmunity induced upon the transfer of populations of T cells into lymphopenic SCID
or nude mice. Experiments reported in 1985 by Sakaguchi et. al. showed that the
CD5hiCD4+ T cells contained the ability to prevent autoimmunity [5], and in 1990 it was
shown that CD45RClo CD4+ T cells prevented disease in athymic rats [6]. Other studies
identified this population as RT6.1+ T cells [7] or CD45RBlowCD4+ T cells [8, 9] in mice.
Then, in 1995, CD25 (IL-2 receptor α-chain) was identified as a marker for a subset of
CD4+ T cells contained in the CD5hi and CD45RBlo fraction, and depletion of the CD25-
expressing cells from a splenic cell suspension before transfer into a nude mouse
produced a high incidence and wide range of autoimmune diseases in these recipient
mice [10]. Purified CD25+ CD4+ T cells were subsequently shown to be capable of
suppressing autoimmunity and effector T cell responses in a wide variety of systems.
While CD25 proved to be a good marker for regulatory T cells and its discovery
pushed the field of regulatory T cells forward, its expression is not limited to this cell
population alone, as it is transiently upregulated on all T cells upon activation. In
addition, these cells were found to express high levels of other molecules previously
identified as markers of T cell activation, such as the glucocorticoid induced TNF
receptor (GITR) [11, 12], and cytotoxic T-lymphocyte-associated gene 4 (CTLA-4) [13,
14]. Therefore, the search for a more specific indicator of the regulatory T cell lineage
continued. In 2001, the transcription factor Foxp3 was identified as the defective gene in
the scurfy mouse, a spontaneous mutant mouse known to develop severe autoimmunity as
a result of an X-linked mutation [15]. Two years later, Foxp3 was found to be expressed

-5-
exclusively in the CD25+CD4+ regulatory T cell subset, and became the first, and to date
only, gene known to be exclusively expressed in these cells [16-18]. Identification of
Foxp3 as a definitive marker of regulatory T cells greatly facilitated the further study of
this population, particularly once identification of these cells was simplified by the
engineering of mice co-expressing Foxp3 with a fluorescent protein or a fusion of Foxp3
with green fluorescent protein (GFP) [19-21].
The “Natural” Regulatory T Cell
It is now known that there are several types of lymphocytes possessing regulatory
activity [22]. CD4+ regulatory T cells are often designated as “natural” Treg if they
express Foxp3 and develop in thymus, and “induced” Treg if they are Foxp3– and are
thought to differentiate in the periphery. Among these “induced” regulatory cells, there
are several subtypes, based upon their ability to produce inhibitory cytokines. T cells that
are induced in the gut after low doses of orally-administered antigen and produce TGFβ
are termed “Th3” cells [23], while cells that produce large amounts of IL-10 are called
“Tr1” cells [24]. Tr1 cells were first described after culture of T cells with antigen in the
presence of IL-10, but have since been described as prevalent in the gut, particularly the
small intestine [25], and also produce TGFβ, calling into question the distinction of their
role from that of Th3 cells.
In addition to traditional CD4+ regulatory T cells, regulatory activity has been
ascribed to other subsets of T cells, such as certain subsets of CD8+ cells (CD8αβ or
CD8αα), γδ T cells, invariant natural killer T (iNKT) cells, and mucosal associated
invariant T (MAIT) cells. Most of these have been described as playing a role in gut

-6-
tolerance [26]. Although poorly understood, these cells generally express an TCR
displaying limited or no variation and recognize non-classical MHC molecules. Their
mechanisms of regulation may involve interaction with the epithelial cell barrier or
cytotoxic effects on antigen presenting cells.
The importance of Foxp3+ Treg in tolerance
While regulatory cells that do not express Foxp3 have been shown to be involved
in the regulation of effector T cell responses, particularly at mucosal sites such as the gut,
it has been shown that they are not sufficient to maintain tolerance in the absence of
Foxp3+ Treg. The scurfy mouse was first described as the result of a naturally-arising X-
linked mutation in a strain of mice in the 1950s. This mouse exhibited spontaneous,
severe autoimmunity and inflammation which resulted in the death of the animals by
about four weeks of age, and resembled the human disease immune dysregulation,
polyendocrinopathy, enteropathy, X-linked (IPEX) syndrome [15, 27]. The CD4+ T cells
from these mice were capable of mediating disease upon transfer into lymphopenic SCID
or nude mice, much like CD4+CD25– cells, and were hyperproliferative in vitro [28]. It
was soon discovered that the mutant protein involved was the transcription factor Foxp3,
resulting in the absence of Treg. Mutations in the human equivalent of this transcription
factor are also responsible for reduced or absent Treg function in the human IPEX
syndrome [29]. Therefore, in both mice and humans, Foxp3+ Treg are absolutely essential
for the prevention of widespread autoimmunity. The need for the continual presence of
these cells in order to restrain self-reactive T cells was further confirmed by the creation
of a mouse that expressed the human diphtheria toxin (DT) receptor on cells expressing

-7-
Foxp3, allowing for the deletion of these cells upon administration of DT. At any age, the
administration of DT caused a rapid induction of rampant autoimmune syndromes,
resulting in the death of the animals within 2-3 weeks [30].
Thymic development of Foxp3+ Treg
As mentioned above, one criteria for the definition of a “natural” Treg is that they
develop this phenotype during thymic development. The first clue that Treg indeed
develop in the thymus was the model of autoimmunity induced upon thymectomy of
mice at neonatal day 3 [31]. It was later confirmed that Treg are slightly delayed in their
initial release from the thymus as compared to naïve, non-Treg cells, leaving these mice
relatively deficient in Treg and resulting in disease [32]. A comparison of the repertoires
of T cell receptor (TCR) sequences found on thymic CD4+Foxp3+ T cells and those found
in the periphery (spleen and lymph nodes) showed a high similarity between these
populations, suggesting that most or all Treg originate in the thymus [33-35].
During T cell development in the thymus, TCRs, which are the product of
randomly rearranged gene segments, interact with self-peptides presented by major
histocompatibility (MHC) molecules expressed on thymic stromal cell or thymic
dendritic cells (DC). If the TCR is unable to interact productively with the MHC, the
developing T cell dies; as long as the interaction is above a certain threshold the cell
receives a survival signal, or is “positively selected”. This ensures that only T cells
capable of productive interactions with the MHC molecules enter the T cell pool.
However, if the TCR recognizes the self-peptide/MHC complexes too strongly it receives

-8-
a death signal, or is “negatively selected”, to prevent this potentially self-reactive T cell
from being released from the thymus and possibly causing disease.
Regulatory T cells are thought to be selected in the thymus based upon an affinity
to self-peptide/MHC complexes that lies somewhere just below the threshold of negative
selection, but higher than most non-regulatory T cells. The theory that a developing Treg
must recognize its cognate peptide/MHC complex is supported by studies showing the
increased Treg selection in TCR transgenic mice after expression of the antigen
recognized by this TCR in the thymus of the mice [36]. An increased prevalence of self-
reactive TCRs among thymic Treg TCRs has been demonstrated by the transfer of T cells
expressing Treg TCRs vs. non-Treg TCRs into lymphopenic hosts [37]. In these
experiments, those T cells expressing Treg TCRs more often proliferated in response to
unknown self-antigens encountered in the host animal. It is assumed that recognition of
self-antigens by thymically derived Treg protects the tissues expressing those antigens
from autoimmune attack.
Peripheral development of Foxp3+ Treg
Although it seems most natural Treg found in the periphery of the mouse were
selected into this lineage within the thymus, it has become clear that in certain situations
Foxp3– cells can develop into Foxp3+ T cells which are phenotypically indistinguishable
from thymically derived Treg. This process has been coined peripheral “conversion” of
non-Treg into Treg. The circumstances under which it has been reported in vivo are
mostly those of antigen presentation under suboptimal, or “tolerizing” conditions. These
include the oral, intravenous, or prolonged subcutaneous administration of cognate

-9-
peptide in the absence of adjuvant [38, 39]; transplantation tolerance under the cover of
blocking antibodies; direct delivery of antigen to DEC-205+ DCs (using a DEC-205
antibody-antigen fusion)[40]; and the transfer of TCR transgenic (Tg) T cells into a
recipient that expresses the cognate antigen [41]. In addition, the transfer of CD4+CD25–
T cells into either a lymphopenic [42] or a non-lymphopenic [43] host will induce the
development of T cell population stably expressing CD25.
While these experiments have demonstrated that non-regulatory cells have the
ability to become Foxp3+ regulatory cells outside of the thymus, it remains unknown how
prevalent this is under steady-state conditions in a normal individual. A few studies have
attempted to address this. The aforementioned transfer of CD4+CD25– T cells into a
wild-type congenically marked host reported about 5-12% of transferred cells became
CD25+ by six weeks post transfer [43]. The resulting cells were capable of inhibiting
proliferation of effector cells in an in vitro proliferation assay. However, the use of CD25
as the sole marker for Treg makes it likely that these results could over-estimate the
amount of conversion in the system. Studies looking at the TCR repertoires of Foxp3+
and Foxp3– CD4 single-positive (SP) thymocytes versus peripheral Treg and non-Treg
populations showed little evidence of conversion [34]. Additionally, an attempt to track
the phenotype of TCR transgenic T cells specific for a pancreatic antigen which also
express a secondary TCRα chain did not reveal that TCRα chains seen on the Foxp3–
population in the thymus became part of the Foxp3+ population after exposure to the
pancreatic antigen in the periphery[35].
While current data is inconsistent about the contribution of peripheral conversion
to the normal Treg repertoire, it is easy to imagine a role for conversion in particular

-10-
situations of novel antigen encounter. The peripheral development of regulatory T cells
could potentially fill the role of mediating tolerance to food antigen, commensal
microbiota, and any other self or harmless foreign antigen which would not be found in
the thymus. Indeed, a study of oral tolerance in which Foxp3– OVA-specific TCR
transgenic T cells (expressing the Foxp3gfp fusion protein) were transferred into a
sublethally irradiated host subsequently fed OVA protein showed the induction of Foxp3
expression on donor T cells in the small intestine lamina propria (LP) and mesenteric
LNs [44]. This supports a role for peripheral conversion in the maintenance of tolerance
to non-thymic antigens at mucosal sites such as the gut.
It has also been postulated that Treg recognizing foreign antigens routinely
develop from activated effector cells during an immune response, in order to dampen
down and prevent the response from getting out of control, and as source of
replenishment for the Treg pool [45]. A role for Treg in balancing a potentially
overzealous immune response has been shown in many types of infections, although the
character and source of the Treg involved is unknown [46]. Treg accumulated at the site
of infection have been shown to be specific for microbial antigens in Leishmania major
infection of mice [47], although it is unknown what the source of these Treg is. After
adoptive transfer of TCR transgenic T cells specific for a particular peptide/MHC
(pMHC), intradermal immunization of a protein containing the peptide was shown to
cause the accumulation of donor-derived TCR transgenic T cells of both Treg and IFNγ-
producing effector cell phenotypes, both of which were shown to recognize the cognate
peptide/MHC complex by tetramer staining [48]. However, the use of incomplete

-11-
Freund’s adjuvant (IFA) in this study calls into question the relevance of this model to a
microbial infection in which antigen would be presented in the context of TLR ligands.
Mechanisms of suppression by Treg
Several mechanisms by which Treg may suppress immune responses have been
reported [49, 50]. These can be divided according to whether the suppressive effect is
directly on the effector T cells (Teff) in a contact dependent or independent way, or
indirect via an alteration of the antigen presenting cells (APC). There seems to be no
single, definitive mechanism by which Treg can suppress; it seems, instead, that they rely
on a broad combination of actions whose role and importance vary according to the
situation.
In in vitro suppression assays, contact between the Treg and the Teff cells appears
to be required, as separation by a permeable membrane abrogates the suppressive effect
[51]. In these studies, the presence of APC in the culture was not required. Contact-
mediated effects may involve the delivery of cytoplasmic cAMP from the Treg to the
Teff by contact via gap junctions [52], or granzyme B-dependent killing [53]. However,
this need for direct contact is not supported by in vitro and in vivo imaging studies in
which the Treg and Teff cells are not shown to interact stably [54]. A recent report argues
that the contact with the target T cell may actually provide the Treg with additional
suppressive capabilities, such as the ability to secrete cytokines, and after this initial
contact it may suppress in a contact-independent manner [55].
Another mechanism by which Treg could suppress is by the production of
inhibitory cytokines. While the blockade of the inhibitory cytokines IL-10 and TGFβ was

-12-
not reported to affect suppressive function in vitro [51], a role for these cytokines has
been reported in several in vivo systems. The suppressive ability of Treg in a model of
airway hyper-reactivity, as well as in various infections, depended upon IL-10, but in
these cases the Treg themselves were not the source of the IL-10 [56-58]. However, in
models of IBD, IL-10 production by the Treg themselves is absolutely essential for
disease prevention. In addition, TGF-β also appears to be required for prevention of IBD,
as Teff lacking the TGF-β receptor are refractory to Treg-mediated suppression in models
of IBD [59, 60].
Another, more recently discovered Treg-produced inhibitory cytokine is IL-35
[61]. It is preferentially expressed by Treg, and its production is upregulated when they
are actively suppressing. Treg deficient in either protein that makes up this heterodimeric
cytokine show reduced regulatory activity in vitro, and are unable to control homeostatic
proliferation or IBD in vivo. In addition, ectopic expression of this cytokine by naïve T
cells caused them to gain regulatory activity, and addition of recombinant IL-35 can
suppress proliferation in vitro. Although not much is known about this cytokine, it is
likely to be an important player in Treg-mediated suppression.
Treg may also create a local environment that is unfavorable for effector T cell
development. Treg may take up the IL-2 in their vicinity via their constitutive expression
of the high-affinity IL-2 receptor α chain, CD25, leaving their immediate environment
deficient in IL-2. This could cause the apoptosis of target cells as a result of cytokine
deficiency, a theory that is supported by reports of Teff apoptosis following exposure to
Treg in a process that depends upon expression of the pro-apoptotic factor Bim in the
Teff [62]. Additionally, Treg have been shown to express high levels of the ectoenzymes

-13-
CD39 and CD73, which catalyze the breakdown of extracellular ATP or ADP into
adenosine [63]. Adenosine binds to the adenosine receptor 2A on Teff and can inhibit
their function.
Treg may also mediate their suppressive effects by altering the function of the
APC, particularly dendritic cells (DC), that present the antigens to the target T cells.
Intravital microscopy has revealed direct interactions between antigen-specific Treg and
DC in vivo within hours after transfer [64, 65], and the presence of Treg shortens the
interactions between Teff and DC (65). These interactions may directly inhibit the ability
of Teff to interact with DC (by “crowding”), as well as directly alter the characteristics of
the DC as to reduce its ability to subsequently present antigen to the Teff, and/or cause it
to enhance the proliferation and generation of Treg.
In terms of decreasing the DC’s ability to activate a Teff cell, Treg have been
shown to condition DC to express indolamine 2,3-dioxygenase (IDO), which can cause
suppression by breakdown of tryptophan into pro-apoptotic molecules [66]. Additionally,
interaction with Treg has been shown to result in a downregulation of the costimulatory
molecules CD80 and CD86 on the DC, thereby inhibiting its ability to activate a naïve T
cell [67]. These effects on DC are dependent upon the expression of CTLA-4 by the
Treg, which engages CD80 and/or CD86 on the DC; in the absence of CTLA-4
expression or in presence of blocking antibody there was a reduction of Treg-mediated
suppression via DCs [13, 68].
It is also possible that the Treg is able to change the phenotype of the DC to
become “tolerogenic”. Treg have the potential to activate latent TGF-β on the surface of
DC by their production of the enzyme furin in response to environmental IL-12, and this

-14-
TGF-β may then go on to promote the differentiation of conventional T cells into Foxp3+
Treg [69]. This could help to explain the phenomenon of infectious tolerance, by which
Treg with one specificity can go on to promote tolerance to a second antigen presented on
the same tissue or cell [70, 71]. In these situations, the original population of Treg is then
no longer required to maintain tolerance, suggesting that T cells of a new specificity were
generated.
The absence of any one of the aforementioned molecules does not cause a
complete of loss of suppressive activity akin to a Foxp3 deficiency; this leads to the
theory that all of these mechanisms play but a part in the overall ability of Treg to
maintain order. It has been postulated that different mechanisms of suppression come into
play during different scenarios; in the most “challenging” situations, all of these
mechanisms may need to work together to keep the immune system fully in check [49].
For example, in the case of inflammatory bowel disease (IBD), an array of mechanisms
may be required due to the great inflammatory potential of this microbial-laden mucosal
surface, while a more slowly progressing autoimmune disease in a sterile organ, such as
type I diabetes, may not require as many suppressive mechanisms to control.
T cell receptor specificity in Treg function
There has been some controversy over the need for regulatory T cells to
specifically recognize an antigen from the same cells or tissues to which it is preventing
an inappropriate immune response. Some reports suggest that the mere presence of a Treg
of any specificity will suppress the effector T cells in the vicinity, such as in a model of
autoimmune gastritis that was prevented by the transfer of polyclonal, wild-type Treg

-15-
[72]. This may be due to the “bystander effect”, in which a Treg is activated by
recognition of antigen and can then go on to suppress cells of other specificities [73].
However, in a follow-up report the same group reported that antigen-specific Treg were
much more efficient at preventing disease [74]. The very opposite has also been reported,
in a system where TCR transgenic Treg cells of known antigen specificity only
suppressed cells with the same antigen specificity [75]. And while several reports have
established a need for TCR engagement for Treg function [51, 76], there is also a report
showing that Treg can suppress T cells with a completely different antigen specificity, in
the absence of TCR engagement [77].
Evidence for antigen specificity in the Treg population has been observed in
models which show a lack of suppressive capability for a tissue or organ which is absent
in the animal in which the Treg developed. For example, in the prevention of
autoimmune prostatitis due to day 3 thymectomy, T cells isolated from male mice were
more effective than those from female mice or from males that had been orchidectomized
just after birth [78]. Similarly, in a model of autoimmune thyroiditis in rats, disease was
prevented by the transfer of a CD4+ regulatory subset from rats with an intact thyroid but
not by cells from rats whose thyroids were ablated in utero by 131I treatment [79]. These
studies suggest that the development and/or maintenance of Treg capable of controlling
autoimmunity of a particular tissue depends upon the presence of that tissue.
A skewing towards self-antigen reactivity has been demonstrated for Treg [37],
supporting the hypothesis that Treg maintain tolerance by direct recognition of the
antigens of the cells and tissues they are protecting. Additionally, it has been shown that
Treg capable of preventing autoimmunity of a particular organ are found preferentially in

-16-
the draining LN of that organ [80]. However, another report argues that there are no more
self-reactive TCRs found within the Treg repertoire than the non-Treg repertoire, and that
most, in fact, could be shown to be non-self antigen responsive [81]. Although this study
uses an extremely reduced repertoire of TCRs, and its most compelling data relies on
TCRs selected in an environment in which the MHC display only a single self-peptide, it
casts doubt on the assumption that the Treg population is highly enriched in self-specific
T cells.
Studies of the repertoires of the Treg and non-Treg populations in the peripheral
lymphoid organs of mice have reported a varying degree of overlap in the T cell receptors
used by, and presumably the antigen specificities of, the two subsets [33-35]. This
variability in results may be due to the different systems used by these groups.
Additionally, a more recent study suggests that these overlapping TCRs may belong to
“unstable” Treg, which tend to express lower levels of Foxp3 and appear to be the result
of conversion of non-Treg cells into Foxp3+ T cells [82]. All of these studies, however,
agree that the TCR repertoire is not the same between the two populations, indicating that
they develop differently.
The highly specialized immune system of the gut
The digestive tract is a portion of the body that presents a unique challenge to the
immune system; it must prevent disease caused by infectious organisms at this
environmental interface, while maintaining tolerance to the many beneficial and non-
harmful organisms that are colonized there. It is estimated that the lower gastrointestinal
tract of the mammal is one of the most complex microbial ecosystems on the planet,

-17-
harboring over 100 trillion bacteria of 500-1000 different species [83, 84]. The immune
system must allow the colonization of beneficial symbionts, which provide host benefits
such as supplying essential nutrients, metabolizing otherwise undigestible compounds,
and defending against colonization by pathogenic bacteria. On the other hand, it must still
be capable of recognizing and fighting pathogenic microorganisms to fight disease. When
the ability to appropriately balance these two goals breaks down, the immune system can
inappropriately target commensal organisms, resulting in inflammatory bowel diseases
(IBD) such as Crohn’s disease (CD) or ulcerative colitis (UC).
The commensal microbiota is composed of members from all three domains of
life – eukarya, archaea and bacteria. However, the bacteria are the dominant organisms
present. The bacteria are acquired during a short period of initial colonization beginning
immediately after birth, and by adulthood there is a relatively stable community of
bacteria which can vary from individual to individual, in a way that appears to be partly
influenced by genetics and partly by environment [85]. The amount of bacteria present
depends on the location, with there being very little in the stomach and proximal small
intestine, with increasing amounts in the distal small intestine and colon, resulting in a
density of approximately 109 – 1012 per ml of luminal contents.
Sequencing of the 16S rRNA of the intestinal microbes has allowed for the
identification of the bacteria that typically inhabit the gut, regardless of the ability to
culture them in the laboratory. These studies have identified members of the gram-
positive, anaerobic phylum Firmicutes as the most prominent, with the gram-negative
Bacteroides as the next most prevalent [86]. The remaining phyla make up less than ten
percent of the population, and include Actinobacteria, Proteobacteria, Fusobacteria and

-18-
others. The fact that many of these are facultative aerobes may put them at a competitive
disadvantage and explain their relatively low abundance in the anaerobic environment of
the gut [87].
The barrier which separates the gut lumen and its microbial contents from the
body is composed of a single layer of intestinal epithelial cells (IEC) connected by tight
junctions. Also included in this epithelial layer are the goblet cells, responsible for
secreting the mucin that forms a layer of mucus which coats the lumen, and the Paneth
cells, specialized antimicrobial peptide secreting cells found in the base of the crypts of
the intestine [88]. The mucus that coats the lumen can extend up to 150µm from the
epithelial surface. Its innermost layer is resistant to bacterial penetration and likely also
retains secreted antimicrobial peptides, therefore serving as an additional barrier to the
bacteria that inhabits the lumen [87].
Also incorporated into the epithelial layer are the specialized microfold or “M”
cells, which transporter luminal antigens across the epithelial barrier to the underlying gut
associated lymphoid tissues (GALT). This provides a source of antigen for the dendritic
cells (DC) of the GALT, which can then present them to the resident T cells. The
epithelium also includes a population of specialized T cells, the intraepithelial
lymphocytes (IEL), which are largely of the “unconventional” CD8αα+ (CD8β–) type,
many of which express TCRγδ and may assist in the clearing of stressed or damaged IEC,
and contribute to tolerance by secreting TGFβ upon activation [89]. A population of DC
have also been described to form tight-junction-like structures with the IECs and project
dendrites into the lumen in order to sample antigens directly [90].

-19-
Beneath the epithelium in the lamina propria, the loose connective tissue which
supports the delicate epithelium, are most of the more conventional immune cells of the
GALT. Organized lymphoid structures include the Peyer’s patches of the small intestine
and the isolated lymphoid follicles (ILF) of the colon. These serve as the site of T cell
interaction with antigen-loaded DC, which are known to acquire antigens from the
intestinal lumen [91, 92]. In addition, B cells are located in these follicles, as well as
throughout the lamina propria, and produce secretory IgA antibodies which are
transcytosed across the epithelium by the IEC [93]. These antibodies help to keep the
intestinal bacteria in the lumen, as shown by increased penetration of symbiotic bacteria
into the tissues of IgA deficient mice [94, 95].
The intestinal epithelial cell interaction with the commensal microbiota
The microorganisms that peacefully reside in the gut are not just tolerated; they
constantly interact with and influence the host. With such a large reservoir of
microorganisms in constant contact with host mucosal surfaces, it is not surprising that
they have been shown to have an important impact on the immunology of the gut for the
benefit of both the host and the resident gut organisms. Studies with germ-free and
gnotobiotic mice have shown that recognition of the commensal microbiota is necessary
for the normal development of both the mucosal and peripheral immune system [85].
Germ-free mice exhibit poorly formed Peyer’s patches, smaller mesenteric lymph nodes
(MLN), impaired development of isolated lymphoid follicles (ILFs), altered composition
of the CD4+ T cells and IgA-producing B cells in the lamina propria, and an absence of
MAIT cells which normally reside in the lamina propria [96, 97]. Additionally, the IEC

-20-
exhibit a reduced rate of cell turnover, and altered microvilli formation in germ-free
animals [96].
The IEC are the most abundant cells to have direct contact with the microbiota,
and they play an important role in maintaining intestinal immune tolerance. Their first
role is to provide a barrier between the bacteria of the gut and the immune system of the
host. However, the IEC can also sense the bacteria by their expression of pattern
recognition receptors (PRR), such as toll-like receptors (TLR) and nucleotide-binding
oligomerization domain (NOD)-like receptors (NLRs), which bind to a variety of
conserved ligands derived from microorganisms [98]. The hyporesponsiveness of these
cells is thought to be a result of several strategies, one simply being the limited contact
with bacteria, which find it difficult to penetrate the layer of mucus which lines the
lumen. Mice which lack production of mucin suffer from intestinal inflammation,
presumably as a result of their inability to form this relatively bacteria-free zone adjacent
to the epithelium [99].
In an additional mechanism to minimize reactivity to the bacteria, the expression
of TLRs by the IEC is generally quite low, while increased expression is seen in inflamed
intestines, such as in patients with Crohn’s disease [100]. The TLR expression on the IEL
may also be limited in order to minimize engagement of bacterial-derived ligands. For
example, it has been shown that TLR5 expression is normally limited to the basolateral
side; therefore, TLR5-mediated activation will only occur in response to bacteria that
have breached the epithelial barrier [101]. In contrast, TLR9 has been shown to be
expressed on both the apical and basolateral sides of the IEC (unlike in immune cells, it
does not reside in endosomes), and the response to engagement of the receptor in the two

-21-
locations is opposite. When administering CpG oligodeoxynucleotides (ODN), a ligand
for TLR9, on the basolateral side of the cell, NF-κB was activated and led to the secretion
of the inflammatory cytokine IL-8 [102]. However, when TLR9 was engaged on the
apical surface, NF-κB was inhibited. This sort of spatial segregation can emphasize
tolerance to bacteria encountered in the lumen, but still allow for a vigorous immune
response to bacteria that have breeched the epithelial barrier.
The IEC also appear to actively dampen the response to engagement of TLRs and
other PRR when it does occur. For example, IEC express a negative regulator of TLR and
IL-1R signaling called SIGIRR (single-immunoglobulin-domain-containing interleukin-1
receptor-related protein), and in the absence of this they express an increased level of
pro-inflammatory genes, and increased susceptibility to commensal bacteria-dependent
intestinal inflammation [103]. They also express the protein A20, which acts to inhibit
NF-kB activation, and mice deficient in A20 develop severe intestinal inflammation [104,
105]. It is also thought that certain commensal bacteria are capable of actively
suppressing the immune response by inhibiting NF-kB activation. Both nonpathogenic
Salmonella strains and Bacteroides thetaiotamicron have been shown to interfere with
NF-kB activation, although by different mechanisms [106, 107]. In addition, some
products of commensal bacteria metabolism are immunomodulatory, such as butyrate
that is produced by the digestion of starch, which can inhibit the production of pro-
inflammatory cytokines [108].
IECs respond to contact with bacteria in ways which impact and instruct the
immune system. Engagement of TLRs can cause NF-kB activation, leading to the
increased production of thymic stromal lymphopoietin (TSLP), which is thought to have

-22-
a tolerogenic effect on the intestinal DC [109, 110]. TSLP has been shown to restrict the
production of IL-12 and promote IL-10 production by DC, and therefore may play a vital
role in conditioning lamina propria DC to be tolerogenic. IEC also produce TGFβ, which
can inhibit the expression of pro-inflammatory cytokines by macrophages and DC, and
inhibit the expression of MHC class II and costimulatory molecules [111, 112]. The
production of prostaglandin E2 (PGE2) by the IEC can contribute to the maintenance of
tolerance to dietary antigens, by an unknown mechanism involving the inhibition of T
cell proliferation [113]. This may be due to the induction of IL-10 and IDO production by
DC [114, 115]. Upon TLR engagement IEC can also influence B cells by the production
of APRIL, a B cell stimulating factor which can promote plasma cell survival and class
switching to IgA [116]. IEC also express MHC class II molecules, and while they lack
the costimulatory molecules necessary to prime naïve T cell responses, they are capable
of activating antigen-experienced T cells, and may induce anergy in naive T cells due to
this lack of costimulation [117]. Antigen processing and presentation by IEC has been
shown to occur in a polarized fashion, with antigens obtained on the apical side of the
cell and presented on the basolateral side [118].
The Unique Role and Properties of Intestinal Dendritic Cells
Antigen presenting cells are also in contact, both directly and indirectly, with the
commensal microbiota and are central to mediating the immune response to it. The
dendritic cells (DC) found in the intestine are different in their phenotype and functional
properties than those found elsewhere in the body, and multiple types have been
identified. These are generally identified by their high expression of CD11c, and then by

-23-
the expression of either CD11b, CD8α, or neither, forming three main categories of
conventional DC in the gut immune system [119, 120]. These different subsets tend to be
found in different locations, with the CD11b+ DC concentrated in the sub-epithelial dome
of the Peyer’s patch, and the CD8α+ DC in the interfollicular regions. There are also
many DC present in the lamina propria of the small intestine, but in the colon most DC
are found within the isolated lymphoid follicles (ILF) under steady state conditions [121].
The DCs can obtain antigens from the commensal microbiota in multiple ways.
The CD11b+ DC located in the sub-epithelial dome are positioned to receive bacteria and
bacterial antigens transported from the gut lumen by M cells. This subset has a higher
capacity to produce IL-10 and to prime a TH2 (rather than TH1) T cell response to
infection, and therefore may help mediate tolerance to the gut antigens constitutively
transcytosed by the M cells [120]. Uptake of small numbers of commensal bacteria by
this route has been shown to induce production of IgA, which would serve to limit
bacterial penetration, and therefore may limit the potential for destructive inflammatory
responses to develop to the bacteria [95]. Lamina propria DC expressing the chemokine
receptor CX3CR1 can also form tight-junction-like structures with the IEC and extend
dendrites through the epithelial barrier to directly sample luminal contents [90]. This
ability to penetrate the epithelium may also allow for DCs to engulf apoptotic epithelial
cells, and thereby process and present antigens from them.
DCs which take up antigen in the intestine may constitutively migrate to the
MLN, where they can present antigen to T cells. These DC have obtained antigen in close
proximity to the IEC, and as discussed earlier, may be affected by the production of
tolerogenic molecules by the IEC under non-inflammatory conditions. Intestinal dendritic

-24-
cells can be subdivided by their expression of the αE integrin, CD103. Those which
migrate through the lymph to the MLN tend to be CD103+, while the CD103– subset
found in the MLN are thought to be resident DC which have developed from blood-borne
precursors. CD103+ DC have the ability to promote expression of the gut-homing
receptors α4β7 (which binds to MadCAM1 on the vascular endothelium of the
gastrointestinal tract) and CCR9 (whose ligand CCL25 is produced by IEC) on CD4+ T
cells, likely including regulatory T cells which are induced in the lymph nodes [122,
123]. CD103+ DC carrying antigens from the intestine are implicated in the development
of Foxp3+ Treg from naïve Foxp3– T cells; CD103+ DC isolated from the MLN were
shown to mediate the development of Treg in vitro in a TGFβ-dependent manner, while
the CD103– subset did not [124]. In one study, bone marrow-derived dendritic cells
(BMDC) were capable of internalizing the commensal bacterium Lactobacillus
rhamnosus while maintaining an immature phenotype, and were able to prevent intestinal
disase upon transfer into a recipient animal by a mechanism that depended upon the
presence of CD4+CD25+ T cells [125]. Presumably, therefore, intestinal DC would be
capable of internalizing commensal bacteria in the intestine and trafficking to the MLN,
where they could expand and/or convert regulatory T cells, as well as causing them to
upregulate gut-homing receptors, therefore sending them to the intestine to mediate
tolerance to that bacterium.
The ability of DC to induce B cell class switching to IgA, convert naïve T cells
into Foxp3+ Treg, and induce gut-homing molecules may all be due at least in part to the
production of retinoic acid (RA) by these DC. Retinoic acid is a product of vitamin A
metabolism, and vitamin A deficiency is reported to lead to low levels of IgA [126], and

-25-
T cell independent class switching mediated by DCs isolated from the Peyer’s patch has
been shown to depend upon RA and IL-5 or IL-6 [127]. RA has been shown to enhance
TGFβ dependent conversion of naïve T cells into Foxp3+ Treg and to induce gut homing
molecules [44, 124, 128-130]. Accordingly, MLN CD103+ DCs express higher levels of
one of the enzymes involved in the production of RA from vitamin A, aldehyde
dehydrogenase family 1, subfamily A2 (ALDH1A2), than their CD103– counterparts
[124]. Additionally, the IEC have been shown to express the closely related ALDH1A1,
so they can also produce RA which can be taken up and transported by DCs [131, 132].
These data suggest a scenario in which the “decision” of whether to respond to the
detection of a bacteria rests on the way in which the dendritic cell acquires the antigen. If
a DC is in close proximity to the IEC, it can acquire the antigen in a way that promotes a
non-inflammatory response; as CD103 expression allows interaction of the DC with E-
cadherin expressed on the IEC, it would follow that the CD103+ DC are the ones which
have done this. These DC then go on to promote tolerance to these antigens, by inducing
and/or enhancing regulatory T cell responses and B cell production of IgA directed at
these antigens. On the other hand, if a DC encounters a bacterium in an area that is not in
close vicinity to the IEC, such as the lamina propria or MLN, it is likely that the bacteria
has actively invaded the epithelium. This DC was not in close contact with the IEC, did
not undergo “conditioning”, and is still capable of mediating attack to this organism. In
the absence of “conditioning”, the CD103– DC would tend to prime a TH1 response, as
this subset has been shown to produce more IFNγ [122]. In addition, IEC would no
longer be secreting tolerogenic molecules, in response to the epithelial cell invasion or
epithelial layer breech, allowing for engagement of PRR which would normally be
-26-
sequestered (such cytosolic NOD2 or basolaterally-expressed TLR5). They would
therefore not downregulate DC maturation and inflammatory cytokine production, further
driving the immune response.
The loss of tolerance to the commensal microbiota results in inflammatory bowel disease.
In humans, inflammatory bowel disease is a serious clinical problem, affecting 0.1
– 0.2% of the population in the form of Crohn’s disease and Ulcerative Colitis [133].
Disease susceptibility, as with most autoimmune disorders, appears to be a combination
of genetic predisposition and unknown environmental triggers [134]. There is evidence
that disease is dependent upon and affected by the resident bacteria in the gut, as
antibiotic treatment often ameliorates disease in IBD patients, and they show higher
antibody titers against commensal bacteria than unaffected individuals [135, 136]. Also,
individuals with IBD show an altered community of commensal bacteria compared to
healthy controls. In most mouse models of IBD disease does not develop in the absence
of bacteria.
The prevailing view of IBD is that it is the result of a dysregulated inflammatory
response and/or innate immunodeficiency to the commensal microorganisms in the gut
[137]. Failures in the mucosal barrier (due to targeting by a pathogen or genetic
mutations such as NF-kB deficiency) and defective defensin production by Paneth cells
(due to mutations in the intracellular peptidoglycan derivitive detector NOD2 or a defect
in autophagy) are failures of the innate immune system which can allow the microbiota to
become uncontrolled [138-140]. In addition, a dysregulated response to the sensing of
bacteria can cause an inappropriate or exaggerated inflammatory response. This can be

-27-
due to defective TLR signaling, which is required to maintain intestinal homeostasis and
repair, promotes luminal antigen sampling by DCs and usually causes production of anti-
inflammatory cytokines by the IECs [109, 141, 142]. However, inappropriate responses
to TLR signals in may also occur, due to a lack of molecules that usually dampen the
TLR response in these cells, such as A20 or SIGIRR (mentioned earlier) [103, 104]. A
lack of anti-inflammatory cytokines such as IL-10 or TGFβ can also cause intestinal
disease, as shown by the spontaneous development of colitis in mice with IL-10, IL-10
receptor, TGFβ, or TGFβ receptor signaling deficiencies [143]. These cytokines have
effects both on the activation state of the antigen presenting cells as well as the on the B
and T cells directly. The downstream effect of all of these innate immune system
deficiencies is a failure to establish or maintain tolerance in the adaptive immune system,
resulting in an inappropriately directed adaptive immune response.
While there are many cell types and mechanisms involved in the maintenance of
intestinal tolerance, Foxp3+ regulatory T cells are an essential component. One of the
earliest and most prevalent disorders seen in the IPEX disorder (resulting from Foxp3
mutations in humans), often leading to the diagnosis, is severe early-onset enteropathy
[144]. Crohn’s Disease and Ulcerative Colitis are believed to be T cell mediated diseases,
and are associated with increased pro-inflammatory cytokines such as TNF and IFNγ. It
has been shown that normal mice harbor effector T cells in the MLN and colonic lamina
propria which recognize intestinal bacteria, and these are actively restrained by the
CD4+CD25+ cells from the GALT. [145]. This is the basis of a classic model used in the
study of colitis first described by Fiona Powrie [146]. In this model, a population of non-
regulatory T cells is transferred into a T cell deficient host, where they undergo

-28-
homeostatic expansion. This leads to the development of spontaneous colitis upon the
arrival of effector T cells into the gut in the absence of Treg. Therefore, disease can be
prevented by the co-transfer of a population of Treg, providing a model that allows the
requirements for Treg suppressive activity in the gut to be elucidated.
Whether Treg in the gut need to be specific for intestinal (self or commensal-
derived) antigens to maintain homeostasis is uncertain. Some evidence suggests that Treg
specific for gut antigens are more efficient at preventing disease. In at least one study,
Treg cells isolated from germ free mice could not protect from disease in the transfer
model of colitis [147]. In another study, germ-free Treg were capable of preventing
disease, but not as efficiently as the conventional Treg [148]. This somewhat reduced
ability to suppress may rely on Treg that recognize conserved self antigens found in the
gut, allowing for their activation and suppressive function even in the absence of bacterial
recognition. Alternatively, in the absence of commensal bacteria, the Treg may be less
activated, and therefore less suppressive no matter their specificity. Models of oral
tolerance, however, have been shown to involve the induction of antigen-specific Treg
cells. In these studies, DO11.10 TCR transgenic T cells specific for an ovalbumin (OVA)
peptide became Foxp3+ in the MLN and small intestine LP only after feeding the mice
OVA [124].
With the importance of Treg in the maintenance of tolerance in the intestines, it
seems reasonable that the ability to induce Treg at this location would confer the
flexibility that is required to maintain tolerance in a location with such a dynamic
antigenic profile. The increased propensity for peripheral conversion of non-regulatory
cells into Foxp3+ Treg in the GALT as compared to the “central” immune system has

-29-
been reported. As previously mentioned, upon transfer of non-Treg into a lymphopenic
host (with co-transfer of whole CD4+ T cells to prevent intestinal inflammation) there
were 4-5 times more converted Treg recovered in the MLN and small intestine lamina
propria (LP) than in peripheral LN or ear dermis [44]. Additionally, a recent study of the
role of the conserved non-coding sequences (CNS) in the foxp3 gene that one of these
sequences was required specifically for conversion of a mature non-regulatory cell into a
Foxp3+ regulatory cell in vitro. In the mice harboring a deletion in this sequence, a
selective decrease was seen in Foxp3+ Treg in the GALT [149]. Most likely conversion is
prominent in the gut due to the presence of the CD103+ DC, which have been shown to
be efficient at inducing Foxp3+ T cells due to their ability to provide retinoic acid (RA)
and TGFβ alongside TCR engagement. These cells have been shown to migrate to the
lymph nodes carrying intestinal antigens including bacteria, and are therefore poised to
divert T cells with specificity for bacterial antigens into the regulatory lineage.
Summary
The CD4+Foxp3+ regulatory T cell subset is of vital importance in the
maintenance of peripheral tolerance to both self antigens and harmless foreign antigens
such as those derived from food or commensal bacteria. The specific mechanisms by
which Treg assert their suppressive ability are still unclear, with many different candidate
mechanisms having been described. Most likely some combination of these mechanisms
is employed, with some variability according to the situation, and some redundancies that
highlight the importance of their function. The challenge of maintenaning tolerance while
keeping the ability to provide an immune response to pathogens is particularly

-30-
challenging in areas of the body in contact with the microorganisms that inhabit our
surroundings. The immune system of the gut meets this challenge with a complicated and
unique set of solutions, among them the regulatory T cells that are essential for
preventing inappropriate responses to the commensal microbiota. What role Treg
specificity plays in their function remains undefined, as there are conflicting data
concerning their ability to suppress immune responses in an antigen non-specific way.

-31-
CHAPTER TWO
Antigen Specific Shaping of the Natural Regulatory T Cell Population

-32-
Chapter Two: Preface
The studies described in this chapter were a direct result of previous work done by
my thesis advisor, Dr. Chyi Hsieh, while a postdoctoral fellow in the laboratory of Dr.
Alexander Rudensky at the University of Washington. It was known that Foxp3+
regulatory T cells emerged from the thymus with this phenotype, but it was not certain
whether they were selected on the basis of a unique TCR specificity or were randomly
selected. The use of a transgenic mouse expressing a fixed TCRβ chain to sequence a
subset of the TCRα chains to get a measurement of the TCR repertoire of the Treg and
non-Treg populations proved to be an elegant way to answer this question at the
individual sequence level. As was suspected, these populations showed only slight
overlap in their TCR usage, suggesting that they recognize different populations of
antigens. These studies went on to show evidence that many of these appear to be self
antigens, as T cells expressing these Treg-derived receptors expanded preferentially upon
transfer to lymphopenic hosts [37].
While these studies showed that regulatory and non-regulatory cells used a
different repertoire of TCRs, they left unaddressed the possibility that the regulatory T
cells may show similarity to antigen-experienced memory T cells. It has been proposed
that upon antigen recognition a naïve T cell may give rise to both effector T cells (a TH1
cell, for example) and a regulatory T cells, in order to limit the extent of the immune
response [45]. The previous studies did not differentiate between non-regulatory cells of
a naïve and a memory phenotype; as 90% of the non-regulatory population in these mice
is usually of a naive phenotype, the main comparison previously made was between naïve
and regulatory T cells.

-33-
Additionally, the T cells sequenced in the previous studies were a mix of cells
from the spleen and lymph nodes. There have been reports suggesting that Treg act in an
antigen-specific manner to prevent autoimmunity, and the presence of a tissue is required
to develop and maintain Treg specific for that particular tissue [79]. In addition, data
suggested that the Treg would be located preferentially in the draining lymph node of that
tissue [80]. Therefore, the studies described in this chapter were designed to answer these
questions. The results of this work were published in The Journal of Experimental
Medicine in 2008 and this chapter is adapted from this manuscript [150].

-34-
Chapter Two: Abstract
Although regulatory T (Treg) cells are thought to develop primarily in the thymus, the
peripheral events that shape the protective Treg cell population are unclear. Here, we
analyzed the peripheral CD4+ TCR repertoire by cellular phenotype and location in mice
with a fixed TCRβ chain. We found that Treg (Foxp3+) cells showed a marked skewing
of TCR usage by anatomic location in a manner similar to antigen-experienced
(CD44hiFoxp3–), but not naïve (CD44loFoxp3–), cells, even though CD44hi and Treg cells
used mostly dissimilar TCRs. This was likely unrelated to peripheral conversion, which
we estimate generates only a small percentage of peripheral Treg cells in adults.
Conversion was readily observed, however, during the immune response induced by
Foxp3– cells in lymphopenic hosts. Interestingly, the converted Foxp3+ and expanded
Foxp3– TCR repertoires were different, suggesting that generation of Foxp3+ cells is not
an automatic process upon antigen activation of Foxp3– T cells. Retroviral expression of
these TCRs in primary monoclonal T cells confirmed that conversion did not require
prior cellular conditioning. Thus, these data demonstrate that TCR specificity plays a
crucial role in the process of peripheral conversion and in shaping the peripheral Treg cell
population to the local antigenic landscape.

-35-
Chapter Two: Introduction
The importance of natural Foxp3+ regulatory T (Treg) cells for the maintenance of
self-tolerance was recently reaffirmed by the observation that acute depletion of Treg
cells creates a state of “immunologic anarchy”, resulting in the rapid death of a
previously healthy animal [30, 151]. Treg cells are commonly thought to be generated in
the thymus due to recognition of self-antigens [36, 152], which is supported by studies
using mice with limited T cell receptor (TCR) diversity showing strong similarity
between the thymic and peripheral Treg TCR repertoires [33, 34, 153]. However, the
peripheral and thymic Treg TCR repertoires were not identical, suggesting that certain
TCRs are preferentially enriched or deleted in the periphery, akin to earlier observations
in the total CD4+ T cell population [154].
The notion that post-thymic Treg TCR repertoire shaping may play an important role
in immune regulation was suggested by a number of studies demonstrating that the
presence of an organ is accompanied by functionally enhanced suppression of
autoimmunity to that organ [78-80, 155]. Based on these studies, it has been widely
hypothesized that tissue-specific Treg cell number is increased due to the presence of the
antigen. However, this has not been directly demonstrated, and alternative explanations
for these classic observations include altered trafficking patterns [128, 130, 156] and
activation status [155, 157] of Treg cells at particular locations. These other possibilities
are consistent with reports suggesting that Treg cells may not require tissue specificity for
suppression [158-160], nor recognize self-antigens [81]. Thus, an important unresolved
question is whether the peripheral Treg TCR repertoire is altered based on the
presentation of tissue-specific antigens.

-36-
The development of Foxp3+ T cells from mature, naïve Foxp3– T cells, a process
often referred to as peripheral conversion, is another mechanism by which the peripheral
repertoire may be altered. This process would allow for the generation of Treg cells
specific for antigens not presented in the thymus, such as those from commensal
microbiota or sequestered self-antigens [45, 161]. Furthermore, it has been hypothesized
that peripheral conversion may also generate Treg cells during the course of an immune
response to limit immune pathology. Studies of TCRαβ transgenic T cells have shown
that exposure to cognate antigen under non-inflammatory or tolerogenic conditions in
vivo results in the development of suppressive Foxp3+ Treg cells in a portion of the
monoclonal T cell population [39, 41, 162]. In polyclonal T cell populations, peripheral
development of CD25+ cells characteristic of Treg cells has been observed after adoptive
transfer of CD25– T cells into both lymphopenic and non-lymphopenic hosts [42, 43].
However, a study using endogenous secondary TCRα chains on self-reactive BDC2.5
TCRαβ transgenic T cells to track T cell fates found no evidence that this TCR facilitates
conversion [35]. Thus, the role of peripheral conversion in generating the peripheral
Treg cell population remains unresolved.
To address these questions, we analyzed the TCR repertoire based on anatomic
location and cellular phenotype by sequencing TCRα chains in mice with a fixed TCRβ
chain [37]. We generated a database of nearly 18,000 TRAV14 (Vα2) TCRα chain
sequences derived from Treg (Foxp3+), antigen-experienced (CD44hiFoxp3–), and naïve
(CD44loFoxp3–) CD4+ cells isolated from the spleen; and cervical, axillary, inguinal, and
mesenteric lymph nodes. We found considerable differences in TCR usage by location in
the Treg and CD44hi, but not CD44lo, T cell populations, demonstrating that tissue-

-37-
specific antigen recognition dramatically alters the peripheral Treg cell population.
Shaping of the peripheral Treg TCR repertoire by location therefore suggests that
immune regulation is a tissue-specific activity.
A potential explanation for parallel changes in both the Treg and CD44hi TCR
repertoires by location is that peripheral conversion generates a large proportion of the
peripheral Treg cell population. However, we found that few cells (~0.03%) became
Foxp3+ after adoptive transfer of Foxp3– cells into normal adult hosts, resulting in an
estimated 3% contribution to the peripheral Treg cell population. By contrast, we found a
much higher percentage of conversion during the immune response induced by Foxp3–
cells transferred into lymphopenic hosts. Interestingly, there was considerable disparity
in TCR usage between the converted Foxp3+ and expanded Foxp3– T cell subsets within
the same individual host. We excluded an absolute requirement for thymically-derived
Treg cell precursors by showing that retroviral expression of particular TCRs on
monoclonal peripheral T cells was sufficient to permit peripheral conversion. Thus, these
data favor a TCR-specific model of peripheral Treg cell development.

-38-
Chapter Two: Materials and Methods
Mice and Reagents
Foxp3gfp reporter knockin, and TCli TCR-β and TCR-αβ transgenic mice were kindly
provided by Dr. Alexander Rudensky (U. Washington, Seattle, WA). B6.SJL (CD45.1),
B6.PL (Thy1.1), Tcrb–/–, and Tcra–/– mice were obtained from the Jackson Laboratory
(Bar Harbor, ME). Animals were housed in a specific-pathogen-free animal facility at
Washington University and were used according to protocols approved by the
Institutional Animal Care and Use Committee. Monoclonal antibodies were purchased
from eBioscience (San Diego, CA) and Becton Dickenson (San Jose, CA). Human IL-2
was obtained from the NIH Biological Resources Branch (Frederick, MD).
Cell purification
CD4+ T cells were initially purified from the indicated tissues using the CD4
Untouched kit, which utilizes AutoMACS magnetic separation to remove non-CD4+ cells
(Miltenyi Biotech, Auburn, CA). Remaining cells were stained with fluorescently labeled
antibodies and sorted by flow cytometry using a Moflo (Dako, Carpinteria, CA) or a
FACSAria (Becton Dickenson).
Isolation of T cells for TCR sequencing
CD4+Vβ6+ T cells were purified by FACS into the Foxp3+, Foxp3–CD44hi, and
Foxp3–CD44lo subsets from normal mice, and Foxp3+ and Foxp3– subsets after
proliferation and conversion in lymphopenic hosts. CD44 was not used to purify T cells
from lymphopenic hosts as the Foxp3– population was CD44hi after lymphopenia-induced

-39-
proliferation. Post-sort purity was > 95%. The percentage of Vα2+ cells was found to
range from 6-14%, suggesting that the proportion of these cells was relatively stable
between mice and experiments. Cloning of TRAV14 TCRα sequences was performed as
previously described [33]. As before, we utilized the CDR3 amino acid sequence
provided by IMGT/V-QUEST as a unique identifier for individual TCRs [163]. Thymic
Foxp3+ and Foxp3– CD4+CD8– data sets have been previously described [164].
Statistical Analysis
The estimated contribution of peripheral conversion to the Treg cell population is a
simple extrapolation of the % Foxp3+ in the adoptively transferred Foxp3– population to
the entire Foxp3– population multiplied by the proportion of Foxp3– cells of CD4+ T
cells, divided by the proportion of Treg cells of CD4+ T cells. Thus, an 8% conversion in
normal mice would represent 7.2% of total CD4+ T cells (8% x 90%), which would be
72% the size of the Treg subset (7.2% of 10% Treg cells in the total CD4+ T cell
population).
We used the Morisita-Horn index as a statistical measure of similarity between two
data sets [165]. This unit-less index ranges from 0 to 1, representing complete
dissimilarity to similarity. The Morisita-Horn index takes into account the frequency of
each TCR, and is relatively resistant to the sample size, as compared with other similarity
indices such as the Jaccard. A sequence found in both data sets at greatly different
frequencies would therefore contribute to dissimilarity by this index. For reference,
comparison of the first 200 sequences with the last 200 sequences of an ~400 sequence
data set results in a Morisita-Horn index of about 0.9, which represents an experimentally

-40-
derived value for the maximum expected similarity, incorporating the inherent variability
due to random sampling.
The abundance coverage estimator (ACE) was used to estimate the total number of
unique species in the population based on the observed number of species in the data set
as previously described [37].
To determine whether anatomic location affected TCR distribution, we performed
generalized linear model testing using the raw counts of all experiments for each of the
phenotypes. We utilized the Bonferroni correction (0.05 divided by the total number of
sequences analyzed) to provide the most stringent p-value for rejection of the null
hypothesis, that TCR distribution is unaffected by location.
Assessment of Peripheral Conversion in vivo
For non-lymphopenic hosts, 107 FACS purified Foxp3–CD4+CD45.2+ T cells from
the pooled spleen and lymph nodes of Foxp3gfp mice were intravenously injected into
congenic Thy1.1 hosts. One to two hundred Foxp3+CD4+CD45.1+ T cells were also co-
transferred to assess the contribution of Foxp3+ contaminants in the Foxp3– population.
Acquisition of Foxp3 and other markers by flow cytometry was assessed after 3-4 weeks.
For lymphopenic hosts, 2x10⁶ FACS purified Foxp3–CD4+ T cells from Foxp3gfp or
TCli TCR-β x Foxp3gfp x TCRα+/– were intravenously injected into Tcrb–/– hosts, and
analyzed for acquisition of Foxp3 and other markers by flow cytometry after 19-21 days.
This time point was chosen to diminish the degree of immune activation following
transfer of non-Treg cells into lymphopenic hosts seen at later time points, while earlier
time points showed a lower frequency of Foxp3+ cells (data not shown). We also verified

-41-
that the converted Foxp3+ cells were unlikely to originate from the contaminating Foxp3+
cells in the sorted population using “spike” experiments similar to that in Fig. 2.8 A (data
not shown). The percentage of Foxp3+ cells was somewhat higher when TCli TCRβ
chain transgenic T cells were used as compared to non-TCR-β transgenic T cells, but the
anatomic variation in the frequency of Foxp3+ cells remained consistent (data not
shown). This is likely due to the constraint on the TCR repertoire imposed by the fixed
TCRβ chain, but should not affect the determination of whether individual TCRs are
preferentially found in the converted versus expanded T cell populations.
Facilitation of peripheral conversion by retrovirally expressed TCRα chains
Peripheral T cells from TCli (Vα18, Vβ6) TCR-αβ transgenic x Foxp3gfp x Rag1–/–
mice were depleted by magnetic bead selection of CD25+ cells (Miltenyi), and then
retrovirally transduced on days 1 and 2 post activation as previously described [33]. After
7 days, a T cell population containing 4x10⁵ transduced Vα2+CD4+ cells was injected
intravenously into a Tcrb–/– host. Acquisition of Foxp3 on Vα2+ cells was assessed at 2.5-
3 weeks by flow cytometry.

-42-
Chapter Two: Results
Mapping the peripheral CD4+ TCR repertoire
To determine the impact of anatomic location and cellular phenotype on the
peripheral CD4+ TCR repertoire, we isolated Treg (Foxp3+), antigen-experienced
(CD44hiFoxp3–), and naïve (CD44loFoxp3–), CD4+ cells from the spleen and cervical,
axillary, inguinal, and mesenteric lymph nodes of TCli TCRβ transgenic x Foxp3gfp x
Tcra+/– mice (Fig. 2.1). We considered using CD62L as an additional putative memory
cell marker, but found that only a minor subset of CD44hi cells are CD62Lhi (data not
shown). We obtained TRAV14 (Vα2) TCRα sequences as previously described [33]
from four independent experiments; three experiments which each consisted of pooled
cells from 3-5 mice, and a fourth experiment in which three mice were individually
sequenced. As before, we utilized the CDR3 amino acid sequence as the primary
identifier for a unique TCR sequence [33]. Approximately 6,000 sequences were
obtained from each of the Treg, naïve, and memory cell populations, for a total of nearly
18,000 sequences.
The Treg TCR repertoire varies by anatomic location.
An important unresolved issue is the mechanism by which tissue-specific antigen
presentation results in enhanced protection from autoimmunity, as it could derive from
either an increased number or heightened potency of antigen-specific Treg cells. Analysis
of TCRs from the various lymph nodes and the spleen revealed that the Treg TCR
repertoire varied considerably according to the anatomic location. This could be observed
both at the level of individual TCRs (Fig. 2.2, 2.3A), and by a statistical assessment of
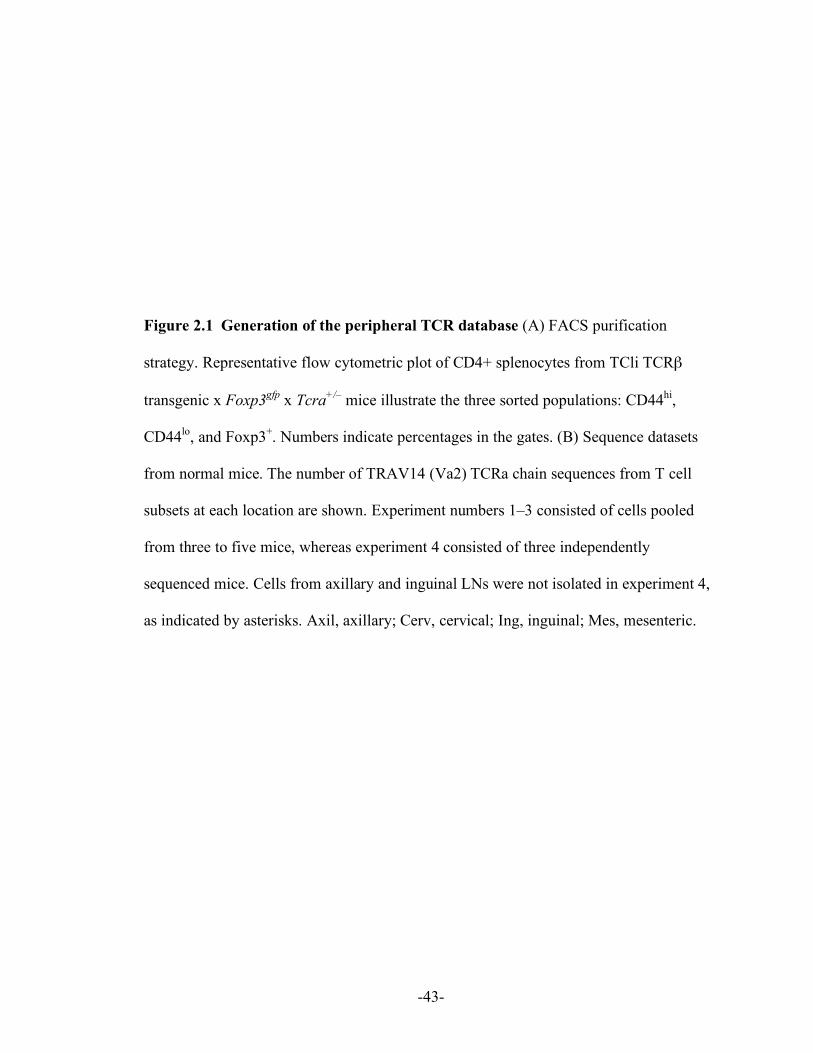
-43-
Figure 2.1 Generation of the peripheral TCR database (A) FACS purification
strategy. Representative flow cytometric plot of CD4+ splenocytes from TCli TCRβ
transgenic x Foxp3gfp x Tcra+/– mice illustrate the three sorted populations: CD44hi,
CD44lo, and Foxp3+. Numbers indicate percentages in the gates. (B) Sequence datasets
from normal mice. The number of TRAV14 (Va2) TCRa chain sequences from T cell
subsets at each location are shown. Experiment numbers 1–3 consisted of cells pooled
from three to five mice, whereas experiment 4 consisted of three independently
sequenced mice. Cells from axillary and inguinal LNs were not isolated in experiment 4,
as indicated by asterisks. Axil, axillary; Cerv, cervical; Ing, inguinal; Mes, mesenteric.

Lymph nodeExpt. Phenotype Spleen Mes Cerv Axil Ing Total1 Foxp3+ 322 298 329 285 357 1,591
CD44hi 295 330 246 305 291 1,467CD44lo 315 306 307 335 274 1,537
2 Foxp3+ 330 298 301 333 304 1,566CD44hi 268 321 321 321 298 1,529CD44lo 333 338 344 344 333 1,692
3 Foxp3+ 283 361 284 298 280 1,506CD44hi 283 276 365 311 377 1,612CD44lo 278 306 278 330 453 1,645
4 Foxp3+ 146 161 179 * * 486mouse 1 CD44hi 154 198 139 * * 491
CD44lo 110 123 167 * * 4004 Foxp3+ 141 120 164 * * 425mouse 2 CD44hi 136 143 116 * * 395
CD44lo 113 120 115 * * 3484 Foxp3+ 122 153 124 * * 399mouse 3 CD44hi 161 149 143 * * 453
CD44lo 114 152 115 * * 381Total: 3,870 4,124 4,003 2,959 2,967 17,923
A
CD
44
716
75
Foxp3
B
Figure 2.1 Generation of the peripheral TCR database.
-44-

-45-
Figure 2.2 Analysis of the most frequent TCR from each phenotype/location. Using
the pooled TCR dataset described in Fig 2.1, we chose the most frequent TCR of a given
phenotype (shown at left) at each location (shown on top). To decrease the effect of
mouse-to-mouse variability, we chose only TCRs that were found in at least two
independent experiments. Because the naïve CD44lo TCRs were fairly uniform across all
locations, the three most frequent TCRs irrespective of location are shown. Symbols
represent the frequency (as a percentage of total sequences) of the TCR, denoted above
by its CDR3 amino acid sequence, within the dataset of that phenotype and the location
in each of four experiments.

AASDGNNRIF AASELYQGGRALI AAEPNYNVLY
AASAGTGGYKVVAARDHNYAQGLT AASDGGSGNKLI
AASETGANTGKLTAASEDNNNAPRAASATGANTGKLT
Foxp
3+C
D44
hiC
D44
lo
Spleen Mesenteric LN Inguinal LN
Spl
Mes
Cer
v
Axil
Ing
0
3
9
6
0
3
9
6
0
3
9
6
12
0
8
4
12
0
4
2
8
6
0
10
5
20
15
0
2
6
4
0
2
6
4
0
2
4
Spl
Mes
Cer
v
Axil
Ing
Spl
Mes
Cer
v
Axil
Ing
Figure 2.2 Analysis of the most frequent TCR from eachphenotype/location
-46-

-47-
Figure 2.3 The natural Treg and memory CD44hi TCR repertoires vary by
anatomical location. (A) Anatomical distribution of the most abundant TCR sequences
within each phenotype. Using the pooled TCR datasets from all four experiments, the top
50 TCR sequences by frequency within a given phenotype were selected. For each TCR,
the relative frequency with which it is found at each anatomical location was calculated
by dividing its frequency at each location by the sum of the frequencies at all locations.
The frequency is represented on the heat map by decile, with the scale indicating the
color at 100 (red), 75, 50, 25, and 0% (yellow) for a TCR at a given location. The data are
clustered such that those TCRs predominantly found in one location are shown together.
(B) Statistical analysis of similarity. The mean Morisita-Horn similarity index (±SD;n=3-
4 independent experiments) is shown for the comparison betweenthe mesenteric (Mes)
LNs versus the spleen, cervical (Cerv), axillary (Axil) and inguinal (Ing) LNs (left), and
the inguinal LNs versus the spleen, Mes, Cerv, and Axil LNs (right).

Mesenteric LN
Similarity (Morisita-Horn Index)
Foxp3+ CD44hiCD44loA
Spl
een
Mes
LN
Cer
v LN
Axi
l LN
Ing
LN
Spl
een
Mes
LN
Cer
v LN
Axi
l LN
Ing
LN
Spl
een
Mes
LN
Cer
v LN
Axi
l LN
Ing
LN
CD
44lo
CD
44hi
Foxp
3+
SpleenMes LNCerv LN
Comparison with:Axil LNIng LN
0.0 0.2 0.4 0.6 0.8 1.0
B Inguinal LN
0.0 0.2 0.4 0.6 0.8 1.0
Figure 2.3 The natural Treg and memory CD44hi TCR repertoires varyby anatomical location.
-48-

-49-
similarity between two populations, the Morisita-Horn index (Fig. 2.3B, see Materials
and Methods). By contrast, naïve CD44lo T cells showed little skewing of their TCR
repertoire by anatomic location, consistent with the notion that these cells circulate
among the secondary lymphoid organs scanning for foreign antigens. Thus, these data
provide direct evidence that the peripheral Treg cell population is shaped by local antigen
presentation.
Interestingly, the CD44hiFoxp3– TCR repertoire behaves much like the Foxp3+ TCR
repertoire with respect to repertoire changes based on location (Fig. 2.2, 2.3). For
example, we observed that in both subsets the TCR usage in the mesenteric lymph nodes
was very different from that in the other lymph nodes, whereas the inguinal and axillary
lymph nodes were much more similar to each other (Fig. 2.3B). This shared pattern of
TCR localization by the Treg and CD44hi subsets may reflect common recirculation
patterns and spectra of antigens in these lymph nodes. For example, one might expect the
axillary and inguinal lymph nodes to share a similar antigenic repertoire since they both
drain the skin and limbs. We also found, using generalized linear model testing, that of
the 15 most prevalent Treg and CD44hi TCRs, 10 Treg and 12 CD44hi TCRs showed a
statistically significant level of skewing according to location (p < 0.05 with Bonferonni
correction, see Materials and Methods), whereas only 1 of the top 15 naïve TCRs did so
(Table 2.1). These data therefore suggest that the peripheral Treg population is shaped
via a mechanism which is reminiscent of the generation and maintenance of memory
cells.

Top
15 F
oxp3
+ TC
Rs
Top
15 C
D44
hi T
CR
sTo
p 15
CD
44lo T
CR
s
Distribution of top 15 TCRs from each phenotype. The 15 most prevalent TCRα sequencesfound in the Treg, CD44hi, and CD44lo T cell populations in the data pooled from all fourexperiments are shown in order of decreasing counts within each phenotype. The number ofinstances is the total count for each TCR in the pooled dataset. Red TCR sequencesshowed statistically significant differences in their prevalence at different locations based onthe generalized linear model testing described in Materials and methods. We considered theBonferroni adjusted p-value (second column from the left) significant if it was <0.05. Of note,cell purification typically results in the contamination of minor populations (Treg and CD44hicells) by the major population (naive cells), with the reverse occurring to a much lowerdegree. A 95–98% purity of the Foxp3+ population generally means that 1 out of 20–50 cellsare naive cells, which creates a small degree of false overlap.
Table 2.1 Distribution of Top TCR from Foxp3+, CD44hi and CD44lo Populations
-50-

-51-
The Treg and antigen-experienced CD44hi TCR repertoires are distinct.
One possible explanation for the observed similarity in the pattern of localization
between the Treg and CD44hi TCR repertoires is that these cells may co-develop from
common precursors. This would be consistent with the hypothesis that peripheral Treg
cells normally develop during the course of an immune response to limit pathology [45],
and the observation in TCRαβ transgenic models that peripheral conversion only occurs
in a portion of antigen-specific T cells after antigen administration [39, 41, 162]. Thus, it
is quite possible that TCRs which select for development into the antigen-experienced
CD44hi phenotype may also be found within the Treg cell subset, due to peripheral
conversion, and potentially account for the well-described overlap between the Treg and
conventional non-Treg TCR repertoires [34, 35, 37].
However, analysis of the fractionated conventional T cell subset revealed that the
prominent TCRs in the CD44hi subset were not preferentially found in the Foxp3+ subset
(Fig. 2.4, 2.5). As expected, the naïve TCR repertoire showed little similarity with either
of the CD44hi and Foxp3+ TCR repertoires, indicating differential requirements in TCR
specificity for the development of these CD4+ T cell subsets. These differences between
cellular phenotypes were also readily apparent in analyses of the TCRs present in each
individual experiment, even though the TCR repertoires varied between experiments
somewhat, particularly for the CD44hi population (Fig. 2.6). Thus, in these unimmunized
adult animals, we found little evidence to support the hypothesis that peripheral Foxp3+ T
cell generation is a prevalent occurrence upon antigen encounter.
The strong difference between the TCR repertoires of these three phenotypes is
further demonstrated by the cluster analysis of a matrix of Morisita-Horn similarity

-52-
Figure 2.4 Frequencies of the top TCR from the Foxp3+, CD44hi, and CD44lo
populations. The three most frequent TCRα sequences from each phenotype were
selected, and their frequency within each phenotype in each experiment was plotted.
Different symbols represent each of the four experiments. Each TCR tends to be
prominent in only one of the three phenotypes, as would be expected from the overall
dissimilarity.

AAEPNYNVLY AARPSGSFNKLT AASDGNNRIF
AASAVNNYQLI AARDHNYAQGLT AAWGYQGGRALI
AASATGANTGKLT AASEDNNNAPR AASETGANTGKLT
Foxp
3+C
D44
hiC
D44
lo
Thre
e hi
ghes
t fre
quen
cy T
CR
s fr
om:
0
1.0
0
2
1
3
0
4
2
0
2
1
3
0
2
1
3
0
4
2
0
4
2
0
8
4
0
6
3
9
Freq
uenc
y (%
) in
Popu
latio
n
Foxp3
+
CD44hi
CD44lo
Foxp3
+
CD44hi
CD44lo
Foxp3
+
CD44hi
CD44lo
0.5
1.5
Expt. 4
Expt. 2Expt. 1
Expt. 3
Figure 2.4 Frequencies of the top TCR from the Foxp3+, CD44hi, and CD44lo
populations.
-53-

-54-
Figure 2.5 The CD44hi, CD44lo, and Foxp3+ Treg repertoires show little overlap.
Comparison of the frequencies of prevalent TCRs between the CD44hi and Foxp3+ or
CD44lo datasets. In each graph, the 50 most abundant TCRs from each of the two
indicated populations were selected and plotted on the x axis, with the frequency of the
TCR in the indicated subset on the y axis. TCRs are arranged in order of decreasing
frequency within the CD44hi subset, and increasing frequency for the Foxp3+ (top) or
CD44lo (middle) subset, or decreasing frequency within the Foxp3+ subset and increasing
frequency for the CD44lo subset (bottom).

Freq
uenc
y (%
) in
Popu
latio
nFo
xp3+
CD
44hi
2
2
4
4
6Fr
eque
ncy
(%) i
n Po
pula
tion
CD
44lo
4
2
6
4
2
0
CD
44hi
CD44hi
0
Foxp3+
CD44hi
CD44lo
Freq
uenc
y (%
) in
Popu
latio
nFo
xp3+
CD
44lo
1
1
3
3
5Unique TCRα CDR3 sequences
Foxp3+
CD44lo
Figure 2.5 The CD44hi, CD44lo, and Foxp3+ Treg repertoires show little overlap.
-55-

-56-
Figure 2.6 Statistical analysis of similarity between different populations. (A) The
Morisita-Horn similarity values between the indicated phenotypes within each
experiment (left) and between populations with the same phenotype across different
experiments (right). (B) Same comparisons as in A, using datasets obtained from three
individual animals, showing mouse-to-mouse variability.

Sim
ilarit
y(M
oris
ita-H
orn
Inde
x)A
B
Between phenotypes,within experiment
Within phenotype,across experiments
Similarity
Foxp3+
CD44loFoxp3+
CD44hiCD44lo
CD44hi
Foxp3+ CD44hiCD44lo
Between
ComparisonsBetween Expt: 1 vs 2 1 vs 3 1 vs 4 2 vs 3 2 vs 4 3 vs 4
Sim
ilarit
y(M
oris
ita-H
orn
Inde
x)
Between phenotypes,within each mouse
Within phenotype,between mice
ComparisonBetween Mice: 1 vs 2 1 vs 3 2 vs 3
Foxp3+ CD44lo CD44hiFoxp3+
CD44lo
Foxp3+
CD44hiCD44lo
CD44hiBetween
Similarity
Figure 2.6 Statistical analysis of similarity between different populations.
-57-

-58-
indices, which includes comparisons based on both location and cell phenotype (Fig. 2.7).
This plot reveals the dominant effect of the cell type over the location when all data are
considered, as the calculated similarities cluster in 5x5 blocks according to cell
phenotype first. This analysis also reaffirms the similarity in the naïve T cell repertoires
between locations, as shown by the uniformly red 5x5 block representing the naïve subset
repertoires, while the other blocks show relatively high similarity between the axillary
and inguinal lymph nodes. Thus, these data demonstrate that even though Treg and
CD44hi cells share a common behavioral feature at the population level, it is unlikely that
they are generated via a common developmental pathway.
A minor role for peripheral conversion in generating the adult Treg cell population.
One explanation for the unexpected lack of similarity between the Treg and antigen-
experienced subset is that peripheral conversion is an infrequent process in unimmunized
adult animals. Current estimates of the magnitude of peripheral conversion in adult
animals are quite divergent. One study suggested that many peripheral Treg cells could
arise via conversion, as approximately 8% of CD25– T cells became CD25+ after transfer
into a congenic, non-lymphopenic host [43]. If one extrapolates the behavior of the
adoptively transferred population in this study to represent that of the normal non-Treg
cell subset at large, conversion would account for approximately 72% of peripheral Treg
(see Materials and Methods). On the other hand, it has also been suggested that
conversion occurs infrequently based on a study of monoclonal T cells reactive to an islet
self-antigen [35].

-59-
Figure 2.7 Cluster analysis of the total peripheral TCR dataset. Data shown are a
heatmap representation of the Morisita-Horn similarity indices calculated pairwise for all
cell phenotype and location combinations using the pooled TCR dataset. Each decile is
represented by distinct shades, with the scale indicating the color at 0, 0.5, and 1. The
mean linkage algorithm was used to obtain a hierarchical cluster (or dendrogram; right)
by sequentially grouping the two most correlated observations on the basis of a distance
metric provided by the square root of 1 (Morisita-Horn index).

Foxp3+ CD44hi CD44lo
ScaleMorisita-Horn
Similarity Index
10 0.5
SpleenMes LNCerv LN
Axil LNIng LN
Axil LNIng LNSpleenCerv LNMes LNIng LNAxil LNCerv LNSpleenMes LN
Foxp
3+C
D44
hiC
D44
lo
Spl
een
Mes
LN
Cer
v LN
Axi
l LN
Ing
LN
Axi
l LN
Ing
LNS
plee
nC
erv
LNM
es L
NIn
g LN
Axi
l LN
Cer
v LN
Spl
een
Mes
LN
Figure 2.7 Cluster analysis of the total peripheral TCR dataset
-60-

-61-
To measure the potential for peripheral conversion in a polyclonal T cell population,
we used fluorescence activated cell sorting (FACS) to obtain a highly pure population of
Foxp3–CD4+ donor T cells from Foxp3gfp mice. We achieved a purity of > 99.998%, or
less than 1 contaminating Foxp3+ cell per 50,000 Foxp3– CD4+ cells (data not shown).
Since Treg cells have been reported to divide at a faster rate than non-Treg cells [166],
we also measured the projected expansion of these few contaminating natural Treg cells
in this environment by adding approximately 0.001% (100-200 cells per 107) FACS-
purified CD45.1+ Foxp3+ cells to the donor cell population. In order to detect sufficient
numbers of donor cells by flow cytometry 3-4 weeks after intravenous transfer, we
analyzed nearly the entire T cell population from the pooled lymph nodes and spleen of
each recipient.
We found that the percentage of donor-derived cells that were Foxp3+ by three weeks
after transfer was quite low–approximately 0.3% of the donor cells analyzed (Fig. 2.8A).
Consistent with previous studies, these cells appeared phenotypically similar to natural
Treg cells (CD25hiGITRhi, not depicted). As the contribution from contaminating Foxp3+
donor cells to the final Foxp3+ population was estimated to be about 2%, via analysis of
the co-injected CD45.1+ cells, we believe that this frequency (0.3%) approximates the
extent of conversion from peripheral Foxp3– CD4+ T cells.
Recent studies have suggested that the gut environment may preferentially facilitate
peripheral conversion [44, 124, 130]. We repeated the experiment described above to
compare the frequency of converted Foxp3+ cells in the mesenteric LN, spleen, and the
pooled cervical, axillary, and inguinal LN. In order to observe sufficient conversion
events by flow cytometry, each experiment consisted of tissues pooled from three

-62-
Figure 2.8 Peripheral conversion in nonlymphopenic hosts is infrequent. (A)
Adoptive transfer of peripheral Foxp3–CD45.2+ (107) and Foxp3+CD45.1+ (1-2 x 10²) T
cells were intravenously transferred into normal Thy1.1 hosts. After 3-4 wk, acquisition
of Foxp3 was analyzed by flow cytometry. Pooled spleen and LN cells were gated on
CD4+ and Thy1.2+ (donor cells; left) to determine the frequency of Foxp3+ cells (middle).
Within the Foxp3+ cells, the outgrowth of the contaminating cells in the original
CD45.2+Foxp3– population was estimated by the spike of Foxp3+CD45.1+ cells (right).
Data shown are representative of three independent experiments (n=5 mice), and
percentages are shown. (B) The frequency of conversion varies by anatomical location.
The experiment was performed as in A, and after 4 wk the LNs or spleens from three
animals were pooled for analysis. Data shown are representative of two independent
experiments, and percentage are shown. (C) Summary of the flow cytometric data
described in A and B. The frequency of Foxp3+ cells is shown. Each symbol represents
data from an individual mouse (“pooled”; as in A) or an experiment in which cells from
the organs of three mice were pooled (as in B) from the spleen, Mes LNs, and a pool of
Cerv/Axil/Ing LNs.

B
2.1
Thy1.2 CD45.1
CD4+
0.3
C
A
Thy1
.1Thy1.2
0.1
0.2
0.3
0.4
0.5
Foxp
3+ (%
) of d
onor
cel
ls
0.0Pooled Spleen Mes LN Cerv/Axil/
Ing LN
0.21 0.230.47
Spleen Cerv/Axil/IngLN
Mes LN
Donor CD4+ Thy1.2+
Thy1.2
Foxp
3
Foxp
3
dono
r
“spike”
Figure 2.8 Peripheral conversion in nonlymphopenic hosts is infrequent.
-63-

-64-
individual mice which had received the same preparation of purified donor cells four
weeks earlier. Consistent with a previous report [44], we found that the mesenteric LN, in
comparison with the peripheral LN and spleen, contained an approximately two-fold
higher percentage of converted Foxp3+ cells (Fig. 2.8, B and C). However, converted
Foxp3+ cells were found in all locations, at frequencies ranging from 0.2-0.5%.
Because conversion appears to occur naturally in lymphoreplete animals, it was
possible that this process would reduce the number of cells that can undergo conversion
in the peripheral Foxp3–CD4+ T cell population used. We therefore assessed the
frequency of conversion in immediate precursors to the peripheral T cell population,
mature CD4+CD8– (CD4 single-positive [SP]) thymocytes. We purified
CD62LhiHSAloFoxp3–CD25–CD4SP thymocytes as well as Foxp3–CD4+ peripheral T
cells to enable direct comparison between these populations. 3 wk after adoptive transfer
into congenic hosts, we found that, on average, 0.5% of peripheral CD4+ donor cells and
0.8% of thymocytes became Foxp3+ (Fig. 2.9). If one extrapolates this behavior as
representative of their respective T cell populations, then peripheral conversion would
account for the development of 4-7% of peripheral CD4+Foxp3+ T cells in a normal
mouse (see Materials and methods). Although this is a rough estimate, it suggests that
peripheral conversion plays a relatively small role in generating the protective Treg cell
population in adult individuals.
Peripheral conversion in lymphopenic hosts is TCR-specific.
The low rate of peripheral conversion in an adult lymphoreplete animal may be
caused, in part, to inhibition by the existing Treg cell population. We hypothesized that

-65-
Figure 2.9 Peripheral conversion of CD4 SP thymocytes vs. CD4+ peripheral T cells.
Mature HSAloCD62LhiFoxp3–CD25– CD4 SP thymocytes or Foxp3–CD4+ peripheral T
cells were adoptively transferred into congenic hosts. The frequency of Foxp3+ cells in
pooled spleen and LN preparations was assessed at 3 wk by flow cytometry. Each symbol
represents data from an individual recipient from two experiments in which 3.4 x 10⁶
(closed circles) or 9 x 10⁶ (open circles) cells were injected per mouse. The horizontal
bars represent the mean values.

Foxp
3+ (%
) of d
onor
cel
ls
0.0
0.5
1.0
1.5
2.0
CD62L
HSA
CD25
Foxp
391.6
CD4 SP Foxp3–CD25–
peripheralCD4+
thymic matureCD4 SP
Origin of Foxp3– donor cells
30.5
Donor mature thymocyte sort strategy
Figure 2.9 Peripheral conversion of CD4 SP thymocytes vs.CD4+ peripheral T cells.
-66-

-67-
peripheral conversion may play a greater role in a lymphopenic environment, such as that
seen in the early ontogeny of the peripheral immune system, which is both lymphopenic
[167, 168] and Treg cell deficient due to delayed thymic Treg cell export [32, 169].
Therefore, we used the adoptive transfer of CD4+Foxp3– T cells from mice containing the
fixed TCRβ chain into lymphopenic hosts as a model of peripheral conversion, which has
previously been reported to occur upon the transfer of non-Treg cells into lymphopenic
hosts [42, 43].
Consistent with previously published results, we observed peripheral conversion of
the highly purified CD4+Foxp3– T cells from TCli TCRβ chain transgenic mice 2.5-3.0
weeks after intravenous transfer into Tcrb–/– αβ-T cell deficient mice (Fig. 2.10A). The
converted cells were phenotypically similar to Treg cells, expressing high levels of
CD103, GITR, and CD25 (data not shown). Since the incidence of Foxp3 induction
versus subsequent expansion cannot be discriminated, the extent of “peripheral
conversion” in this system represents the aggregate outcome. Of note, the percentage of
converted Foxp3+ cells was considerably higher after adoptive transfer into lymphopenic
(Fig. 2.10A), as compared with non-lymphopenic (Fig. 2.8), hosts, potentially due to the
empty Treg cell niche available in Tcrb–/– mice. A second difference between the results
from these two hosts was the relative frequencies of Foxp3+ cells recovered from the
various lymph nodes. Lymphopenic hosts showed a decreased frequency of Foxp3+ cells
in the mesenteric relative to other lymph nodes, which may reflect the preferential
accumulation of effector cells, as the transfer of CD4+ T cells depleted of Treg is known
to result in colitis [170].

-68-
Figure 2.10 Peripheral conversion resulting from transfer of Foxp3–CD4+ T cells
into lymphopenic hosts. (A) The frequencies of Foxp3+ cells arising from the transferred
Foxp3– T cells are summarized, with each line representing an independent experiment.
The open circles represent the mean values (±SEM) from three mice within an
independent experiment; the closed circles are values from experiments that consisted of
pooled cells. The dashed line is the percentage of Foxp3+ cells found in
a normal animal (for comparison). (B) Description of TCRα chain sequence datasets
obtained from cells sorted 2.5 wk after adoptive transfer of Foxp3– cells into Tcrb–/–
hosts. The total number of sequences by experiment, location (Crv, cervical; Mes,
mesenteric; Spl, spleen) and phenotype are shown.

Lymph nodeExpt. Phenotype Spleen Mes Crv Total1, mouse 1 Foxp3+ 159 171 194 524
Foxp3– 151 147 172 4701, mouse 2 Foxp3+ 162 150 185 497
Foxp3– 184 180 209 5731, mouse 3 Foxp3+ 176 123 175 474
Foxp3– 162 170 166 4981, mouse 4 Foxp3+ 184 174 174 532
Foxp3– 155 200 174 5292, mouse 1 Foxp3+ 404 413 159 976
Foxp3– 201 154 193 5482, mouse 1 Foxp3+ 367 332 215 914
Foxp3– 150 248 190 5887,123
Number of TCR-α sequences obtained afterlymphopenia-induced proliferation and conversion
B
% F
oxp3
+ of
CD
4+ Vβ6
+ ce
llsA
Figure 2.10 Peripheral conversion resulting from transferof Foxp3–CD4+ T cells into lymphopenic hosts.
-69-

-70-
Initial experiments analyzing TRAV14 TCRα sequences obtained from FACS-
purified Foxp3+ and Foxp3– CD4+ T cells pooled from several recipient Tcrb–/– mice
hinted at a fair degree of mouse-to-mouse variability (data not shown), similar to that
seen in the CD44hi T cell subset in normal mice (Fig. 2.6B). We therefore generated a
database of over 7,000 Foxp3+ and Foxp3– TCR sequences from the cervical lymph
nodes, mesenteric lymph nodes, and spleens of 6 individual recipient mice from two
independent experiments (Fig. 2.10B, Table 2.2).
Based on studies of monoclonal TCR populations showing that the majority of the
antigen-specific T cells remain Foxp3– during peripheral conversion [39, 41, 162], we
were surprised to find relatively little overlap in TCR usage between the converted and
non-converted T cell subsets (Fig. 2.11A). Most of the prevalent TCRs identified in these
experiments showed a marked skewing towards either the Foxp3+ (converted) or Foxp3–
(non-converted) populations, with only a minority (9 of 85) of the TCRs being found
more or less equally in both populations (Fig 2.11B). We observed considerable
differences in the TCR repertoires between the individual mice, even though the donor
cell population was identical within each experiment (Fig. 2.11C right), which was
suggestive of the preferential expansion of cells with a low precursor frequency.
However, the level of dissimilarity between the Foxp3+ and Foxp3– cells from each
animal was equivalent (Fig. 2.11C left). Unlike the repertoires in the normal mice (Fig
2.2, 2.3) TCRs in these experiments did not display a skewing of TCR usage according to
location (Table 2.3), possibly due to the empty T cell nice in these lymphopenic animals.
Although most TCRs were not found in all six individual mice, TCRs recovered from
multiple animals were reproducibly found in either the converted, or nonconverted

TCRs isolated after adoptive transfer are listed by their ability to facilitate peripheral conversion(Conv %) as in Fig 2.11 B. Rare TCRs found at < 0.5% in the posttransfer Foxp3+ and Foxp3–
subsets were excluded. The number of times the TCR was found in the posttransfer and normalperipheral and thymic TCR datasets is shown. These more abundant TCRs found in ourperipherally converted dataset (Conv > 80%) account for ~5% (302 out of 5,973) of the totalsequences in the normal Treg TCR repertoire. However, the appearance of a number of theseTCRs in the thymic Treg cell subset suggests that the actual contribution of peripheral conversionmay be considerably lower under normal conditions.
Table 2.2 Comparison of the normal dataset with TCRs found after adoptive transferof Foxp3– cells into T cell-deficient hosts.
-71-

-72-
Figure 2.11 TCR specificity is important for peripheral conversion in lymphopenic
hosts. (A) The converted and nonconverted TCR repertoires differ. TCRα chain
sequences were obtained as described in Materials and methods. The 50 most abundant
TCRs from each of the converted Foxp3+ and non-converted Foxp3– pooled datasets are
shown, with the frequency in the indicated subset on the y axis. The TCRs are ordered
from the most abundant in the Foxp3+ subset (left) to the most abundant in the Foxp3–
subset (right). (B) TCRs are preferentially skewed toward either the Foxp3+ or Foxp3–
subset. For prevalent TCRs in the pooled dataset (summed frequencies >0.5%), the
percentage of each TCR in the Foxp3+ subset (% Foxp3+/% Foxp3+ + Foxp3–) is plotted
in decreasing order. Arbitrary cutoffs (vertical dashed lines) are shown for TCRs highly
(> 80% Foxp3+), poorly (< 20%), or not (< 1%) associated with conversion. (C)
Assessment of mouse-to-mouse variability. (left) Morisita-Horn index values comparing
the Foxp3+ and Foxp3– TCR datasets within each individual recipient are shown. (right)
The Foxp3+ TCR datasets from individual animals within the same experiment are
compared in green, and the Foxp3– datasets are compared in orange. There were four and
two recipients for the first and second independent experiments, respectively.

A
0
2
2
4
4
6
6
Freq
uenc
y (%
) in
Popu
latio
nFo
xp3+
Foxp
3–
C
Sim
ilarit
y (M
oris
ita-H
orn
Inde
x)
1-2 1-3 1-4 2-3 2-4 3-4
Expt. 1 Expt. 2Expt. 1 Expt. 21 2 3 4 1 2
Within mouse,Foxp3+ vs. Foxp3– Within phenotype, between mice
8
Unique TCRα CDR3 sequences
1-2
Foxp3+
Foxp3–
Converted
Expanded
B
Unique TCRα CDR3 sequencesPerc
enta
ge o
f TC
R s
eque
nces
foun
d in
the
Foxp
3+ su
bset
> 80% < 20% < 1%
0
20
40
60
100
80
Figure 2.11 TCR specificity is important for peripheral conversionin lymphopenic hosts.
-73-

Tabl
e 2.
3 TC
Rα
dis
tribu
tion
afte
r lym
phop
enia
-indu
ced
prol
ifera
tion
and
conv
ersi
on
The
14 m
ost p
reva
lent
TC
R s
eque
nces
poo
led
from
the
four
mic
e in
exp
erim
ent 1
are
list
ed. T
he 1
5th
mos
t fre
quen
t TC
R in
the
Foxp
3+ an
d Fo
xp3–
TCR
s ar
e ea
ch a
lso
foun
d in
the
oppo
site
dat
aset
, as
indi
cate
d by
ast
eris
ks. W
e di
d no
t obs
erve
ast
rong
ske
win
g of
Tre
g TC
R u
sage
bas
ed o
n an
atom
ical
loca
tion
in th
ese
mic
e, u
nlik
e no
rmal
mic
e (F
ig. 2
.3),
poss
ibly
as
are
sult
of th
e em
pty
Treg
cel
l nic
he in
lym
phop
enic
ani
mal
s. P
recu
rsor
freq
uenc
y (%
) is
calc
ulat
ed u
sing
534
TC
Rα
sequ
ence
s fro
m th
e so
rted
CD
4+ Fox
p3–
inpu
t cel
l pop
ulat
ion
(not
e th
at 0
.2%
repr
esen
ts a
TC
R fo
und
once
in th
is d
atas
et).
-74-

-75-
subsets, with few exceptions (Fig. 2.12). Thus, even though both peripheral conversion
and lymphopenia-induced proliferation of non-Treg cells occurred within the same
animal, these data demonstrate that TCR specificity played an important role in Treg cell
fate determination during this immune response.
TCRs that facilitate peripheral conversion are also found within the normal peripheral
and thymic Treg TCR repertoire.
Although we were unable to determine which TCRs undergo peripheral conversion in
normal (non-lymphopenic) hosts due to the low rate of conversion, we did identify TCRs
that facilitate peripheral conversion during the immune response in lymphopenic hosts.
As would be expected, these converted TCRs are found in the normal non-Treg cell
subsets, since the donor cells for these studies were normal Foxp3– cells (Fig 2.13A).
Interestingly, these TCRs were also often found in the normal Treg cell subset, and
constitute approximately 5% of the sequences in the normal peripheral Treg cell data set
(Table 2.2). Although the extent that these TCRs affect the Treg TCR repertoire in
lymphoreplete individuals by peripheral conversion is unknown, these data support our
observation that peripheral conversion makes only a small contribution to the normal
Treg cell population.
It has been proposed that peripheral conversion may play an important role in
generating Treg cells to antigens which are not present in the thymus, such as those found
in the gut [44, 124, 130]. This would predict, then, that converted TCRs should generally
be found within the peripheral, but not thymic, Treg cell subset. We found that, of the
highly converting TCRs that were also present in our thymic sequence data set [164],

-76-
Figure 2.12 Reproducibility of TCR-dependent conversion. Foxp3–CD4+ cells were
transferred into αβ T cell–deficient hosts and recovered 2.5 wk later for TCR sequencing
(Figs. 2.10, 2.11). TCRs that were identified at a frequency of >1% in two or more
recipients were selected, and the frequencies of the indicated TCR in each of the six
individual mice are shown. The frequencies within the Foxp3+ (converted) population
(green) are shown above the axis, and the frequencies within the Foxp3– (nonconverted)
population (orange) are shown below the axis. Ms, mouse.

AASAHHTGGLSGKLTAASARATGGLSGKLT AASPRNSGGSNYKLT
Expt 1
Ms
1
Ms
2
Ms
3
Ms
4
Ms
1M
s 2
Expt 2
Freq
uenc
y (%
) with
in p
opul
atio
n
Figure 2.12 Reproducibility of TCR-dependent conversion.
Expt 1
Ms
1
Ms
2
Ms
3
Ms
4
Ms
1M
s 2
Expt 2Expt 1
Ms
1
Ms
2
Ms
3
Ms
4
Ms
1M
s 2
Expt 2Expt 1
Ms
1
Ms
2
Ms
3
Ms
4
Ms
1M
s 2
Expt 2Expt 1
Ms
1
Ms
2
Ms
3
Ms
4
Ms
1M
s 2
Expt 2
-77-

-78-
Figure 2.13 TCRs that facilitate peripheral conversion are found in the normal
peripheral and thymic Treg cell TCR repertoires. (A) Comparison with the normal
peripheral TCR repertoire. Prevalent TCRs recovered after the transfer of Foxp3– cells
into lymphopenic hosts that are also found in the normal peripheral dataset (Fig 2.1) at a
summed frequency of > 0.15% were identified (Table 2.3). The frequencies of these
overlapping TCRs in the normal dataset are plotted. The TCRs are sorted by their ability
to facilitate conversion, as designated by the vertical dashed lines on Fig. 2.12. (B)
Comparison with the normal thymic TCR repertoire. The frequency of the TCR in the
normal thymic dataset [164] is shown as in A.

A
B
0.0
2.0
Freq
uenc
y (%
) in
Thym
ic S
ubse
t
Foxp
3+Fo
xp3–
1.0
Freq
uenc
y (%
) in
Perip
hera
l Sub
set
Foxp
3+Fo
xp3–
0.0
1.5
3.5
1.5
Unique TCRα CDR3 sequences
Unique TCRα CDR3 sequences
1.0
2.0
2.5
> 80% < 20% < 1%
> 80% < 20% < 1%
CD44lo
CD44hi
Figure 2.13 TCRs that facilitate peripheral conversion are found inthe normal peripheral and thymic Treg cell TCR repertoires.
-79-

-80-
most (11 of 12) could be found within the Foxp3+ subset (Fig. 2.13B). By comparison,
only 2 of 11 TCRs from the poorly converting category were found within the thymic
Foxp3+ data set. One potential explanation for this observation is the presence of
recirculating mature peripheral CD4+Foxp3+ T cells in the thymus. Although the
frequency of recirculating T cells appears low by previous reports [171, 172], a direct
assessment of Foxp3+ Treg cell circulation in normal hosts was not performed. To test
this possibility, we injected 20 x 106 enriched peripheral CD4+ T cells into a congenic
host and assessed the percentage of donor cells in the CD4SP thymocyte population after
1 week (Fig. 2.14). If one assumes that the behavior of the donor cells is representative of
all peripheral CD4+ T cells, then about 4% of thymic Treg cells arise from recirculation.
Because these shared TCRs are not grossly overrepresented in the periphery compared
with the thymus, recirculation alone is unlikely to account for the thymic observation of
TCRs that facilitate peripheral conversion. Rather, we favor the hypothesis that some
TCRs are able to facilitate both thymic and peripheral Treg development. Because we
expect primarily self-antigens to be presented in a normal thymus, these data suggest that
some self-reactive cells, upon escaping Treg cells selection in the thymus, may get a
“second chance” to become Foxp3+ regulatory cells via peripheral conversion.
TCR specificity plays a crucial role in peripheral conversion.
The observation that many TCRs found preferentially on converted Treg cells are also
found on normal thymic Treg cells raised the possibility that we were merely observing
Foxp3 induction in Foxp3– Treg cell precursors that arise in the thymus, and are then
exported before Foxp3 is expressed [173]. We therefore asked whether TCR specificity

-81-
Figure 2.14 Recirculation of peripheral CD4+ T cells to the thymus. 20 million CD4+
T cell–enriched spleen and lymph node cells were injected into normal congenic
recipients. 1 wk later, the spleen and thymus were analyzed by flow cytometry to
determine the percentage of CD4+ T cells derived from the donor (left), and the
percentage of those that are Foxp3+ (right). Data are pooled from two independent
experiments (n = 5 mice), summarized in the bottom graphs (closed circle, individual
mouse; horizontal line, mean). To estimate the percentage of thymic T reg cells that come
from recirculating peripheral T cells, we assumed that the behavior of our adoptively
transferred CD4+ cells represented that of the normal peripheral T cell population.
Therefore, recirculating cells comprise ~0.8% of the CD4 SP population (0.03% of donor
T cells in the CD4 SP thymus times 26.3, the ratio of host:donor cells in the spleen
[1:0.038]). 16.4% of recirculating cells are Foxp3+; this suggests that recirculating Treg
cells comprise 0.13% of the CD4 SP population. Thus, ~4% of the normal thymic Treg
cell subset may arise from recirculation (0.13% of ~3%, the normal thymic Treg cell
frequency). If we assume that Treg cells that develop in the periphery recirculate as
estimated, then the extent of thymic recirculation is not sufficient to account for the
presence of thymic Treg cells with TCRs also found in the converted population. For
example, two of the most frequent TCRs found within the converted Foxp3+ population,
with CDR3 amino acid sequences AASDYGSSGNKLI and AASANSGTYQR (Table
2.2), are found in the normal Treg cell population at frequencies of 0.8 and 0.4%,
respectively. Therefore, we could expect that they would account for 0.032% (0.8 x 4%)
and 0.016% (0.4 x 4%) of thymic T reg cells. However, their frequencies within the
normal thymic Foxp3+ population are far greater (0.4 and 0.3%, respectively).

CD45.1
CD
45.2
2.9
4.29.0
Spleen
Thymus
18.7
0
4.2105
104
103
0.03
0
105
104
103
0 100 105104103
0
105
104
0 100 105104103
0
105
104
0 100 105104103
TCRβ+ CD4+
Spleen Thymus% d
onor
-der
ived
CD
4+ ce
lls
% F
oxp3
+ of
don
or-d
eriv
edC
D4+
cells
Spleen Thymus
CD45.2CD45.1
CD
25
Foxp3
Figure 2.14 Recirculation of peripheral CD4+ T cells to the thymus
-82-

-83-
alone, in the absence of thymic conditioning, is sufficient to direct peripheral conversion
by introducing selected TCRα chains into peripheral monoclonal T cells from TCli αβ-
TCR transgenic x Foxp3gfp mice on a Rag1–/– background and then transferring them into
Tcrb–/– hosts [33]. As the cells were isolated and treated identically, they should differ
only by the additional retroviral TCRα chain at the time of transfer.
We first tested two TCRα chains (B2, B132) that were previously identified in naïve
T cells, and also found primarily in the non-converted T cell subset in our lymphopenic
expansion experiments (Fig. 2.15 A). These TCRs were also previously shown to be
unable to facilitate in vivo expansion of T cells in Rag1–/– hosts [37]. Consistent with
their low frequencies in the converted TCR data sets, we found that these naïve TCRs did
not facilitate either Foxp3 induction or expansion (Fig. 2.15 B). Therefore, TCR
activation and retroviral introduction of an additional TCRα chain alone are not sufficient
to induce Foxp3 expression in these cells.
We then tested four TCRα chains that were identified in the highly converting
Foxp3+ TCR data set (R19, R22, TR3, and TR5; Fig. 2.15 A, Table 2.2), and found that
they also facilitated peripheral conversion in retrovirally transduced cells (Fig. 2.15 B,
top). Thus, these data demonstrate that TCR specificity alone, in the absence of a unique
thymic signal, is sufficient to facilitate the process of peripheral conversion.
Because these highly converting TCRs were also found in the normal Treg TCR data
set, we tested the ability of other natural Treg TCRs that were not found in the conversion
experiments to facilitate conversion. Interestingly, only one of the four Treg TCRs tested
(R111) was able to induce Foxp3 in a sizable proportion of cells, whereas the others did
not (G113, G5, G57). The inability to augment conversion was presumably not due to a

-84-
lack of TCR engagement, as these other TCRs did facilitate in vivo expansion (Fig. 2.15
B, bottom), suggesting that their cognate antigens were available in the periphery. It also
appeared that certain TCRs favored expansion and conversion in different anatomic
lymph nodes, which is consistent with our analysis of the normal Treg TCR repertoire
(Fig. 2.2, 2.3). For example, R22 seems to promote conversion in the axillary and
inguinal LNs, but less so in the mesenteric LNs (Fig. 2.15 B, top). Conversely, G57
showed expansion in the mesenteric LN but not in the axillary and inguinal LNs, (Fig.
2.15 B bottom), in accordance its distribution in the normal Treg cell population. In
summary, these data suggest that TCR specificity determines whether a cell is capable of
peripheral conversion, but that not all TCR specificities associated with peripheral Treg
cells have this capability.

-85-
Figure 2.15 TCR specificity is sufficient to direct peripheral conversion in
lymphopenic hosts. (A) Frequency distribution of TCRs tested. Data shown are the
frequencies (percentages) of the TCRs in the datasets from thymocytes, normal peripheral
T cells, and T cells recovered after adoptive transfer into lymphopenic hosts. (B)
Retroviral manipulation of TCR specificity in peripheral T cells. Monoclonal TCli
αβTCR transgenic T cells were transduced with TCRα chains, as described in Materials
and methods. (top) The frequency of Foxp3+ cells in the transduced (Vα2+Vβ6+CD4+) T
cell population was assessed by flow cytometry 2.5 – 3 wk after adoptive transfer into
Tcrb–/– mice. (bottom) The absolute number of transduced (Vα2+) cells recovered was
calculated using the total cell count and the frequency of Vα2+Vβ6+CD4+ T cells within
the live gate, as determined by flow cytometry. Data shown are from individual mice and
were obtained from five independent experiments constituting at least two independent
retroviral transductions per TCR. Each symbol represents data from an individual
recipient (n = 4-6), and the horizontal bars represent mean values.

TR5
A
B Axillary-Inguinal LNs
Foxp
3+ (%
)
Cel
l num
ber (
x105
)
Cel
l num
ber (
x104
)
Foxp
3+ (%
)
Mesenteric LN
B132 B8 R22
R19
R11
1
TR3
G11
3
G5
G57
TR5
B132 B8 R22
R19
R11
1
TR3
G11
3
G5
G57
Figure 2.15 TCRs that facilitate peripheral conversion are found inthe normal peripheral and thymic Treg cell TCR repertoires
-86-

-87-
Chapter 2: Discussion
Our analysis of the peripheral TRAV14 TCR repertoire strongly suggests that
immune regulation is a tissue-specific activity, as the antigen-specificity of the protective
Treg cell population changes considerably by anatomic location (Fig. 2.2, 2.3). These
data are consistent with our previous observations of individual Treg TCR-driven
proliferation in normal hosts, in which CFSE dilution was more pronounced in certain
lymph nodes [33]. Thus, the observation that tissue-specific antigens greatly modify the
local Treg TCR repertoire provides direct evidence for a mechanism by which the
presence of an organ facilitates Treg cell-mediated tolerance to that organ [78-80].
Another intriguing observation is that the Treg and CD44hi TCR repertoires showed
similar patterns of variability by anatomic location. This suggests that Treg and CD44hi
populations share similar fundamental behaviors governing their interaction with tissue-
specific antigens, even though the conditions for their development may be different.
These data therefore support previous studies using monoclonal TCR transgenic mice
[174] demonstrating that both Treg and non-Treg cells undergo clonal expansion upon
antigen encounter. The expansion and maintenance of Treg cells specific for antigens
normally presented in the peripheral self would favor tolerogenic Treg cell responses to
those antigens, rather than novel foreign antigens. Thus, we hypothesize that shaping of
the Treg cell population to the local antigenic landscape provides another mechanism for
self/non-self discrimination by the immune system.
Contrary to previous studies [43], we did not find that peripheral conversion played a
prominent role in the generation of the peripheral Treg cell population (Fig. 2.8). This
difference could be explained in part by our use of Foxp3 as a marker for Treg cells,

-88-
rather than CD25 [32], to isolate non-Treg cells for adoptive transfer and analysis of
conversion. Nonetheless, the use of mature Foxp3–CD4+ thymocytes may still
overestimate the role of peripheral conversion because we cannot exclude the presence of
rare CD25–Foxp3– Treg cell precursors within this subset. We can also not be certain that
these mature thymocytes are phenotypically identical to recent thymic emigrants in terms
of their potential to undergo peripheral conversion. On the other hand, the use of
peripheral Foxp3–CD4+ T cells may underestimate the role of peripheral conversion
because we can only assess the fraction of Foxp3– cells capable of converting at steady
state, and those T cells with the greatest propensity to undergo peripheral conversion are
likely to be underrepresented. Thus, we believe our estimate that peripheral conversion
contributes about 4-7% of the normal adult peripheral T reg cell population represents the
best currently available figure.
We also studied the process of peripheral conversion during the immune response of
Foxp3– cells transferred into αβ-T cell deficient hosts, which may mimic the
lymphopenic and Treg cell-deficient conditions during the early neonatal period. We
found that peripheral conversion occurred much more readily in this environment than in
a lymphoreplete host, and this made it technically feasible to perform TCR usage
analysis. Interestingly, we found that peripheral conversion in polyclonal populations did
not mirror previous experiments using monoclonal T cell populations, where a portion (~
20%) of cells became Foxp3+ after non-inflammatory antigen encounter in both non-
lymphopenic and lymphopenic models [39, 40, 173]. Rather, we observed no consistent
patterns governing peripheral conversion during T cell expansion, finding that individual
TCRs ranged from being highly skewed toward or against peripheral Treg cell

-89-
development (Fig. 2.11B, 2.12). Thus, the analysis of polyclonal TCR repertoires from
both lymphopenic and non-lymphopenic environments do not support a model in which
peripheral conversion is an automatic consequence of T cell activation, but rather one in
which peripheral conversion is highly dependent on TCR specificity.
Although our data do not directly allow us to determine whether peripheral
conversion occurs upon recognition of non-self antigens, it appears likely that many
TCRs which facilitate conversion are reactive to self antigens. This is strictly based on
the observation that several TCRs from converted Treg cells in lymphopenic hosts can
also be found in the normal thymic Treg cell subset (Fig. 2.13, Table 2.2). As previously
argued, we believe that thymic Treg development occurs via recognition of self [164],
rather than nonself [81], antigens. Although we cannot exclude the possibility of
peripheral nonself-antigen presentation in the thymus, nor the possibility that different
peptides are recognized in the thymus and periphery, the most straightforward
explanation is that the same self-reactivity that induces Treg cell development in the
thymus also does so in the periphery. Although future experiments will be required to
prove that the observed bias of converted TCRs toward the thymic Treg TCR repertoire is
caused by the recognition of the same self-antigens, these data suggest that some cells
that escape thymic Treg cell development express self-reactive TCRs which facilitate a
second chance for Treg cell development in the periphery.
Peripherally converted Treg cells may develop directly from naïve T cells, or instead
differentiate from memory/effector T cells [173]. In vivo data suggests that an
appreciable frequency of Foxp3+ cells requires one or more weeks to develop [39-41].
This time frame favors a multi-step process, but may also reflect a need for post-

-90-
conversion expansion. By contrast, in vitro studies have suggested that TGFβ−mediated
induction of Foxp3 is considerably more efficient in naïve than memory T cells [175]. In
fact, it has been reported that TGFβ is unable to induce Foxp3 in previously in vitro
differentiated T cells [176]. Because in vitro TCR stimulation is used in the retroviral
transduction protocol, our data directly demonstrate that, in vivo, peripheral conversion
from previously activated T cells can still occur in the context of an appropriate TCR
specificity (Fig. 2.15), hinting at possible differences between in vitro and in vivo
conversion.
It is clear, however, that conversion alone is insufficient to maintain immune
homeostasis, as shown by the development of colitis and other autoimmune
manifestations upon transfer of Treg cell-depleted CD4+ T cells [78-80, 152, 170].
However, conversion may diminish the severity of disease [41, 177]. The inability to
prevent disease may be due to the limited Treg TCR repertoire generated by peripheral
Treg cell development, which has been suggested to permit autoimmunity in
lymphopenic mice [178]. Alternatively, it may be that peripheral conversion occurs too
late to fully prevent autoimmune pathology. One interesting hypothesis is that
autoimmune disease may also be exacerbated by self-reactive Foxp3– T cells expressing
Treg TCRs that escape into the periphery [33], but are unable to undergo peripheral
conversion due to their antigen specificity (Fig. 2.15).
These data demonstrate a critical role for TCR specificity in the decision to undergo
peripheral conversion. One potential mechanism by which this occurs is that the “nature”
of the TCR-ligand interaction itself could generate a unique signal that results in Foxp3
expression. This has been suggested by an αβ-TCR x cognate antigen double transgenic

-91-
model of thymic Treg cell development [36]. In this model, the high affinity ligand
induced both deletion and Treg cell development, whereas a slightly different, lower
affinity ligand could only induce deletion. However, a mechanism dependent on unique
TCR signals would be unable to distinguish the context of T cell activation in the
periphery, making it teleologically less appealing. An alternative, non-mutually
exclusive, hypothesis is that the TCR specificity results in activation within an
environment which facilitates peripheral Treg cell development. We favor this latter
model, in which antigen presentation can occur on APCs and/or within
microenvironments that determine whether a given T cell will become a regulatory or
effector cell. Based on current data, we suspect that a microenvironment promoting
peripheral conversion would contain TGF-β and potentially retinoic acid [40, 44, 124,
130]. Therefore, the balance of antigen presentation between two different
microenvironments would determine the pathologic or tolerogenic outcome of the
immune response to an antigen.

-92-
CHAPTER THREE
The Colonic Foxp3+ Regulatory T Cell Repertoire is Shaped by Recognition of Commensal Gut Bacteria

-93-
Chapter Three: Preface
The findings described in this chapter were a natural outgrowth of the results
described in Chapter Two. In sequencing TCRs from CD4+ T cells in various locations,
we wondered if those found in the gut would show signs of antigen specificity and a
unique TCR repertoire. In the gut, this would imply that at least a portion of the Treg
cells would have developed extra-thymically, via peripheral conversion, in response to
unique antigens derived from the commensal microbiota, which would not be available
for selection in the thymus. With reports such as that by Sun et. al. [44] showing an
increased prevalence of conversion in the GALT, and our own finding that conversion
was higher in the MLN than in other LN or the spleen [150], we expected we might see
more evidence of peripheral conversion in the Treg of the gut.
The large portion of these studies included in this chapter would not have been
possible without the generous and enthusiastic contribution made by our collaborators
Seth Bloom and his mentor Thad Stappenbeck. Seth’s offer of his knowledge and skills
to culture many strains of bacteria that live in the colon and cecum of the mice in our
colony made possible some of the most exciting results we present in this chapter, and for
this I am greatly indebted to him. He has contributed to the Materials and methods
section of this chapter directly with a description of his techniques in culturing bacteria
from the intestinal contents. The studies presented here are currently being prepared as a
manuscript for publication.

-94-
Chapter Three: Abstract
Regulatory T cells (Treg) play an essential role in the maintenance of homeostasis
in the face of constant exposure to the organisms, both beneficial and potentially harmful,
which are encountered in the gut. To determine if the colon, with its unique environment
and antigens derived from the commensal microbiota, harbors an equally unique Treg
population we determined the repertoire of TRAV14 (Vα2) TCRα chains found on the
CD4+Foxp3+ T cells of the spleen, mesenteric lymph nodes (LN), cervical LN, and
colonic/cecal lamina propria (LP) in mice expressing a single TCRβ chain. We found the
repertoire of the colon Treg to be unique, with no appreciable overlap with Treg from
other locations in the body, nor with the naïve or CD44hi memory T cells in the colon.
Using reporter hybridomas expressing those TCRs found most commonly on the colonic
Treg, we screened for reactivity to preparations of bacteria cultured from the colon and
cecum of mice in our colony. Amazingly, 3 of 12 TCRs tested were found to react to
specific bacterial preps, and 4 others reacted to a preparation of autoclaved colon/cecal
contents. CD4 single-positive (SP) thymocytes expressing these TCRs showed no sign of
Foxp3 expression in the thymus, while those expressing Treg TCRs from other locations
did. T cells expressing two of these bacterial-reactive TCRs were confirmed to show no
Foxp3 expression in the thymus in mixed bone marrow chimeras. However, these T cells
developed Foxp3+ T cells in the colonic LP when hosts were cohoused with littermates of
the mice expressing the fixed TCRβ chain. These studies show that the colonic Foxp3+
Treg show unique TCR specificities, some of which develop in situ upon recognition of
antigens derived from commensal bacteria.

-95-
Chapter Three: Introduction
The maintenance of tolerance in the gut requires that the immune system retain
the ability to respond to pathogens but also be tolerant to the large number of
microorganisms which inhabit the site, many of which provide essential nutrients and
other benefits to their host. When this ability to maintain tolerance to the commensal
microbiota fails, the result is inflammatory bowel disease (IBD), which in humans
generally manifests as Crohn’s disease or ulcerative colitis. These debilitating and
sometimes fatal diseases affect an estimated 0.1 – 0.2% of the population [133].
One important part of the strategy employed by the immune system for
accomplishing this feat are the CD4+Foxp3+ regulatory T cells (Treg). These cells are
essential for the maintenance of gut homeostasis. In Foxp3-deficient scurfy mice, and in
patients harboring a mutation in Foxp3, one of the earliest autoimmune manifestations to
occur is severe enteropathy [144, 179]. Similarly, in mice engineered to express the
human diptheria toxin (DT) receptor under the Foxp3 promoter, administration of DT
results in elimination of the Foxp3+ T cells, and severe wasting disease quickly develops
[30]. A widely used model for the development of IBD is the transfer of T cells depleted
of the Treg population into a lymphopenic recipient; in the absence of regulation these T
cells cause intestinal inflammation, which can be prevented by the co-transfer of the
Foxp3+ Treg population [146].
Most Treg develop their regulatory phenotype, indicted by the expression of
Foxp3, during thymic selection [33-35, 150]. However, Foxp3+ regulatory cells can also
develop from mature, non-regulatory CD4+ T cells outside of the thymus under certain
conditions, a process termed peripheral conversion [173]. This has been shown to occur

-96-
under circumstances in which cognate antigen is introduced in a non-inflammatory
setting, and may be a mechanism to generate tolerance to antigens not found in the
thymus. While it is estimated that peripheral conversion does not contribute greatly to the
peripheral Treg repertoire [34, 35, 150], several studies have shown an increased amount
of conversion in the mesenteric LN (MLN) and small intestine lamina propria, under
steady state conditions and during induction of oral tolerance [44, 124, 150]. However,
these studies did not address the potential for conversion in the colon.
The dendritic cells (DC) found in the gut appear to be uniquely capable of
mediating peripheral conversion. In particular, the CD103+ DC have been shown to carry
bacterial antigens from the lamina propria to MLN [91]. DC can obtain bacterial antigens
that have been transcytosed by M cells in the intestinal epithelium, by the phagocytosis of
apoptotic intestinal epithelial cells which may have been invaded by bacteria, or even by
direct sampling of luminal contents [90]. Therefore, it would seem likely that T cells
recognizing bacterial antigens presented by these tolerogenic intestinal DC may become
Treg that are then capable of mediating tolerance in the intestines. Exposure to this subset
of DC also causes upregulation of gut homing molecules, due to their ability to provide
retinoic acid (RA), and therefore can also cause these T cells to traffick to the LP [123,
129].
There is some evidence that Treg in the gut need to recognize bacterial antigens to
efficiently preserve tolerance to the commensal bacteria. Strauch et. al. showed that co-
transfer of CD4+CD62L– cells (containing the regulatory population) isolated from germ
free mice did not prevent disease development after transfer of CD4+CD62L+ T cells into
SCID mice [147]. However, it appears from the low expression of GITR and deficiency

-97-
in Foxp3 mRNA that the germ-free CD4+CD62L– T cells may have been relatively
deficient in Foxp3+ Treg. Using the transfer of CDRBhi cells into SCID mice, Singh et.
al. showed that co-transferred CDRBlo cells from germ free mice were capable of
preventing IBD only at high cell numbers, but when fewer Treg were transferred they
proved to be less efficient than the comparable population from SPF mice [148]. These
studies imply that without bacterial recognition, the Treg population in the colon is
somewhat incomplete.
In a previous report we showed that the TCR repertoire of Foxp3+ Treg varied
according to their location, suggesting that the repertoire is reflective of the local
antigenic milieu [150]. These TCRs also differed from those found on the activated
memory T cells expressing high levels of CD44, indicating that these two populations do
not overlap in their antigen specificity. We speculated that the unique antigenic
environment of the colon would result in a particularly unique repertoire of TCRs being
used by the colonic Treg cells, and therefore this led us to sequence the TCRα chains
from Foxp3+, CD44hi, and naïve CD44lo CD4+ T cells isolated from the colonic LP of
mice expressing a fixed TCRβ chain. Indeed we found that these TCR were not shared
with Foxp3+ TCRs found in other locations, nor with the activated/memory CD44hi or
naïve CD44lo populations.
We hypothesized that these unique specificities may be due to the availability of
antigens derived from the commensal microbiota, and that these Treg may develop from
Foxp3– cells via peripheral conversion. We indeed found that several of these TCRs
recognized antigens derived from commensal bacteria or recognized some component of
the colon/cecum contents of mice in our colony but not from germ-free mice. T cells

-98-
expressing these TCRs showed no sign of Foxp3 expression in the thymus, but two such
TCRs were demonstrated to have developed Foxp3 expression after isolation from the
colonic LP. Therefore, at least some Treg found commonly in the colonic LP have
developed in the periphery upon recognition of an antigen derived from commensal
bacteria.

-99-
Chapter Three: Materials and methods
Mice
The Foxp3gfp reporter knockin, TCliβ transgenic and TCliαβ transgenic mice
were kindly provided by Dr. Alexander Rudensky (then at the U. of Washington, Seattle,
WA) and were bred in the specific-pathogen-free (SPF) facility at Washington University
in St. Louis. Rag1–/– and Tcra–/– mice were obtained from the Jackson Laboratory (Bar
Harbor, ME). CD45.1 congenic mice were obtained from National Cancer Institute
(Frederick, MD). Animals were used according to protocols approved by the Institutional
Animal Care and Use Committee.
Cell purification, sorting and sequencing
Colonic lamina propria lymphocytes were isolated from the cecum and colon
combined, rinsed with cold medium, cut into small pieces and incubated in RPMI
containing 3% FBS, 20 mM HEPES, 5 mM EDTA and 0.145 mg/ml DTT for 20
minutes at 37˚C with constant stirring. Pieces then underwent three rounds of shaking in
RPMI + 2 mM EDTA, followed by digestion of the pieces in 0.2 mg/ml Liberase CI
(Roche) for 15 minutes at 37˚C with constant stirring, followed by addition of fresh
enzyme and stirring for another 15 min. Digested tissue was forced through a Cellector
tissue sieve (Bellco Glass, Inc.) and then underwent washing and filtering through 70 µm
and 40 µm filters. Cells were spun down and resuspended in 2ml of RPMI containing
10% FBS, filtered through a 37 µm filter, counted and then stained with antibodies and
either analyzed or sorted by flow cytometry as described below.

-100-
T cell suspensions from the spleen or lymph nodes to be sorted were incubated
with biotinylated anti-B220 (RA3-6B2) and anti-CD8 (53-6.7) antibodies (Biolegend),
followed by incubation with anti-biotin magnetic microbeads (Miltinyi Biotech) and
enriched by depletion by magnetic separation using an AutoMACS (Miltinyi Biotech).
Remaining cells were stained with antibodies for CD4 (RM4-S), Vβ6 (RR4-7) and CD44
(IM7) and sorted by flow cytometry using a FACSAria (Becton Dickinson). Cells to be
analyzed by flow cytometry were stained with a combination of fluorescently-labeled
antibodies including: Vβ6 (RR4-7), CD4 (RM4-S), CD8 (53-6.7), Vα2 (B20.1), GITR
(YGITR 765), CD25 (PC61), Thy1.2 (30-H12), CD45.1 (A20), CD45.2 (I04), and CD24
(M1/69).
Cloning of TRAV14 TCRα sequences from sorted T cells was performed as
previously described [33]. As before, we utilized the CDR3 amino acid sequence
provided by IMGT/V-QUEST as a unique identifier for individual TCRs [163].
Statistical Analysis
The Morisita-Horn similarity index was used to assess the amount of similarity
between any two sets of TCR sequences, as in previous studies [33, 37, 150]. This unit-
less index ranges from 0 to 1, with 0 representing complete dissimilarity and 1 being
absolutely identical [165]. The Morisita-Horn index takes into account the frequency of
each TCR, and is relatively resistant to the sample size, as compared with other similarity
indices such as the Jaccard. A sequence found in both data sets at greatly different
frequencies would therefore contribute to dissimilarity by this index. For reference, a
comparison of the first 200 randomly chosen sequences with the last 200 sequences of an

-101-
~400 sequence data set results in a Morisita-Horn index of about 0.9, which represents an
experimentally derived value for the maximum expected similarity, incorporating the
inherent variability due to random sampling.
Creation and screening of hybridoma cell lines expressing colonic Treg TCRs
The 58α−β− hybridoma cell line stably transduced with hCD4-pA-GFP-NFAT-
RVT was a generous gift of Wataru Ise in the laboratory of Ken Murphy (Washington
University in St. Louis) [180]. This hybridoma was then transduced with MigR1-derived
retrovirus (without IRES GFP) containing TCli TCRβ chain and downstream mCD4
under an IRES. These hybridomas were sorted for expression of mCD4 and the sorted
cells used as the parental cell line for introduction of TCRα chains of interest by
retroviral transduction with MigR1-derived retrovirus containing the TCRα chain. After
introduction of the TCRα chain, cells were allowed to expand and then sorted for high
surface expression of the TCR.
Dendritic cells (DC) used in these cultures were obtained from a wild type mouse
injected with 3-5 x 10⁶ B16 melanoma cells engineered to produce Flt3 ligand (Flt3L)
subcutaneously 7-8 days prior. Spleen and enlarged inguinal LN from the side of
injection were collected and DC were enriched by use incubation with biotinylated
CD11c mAb (N418) (Biolegend) followed by incubation with anti-biotin MACS
microbeads (Miltinyi Biotech) and subsequent positive selection with an AUTOMacs
(Miltinyi Biotech). Cells were washed, resuspended in DMEM with 10% FBS, and used
as APC in screening cultures.

-102-
1x10⁴ colonic Treg TCR-expressing reporter hybridomas cells were cultured with
1x10⁴ DC and antigen from either individual bacterial isolates, pools of bacterial isolates,
medium only, autoclaved cecum/colon contents (ACP, see below), or 0.1 µg/ml αCD3.
The amount of bacterial prep or ACP added was optimized experimentally; the most that
could be added without compromising the health of the cells was used. Often this was
about a 1:200 final dilution in the culture. In some cultures, blocking aMHC class II mAb
(M5-114) was added at 10 µg/ml. After about 40-44 hours cells were collected and
stained with CD4 and Vβ6, and analyzed by flow cytometery on a FACSCanto (Becton
Dickinson).
Creation of bacterial and cecum/colon content preps for screening
Cecum and colon contents of two mice that were wild-type littermates of the TCli
TCRβ trasnsgenic mice used for sequencing studies were aseptically harvested under
anaerobic conditions, pooled in sterile pre-reduced PBS, and plated on a variety of media
types in serial, half-log dilutions, which allowed isolation of unique-appearing colonies
from the plates with the largest number of individually distinguishable colonies [181,
182]. The media types used for anaerobic culture were Anaerobic Reducible Blood Agar
(ANB) (Remel, general anaerobic growth media), Anaerobic Reducible CNA Blood Agar
(ACNA)(Remel, enriched for growth of Gram positive anaerobic organisms), Anaerobic
Reducible LKV Blood Agar (LKV) (Remel, selective for growth of Gram negative
obligate anaerobes), Bacteroides fragilis Isolation Agar (BBE) (Remel, contains
gentamicin to inhibit most facultative anaerobes, bile to inhibit most anaerobic gram
negative bacteria, and esculin to differentiate members of the B. fragilis group), and

-103-
Rogosa agar (Rog)(for cultivation of lactobacilli). The media types used for aerobic
culture were Tryptic Soy Agar with 5% Sheep Blood (TSA) (Remel, general aerobic
growth media), Chocolate Agar (Choc) (Remel, general aerobic growth media enriched
for isolation of fastidious aerobes), Columbia CNA with 5% Sheep Blood (CCNA)
(Remel, for selective isolation of gram-positive cocci and inhibition of gram-negative
bacilli), and MacConkey Agar (Mac) (selective and differential for isolation of gram
negative aerobes or facultative anaerobes).
Cultures were incubated for 2-7 days at 37°C in ambient room air (aerobic
cultures) or 7-14 days in a Bactron-IV Anaerobic Chamber (Shel Lab) at ~37°C in an
atmosphere of 5% hydrogen, 5% carbon dioxide, and 90% nitrogen (anaerobic growth).
Unique-appearing single colonies were picked and sub-cultured them on fresh media,
then passaged a second time to ensure purity. Sub-cultured bacteria were subsequently
grown in BHI broth or Thioglycollate broth (Remel), concentrated by centrifugation, re-
suspended in sterile PBS, and concentrated again by centrifugation. Cultures that did not
grow in liquid media were removed from the surface of culture plates using sterile swabs
and resuspended in sterile PBS. Aliquots were frozen for subsequent re-culture and for
DNA isolation. The remainder was heat-killed by incubating at 75°C for 60 minutes, then
frozen and preserved for subsequent T-cell analysis.
To prepare whole colon and cecal contents for screening (ACP) the contents were
collected and mixed with PBS to make a slurry which was homogenized using a VWR
PowerMAX homogenizer. The preparation was then autoclaved to sterilize, and filtered
through sterile 70 µm nytex mesh to remove large particulates. The preparations were
then frozen at –20˚C for short-term use or –80˚C for long term use.

-104-
Identification of bacterial isolates using 16S rRNA sequencing
Genomic DNA was extracted from individual isolates and the bacterial 16S rRNA
gene was PCR-amplified using primers Bact-8f and Bact-1510r [84, 183]. The resulting
PCR product was then sequenced using one or both of the original PCR primers.
Sequences were edited and trimmed for quality using the Trev 1.9 program of the Staden
Package©. When available, forward and reverse reads were assembled into a single contig
using SeqMan from the DNAStar© Lasergene software package, Version 8.0.2. The 16S
sequences were classified using the Ribosomal Database Project (RDP, Release 10,
Update 15) Classifier and the closest cultured and un-cultured matches from GenBank
were identified using RDP’s SeqMatch program supplemented by BLAST analysis [184-
187].
Retroviral transduction of Rag–/– thymocytes and intrathymic injection
Thymocytes from donor (CD45.2) Foxp3gfpRag1–/– of 5 - 8 weeks of age were
collected and underwent “spinfection” by a MigR1-derived retrovirus which expressed
the TCRα chain being analyzed and the TCli TCRβ chain downstream of the P2A
sequence, as described [188]. After spinfection and a rest in culture for 1 – 2 hours, cells
were thoroughly washed and resuspended in PBS for intrathymic injection of sublethally
irradiated (600 rad) CD45.1 congenic 6 - 10 week old hosts. Thymocytes were then
analyzed by flow cytometry 14 - 16 days after injection to assess for the expression of
Foxp3gfp of CD45.2 (donor) CD4 SP cells.

-105-
Creation of retroviral bone marrow chimeras
Donor Foxp3gfpRag1-/- mice were conditioned with 5-fluorouracil before bone
marrow was collected. After 2 d of culture in recombinant mouse IL-3 (10 ng/ml),
recombinant human IL-6 (20 ng/ml) and recombinant mouse stem cell factor (100 ng/ml),
bone marrow cells underwent 'spin infections' on two consecutive days with MigR1-
derived retrovirus expressing the CT2 or CT6 TCRα chain, as well as the fixed TCli
TCRβ chain downstream of the P2A sequence [188]. On the fourth day of culture, the
bone marrow cells were mixed with CD45.1 Foxp3gfp bone marrow harvested from 5-
fluorouracil-treated mice at varying ratios and were injected into lethally irradiated
CD45.1 hosts (1,050 rads). In some experiments, the mice were cohoused with a mature
female littermate of the TCliβ transgenic mice used for sequencing studies for 7-10 days,
starting at approximately two weeks after bone marrow injection. Cells from the thymus,
spleen, colon LP, MLN, and pooled inguinal, axillary and cervical LNs of the mice were
analyzed by flow cytometry 8-9 weeks after bone marrow injection.

-106-
Chapter Three: Results
Colonic Treg express a unique repertoire of TCRs
We previously observed that the TCR repertoire of Treg show a marked skewing
of their TCR repertoire according to location, suggesting that they home to sites
according to their antigen specificity much as memory T cells do [150]. The intestine is a
unique site immunologically, with its access to the commensal organisms and food
particles of the intestinal lumen and a need to maintain tolerance to their constantly
shifting antigens. Therefore, as an extension of our previous study we chose to sequence
the TCR repertoire of T cells isolated from the lamina propria (LP) of the colon and
cecum (hereafter referred to as the colon). We isolated and sorted CD4+Foxp3+ (Treg),
CD4+Foxp3–CD44hi (memory T cells), and CD4+Foxp3–CD44lo (naïve T cells) from the
spleen, mesenteric LNs (MLN), cervical LNs (CLN) and colon in order to compare their
TCR repertoires. Cells were pooled from 3 or 4 mice in each of two independent
experiments, and in a third experiment cells from the spleen, MLN and colon from five
mice were pooled (Table 3.1). As in previous studies [33, 37, 150], these mice express
the TCRβ chain from the TCli TCR transgenic mouse (TCliβ), the Foxp3gfp fusion
protein reporter, and are heterozygous for TCRα locus expression, ensuring that each T
cell expresses a fixed TCRβ chain and a single, endogenously rearranged TCRα chain.
We sequenced the TRAV14 (Va2) chains and used the CDR3 amino acid sequence of the
chain as a unique identifier of that TCR.
As we hypothesized, the Foxp3+ subset isolated from the colon showed a TCR
repertoire that was unique, with essentially no overlap with those found in other locations

Expt 1 Colon Spleen Mes LN Cerv LN TotalFoxp3+ 258 409 434 467 1568CD44hi 120 451 490 398 1459CD44lo 228 337 395 397 1357Total 606 1197 1319 1262 4384
Expt 2 Colon Spleen Mes LN Cerv LN TotalFoxp3+ 357 283 361 284 1863CD44hi 315 283 276 365 1927CD44lo 281 278 306 278 1926Total 953 844 943 927 5716
Expt 3 Colon Spleen Mes LN TotalFoxp3+ 207 142 162 511CD44hi 197 211 193 601CD44lo 185 148 184 517Total 589 501 539 1629
Table 3.1 TCR sequences from experiments usingpooled animals
Number of sequences obtained from each population of cellsisolated from the indicated tissue. Each experiment consisted ofcells pooled from 3-5 mice. Cervical LN was not sequenced inExpt 3.
-107-

-108-
(Fig 3.1-3.2). While the repertoires of the Treg in each location did not overlap with the
others to a large degree, the comparison with the colon was the least similar in each case,
including, somewhat surprisingly, the MLN, with a Morisita-Horn similarity index of less
than 0.1 in each case (Fig 3.2). As expected, the CD44lo naïve T cell repertoires were
fairly similar across all locations, although the similarity between the colon and other
locations was slightly lower, perhaps reflecting differences in the T cell trafficking
patterns to the colon. The CD44hi memory T cell populations showed a somewhat skewed
repertoire according to location, as previously reported, which held true for the colon as
well, but there was a somewhat increased similarity seen between the colon and MLN in
this population. In summary, our hypothesis that the colon Treg would utilize a
particularly unique repertoire of TCRs was correct, perhaps due to the unique antigens
available at that location.
Because these experiments used a pool of cells from several mice, we wished to
compare the TCRs from individual animals in order to determine to what extent the TCR
repertoire of the colonic Treg varied, and to identify the TCRs that are most commonly
found on the colon Treg population. We therefore sequenced the TCRα chains from the
colonic T cells in five individual animals (Table 3.2). This analysis revealed that the
colonic Treg TCRs are somewhat conserved between individuals, a pattern that was also
seen in the colon sequences from experiments using cells pooled from multiple mice (Fig
3.3 A and not shown). In contrast, the CD44hi memory T cell repertoire showed no
overlap between individuals; in was, in fact, difficult to find TCRs that occurred in more
than one animal. This would suggest that the memory T cell population is directed at
different antigens in each animal, presumably a microbial antigen from a species that is

-109-
Figure 3.1 Foxp3+ Treg TCRs from the colon are unequally distributed.
The anatomical distribution of the most abundant TCR sequences within each phenotype
are shown. Using the average frequencies from the pooled TCR datasets from all three
experiments, the top 50 TCR sequences within a given phenotype were selected. For each
TCR, the relative frequency with which it is found at each anatomical location was
calculated by dividing its frequency at each location by the sum of the frequencies at all
locations. The frequency is represented on the heat map by decile, with the scale
indicating the colors at 100 (red), 66, 33, and 0% (yellow) for a TCR at a given location.
The data are clustered such that those TCRs predominantly found in one location are
shown together.

Figure 3.1 Foxp3+ Treg TCRs from the colon are unequally distributed.
sple
enco
lon
MLN CLN
Foxp3+
sple
enco
lon
MLN
CLN
CD44hi
sple
enco
lon
MLN
CLN
CD44lo
90-1
00%
60-7
0%
0-10
%30
-40%
-110-

-111-
Figure 3.2 Statistical analysis of similarity between populations from different
anatomical locations. The Morisita-Horn similarity index is shown for the comparison
between the colon and the mesenteric LNs (MLN), spleen (SPL) and cervical LNs (CLN)
in the first set of each panel, then between the spleen and the MLN and CLN, then
between the MLN and CLN. Values are for the comparison between datasets combined
from all three experiments.

Figure 3.2 Statistical analysis of similarity between populations fromdifferent anatomical locations
COLON
MLN
CLN
SPL
Vs. SPL
CLN
MLN
MLN
CLN
Foxp3+ CD44lo CD44hi
COLON
MLN
CLN
SPL
SPL
CLN
MLN
MLN
CLN
COLONM
LN
CLN
SPL
SPL
CLN
MLN
MLN
CLN
1.0
0.8
0.6
0.4
0.2
0
Mor
isita
-Hor
n S
imila
rity
Inde
x
-112-

Colon mouse 1 mouse 2 mouse 3 mouse 4 mouse 5 TotalFoxp3+ 200 175 224 214 138 951CD44lo 209 189 201 190 176 965CD44hi 179 187 174 242 194 976Total 588 551 599 646 508 2892
Table 3.2 TCR sequencing of colon T cell from individual animals
Number of sequences obtained from each population of colon/cecumlamina propria T cells from each of 5 individual mice.
-113-

-114-
Figure 3.3 Comparison of the colonic TCR repertoires of five individual mice. (A)
The mean (±SEM) of the Morisita-Horn similarity indices of each pairwise comparison
between the TCR repertoires of the Foxp3+ (green), naïve CD44lo (blue), or memory
CD44hi (gold) populations of five individual mice (Table 3.2). (B) Comparisons between
the TCR repertoires of the Foxp3+, CD44hi, and CD44lo population within each of the five
individual mice. The mean (±SEM) of the Morisita-Horn indices of these comparisons is
shown.

Figure 3.3 Comparison of the colonic TCR repertoiresof five individual mice.
Comparisons of populations fromdifferent individual mice.
Comparisons of different phenotypesfound within the same mouse.
A
B
-115-

-116-
rare or transient, or a potentially pathogenic bacterium that was eliminated by the
immune response. In contrast, it appears that the Treg population recognizes fairly
conserved antigens; either true self antigens which are unique to the colon, and/or broadly
represented bacterial antigens that are either conserved between multiple bacterial species
or derive from very abundant and widespread species.
In agreement with our previous study [150], there was very little overlap in the
TCR repertoires of the Foxp3+ Treg, CD44lo naïve, and CD44hi memory T cell
populations. We had hypothesized there may be an increased similarity between the
CD44hi memory and Treg populations if indeed a sizeable number of colonic Treg arise
via peripheral conversion, as this might occur alongside effector cell development to the
same antigens. To the contrary there was almost no shared TCRs between these two
subsets, with an average M-H value well below 0.1 (Fig 3.3 B), further supporting a
model where T cell differentiation occurs in response to different stimuli in these two
populations. In addition, there was no significant similarity between the Treg and naïve T
cells in the colon (Fig 3.3 B).
Some common colonic Treg TCRs recognize bacterial antigens
In an attempt to determine if we could identify the antigens being recognized by
colonic Treg TCRs we selected several prominent TCRs that were found at relatively
high frequency within multiple mice and/or experiments, and were not found within the
CD44lo or CD44hi datasets. This criteria ensures that we are only considering the most
conserved Treg TCRs, which we believe should encompass a representative sampling of

-117-
typical Treg TCR specificities. These TCRs, and their prevalence in each dataset, are
listed in Table 3.3.
We transduced a T cell hybridoma line expressing an NFAT-driven GFP reporter
(as a way to assess TCR engagement) and the TCli TCRβ chain with these TCRα chains
to create reporter hybridomas with the specificities of the most common colonic Treg.
These were sorted by flow cytometry to obtain a population with consistent TCR
expression and minimal background GFP expression. These hybridomas were then
cultured with a variety of antigens and Flt3L-induced splenic DC, and assayed for NFAT-
GFP expression by flow cytometry as indication of antigen recognition by the TCR.
We sought to test these hybridomas for reactivity against common commensal
bacteria. In order to obtain as wide a variety as possible of the species typically found in
the colon of these mice we harvested the colon and cecum contents from wild-type
littermates of the TCliβ transgenic TCRα heterozygous mice being used for TCR
sequencing. The commensal microbiota can vary widely between animals according to
their genetics and housing conditions . Therefore, we believe the use of these littermate
mice is the best approach to obtain bacterial isolates that will be relevant to the particular
Treg population we have been studying.
Aerobes and anaerobes were isolated from the colon contents by growth on
various nutrient agars in various conditions (see Materials and methods). Individual
colonies appearing to be different species by colony morphology were subcloned and
either grown in liquid media culture, or, for species that wouldn’t grow to sufficient
density in liquid medium, replated again at higher density and the resulting colonies
scraped from the plate. These bacteria were heat-killed and then frozen for later use. In

NA
ME
CD
R3 A
A S
EQ
.m
s 1
ms 2
ms 3
ms 4
ms5
Expt 1
Expt 2
Expt 3
Expt 1
Expt 2
Expt 3
Expt 1
Expt 2
Expt 3
Expt 1
Expt 2
CT
1A
AS
WA
SG
YN
KLT
39.0
24.0
7.6
2.3
33.3
12.8
8.7
4.8
1.6
0.3
0.5
0.4
0.4
CT
2A
AS
AIW
NT
GY
QN
FY
5.0
25.1
11.2
4.2
1.4
6.2
2.2
1.0
0.8
0.4
CT
7A
AS
AT
GD
NR
IF0.5
2.8
3.6
11.2
1.7
4.3
0.3
0.3
G57
AA
SE
LY
QG
GR
ALI
4.7
2.9
4.7
0.3
1.0
1.8
4.4
1.5
1.1
CT
4A
AS
EY
SA
LG
RLH
1.0
0.9
2.9
0.4
CT
6A
AS
GY
SA
LG
RLH
0.5
1.6
0.5
0.3
CT
8A
AS
LT
GG
YK
VV
5.5
3.1
5.6
1.2
7.7
CT
9A
AS
AD
NR
AG
NK
LT
16.0
18.2
CT
11
AA
SA
PW
NS
NN
RLT
1.5
5.6
1.9
CT
12
AA
SA
VW
AN
TG
KLT
1.8
1.4
3.1
0.5
0.2
0.3
CT
10
AA
QR
RG
NY
KY
V2.5
4.0
CT
13
AA
SR
ER
YA
NK
MI
2.3
1.9
CE
RV
LN
Fo
xp
3+ p
op
ula
tio
nC
OL
ON
ME
S L
NS
PL
EE
N
The
freq
uenc
y (in
%) w
ith w
hich
sele
cted
col
on T
reg
TCR
s are
foun
d in
indi
vidu
al m
ice
(ms 1
-5) a
nd p
oole
d m
ice
expe
rimen
t (Ex
pt 1
-3) d
atas
ets.
Tab
le 3
.3 T
CR
s sel
ecte
d to
scre
en fo
r ba
cter
ial r
eact
ivity
-118-

-119-
total, 77 isolates were obtained for screening; as the media and growth conditions used
were fairly non-specific it is likely that several of these preps may consist of the same
bacteria grown in more than one condition. Each of these isolates was given a name
related to the type of agar on which it was grown and a randomly assigned number, and
pools of 2 to 3 isolates each were created to facilitate screening. In addition, the colon
and cecum contents were prepared from another TCliβ TCRα+/– littermate control mouse,
as well as a C57BL/6 germ-free mouse (see Materials and methods). These likely will
contain bacteria that were not culturable with our current techniques, but that may still be
recognized by our TCRs.
T cell hybridomas expressing colonic Treg TCRs were cultured with Flt3L-
elicited splenic DC and pools of bacterial preps or autoclaved colonic/cecal content preps
(ACP). Flow cytometry to detect NFAT-GFP showed that several of the TCRs appear to
recognize antigens present in the ACP from the TCliβ littermate mouse (Fig 3.4 and 3.5),
but did not show reactivity to the C57BL/6 germ-free ACP. In addition, three TCRs
showed reactivity to one or more of the pools of bacterial preps (Fig 3.5). Upon screening
the individual components of these pools, it was found that each of these TCRs reacted
specifically to one or more individual bacterial isolates present in the pools (Fig 3.6 and
Table 3.4) This reactivity was dependent upon the presence of the DCs in the culture and
was abrogated by the addition of a blocking antibody to MHC class II (Fig 3.7).
Therefore, 7 of the 12 prevalent colonic Treg TCRs tested showed some reactivity to
bacterial-derived antigens.
The identity of several isolates from the pools to which a hybridoma was reactive
was determined by 16S rRNA sequencing of the isolates, and the results are shown in

-120-
Figure 3.4 Examples of screening results of CT7- and G57-expressing hybridoma
cells. Shown are representative plots demonstrating the flow cytometry assessment of
hybridoma reactivity by the percentage of Vb6+Va2+ cells that express the NFAT-GFP
reporter following culture with APC + the indicated antigen or no antigen control (far
right) used to assess background fluorescence. ACP, autoclaved cecum/colon prep.
αMHC cII, blocking antibody to MHC class II was added.

0102
103
104
105
Va2
0
102
103
104
105
TCRbeta
93.6
0102
103
104
105
Va2
0
102
103
104
105
NFAT-GFP
2.9
0102
103
104
105
Va20.21
0102
103
104
105
Va20.097
0102
103
104
105
Va2
0
102
103
104
105
TCRbeta
96.3
0102
103
104
105
Va2
0
102
103
104
105
NFAT-GFP
4
0102
103
104
105
Va20.077
0102
103
104
105
Va20.13
CT7
TCR
G57
TCR
Figu
re 3
.4 E
xam
ples
of s
cree
ning
resu
lts u
sing
CT7
- and
G57
- exp
ress
ing
hybr
idom
as
Gat
ed o
n liv
e ce
lls a
nd C
D4
ANB
10AN
B 12
No
antig
en
ACP
ACP
+ α
MH
C c
IIN
o an
tigen
-121-

-122-
Figure 3.5 Screening of hybridomas expressing prevalent colon TCRs against a
panel of bacterial antigen pools and cecal/colonic content preparations. Hybridomas
expressing the TCRs indicated and an NFAT-driven GFP reporter were screened by
culture with Flt3L-elicited DC and the indicated antigen. After 40-44 hours hybridoma
cells were stained for TCR expression and the percentage of cells that expressed GFP was
measured by flow cytometery, as shown in Fig 3.4. The fold-increase over the percentage
of cells expressing GFP in the no antigen added control culture was calculated for each
sample and is shown on the bar graph. Screens of those hybridomas listed in Table 3.3
that did not show any reactivity are not depicted. ACP, autoclaved cecum/colon prep. G-
F ACP, ACP from a germ-free mouse.

Figure 3.5 Screening of hybridomas expressing prevalent colon TCRs against apanel of bacterial antigen pools and cecal/colonic content preparations.
NFA
T-G
FP+
activ
atio
n: fo
ld o
ver b
ackg
roun
d
-123-

-124-
Figure 3.6 Reactivity to individual bacterial isolates by hybridomas expressing the
CT2, CT6 or CT7 T cell receptors. The three hybridomas that showed reactivity to a
pool of bacterial isolates in the assays depicted in Fig 3.5 were then screened against the
individual components of that pool to determine which isolates they respond to. The fold-
increase over the percentage of cells expressing GFP in the no antigen added control
(shown on the right) is shown on the bar graph. Green bars show the reactivity to the
pools (or no antigen control) and orange bars show the reactivity to the individual isolates
which make up the pool shown on their left.

NFA
T-G
FP A
ctiv
atio
n, F
old
Ove
r Bac
kgro
und
Figure 3.6 Reactivity to individual bacterial isolates byhybridomas expressing the CT2, CT6 or CT7 T cellreceptors
NFA
T-G
FP A
ctiv
atio
n, F
old
Ove
r Bac
kgro
und
NFA
T-G
FP A
ctiv
atio
n, F
old
Ove
r Bac
kgro
und
-125-

-126-
Figure 3.7 Hybridoma reactivity to bacterial antigens is dependent upon
presentation of antigen on MHC class II by APC. Shown are screens of the
hybridomas indicated against the specific bacterial isolates with (green) or without
(orange) addition of blocking antibody to MHC class II. Shown in blue are cultures in
which no APC were added (No APC). acII, blocking antibody to MHC class II.

Figure 3.7 Hybridoma reactivity to bacterial antigens isdependent upon presentation of antigen on MHC class IIby APC
NFA
T-G
FP A
ctiv
atio
n, F
old
Ove
r Bac
kgro
und
NFA
T-G
FP A
ctiv
atio
n, F
old
Ove
r Bac
kgro
und
NFA
T-G
FP A
ctiv
atio
n, F
old
Ove
r Bac
kgro
und
-127-

Table 3.4 Summary of reactivity observed for eachcolon Treg TCR hybridoma tested.
Reactivity
CT1 AASWASGYNKLT ACP
CT2 AASAIWNTGYQNFY ANB 8.1 & 8.2, ACP
CT7 AASATGDNRIF ANB 10, LKV 7, LKV 8
G57 AASELYQGGRALI ACP
CT4 AASEYSALGRLH none
CT6 AASGYSALGRLH ACNA 18.1 & 23, ACP
CT8 AASLTGGYKVV none
CT9 AASADNRAGNKLT ACP
CT11 AASAPWNSNNRLT ACP
CT12 AASAVWANTGKLT none
CT10 AAQRRGNYKYV none
CT13 AASRERYANKMI none
Colon Treg TCR
ACP = Autoclaved colonic/cecal content prepResults of screening hybridoma expressing the indicated TCRagainst bacterial preps and ACP. Green=reactive to a specificbacterial prep. Gold=reactive to ACP but no specific bacteriaidentified. ACP=Autoclaved colonic/cecal content prep
-128-

-129-
Table 3.5. In each instance in which a hybridoma was reactive to more than one isolate,
sequencing revealed that these isolates appeared to be identical, and the bacteria had
likely been isolated more than once. Those isolates in the pools which did not cause
hybridoma reactivity were found to be completely unrelated to the isolates that did,
further confirming that each of these TCRs recognizes an antigen found only a specific
species or in closely related species. In addition, the three bacteria that caused reactivity
are from different phyla or orders, and are therefore not at all closely related to each
other. Therefore, it seems that a diverse selection of bacteria may be recognized by
colonic Treg.
T cells expressing colonic Treg TCRs do not become Foxp3+ in the thymus.
Most Treg are selected to become Foxp3+ regulatory cells during thymic
development, presumably due to recognition of a thymically-presented self antigen.
Therefore, the realization that many colonic Treg TCR recognize bacterial antigens,
which presumably would not be available in the thymus, led us to wonder whether these
Treg arose via peripheral conversion from mature non-regulatory cells, or if they are
thymically-selected Treg which happen to cross-react with bacterial antigens. We chose
several of the top colon Treg TCR to test, as well as a three Treg TCR normally found in
other sites in the body, two of which we have previously shown undergo thymic Treg
development (G25 and R19) [189], and as a negative control, a TCR only found on naïve
T cells (B8) (Table 3.6). To test the induction of Foxp3 expression in the thymus by cells
expressing these colonic Treg TCR we retrovirally introduced the TCli TCRβ chain and
TCRα chain in question into thymocytes from Foxp3gfp Rag1–/– mice. As these mice

Tab
le 3
.5 Id
entif
icat
ion
of se
lect
ed b
acte
rial i
sola
tes b
y 16
S rR
NA
seq
uenc
ing
Isol
ates
from
poo
ls w
hich
cau
sed
activ
atio
n of
a h
ybrid
oma
wer
e se
quen
ced
to d
eter
min
e th
eir i
dent
ity.
* =
isol
ate
caus
ed a
ctiv
atio
n of
a h
ybrid
oma.
Isol
ates
with
mat
chin
g le
tter d
esig
natio
ns w
ere
iden
tifie
dto
be
iden
tical
by
sequ
enci
ng. S
imila
rity
indi
cate
s sim
ilarit
y to
the
type
stra
in in
dica
td. T
op, i
sola
tes
from
poo
ls si
mul
ator
y fo
r CT2
; Mid
dle,
stim
ulat
ory
for C
T6; a
nd b
otto
m, s
timul
ator
y fo
r CT7
.
Clo
se
st
Ba
cte
ria
l T
yp
e S
tra
in
RD
P A
ss
ign
me
nt
De
tail
(fo
r C
on
fid
en
ce
th
res
ho
ld:
80
%)
*AN
B 8
.1a
Allo
ba
cu
lum
ste
rco
rica
nis
85%
Ph
ylu
m:
"Firm
icu
tes";
Cla
ss:
"Ery
sip
elo
tric
hi"
; O
rde
r: "
Ery
sip
elo
tric
ha
les";
Fa
mily
:
Ery
sip
elo
tric
ha
ce
ae
; G
en
us:
Allo
ba
cu
lum
*AN
B 8
.2a
Allo
ba
cu
lum
ste
rco
rica
nis
85%
Ph
ylu
m:
"Firm
icu
tes";
Cla
ss:
"Ery
sip
elo
tric
hi"
; O
rde
r: "
Ery
sip
elo
tric
ha
les";
Fa
mily
:
Ery
sip
elo
tric
ha
ce
ae
; G
en
us:
Allo
ba
cu
lum
AN
B 1
9b
Pro
pio
nib
acte
riu
m a
cn
es
10
0%
Ph
ylu
m:
"Actin
ob
acte
ria
"; C
lass:
Actin
ob
acte
ria
; S
ub
cla
ss:
Actin
ob
acte
rid
ae
; O
rde
r:
Actin
om
yce
tale
s;
Su
bo
rde
r: P
rop
ion
iba
cte
rin
ea
e;
Fa
mily
: P
rop
ion
iba
cte
ria
ce
ae
;
Ge
nu
s:
Pro
pio
nib
acte
riu
m
*AC
NA
23
Clo
str
idiu
m c
lostr
idio
form
e92%
Ph
ylu
m:
"Firm
icu
tes";
Cla
ss:
"Clo
str
idia
"; O
rde
r: C
lostr
idia
les
AC
NA
1b
Pro
pio
nib
acte
riu
m a
cn
es
10
0%
Ph
ylu
m:
"Actin
ob
acte
ria
"; C
lass:
Actin
ob
acte
ria
; S
ub
cla
ss:
Actin
ob
acte
rid
ae
; O
rde
r:
Actin
om
yce
tale
s;
Su
bo
rde
r: P
rop
ion
iba
cte
rin
ea
e;
Fa
mily
: P
rop
ion
iba
cte
ria
ce
ae
;
Ge
nu
s:
Pro
pio
nib
acte
riu
m
AC
NA
7c
La
cto
ba
cill
us m
urin
us
99
%
Ph
ylu
m:
"Firm
icu
tes";
Cla
ss:
"Ba
cill
i";
Ord
er:
"L
acto
ba
cill
ale
s";
Fa
mily
:
La
cto
ba
cill
ace
ae
; G
en
us:
La
cto
ba
cill
us
AC
NA
9c
La
cto
ba
cill
us m
urin
us
99
%
Ph
ylu
m:
"Firm
icu
tes";
Cla
ss:
"Ba
cill
i";
Ord
er:
"L
acto
ba
cill
ale
s";
Fa
mily
:
La
cto
ba
cill
ace
ae
; G
en
us:
La
cto
ba
cill
us
*AN
B 1
0c
Pa
rab
acte
roid
es d
ista
so
nis
97%
Ph
ylu
m:
"Ba
cte
roid
ete
s";
Cla
ss:
"Ba
cte
roid
ia";
Ord
er:
"B
acte
roid
ale
s";
Fa
mily
:
"Po
rph
yro
mo
na
da
ce
ae
"; G
en
us:
Pa
rab
acte
roid
es
AN
B 1
2B
acill
us c
ircu
lan
s1
00
%
Ph
ylu
m:
"Firm
icu
tes";
Cla
ss:
"Ba
cill
i";
Ord
er:
Ba
cill
ale
s;
Fa
mily
: B
acill
ace
ae
;
Ge
nu
s:
Ba
cill
us
LK
V 3
dB
acte
roid
es a
cid
ifa
cie
ns
99
%
Ph
ylu
m:
"Ba
cte
roid
ete
s";
Cla
ss:
"Ba
cte
roid
ia";
Ord
er:
"B
acte
roid
ale
s";
Fa
mily
:
Ba
cte
roid
ace
ae
; G
en
us:
Ba
cte
roid
es
*LK
V 7
cP
ara
ba
cte
roid
es d
ista
so
nis
97%
Ph
ylu
m:
"Ba
cte
roid
ete
s";
Cla
ss:
"Ba
cte
roid
ia";
Ord
er:
"B
acte
roid
ale
s";
Fa
mily
:
"Po
rph
yro
mo
na
da
ce
ae
"; G
en
us:
Pa
rab
acte
roid
es
*LK
V 8
cP
ara
ba
cte
roid
es d
ista
so
nis
97%
Ph
ylu
m:
"Ba
cte
roid
ete
s";
Cla
ss:
"Ba
cte
roid
ia";
Ord
er:
"B
acte
roid
ale
s";
Fa
mily
:
"Po
rph
yro
mo
na
da
ce
ae
"; G
en
us:
Pa
rab
acte
roid
es
LK
V 9
dB
acte
roid
es a
cid
ifa
cie
ns
99
%
Ph
ylu
m:
"Ba
cte
roid
ete
s";
Cla
ss:
"Ba
cte
roid
ia";
Ord
er:
"B
acte
roid
ale
s";
Fa
mily
:
Ba
cte
roid
ace
ae
; G
en
us:
Ba
cte
roid
es
%
Sim
ila
rity
by
BL
AS
T2
Iso
late
na
me
-130-

Nam
eC
DR
3 A
.A. S
equence
CO
LO
NM
LN
SP
LC
LN
CO
LO
NM
LN
SP
LC
LN
G2
5A
AS
AD
YS
NN
RL
T0
.56
0.3
80
.51
1.9
6N
A
R1
9A
AS
SG
TY
QR
0.3
60
.20
1.4
2N
A
R1
11
AA
RP
SG
SF
NK
LT
0.3
92
.00
0.3
93
.03
NA
CT
1A
AS
WA
SG
YN
KL
T1
6.0
41
.44
0.4
70
.20
AC
P
CT
2A
AS
AIW
NT
GY
QN
FY
7.5
20
.50
0.1
80
.11
ge
nu
s A
llo
ba
cu
lum
, A
CP
CT
4A
AS
EY
SA
LG
RL
H0
.66
0.2
3n
on
e
CT
6A
AS
GY
SA
LG
RL
H0
.28
0.1
2g
en
us C
lostr
idiu
m,
AC
P
CT
7A
AS
AT
GD
NR
IF2
.96
0.2
10
.04
Pa
rab
acte
roid
es d
ista
sto
nis
G5
7A
AS
EL
YQ
GG
RA
LI
2.3
0A
CP
CT
9A
AS
AD
NR
AG
NK
LT
3.8
0A
CP
CT
11
AA
SA
PW
NS
NN
RL
T1
.00
AC
P
B8
AA
SE
DN
NN
AP
R5
.74
4.4
76
.84
3.1
8N
A
Fo
xp
3+
CD
44
loT
Ce
ll R
ec
ep
tor
Re
activity
Tab
le 3
.6 T
CR
s use
d in
thym
ic d
evel
opm
ent s
tudi
es
Ave
rage
freq
uenc
y of
TC
R (i
n %
) in
the
data
set i
ndic
ated
. Fre
quen
cies
< 0
.01%
wer
e ex
clud
ed fr
om th
eta
ble.
AC
P =
auto
clav
ed c
ecum
/col
on p
rep.
NA
= n
ot a
pplic
able
, as T
CR
was
not
scre
ened
. Pin
k =
Treg
TCR
s fro
m n
on-c
olon
site
s, G
reen
= c
olon
Tre
g TC
Rs,
Blu
e =
naïv
e TC
R
-131-

-132-
cannot rearrange their endogenous TCRβ chain there is an accumulation of cells in the
CD4–CD8– (DN) stage; only those cells which are successfully transduced will be able to
progress through positive and negative selection. The thymocytes were then injected into
the thymus of a CD45.1 congenic host in order to allow development to take place, and
after 14-16 days the thymocytes from these host animals were analyzed by flow
cytometry. The donor thymocytes expressing the TCR of interest were identified by
CD45.2 expression, as well as Vβ6 and Vα2, and analyzed for the expression of Foxp3gfp
(Fig 3.8 A).
We found, as expected, that the three Treg TCR normally found in non-colonic
sites in the mice, R19, R111 and G25, showed induction of Foxp3gfp in this assay (Fig 3.8
B, red dots). In agreement with previous results, we saw that a higher percentage of G25-
expressing CD4 SP thymocytes expressed Foxp3 compared to R19-expressing cells
[189]. The R111 TCR showed a similar efficiency of Foxp3 induction as R19. The naïve
TCR, B8, did not show any Foxp3 expression, as would be expected. These results verify
this assay as capable of identifying TCRs that are normally mediate selection into the
Foxp3+ regulatory cell lineage within the thymus.
In stark contrast, all 8 colonic Treg TCRs tested in this assay showed no Foxp3
expression in the thymus (Fig 3.8 B, green dots). This included a TCR that did not show
any detectable bacterial reactivity with the hybridoma screening, CT4. These results
suggest that these colon Treg TCR do not encounter antigen in the thymus, but leave the
thymus as naïve T cells which upregulate Foxp3 upon antigen recognition in the colon.
This may be a result of interaction with a CD103+ DC presenting antigens derived from
commensal bacteria, as this subset of gut DC has been shown to efficiently mediate

-133-
Figure 3.8 Foxp3 expression by thymocytes expressing selected Treg TCRs or a
naïve control TCR. Thymocytes from Foxp3gfpRag1–/– CD45.2+ donor mice were
transduced with the indicated TCR and injected into the thymus of a sublethally
irradiated CD45.1 recipient mouse. (A) (top) Gating strategy used to identify donor CD4
SP thymocytes expressing the transduced TCR 14-16 days after transfer. (bottom)
Representative plots showing the level of Foxp3gfp expression by recovered thymocytes
expressing the R19, CT7, or B8 TCRs, as indicated. (B) Graph plotting the percentage of
recovered donor CD4 SP thymocytes expressing Foxp3gfp for each tested TCR. Each dot
represents one animal; data from each TCR is from at least two individual experiments.
Red TCRs are those normally found in non-colon Treg populations (shown in pink in
Table 3.6), while those in green are colon Treg TCRs (green in Table 3.6). In blue is the
control naïve T cell TCR, B8.

0 102
103
104
105
CD24 (HSA)
0
102
103
104
105
Fo
xp
3g
fp
0
Perc
ent o
f TC
R+
CD
4 SP
Cel
ls E
xpre
ssin
g Fo
xp3
CT1 CT2 CT4 CT6 CT7 CT9 CT11 G57R19 R111G25 B8
0 102
103
104
105
CD45.2
0
102
103
104
105
CD45.1
99
0.12
0 102
103
104
105
CD4
0
102
103
104
105
CD8
38.1
0 102
103
104
105
TCR Va2
0
102
103
104
105
TC
R V
b6
85.8
Vα2+Vβ6+
CD4 SPCD45.2+Live lymphocyte gate
CT7
0 102
103
104
105
CD24 (HSA)
0
102
103
104
105
Fo
xp
3g
fp
9.15R19
0 102
103
104
105
CD24 (HSA)
0
102
103
104
105
Fo
xp
3g
fp
0B8Vα2+Vβ6+ Vα2+Vβ6+
A
B
Figure 3.8 Foxp3 expression by thymocytes expressing selected Treg TCRs or naïvecontrol TCR.
-134-

-135-
peripheral conversion, as well as upregulate gut-homing receptors on T cells [44, 124,
129]. As these TCR were all found to be quite abundant in the colon Treg TCR
repertoire, it is likely that peripheral conversion plays a larger role in the generation of
this population than previously suspected.
T cells expressing colonic Treg TCRs in vivo do not express Foxp3 in the thymus, but
upregulate Foxp3 upon encountering bacterial antigen in the periphery.
To further investigate the possibility that these colon Treg are a product of
peripheral conversion rather than thymic Treg selection we chose to create retroviral
mixed bone marrow chimeras expressing the CT2 and CT6 TCRs. These TCRs were
shown to recognize specific bacterial antigens (Fig 3.5 and Table 3.4), and did not appear
to undergo thymic selection into the Treg pool (Fig 3.8 B). Retroviral bone marrow
chimeras were created by mixing Foxp3gfpCD45.1+ congenic bone marrow with (CD45.2)
Foxp3gfpRag1–/– bone marrow transduced with a retrovirus encoding the TCli TCRβ
chain and either the CT2 or CT6 TCRα chain (see Materials and methods). These mice
were allowed to reconstitute their T cell populations for 8 – 9 weeks, and then cells from
the thymus, spleen, MLN, pooled axillary, inguinal and cervical LN (referred to as
“peripheral”LN or PLN) and the colon/cecum LP were isolated and analyzed by flow
cytometery.
Initial experiments confirmed that there was no detectable expression of Foxp3 in
the CT2- or CT6–expressing thymocytes (orange symbols, Fig 3.9 A and 3.10). However,
these initial experiments also did not show any Foxp3 expression by the CT2- or CT6-
expressing cells recovered from the periphery, including the colon LP. We suspected that

-136-
Figure 3.9 Foxp3 expression by T cells expressing the CT2 TCR in mixed retroviral
bone marrow chimeras. Bone marrow chimeras were made with a mixture of wild-type
CD45.1+ bone marrow and CT2-transduced CD45.2+ bone marrow from Foxp3gfpRag1–/–
donors, and injected into CD45.1+ lethally irradiated recipients. At 8-9 weeks of post-
injection the CD45.2+ T cells were recovered from the thymus, spleen, mesenteric LN,
the axillary, inguinal and cervical LNs (pooled) and the colon lamina propria. The
percentage of CT2-expressing CD4 SP (thymocytes) or CD4+ T cells expressing Foxp3gfp
was assessed. (A) Results of experiments in which the chimeras were allowed to develop
undisturbed (orange) or cohoused approximately two weeks after injection with a
littermate mouse of the TCli TCRβ transgenic mice used for sequencing studies (Fig 3.1-
3.3, Tables 3.1 and 3.2) (green). Each symbol is represents an individual animal, and data
is from 3 individual experiments. (B) Additional experiment as described in A, in which
the chimeras were cohoused as described. The data from this experiment is shown on a
separate graph for clarity due to the development of a higher percentage of Foxp3+ cells.

Figure 3.9 Foxp3 expression by T cells expressing the CT2 TCR in mixed retroviralbone marrow chimeras.
A
B
-137-

-138-
Figure 3.10 Foxp3 expression by T cells expressing the CT6 TCR in mixed retroviral
bone marrow chimeras. Bone marrow chimeras were created with CT2-transduced
CD45.2+ bone marrow from Foxp3gfpRag1–/– donors as described in Fig. 3.9. As before,
the percentage of recovered CT2-expressing cells that are Foxp3+ is shown, and orange
symbols represent mice that were not cohoused, while green symbols represent those that
were. Data is from four individual experiments.

Figure 3.10 Foxp3 expression by T cells expressing the CT6 TCR in mixedretroviral bone marrow chimeras.
-139-

-140-
this might be due to a lack of the appropriate bacteria in the gut. The recipient mice in
these experiments were obtained from the National Cancer Institute (NCI), and since they
were not bred in our colony their colonic microbiota might have a different composition,
and therefore be missing the bacteria recognized by CT2 and CT6.
Therefore, in repeat experiments we cohoused the chimeras for 7-10 days with a
female TCli TCRβ chain littermate mouse, starting at approximately two weeks after
bone marrow injection, to see if the bacteria could be transferred between the animals.
Indeed, in the mice which had been cohoused, analysis of the peripheral T cells,
particularly the colon LP T cells, showed Foxp3gfp expression in the CT2- or CT6-
expressing cells (Fig 3.9 A and B, 3.10, green symbols). Non-cohoused animals
continued to show no sign of Foxp3 expression (orange symbols). Therefore, it seems
that colon Treg expressing the CT2 or CT6 TCR are a product of peripheral conversion,
which occurs as a result of bacterial-derived antigen recognition in the colon.

-141-
Chapter Three: Discussion
With these experiments we have demonstrated that the colon Treg population
expresses a unique repertoire of TCRs, which does not overlap with those used by Treg in
the other locations in the body that we have sequenced, nor with the CD44hi memory T
cell population. The very distinct set of antigens recognized by these T cells may in large
part be derived from the abundant commensal microbiota, as we have gone on to show
that the most prominent colon Treg TCR recognize bacterial antigens. Furthermore, T
cells expressing these TCRs do not show signs of expressing Foxp3 during selection in
the thymus, suggesting that Foxp3 expression is a result of peripheral conversion. Indeed,
for T cells expressing two of these bacterial reactive TCRs, CT2 and CT6, we have
confirmed that no Foxp3 expression is seen during thymic development in a retroviral
bone marrow chimera. In these mice, Foxp3 expression occurs only in the periphery, and
is dependent upon commensal bacteria found in the TCli TCRβ transgenic mice used in
our TCR sequencing studies. In summary, we have directly shown for the first time that
some colonic Treg cells develop in response to peripheral conversion due to recognition
of antigens derived from the commensal microbiota.
That peripheral conversion would be a source of colonic Treg is not particularly
surprising in light of data showing abundant conversion in the small intestine and MLN
in models of oral tolerance [44, 124]. Conversion in the small intestine is mediated by
lamina propria CD103+ DC which can transport antigen to the MLN to present antigen to
naïve T cells . Here we show evidence that peripheral conversion also plays a role in the
shaping of the Treg repertoire in the colon, as well, presumably through the same
mechanism.

-142-
The lack of similarity between the colonic and MLN Treg repertoires is somewhat
surprising, particularly in light of these results. One study has shown that for peripheral
conversion to occur in a model of alloantigen tolerance the T cells must be able to occupy
the lymph nodes; T cells from mice that did not express CD62L were not converted,
presumably due to an inability to access the LN and interact with the APC mediating
conversion [190]. It has also been shown that antigen presentatio in the MLN is required
for oral tolerance induction [191]. It is unknown if this also holds true for T cells in the
colon, as the lymphoid architecture in this region is unique. The majority of the MLN
drain the small intestine rather than the colon, so while this may be a site of peripheral
conversion against small intestine antigens, it may not hold true for colonic antigens. The
colon lamina propria contains isolated lymphoid follicles (ILF) that might act as an
additional site of conversion. Studies of germ-free mice have shown that the development
of the ILFs is dependent upon the presence of the commensal microbiota, and that the
bacterial load and composition affect the size and number of ILFs [192]. It is possible
that the ILFs, with their proximity and responsiveness to the commensal microbiota, are
actually the major site of T cell/DC interaction in the colon.
We were surprised at the number of prominent colon TCRs which showed
bacterial reactivity. It would be expected that many bacterial-responsive TCRs did not
show reactivity in our screen because they recognize a bacterium which was not present
at a sufficient concentration in the ACP, and therefore the number of TCRs which were
positive in our assay probably underestimates the true number. While several of the
TCRs recognized ACP, we were able to pinpoint the reactivity to specific bacteria
cultured out of mice in our colony for only three TCRs (one of which, CT7, did not show

-143-
reactivity to ACP). It is estimated that less than half of the bacterial species in the
microbiota are uncultureable by currently developed methods . Therefore, the four ACP-
reactive TCRs which did not react to any of our bacterial isolates likely recognize
antigens from organisms we were unable to culture.
The high number of TCRs reactive to ACP (6 of the 12 tested) may reflect the
ability of more abundant commensal organisms to induce Treg directed against them.
This may be a bacterial-driven process, such as the production of a molecule that assists
in tolerance induction, or properties that maintain a tolerogenic state in APCs upon their
phagocytosis. Tolerance may also just be a passive result of the lifestyle of these bacteria.
For instance, they may favor a location which facilitates their uptake in a way that
promotes tolerance. In effect, the ability to induce Treg tolerance may be a hallmark of a
successful commensal organism, and may help explain the fairly conserved colon Treg
TCR repertoire across multiple mice and experiments.
Our selection criteria of choosing colon Treg TCRs which are found almost
exclusively in the colon, and were detected in multiple experiments (see Table 3.3), may
have selected for bacterial-reactive TCRs. While it would be expected that some colon
Treg recognize conserved self antigens, these TCRs may be found in other locations as
well, and therefore not chosen by us for further study. However, the low similarity
between colon and other organs studied suggest that these Treg are in the minority (Fig.
3.2) It may be that these Treg are outcompeted by the bacterial-reactive Treg in the colon,
which probably receive frequent restimulation by APCs that continue to encounter these
abundant bacterial antigens. DC are not the only cell type in the intestine which can
present bacterial antigens, and therefore the Treg may also encounter their cognate

-144-
antigens on macrophages and on the intestinal epithelial cells (IEC), which also express
MHC class II. It is possible that in the absence of bacterial-reactive Treg, more Treg
recognizing conserved self antigens would inhabit the intestines and be capable of
maintaining homeostasis to some degree. For example, in mice lacking a conserved
noncoding sequence in the Foxp3 gene required for peripheral conversion, there is a
reduction in the size of the Treg population of the GALT, but these mice do not
spontaneously develop inflammation [149]. It would be interesting to see whether these
mice are at increased risk for IBD development if crossed to models of spontaneous
colitis development, or if the existing colon Treg repertoire that develops in these mice
would be as efficient as wild type Treg in preventing disease in the classic model of
transfer colitis.

-145-
Chapter Four: Discussion
Is antigen specificity necessary for regulatory T cell suppression?
The research detailed in this thesis centers around the part that antigen specificity
plays in Treg function. It can be inferred from our results that, in vivo, Treg often do have
antigen specificity. This is the simplest explanation for the segregation of TCR usage
seen in the Treg populations of the spleen, lymph nodes, and even the colon. However,
that does not mean that Treg must have this antigen specificity to perform their function,
although most people agree that Treg need to receive TCR stimulation to mediate their
suppressive functions [51, 76].
There are studies suggesting that Treg can act to suppress T cell effector function
against antigens which they do not themselves recognize. For example, in a model of
autoimmune gastritis, in which polyclonal T cells were able to prevent disease through
“bystander suppression” [72, 73]. A follow-up paper by this group, however, reported
that antigen-specific Treg were better suppressors in this system. In a model of Friend
virus infection of the hematopoietic system in which a lack of regulatory activity will
result in anemia, it was found that the Treg capable of preventing the anemia were not
specific for Friend virus [193]. Additionally, a common model of colitis relies on the
transfer of non-regulatory T cells into a lymphopenic host, and disease is prevented by
the co-transfer of a population of Treg. However, it seems unlikely in this system that
most of the Treg transferred are specific for gut antigens, as they generally not isolated
from the GALT. Treg isolated from germ–free mice were reported to be fully capable of
preventing disease in this same transfer model, although they were not as efficient as

-146-
those from conventional mice [148]. However, there is also a report that Treg from germ-
free mice are unable to prevent disease in this model [147].
These studies appear to conflict with others that demonstrate antigen specificity of
Treg. In one paper it was shown that in vitro Treg with a known antigen specificity
capable of suppressing effector cells with the same specificity, but not those with a
different defined specificity [75]. Additionally, studies showing that protection from
organ autoimmunity relies on Treg cells that arose in an animal containing the organ in
question suggest that only Treg specific for that organ can prevent disease [78, 80, 155].
These data are most easily reconciled by the theory that Treg are most effective at
suppression of T cells when the antigens recognized by each are presented on the same
APC (which would most commonly occur when these antigens arise from the same tissue
or organism), but they can also mediate non-specific suppression less efficiently.
Improved efficiency of suppression is likely to be a result of mechanisms that rely on
direct interactions between the Treg and the effector cell, and/or tolerogenic effects the
Treg may have on the APC. Therefore, this allows for very efficient protection of those
potential targets for which Treg are specific, and explains how they are able to maintain
homeostasis even while they are outnumbered in vivo. However, if a Treg in the vicinity
of an effector cell is receiving TCR stimulation it might have a non-specific tolerogenic
effect on its surrounding through the release of cytokines. The ability of Treg to control T
cells with a different antigen specificity may therefore be a numbers game – if you have
enough of these cells, they will abrogate the immune response through passive
suppression, possibly combined with the effect of some Treg recognizing its antigen on
an APC that happens, by chance, to also present antigen to the effector cell. The

-147-
combination of these will then, somewhat less efficiently, be capable of controlling
responses in a “non-specific” way.
The pattern of localization seen by regulatory T cells is similar to the localization
of antigen-experienced memory T cells. T cells are conditioned to stay in the area in
which they recognize antigen and become activated, and regulatory T cells, as antigen-
experienced cells, are no exception. Since Treg do require stimulation through their
antigen receptor to suppress, whether or not their target is also recognizing the same
antigen, it makes sense to keep them in the area in which they will find that stimulation.
Therefore, as with memory T cells which are most effective at maintaining immunity it
kept at the ready in the site where the antigen previously turned up, this pattern of
localization improves the likelihood that a Treg will receive the stimulation it requires to
do its job efficiently.
Does peripheral conversion play a role in the non-mucosal immune system?
Many studies in which antigen was supplied in vivo under non-inflammatory
conditions have shown that peripheral conversion of mature T cells into Foxp3+
regulatory T cells CAN occur [38, 39, 41, 162, 194, 195]. There doesn’t seem to be any
special characteristic of the T cells able to undergo conversion; it seems that if you
present a T cell with its cognate antigen under the right conditions it may become a Treg.
Our data suggests that only T cells expressing a certain subset of TCR can be converted
(Fig 2.15). However, in vivo, this restriction likely has more to do with the antigens than
the TCR or T cell properties. Only certain antigens will be presented under the proper

-148-
conditions for Treg to develop, therefore limiting the T cells capable of converting to
those able to recognize this subset of antigens.
This ability of T cells to become regulatory serves as an excellent way to enforce
tolerance to certain antigens, whether or not they were presented in the thymus. The body
needs a system by which tolerance can be maintained to newly acquired or manufactured
antigens, or even typical self antigens which may not be thymically presented. Further,
even antigens which are expressed in the thymus are often expressed at low amounts, and
it would be impossible for all T cells to encounter all possible antigens. This results in
some T cells which strongly recognize self antigens escaping negative selection, and it
has been clearly shown that there are self-reactive T cells normally in the body; in the
absence of proper regulation these cells can cause autoimmunity. The flip side of this
antigen limitation is that some potential Treg will also escape their induction into the
Treg lineage, and enter the periphery as a typical naïve T cell.
This limited niche for Treg development was demonstrated by the recent paper
from our lab showing that, for any one particular TCR specificity, there are a limited
number of Treg that can be induced [189]. This number varies, most likely depending
upon the availability of the particular antigen recognized. If you have a large number of T
cells with a particular specificity, they cannot all receive sufficient signal to become
Treg, and a lower percentage of these cells will upregulate Foxp3 in the thymus. In the
TCR transgenic mouse expressing a Treg TCR, G113, there was no Foxp3 induction in
the thymus. However, if the prevalence of these cells in the thymus was reduced by
mixing with polyclonal T cells in a mixed bone marrow chimera, suddenly the G113 cells
no longer overwhelmed the supply of their (unknown) cognate antigen, and some were

-149-
able to receive the signal to become a Treg. The TCR transgenic mouse did, however,
show some Foxp3+ cells in the periphery even when there was no visible thymic
development. These cells may be a result of a “second chance” at Foxp3 induction for
cells that missed out on the opportunity in the thymus by peripheral conversion.
Our studies and others estimate that peripheral conversion does not contribute a
large amount to the normal Treg repertoire. This is probably because only a few cells will
require this “second chance” mechanism, which may account for the small number of
Treg (4-7%) estimated to arise from conversion in the secondary lymphoid organs.
However, during ontogeny the contribution may be greater, as the emerging T cells enter
the somewhat lymphopenic periphery. Homeostatic expansion facilitates conversion [42,
43]. As we showed in Fig. 2.15, however, even conversion in a lymphopenic
environment depends upon the TCR specificity; only those T cells receiving antigenic
stimulation in the correct environment will become Treg, and therefore only the T cells
recognizing self antigen will become regulatory.
It does seem, however, that peripheral conversion is not absolutely required to
maintain homeostasis. A recent study identified a conserved, non-coding sequence in the
Foxp3 gene which appears to be involved in peripheral conversion [149]. In spite of this
defect, mice that are deficient in this region showed no spontaneous development of
autoimmunity. There is likely to be a proportionally small number of cells in the
periphery which have “missed” becoming Foxp3 in the thymus in a fully polyclonal
animal, and therefore the thymically-derived Treg population is sufficient to maintain
tolerance. Additionally, while conversion was reduced, it was not absent in these mice.
However, it may be interesting to push this system and see if this lack of conversion does

-150-
affect the health of the mice under various conditions. For example, it has been reported
that during infection with a pathogen, Treg can arise alongside Teff cells, and are thought
to help restrain and shut down the immune response. Infection of these mice might show
increased tissue damage, possibly increasing their mortality in response to certain
pathogens. However, some pathogens that rely on induction of Foxp3+ Treg in order to
establish chronic infections (such as Leishmania major) might be cleared by these
animals [47].
Peripheral conversion and tolerance in the gut.
While it makes sense that peripheral conversion is not required on a large scale in
much of the body, the mucosal immune system is in contact with an ever changing array
of non-self antigens, and therefore it seems reasonable that Treg specific for harmless
commensal organisms would be advantageous. As antigens derived from these organisms
are unlikely to be transported to the thymus, at least in any useful amount, most Treg
specific for commensal bacteria are likely to arise via conversion. Our data shows that
many commonly found Treg in the colon do not arise from thymic Treg selection, and
instead appear to develop in the periphery in response to exposure to bacterial antigens.
While this may have been suspected, it is the first time that it has been shown that Treg
recognize antigens derived from specific bacteria, and it seems that, at least in our
experimental system, a large portion of the most prevalent Treg in the colon are actually
bacterially-reactive. As an extension of these studies, it would be excellent to see if the
Treg segregate even further within the various sections of the colon and cecum. The
cecum could be processed on its own, and the colon separated into the ascending colon,

-151-
transverse colon, and rectum/anal-rectal junction. If the Treg in these portions do show
differences in their TCR usage, it would be very useful to correlate the natural habitat of
the bacteria to which these Treg are specific to the Treg localization, if possible.
In the previously-mentioned study of the Foxp3 CNS1-deficient mice [149], T
cells show a defect in peripheral conversion, and have a lower number of Foxp3+ cells in
the gut-associated immune system. In spite of this, they report no development of
spontaneous gut inflammation in these animals. This may seem surprising considering the
evidence that conversion plays a large role in the formation of the Treg repertoire at this
location. However, in these mice conversion is not completely absent, just reduced.
Therefore, enough cells may created to keep homeostasis intact, at least in an unperturbed
system. They also have not specifically shown that the reduction is due to a lack of
conversion rather than a shorter lifespan of these converted Treg; they may, by their
nature, be less stable. Therefore, at any one time the gut immune system may contain a
reasonable array of bacterial-specific Treg capable of preventing disease, even if they
may not survive as long. It would be very interesting to compare the repertoire of TCRs
of the Treg populations in the CNS1-deficient and wild-type mice; this should allow for
the determination of whether the cells expressing typical Treg TCRs do not become
Foxp3+, or are simply reduced in frequency. The authors also speculate that some T cells
which would normally become Treg may instead become IL-10 producing Tr1 cells; this
theory could also be tested by the sequencing of these mice crossed to an IL-10 reporter
mouse [25].
The real challenge of maintaining a healthy intestine becomes evident during
infection with a pathogen. During such an event, there is often a breakdown in the mucus

-152-
layer and epithelial barrier, with a resulting high level of interaction between effector T
cells and both the pathogenic and non-pathogenic commensal organisms. To restore
homeostasis after such a pathogen is cleared and curb inflammation to allow repair of the
mucosal barrier is likely a challenge requiring the highest level of suppressive activity
available. In the absence of the normal number of the bacterially-responsive Treg capable
of efficiently suppressing reactivity to the commensal organisms, a chronic inflammatory
response may develop in the aftermath of such an event. Therefore, it would be
interesting to see whether these mice develop intestinal inflammation after infection with
an intestinal pathogen. Although the authors saw no difference between the CNS1 KO
mice and wild-type mice in resolution of DSS-mediated colitis, it has been shown
inflammation in this model is not T cell dependent [196], and therefore resolution may
not require a full Treg repertoire, and the increased number of IL-10-producing Tr1 cells
seen in these mice may instead compensate.
Therapeutic considerations of regulatory T cells in disease
The fact that Treg play an important role in maintaining immune homeostasis and
the observations that these cells are often lacking in either numbers or suppressive
capability in autoimmune diseases has led to the attempt to use these cells therapeutically
[197]. Strategies are two-fold; induce and expand Treg in vivo, or collect cells and
convert/expand them in vitro, for reintroduction into the patient. Many current IBD
therapies such as steroid regimens, neutralization of TNFα, and blockade of IL-12p40 (as
a component of both IL-12 and IL-23) may reduce innate immune activation but may also
have the ability to enhance Treg function or induce Treg, possibly through the restoration

-153-
of a permissive cytokine environment [177, 198, 199]. However, these broad-based
treatments can lead to unwanted side effects and susceptibility to infectious disease, so
more specific ways to target Treg are being developed [197].
Efforts to collect T cells from patients and then expand or induce Treg in vitro
have not so far been very successful [200]. There is not yet a reliable way to convert
human conventional T cells into stable, functional Treg in vitro on any large scale.
Expansion of Treg is hindered by the relatively low proportion of Treg in the blood, a
lack of a good technique to efficiently purify them away from the conventional T cells,
and the very large number of cells required to make a therapeutic difference. Most likely
the large number required is due to the lack of Treg specificity in this approach. In mouse
models of diabetes and IBD, the successful cure of ongoing inflammation by
administration of Treg required the Treg to be antigen-specific [201]. Of course, in most
cases it is not practical to obtain antigen-specific Treg from humans, and this is where the
potential therapy has reached its largest stumbling block. It has been proposed that
perhaps a vaccination of antigenic peptide may expand specific Treg in vivo, as a way to
get around this limitation [201]
It has been discovered that certain species of commensal bacteria can help to curb
inflammation in the gut; these bacteria have been termed probiotics. Many species have
been described to control inflammation, and in many cases the induction of Treg may be
central to this function [96]. A well-studied example is the VSL#3 cocktail of probiotics,
which causes increased IL-10 production and a population of TGFβ-producing cells that
prevent colitis in recipient mice upon transfer in a TGFβ-dependent manner [202].
Another is Bifidobacteria infantis, which led to an increase in CD4+CD25+ Treg and a

-154-
reduction in inflammation during infection with Salmonella typhimurium, and this
protection could also be transferred with the Treg population. In some cases, bacteria that
act as probiotics may produce a molecule that induce protective intestinal immune
responses, such as polysaccharide A (PSA) produced by Bacteroides fragilis [203, 204].
Administration of purified PSA alone can protect against the induction of experimental
IBD, and this is dependent upon the ability of T cells to produce IL-10, suggesting that
this factor can cause the production or expansion of IL-10-producing regulatory cells of
either the Tr1 or Foxp3+ subsets. These probiotics have the advantage of being able to
target directly an region and a subset of T cells which is directly relevant to disease in a
way that is much more efficient than our current methods allow us to do in vitro.
Additionally, it is non-invasive and very safe. These organisms and their immune effects
warrant further study and hold promise in the safe effective treatment of intestinal
inflammation.

-155-
REFERENCES
1. Walker, L.S. and A.K. Abbas, The enemy within: keeping self-reactive T cells at bay in the periphery. Nat Rev Immunol, 2002. 2(1): p. 11-9.
2. Germain, R.N., Special regulatory T-cell review: A rose by any other name: from suppressor T cells to Tregs, approbation to unbridled enthusiasm. Immunology, 2008. 123(1): p. 20-7.
3. Sakaguchi, S., K. Wing, and M. Miyara, Regulatory T cells - a brief history and perspective. Eur J Immunol, 2007. 37 Suppl 1: p. S116-23.
4. Kronenberg, M., et al., RNA transcripts for I-J polypeptides are apparently not encoded between the I-A and I-E subregions of the murine major histocompatibility complex. Proc Natl Acad Sci U S A, 1983. 80(18): p. 5704-8.
5. Sakaguchi, S., et al., Organ-specific autoimmune diseases induced in mice by elimination of T cell subset. I. Evidence for the active participation of T cells in natural self-tolerance; deficit of a T cell subset as a possible cause of autoimmune disease. J Exp Med, 1985. 161(1): p. 72-87.
6. Powrie, F. and D. Mason, OX-22high CD4+ T cells induce wasting disease with multiple organ pathology: prevention by the OX-22low subset. J Exp Med, 1990. 172(6): p. 1701-8.
7. McKeever, U., et al., Adoptive transfer of autoimmune diabetes and thyroiditis to athymic rats. Proc Natl Acad Sci U S A, 1990. 87(19): p. 7618-22.
8. Powrie, F., et al., Phenotypically distinct subsets of CD4+ T cells induce or protect from chronic intestinal inflammation in C. B-17 scid mice. Int Immunol, 1993. 5(11): p. 1461-71.
9. Morrissey, P.J., et al., CD4+ T cells that express high levels of CD45RB induce wasting disease when transferred into congenic severe combined immunodeficient mice. Disease development is prevented by cotransfer of purified CD4+ T cells. J Exp Med, 1993. 178(1): p. 237-44.
10. Sakaguchi, S., et al., Immunologic self-tolerance maintained by activated T cells expressing IL-2 receptor alpha-chains (CD25). Breakdown of a single mechanism of self-tolerance causes various autoimmune diseases. J Immunol, 1995. 155(3): p. 1151-64.
11. Shimizu, J., et al., Stimulation of CD25(+)CD4(+) regulatory T cells through GITR breaks immunological self-tolerance. Nat Immunol, 2002. 3(2): p. 135-42.
12. McHugh, R.S., et al., CD4(+)CD25(+) immunoregulatory T cells: gene expression analysis reveals a functional role for the glucocorticoid-induced TNF receptor. Immunity, 2002. 16(2): p. 311-23.
13. Read, S., V. Malmstrom, and F. Powrie, Cytotoxic T lymphocyte-associated antigen 4 plays an essential role in the function of CD25(+)CD4(+) regulatory cells that control intestinal inflammation. J Exp Med, 2000. 192(2): p. 295-302.
14. Takahashi, T., et al., Immunologic self-tolerance maintained by CD25(+)CD4(+) regulatory T cells constitutively expressing cytotoxic T lymphocyte-associated antigen 4. J Exp Med, 2000. 192(2): p. 303-10.
15. Brunkow, M.E., et al., Disruption of a new forkhead/winged-helix protein, scurfin, results in the fatal lymphoproliferative disorder of the scurfy mouse. Nat Genet, 2001. 27(1): p. 68-73.

-156-
16. Hori, S., T. Takahashi, and S. Sakaguchi, Control of autoimmunity by naturally arising regulatory CD4+ T cells. Adv Immunol, 2003. 81: p. 331-71.
17. Fontenot, J.D., M.A. Gavin, and A.Y. Rudensky, Foxp3 programs the development and function of CD4+CD25+ regulatory T cells. Nat Immunol, 2003. 4(4): p. 330-6.
18. Khattri, R., et al., An essential role for Scurfin in CD4+CD25+ T regulatory cells. Nat Immunol, 2003. 4(4): p. 337-42.
19. Fontenot, J.D., et al., Regulatory T cell lineage specification by the forkhead transcription factor foxp3. Immunity, 2005. 22(3): p. 329-41.
20. Wan, Y.Y. and R.A. Flavell, Identifying Foxp3-expressing suppressor T cells with a bicistronic reporter. Proc Natl Acad Sci U S A, 2005. 102(14): p. 5126-31.
21. Haribhai, D., et al., Regulatory T cells dynamically control the primary immune response to foreign antigen. J Immunol, 2007. 178(5): p. 2961-72.
22. Shevach, E.M., From vanilla to 28 flavors: multiple varieties of T regulatory cells. Immunity, 2006. 25(2): p. 195-201.
23. Faria, A.M. and H.L. Weiner, Oral tolerance. Immunol Rev, 2005. 206: p. 232-59.
24. Groux, H., et al., A CD4+ T-cell subset inhibits antigen-specific T-cell responses and prevents colitis. Nature, 1997. 389(6652): p. 737-42.
25. Maynard, C.L., et al., Regulatory T cells expressing interleukin 10 develop from Foxp3+ and Foxp3- precursor cells in the absence of interleukin 10. Nat Immunol, 2007. 8(9): p. 931-41.
26. Izcue, A., J.L. Coombes, and F. Powrie, Regulatory lymphocytes and intestinal inflammation. Annu Rev Immunol, 2009. 27: p. 313-38.
27. Wildin, R.S., et al., X-linked neonatal diabetes mellitus, enteropathy and endocrinopathy syndrome is the human equivalent of mouse scurfy. Nat Genet, 2001. 27(1): p. 18-20.
28. Blair, P.J., et al., CD4+CD8- T cells are the effector cells in disease pathogenesis in the scurfy (sf) mouse. J Immunol, 1994. 153(8): p. 3764-74.
29. Campbell, D.J. and S.F. Ziegler, FOXP3 modifies the phenotypic and functional properties of regulatory T cells. Nat Rev Immunol, 2007. 7(4): p. 305-10.
30. Kim, J.M., J.P. Rasmussen, and A.Y. Rudensky, Regulatory T cells prevent catastrophic autoimmunity throughout the lifespan of mice. Nat Immunol, 2007. 8(2): p. 191-7.
31. Sakaguchi, S., et al., T cell-mediated maintenance of natural self-tolerance: its breakdown as a possible cause of various autoimmune diseases. J Autoimmun, 1996. 9(2): p. 211-20.
32. Fontenot, J.D., et al., Developmental regulation of Foxp3 expression during ontogeny. J Exp Med, 2005. 202(7): p. 901-6.
33. Hsieh, C.S., et al., An intersection between the self-reactive regulatory and nonregulatory T cell receptor repertoires. Nat Immunol, 2006. 7(4): p. 401-10.
34. Pacholczyk, R., et al., Origin and T cell receptor diversity of Foxp3+CD4+CD25+ T cells. Immunity, 2006. 25(2): p. 249-59.
35. Wong, J., D. Mathis, and C. Benoist, TCR-based lineage tracing: no evidence for conversion of conventional into regulatory T cells in response to a natural self-antigen in pancreatic islets. J Exp Med, 2007. 204(9): p. 2039-45.

-157-
36. Jordan, M.S., et al., Thymic selection of CD4+CD25+ regulatory T cells induced by an agonist self-peptide. Nat Immunol, 2001. 2(4): p. 301-6.
37. Hsieh, C.S., et al., Recognition of the peripheral self by naturally arising CD25+ CD4+ T cell receptors. Immunity, 2004. 21(2): p. 267-77.
38. Thorstenson, K.M. and A. Khoruts, Generation of anergic and potentially immunoregulatory CD25+CD4 T cells in vivo after induction of peripheral tolerance with intravenous or oral antigen. J Immunol, 2001. 167(1): p. 188-95.
39. Apostolou, I. and H. von Boehmer, In vivo instruction of suppressor commitment in naive T cells. J Exp Med, 2004. 199(10): p. 1401-8.
40. Kretschmer, K., et al., Inducing and expanding regulatory T cell populations by foreign antigen. Nat Immunol, 2005. 6(12): p. 1219-27.
41. Knoechel, B., et al., Sequential development of interleukin 2-dependent effector and regulatory T cells in response to endogenous systemic antigen. J Exp Med, 2005. 202(10): p. 1375-86.
42. Curotto de Lafaille, M.A., et al., CD25- T cells generate CD25+Foxp3+ regulatory T cells by peripheral expansion. J Immunol, 2004. 173(12): p. 7259-68.
43. Liang, S., et al., Conversion of CD4+ CD25- cells into CD4+ CD25+ regulatory T cells in vivo requires B7 costimulation, but not the thymus. J Exp Med, 2005. 201(1): p. 127-37.
44. Sun, C.M., et al., Small intestine lamina propria dendritic cells promote de novo generation of Foxp3 T reg cells via retinoic acid. J Exp Med, 2007. 204(8): p. 1775-85.
45. Akbar, A.N., et al., The dynamic co-evolution of memory and regulatory CD4+ T cells in the periphery. Nat Rev Immunol, 2007. 7(3): p. 231-7.
46. Belkaid, Y. and B.T. Rouse, Natural regulatory T cells in infectious disease. Nat Immunol, 2005. 6(4): p. 353-60.
47. Suffia, I.J., et al., Infected site-restricted Foxp3+ natural regulatory T cells are specific for microbial antigens. J Exp Med, 2006. 203(3): p. 777-88.
48. McLachlan, J.B., et al., Dendritic cell antigen presentation drives simultaneous cytokine production by effector and regulatory T cells in inflamed skin. Immunity, 2009. 30(2): p. 277-88.
49. Tang, Q. and J.A. Bluestone, The Foxp3+ regulatory T cell: a jack of all trades, master of regulation. Nat Immunol, 2008. 9(3): p. 239-44.
50. Vignali, D.A., L.W. Collison, and C.J. Workman, How regulatory T cells work. Nat Rev Immunol, 2008. 8(7): p. 523-32.
51. Thornton, A.M. and E.M. Shevach, CD4+CD25+ immunoregulatory T cells suppress polyclonal T cell activation in vitro by inhibiting interleukin 2 production. J Exp Med, 1998. 188(2): p. 287-96.
52. Bopp, T., et al., Cyclic adenosine monophosphate is a key component of regulatory T cell-mediated suppression. J Exp Med, 2007. 204(6): p. 1303-10.
53. Gondek, D.C., et al., Cutting edge: contact-mediated suppression by CD4+CD25+ regulatory cells involves a granzyme B-dependent, perforin-independent mechanism. J Immunol, 2005. 174(4): p. 1783-6.
54. Tang, Q. and M.F. Krummel, Imaging the function of regulatory T cells in vivo. Curr Opin Immunol, 2006. 18(4): p. 496-502.

-158-
55. Collison, L.W., et al., Regulatory T cell suppression is potentiated by target T cells in a cell contact, IL-35- and IL-10-dependent manner. J Immunol, 2009. 182(10): p. 6121-8.
56. Kearley, J., et al., Resolution of airway inflammation and hyperreactivity after in vivo transfer of CD4+CD25+ regulatory T cells is interleukin 10 dependent. J Exp Med, 2005. 202(11): p. 1539-47.
57. Kursar, M., et al., Cutting Edge: Regulatory T cells prevent efficient clearance of Mycobacterium tuberculosis. J Immunol, 2007. 178(5): p. 2661-5.
58. Anderson, C.F., et al., CD4(+)CD25(-)Foxp3(-) Th1 cells are the source of IL-10-mediated immune suppression in chronic cutaneous leishmaniasis. J Exp Med, 2007. 204(2): p. 285-97.
59. Asseman, C., et al., An essential role for interleukin 10 in the function of regulatory T cells that inhibit intestinal inflammation. J Exp Med, 1999. 190(7): p. 995-1004.
60. Fahlen, L., et al., T cells that cannot respond to TGF-beta escape control by CD4(+)CD25(+) regulatory T cells. J Exp Med, 2005. 201(5): p. 737-46.
61. Collison, L.W., et al., The inhibitory cytokine IL-35 contributes to regulatory T-cell function. Nature, 2007. 450(7169): p. 566-9.
62. Pandiyan, P., et al., CD4+CD25+Foxp3+ regulatory T cells induce cytokine deprivation-mediated apoptosis of effector CD4+ T cells. Nat Immunol, 2007. 8(12): p. 1353-62.
63. Deaglio, S., et al., Adenosine generation catalyzed by CD39 and CD73 expressed on regulatory T cells mediates immune suppression. J Exp Med, 2007. 204(6): p. 1257-65.
64. Tang, Q., et al., Visualizing regulatory T cell control of autoimmune responses in nonobese diabetic mice. Nat Immunol, 2006. 7(1): p. 83-92.
65. Tadokoro, C.E., et al., Regulatory T cells inhibit stable contacts between CD4+ T cells and dendritic cells in vivo. J Exp Med, 2006. 203(3): p. 505-11.
66. Fallarino, F., et al., Modulation of tryptophan catabolism by regulatory T cells. Nat Immunol, 2003. 4(12): p. 1206-12.
67. Cederbom, L., H. Hall, and F. Ivars, CD4+CD25+ regulatory T cells down-regulate co-stimulatory molecules on antigen-presenting cells. Eur J Immunol, 2000. 30(6): p. 1538-43.
68. Oderup, C., et al., Cytotoxic T lymphocyte antigen-4-dependent down-modulation of costimulatory molecules on dendritic cells in CD4+ CD25+ regulatory T-cell-mediated suppression. Immunology, 2006. 118(2): p. 240-9.
69. Pesu, M., et al., T-cell-expressed proprotein convertase furin is essential for maintenance of peripheral immune tolerance. Nature, 2008. 455(7210): p. 246-50.
70. Qin, S., et al., "Infectious" transplantation tolerance. Science, 1993. 259(5097): p. 974-7.
71. Tarbell, K.V., et al., Dendritic cell-expanded, islet-specific CD4+ CD25+ CD62L+ regulatory T cells restore normoglycemia in diabetic NOD mice. J Exp Med, 2007. 204(1): p. 191-201.

-159-
72. Stummvoll, G.H., et al., Th1, Th2, and Th17 effector T cell-induced autoimmune gastritis differs in pathological pattern and in susceptibility to suppression by regulatory T cells. J Immunol, 2008. 181(3): p. 1908-16.
73. Thornton, A.M. and E.M. Shevach, Suppressor effector function of CD4+CD25+ immunoregulatory T cells is antigen nonspecific. J Immunol, 2000. 164(1): p. 183-90.
74. Huter, E.N., et al., Pre-differentiated Th1 and Th17 effector T cells in autoimmune gastritis: Ag-specific regulatory T cells are more potent suppressors than polyclonal regulatory T cells. Int Immunopharmacol, 2009. 9(5): p. 540-5.
75. Tanchot, C., et al., Immune regulation by self-reactive T cells is antigen specific. J Immunol, 2004. 172(7): p. 4285-91.
76. Takahashi, T., et al., Immunologic self-tolerance maintained by CD25+CD4+ naturally anergic and suppressive T cells: induction of autoimmune disease by breaking their anergic/suppressive state. Int Immunol, 1998. 10(12): p. 1969-80.
77. Szymczak-Workman, A.L., C.J. Workman, and D.A. Vignali, Cutting Edge: Regulatory T Cells Do Not Require Stimulation through Their TCR to Suppress. J Immunol, 2009. 182(9): p. 5188-92.
78. Taguchi, O., et al., Tissue-specific suppressor T cells involved in self-tolerance are activated extrathymically by self-antigens. Immunology, 1994. 82(3): p. 365-9.
79. Seddon, B. and D. Mason, Peripheral autoantigen induces regulatory T cells that prevent autoimmunity. J Exp Med, 1999. 189(5): p. 877-82.
80. Samy, E.T., et al., Continuous control of autoimmune disease by antigen-dependent polyclonal CD4+CD25+ regulatory T cells in the regional lymph node. J Exp Med, 2005. 202(6): p. 771-81.
81. Pacholczyk, R., et al., Nonself-antigens are the cognate specificities of Foxp3+ regulatory T cells. Immunity, 2007. 27(3): p. 493-504.
82. Kuczma, M., et al., TCR repertoire and Foxp3 expression define functionally distinct subsets of CD4+ regulatory T cells. J Immunol, 2009. 183(5): p. 3118-29.
83. Ley, R.E., et al., Evolution of mammals and their gut microbes. Science, 2008. 320(5883): p. 1647-51.
84. Eckburg, P.B., et al., Diversity of the human intestinal microbial flora. Science, 2005. 308(5728): p. 1635-8.
85. Artis, D., Epithelial-cell recognition of commensal bacteria and maintenance of immune homeostasis in the gut. Nat Rev Immunol, 2008. 8(6): p. 411-20.
86. Ley, R.E., et al., Worlds within worlds: evolution of the vertebrate gut microbiota. Nat Rev Microbiol, 2008. 6(10): p. 776-88.
87. Duerkop, B.A., S. Vaishnava, and L.V. Hooper, Immune responses to the microbiota at the intestinal mucosal surface. Immunity, 2009. 31(3): p. 368-76.
88. Barnes, M.J. and F. Powrie, Regulatory T cells reinforce intestinal homeostasis. Immunity, 2009. 31(3): p. 401-11.
89. Kunisawa, J., I. Takahashi, and H. Kiyono, Intraepithelial lymphocytes: their shared and divergent immunological behaviors in the small and large intestine. Immunol Rev, 2007. 215: p. 136-53.
90. Rescigno, M., et al., Dendritic cells express tight junction proteins and penetrate gut epithelial monolayers to sample bacteria. Nat Immunol, 2001. 2(4): p. 361-7.

-160-
91. MacPherson, G., et al., Uptake of antigens from the intestine by dendritic cells. Ann N Y Acad Sci, 2004. 1029: p. 75-82.
92. Chirdo, F.G., et al., Immunomodulatory dendritic cells in intestinal lamina propria. Eur J Immunol, 2005. 35(6): p. 1831-40.
93. Macpherson, A.J., M.B. Geuking, and K.D. McCoy, Immune responses that adapt the intestinal mucosa to commensal intestinal bacteria. Immunology, 2005. 115(2): p. 153-62.
94. Macpherson, A.J., et al., A primitive T cell-independent mechanism of intestinal mucosal IgA responses to commensal bacteria. Science, 2000. 288(5474): p. 2222-6.
95. Macpherson, A.J. and T. Uhr, Induction of protective IgA by intestinal dendritic cells carrying commensal bacteria. Science, 2004. 303(5664): p. 1662-5.
96. Round, J.L. and S.K. Mazmanian, The gut microbiota shapes intestinal immune responses during health and disease. Nat Rev Immunol, 2009. 9(5): p. 313-23.
97. Treiner, E., et al., Selection of evolutionarily conserved mucosal-associated invariant T cells by MR1. Nature, 2003. 422(6928): p. 164-9.
98. Abreu, M.T., Toll-like receptor signalling in the intestinal epithelium: how bacterial recognition shapes intestinal function. Nat Rev Immunol, 2010. 10(2): p. 131-44.
99. Johansson, M.E., et al., The inner of the two Muc2 mucin-dependent mucus layers in colon is devoid of bacteria. Proc Natl Acad Sci U S A, 2008. 105(39): p. 15064-9.
100. Cario, E. and D.K. Podolsky, Differential alteration in intestinal epithelial cell expression of toll-like receptor 3 (TLR3) and TLR4 in inflammatory bowel disease. Infect Immun, 2000. 68(12): p. 7010-7.
101. Gewirtz, A.T., et al., Cutting edge: bacterial flagellin activates basolaterally expressed TLR5 to induce epithelial proinflammatory gene expression. J Immunol, 2001. 167(4): p. 1882-5.
102. Lee, J., et al., Maintenance of colonic homeostasis by distinctive apical TLR9 signalling in intestinal epithelial cells. Nat Cell Biol, 2006. 8(12): p. 1327-36.
103. Xiao, H., et al., The Toll-interleukin-1 receptor member SIGIRR regulates colonic epithelial homeostasis, inflammation, and tumorigenesis. Immunity, 2007. 26(4): p. 461-75.
104. Lee, E.G., et al., Failure to regulate TNF-induced NF-kappaB and cell death responses in A20-deficient mice. Science, 2000. 289(5488): p. 2350-4.
105. Turer, E.E., et al., Homeostatic MyD88-dependent signals cause lethal inflamMation in the absence of A20. J Exp Med, 2008. 205(2): p. 451-64.
106. Neish, A.S., et al., Prokaryotic regulation of epithelial responses by inhibition of IkappaB-alpha ubiquitination. Science, 2000. 289(5484): p. 1560-3.
107. Kelly, D., et al., Commensal anaerobic gut bacteria attenuate inflammation by regulating nuclear-cytoplasmic shuttling of PPAR-gamma and RelA. Nat Immunol, 2004. 5(1): p. 104-12.
108. Saemann, M.D., et al., Anti-inflammatory effects of sodium butyrate on human monocytes: potent inhibition of IL-12 and up-regulation of IL-10 production. FASEB J, 2000. 14(15): p. 2380-2.

-161-
109. Rimoldi, M., et al., Intestinal immune homeostasis is regulated by the crosstalk between epithelial cells and dendritic cells. Nat Immunol, 2005. 6(5): p. 507-14.
110. Zaph, C., et al., Epithelial-cell-intrinsic IKK-beta expression regulates intestinal immune homeostasis. Nature, 2007. 446(7135): p. 552-6.
111. Fujita, S., et al., Regulatory dendritic cells act as regulators of acute lethal systemic inflammatory response. Blood, 2006. 107(9): p. 3656-64.
112. Strobl, H. and W. Knapp, TGF-beta1 regulation of dendritic cells. Microbes Infect, 1999. 1(15): p. 1283-90.
113. Newberry, R.D., W.F. Stenson, and R.G. Lorenz, Cyclooxygenase-2-dependent arachidonic acid metabolites are essential modulators of the intestinal immune response to dietary antigen. Nat Med, 1999. 5(8): p. 900-6.
114. Harizi, H., et al., Cyclooxygenase-2-issued prostaglandin e(2) enhances the production of endogenous IL-10, which down-regulates dendritic cell functions. J Immunol, 2002. 168(5): p. 2255-63.
115. Braun, D., R.S. Longman, and M.L. Albert, A two-step induction of indoleamine 2,3 dioxygenase (IDO) activity during dendritic-cell maturation. Blood, 2005. 106(7): p. 2375-81.
116. He, B., et al., Intestinal bacteria trigger T cell-independent immunoglobulin A(2) class switching by inducing epithelial-cell secretion of the cytokine APRIL. Immunity, 2007. 26(6): p. 812-26.
117. Dahan, S., et al., Epithelia: lymphocyte interactions in the gut. Immunol Rev, 2007. 215: p. 243-53.
118. Hershberg, R.M., et al., Intestinal epithelial cells use two distinct pathways for HLA class II antigen processing. J Clin Invest, 1997. 100(1): p. 204-15.
119. Iwasaki, A. and B.L. Kelsall, Localization of distinct Peyer's patch dendritic cell subsets and their recruitment by chemokines macrophage inflammatory protein (MIP)-3alpha, MIP-3beta, and secondary lymphoid organ chemokine. J Exp Med, 2000. 191(8): p. 1381-94.
120. Iwasaki, A. and B.L. Kelsall, Unique functions of CD11b+, CD8 alpha+, and double-negative Peyer's patch dendritic cells. J Immunol, 2001. 166(8): p. 4884-90.
121. Coombes, J.L. and K.J. Maloy, Control of intestinal homeostasis by regulatory T cells and dendritic cells. Semin Immunol, 2007. 19(2): p. 116-26.
122. Annacker, O., et al., Essential role for CD103 in the T cell-mediated regulation of experimental colitis. J Exp Med, 2005. 202(8): p. 1051-61.
123. Johansson-Lindbom, B., et al., Functional specialization of gut CD103+ dendritic cells in the regulation of tissue-selective T cell homing. J Exp Med, 2005. 202(8): p. 1063-73.
124. Coombes, J.L., et al., A functionally specialized population of mucosal CD103+ DCs induces Foxp3+ regulatory T cells via a TGF-beta and retinoic acid-dependent mechanism. J Exp Med, 2007. 204(8): p. 1757-64.
125. Foligne, B., et al., A key role of dendritic cells in probiotic functionality. PLoS One, 2007. 2(3): p. e313.
126. Stephensen, C.B., Vitamin A, infection, and immune function. Annu Rev Nutr, 2001. 21: p. 167-92.

-162-
127. Mora, J.R., et al., Generation of gut-homing IgA-secreting B cells by intestinal dendritic cells. Science, 2006. 314(5802): p. 1157-60.
128. Benson, M.J., et al., All-trans retinoic acid mediates enhanced T reg cell growth, differentiation, and gut homing in the face of high levels of co-stimulation. J Exp Med, 2007. 204(8): p. 1765-74.
129. Iwata, M., et al., Retinoic acid imprints gut-homing specificity on T cells. Immunity, 2004. 21(4): p. 527-38.
130. Mucida, D., et al., Reciprocal TH17 and regulatory T cell differentiation mediated by retinoic acid. Science, 2007. 317(5835): p. 256-60.
131. Saurer, L., K.C. McCullough, and A. Summerfield, In vitro induction of mucosa-type dendritic cells by all-trans retinoic acid. J Immunol, 2007. 179(6): p. 3504-14.
132. Lampen, A., et al., Metabolism of vitamin A and its active metabolite all-trans-retinoic acid in small intestinal enterocytes. J Pharmacol Exp Ther, 2000. 295(3): p. 979-85.
133. Loftus, E.V., Jr., Clinical epidemiology of inflammatory bowel disease: Incidence, prevalence, and environmental influences. Gastroenterology, 2004. 126(6): p. 1504-17.
134. Bouma, G. and W. Strober, The immunological and genetic basis of inflammatory bowel disease. Nat Rev Immunol, 2003. 3(7): p. 521-33.
135. Elson, C.O., Commensal bacteria as targets in Crohn's disease. Gastroenterology, 2000. 119(1): p. 254-7.
136. Macpherson, A., et al., Mucosal antibodies in inflammatory bowel disease are directed against intestinal bacteria. Gut, 1996. 38(3): p. 365-75.
137. Garrett, W.S., J.I. Gordon, and L.H. Glimcher, Homeostasis and inflammation in the intestine. Cell. 140(6): p. 859-70.
138. Cadwell, K., et al., A key role for autophagy and the autophagy gene Atg16l1 in mouse and human intestinal Paneth cells. Nature, 2008. 456(7219): p. 259-63.
139. Nenci, A., et al., Epithelial NEMO links innate immunity to chronic intestinal inflammation. Nature, 2007. 446(7135): p. 557-61.
140. Kobayashi, K.S., et al., Nod2-dependent regulation of innate and adaptive immunity in the intestinal tract. Science, 2005. 307(5710): p. 731-4.
141. Chieppa, M., et al., Dynamic imaging of dendritic cell extension into the small bowel lumen in response to epithelial cell TLR engagement. J Exp Med, 2006. 203(13): p. 2841-52.
142. Rakoff-Nahoum, S., et al., Recognition of commensal microflora by toll-like receptors is required for intestinal homeostasis. Cell, 2004. 118(2): p. 229-41.
143. Li, M.O. and R.A. Flavell, Contextual regulation of inflammation: a duet by transforming growth factor-beta and interleukin-10. Immunity, 2008. 28(4): p. 468-76.
144. Patey-Mariaud de Serre, N., et al., Digestive histopathological presentation of IPEX syndrome. Mod Pathol, 2009. 22(1): p. 95-102.
145. Gad, M., et al., Demonstration of strong enterobacterial reactivity of CD4+CD25- T cells from conventional and germ-free mice which is counter-regulated by CD4+CD25+ T cells. Eur J Immunol, 2004. 34(3): p. 695-704.

-163-
146. Maloy, K.J., Induction and regulation of inflammatory bowel disease in immunodeficient mice by distinct CD4+ T-cell subsets. Methods Mol Biol, 2007. 380: p. 327-35.
147. Strauch, U.G., et al., Influence of intestinal bacteria on induction of regulatory T cells: lessons from a transfer model of colitis. Gut, 2005. 54(11): p. 1546-52.
148. Singh, B., et al., Control of intestinal inflammation by regulatory T cells. Immunol Rev, 2001. 182: p. 190-200.
149. Zheng, Y., et al., Role of conserved non-coding DNA elements in the Foxp3 gene in regulatory T-cell fate. Nature. 463(7282): p. 808-12.
150. Lathrop, S.K., et al., Antigen-specific peripheral shaping of the natural regulatory T cell population. J Exp Med, 2008. 205(13): p. 3105-17.
151. Lahl, K., et al., Selective depletion of Foxp3+ regulatory T cells induces a scurfy-like disease. J Exp Med, 2007. 204(1): p. 57-63.
152. Itoh, M., et al., Thymus and autoimmunity: production of CD25+CD4+ naturally anergic and suppressive T cells as a key function of the thymus in maintaining immunologic self-tolerance. J Immunol, 1999. 162(9): p. 5317-26.
153. Wong, J., et al., Adaptation of TCR repertoires to self-peptides in regulatory and nonregulatory CD4+ T cells. J Immunol, 2007. 178(11): p. 7032-41.
154. Correia-Neves, M., et al., The shaping of the T cell repertoire. Immunity, 2001. 14(1): p. 21-32.
155. Green, E.A., Y. Choi, and R.A. Flavell, Pancreatic lymph node-derived CD4(+)CD25(+) Treg cells: highly potent regulators of diabetes that require TRANCE-RANK signals. Immunity, 2002. 16(2): p. 183-91.
156. Sather, B.D., et al., Altering the distribution of Foxp3(+) regulatory T cells results in tissue-specific inflammatory disease. J Exp Med, 2007. 204(6): p. 1335-47.
157. Gavin, M.A., et al., Homeostasis and anergy of CD4(+)CD25(+) suppressor T cells in vivo. Nat Immunol, 2002. 3(1): p. 33-41.
158. Grajewski, R.S., et al., Endogenous IRBP can be dispensable for generation of natural CD4+CD25+ regulatory T cells that protect from IRBP-induced retinal autoimmunity. J Exp Med, 2006. 203(4): p. 851-6.
159. Hori, S., et al., Specificity requirements for selection and effector functions of CD25+4+ regulatory T cells in anti-myelin basic protein T cell receptor transgenic mice. Proc Natl Acad Sci U S A, 2002. 99(12): p. 8213-8.
160. Suri-Payer, E., et al., CD4+CD25+ T cells inhibit both the induction and effector function of autoreactive T cells and represent a unique lineage of immunoregulatory cells. J Immunol, 1998. 160(3): p. 1212-8.
161. Belkaid, Y., Regulatory T cells and infection: a dangerous necessity. Nat Rev Immunol, 2007. 7(11): p. 875-88.
162. Cobbold, S.P., et al., Induction of foxP3+ regulatory T cells in the periphery of T cell receptor transgenic mice tolerized to transplants. J Immunol, 2004. 172(10): p. 6003-10.
163. Giudicelli, V., D. Chaume, and M.P. Lefranc, IMGT/V-QUEST, an integrated software program for immunoglobulin and T cell receptor V-J and V-D-J rearrangement analysis. Nucleic Acids Res, 2004. 32(Web Server issue): p. W435-40.

-164-
164. Lio, C.W. and C.S. Hsieh, A two-step process for thymic regulatory T cell development. Immunity, 2008. 28(1): p. 100-11.
165. Magurran, A.E., Ecological diversity and its measurement. 1988, Princeton, N.J.: Princeton University Press. 179.
166. Fisson, S., et al., Continuous activation of autoreactive CD4+ CD25+ regulatory T cells in the steady state. J Exp Med, 2003. 198(5): p. 737-46.
167. Le Campion, A., et al., Naive T cells proliferate strongly in neonatal mice in response to self-peptide/self-MHC complexes. Proc Natl Acad Sci U S A, 2002. 99(7): p. 4538-43.
168. Min, B., et al., Neonates support lymphopenia-induced proliferation. Immunity, 2003. 18(1): p. 131-40.
169. Asano, M., et al., Autoimmune disease as a consequence of developmental abnormality of a T cell subpopulation. J Exp Med, 1996. 184(2): p. 387-96.
170. Izcue, A., J.L. Coombes, and F. Powrie, Regulatory T cells suppress systemic and mucosal immune activation to control intestinal inflammation. Immunol Rev, 2006. 212: p. 256-71.
171. Kirberg, J., et al., Peripheral T lymphocytes recirculating back into the thymus can mediate thymocyte positive selection. J Immunol, 2008. 181(2): p. 1207-14.
172. Bosco, N., et al., Role of the T cell receptor alpha chain in the development and phenotype of naturally arising CD4+CD25+ T cells. Mol Immunol, 2006. 43(3): p. 246-54.
173. Lohr, J., B. Knoechel, and A.K. Abbas, Regulatory T cells in the periphery. Immunol Rev, 2006. 212: p. 149-62.
174. Klein, L., K. Khazaie, and H. von Boehmer, In vivo dynamics of antigen-specific regulatory T cells not predicted from behavior in vitro. Proc Natl Acad Sci U S A, 2003. 100(15): p. 8886-91.
175. Zheng, S.G., et al., IL-2 is essential for TGF-beta to convert naive CD4+CD25- cells to CD25+Foxp3+ regulatory T cells and for expansion of these cells. J Immunol, 2007. 178(4): p. 2018-27.
176. Davidson, T.S., et al., Cutting Edge: IL-2 is essential for TGF-beta-mediated induction of Foxp3+ T regulatory cells. J Immunol, 2007. 178(7): p. 4022-6.
177. Izcue, A., et al., Interleukin-23 restrains regulatory T cell activity to drive T cell-dependent colitis. Immunity, 2008. 28(4): p. 559-70.
178. Milner, J., et al., Repertoire-dependent immunopathology. J Autoimmun, 2007. 179. Lyon, M.F., et al., The scurfy mouse mutant has previously unrecognized
hematological abnormalities and resembles Wiskott-Aldrich syndrome. Proc Natl Acad Sci U S A, 1990. 87(7): p. 2433-7.
180. Ise, W., et al., CTLA-4 suppresses the pathogenicity of self antigen-specific T cells by cell-intrinsic and cell-extrinsic mechanisms. Nat Immunol. 11(2): p. 129-35.
181. Onderdonk, A.B., et al., Experimental intra-abdominal abscesses in rats: quantitative bacteriology of infected animals. Infect Immun, 1974. 10(6): p. 1256-9.
182. Sakon, H., et al., Sutterella parvirubra sp. nov. and Megamonas funiformis sp. nov., isolated from human faeces. Int J Syst Evol Microbiol, 2008. 58(Pt 4): p. 970-5.

-165-
183. Gill, S.R., et al., Metagenomic analysis of the human distal gut microbiome. Science, 2006. 312(5778): p. 1355-9.
184. Altschul, S.F., et al., Basic local alignment search tool. J Mol Biol, 1990. 215(3): p. 403-10.
185. Cole, J.R., et al., The ribosomal database project (RDP-II): introducing myRDP space and quality controlled public data. Nucleic Acids Res, 2007. 35(Database issue): p. D169-72.
186. Wang, Q., et al., Naive Bayesian classifier for rapid assignment of rRNA sequences into the new bacterial taxonomy. Appl Environ Microbiol, 2007. 73(16): p. 5261-7.
187. Cole, J.R., et al., The Ribosomal Database Project: improved alignments and new tools for rRNA analysis. Nucleic Acids Res, 2009. 37(Database issue): p. D141-5.
188. Holst, J., et al., Rapid analysis of T-cell selection in vivo using T cell-receptor retrogenic mice. Nat Methods, 2006. 3(3): p. 191-7.
189. Bautista, J.L., et al., Intraclonal competition limits the fate determination of regulatory T cells in the thymus. Nat Immunol, 2009. 10(6): p. 610-7.
190. Ochando, J.C., et al., Lymph node occupancy is required for the peripheral development of alloantigen-specific Foxp3+ regulatory T cells. J Immunol, 2005. 174(11): p. 6993-7005.
191. Worbs, T., et al., Oral tolerance originates in the intestinal immune system and relies on antigen carriage by dendritic cells. J Exp Med, 2006. 203(3): p. 519-27.
192. Bouskra, D., et al., Lymphoid tissue genesis induced by commensals through NOD1 regulates intestinal homeostasis. Nature, 2008. 456(7221): p. 507-10.
193. Antunes, I., et al., Retrovirus-specificity of regulatory T cells is neither present nor required in preventing retrovirus-induced bone marrow immune pathology. Immunity, 2008. 29(5): p. 782-94.
194. Chen, T.C., et al., Generation of anergic and regulatory T cells following prolonged exposure to a harmless antigen. J Immunol, 2004. 172(10): p. 5900-7.
195. Mahnke, K., et al., Induction of CD4+/CD25+ regulatory T cells by targeting of antigens to immature dendritic cells. Blood, 2003. 101(12): p. 4862-9.
196. Dieleman, L.A., et al., Dextran sulfate sodium-induced colitis occurs in severe combined immunodeficient mice. Gastroenterology, 1994. 107(6): p. 1643-52.
197. Brusko, T.M., A.L. Putnam, and J.A. Bluestone, Human regulatory T cells: role in autoimmune disease and therapeutic opportunities. Immunol Rev, 2008. 223: p. 371-90.
198. Vieira, P.L., et al., IL-10-secreting regulatory T cells do not express Foxp3 but have comparable regulatory function to naturally occurring CD4+CD25+ regulatory T cells. J Immunol, 2004. 172(10): p. 5986-93.
199. Valencia, X., et al., TNF downmodulates the function of human CD4+CD25hi T-regulatory cells. Blood, 2006. 108(1): p. 253-61.
200. Riley, J.L., C.H. June, and B.R. Blazar, Human T regulatory cell therapy: take a billion or so and call me in the morning. Immunity, 2009. 30(5): p. 656-65.
201. Vandenbark, A.A. and H. Offner, Critical evaluation of regulatory T cells in autoimmunity: are the most potent regulatory specificities being ignored? Immunology, 2008. 125(1): p. 1-13.

-166-
202. Di Giacinto, C., et al., Probiotics ameliorate recurrent Th1-mediated murine colitis by inducing IL-10 and IL-10-dependent TGF-beta-bearing regulatory cells. J Immunol, 2005. 174(6): p. 3237-46.
203. Mazmanian, S.K., et al., An immunomodulatory molecule of symbiotic bacteria directs maturation of the host immune system. Cell, 2005. 122(1): p. 107-18.
204. Mazmanian, S.K., J.L. Round, and D.L. Kasper, A microbial symbiosis factor prevents intestinal inflammatory disease. Nature, 2008. 453(7195): p. 620-5.