the role of starch physicochemical properties in
TRANSCRIPT
THE ROLE OF STARCH PHYSICOCHEMICAL
PROPERTIES IN DETERMINING THE GLYCAEMIC
INDEX OF NOVEL POTATO VARIETIES
by
Tracy Sousa Moreira
A thesis submitted in conformity with the requirements
for the degree of Master of Science
Department of Nutritional Sciences
University of Toronto
© Copyright by Tracy Sousa Moreira 2012
ii
THE ROLE OF STARCH PHYSICOCHEMICAL PROPERTIES IN DETERMINING
THE GLYCAEMICINDEX OF NOVEL POTATO VARIETIES
Master of Science, 2012
Tracy Sousa Moreira
Department of Nutritional Sciences
University of Toronto
ABSTRACT
Potatoes are often thought of as high GI. It is known that cooking and cooling affect GI
and that these effects may be mediated through the physicochemical properties of their starch.
As part of a Canadian initiative to develop low GI potatoes, novel potato varieties which differed
in starch composition were tested in 2 separate studies. In study 1, we determined the GI of 8
varieties and found that cooling produced a wide range of effects (0-50% reduction in GI). In
study 2, four previously tested varieties were re-examined. A significant variety-x-treatment
interaction (p<0.01) was observed with cooling reducing GI in some potatoes. Examination of
the starch properties and their role in determining GI showed that RDS was positively associated
with GI (r2= 0.85, p= 0.001) and SDS (r
2=-0.60, p= 0.02) and amylose (r
2=-0.99, p=0.007)
negatively associated with GI. No relationship between RS and phosphorous content and GI was
observed.
iii
ACKNOWLEDGEMENTS
I would like to thank my supervisor Dr. Thomas Wolever for giving me the opportunity
to pursue graduate studies at the University of Toronto and for always being available to answer
my many questions.
I would also like to thank my committee members Dr. David Jenkins and Dr. Richard Bazinet for
providing me with great insight and constructive feedback for my studies. I would also like to
thank Dr. Mary Keith for acting as my external examiner and to Dr. Mary L‟Abbe for
chairing my defense.
Thank-you to all the members of the Wolever laboratory, especially Tara Kinnear for engaging
me in exciting conversations about potatoes!!
A special thank-you to everyone at Glycemic Index Laboratories, for training me and aiding me
in the organization and day-to-day operations of my studies.
Thank-you to my parents Jack and Dionisia Moreira for always supporting me and encouraging
my pursuit for higher knowledge. I would like to especially thank my dad for encouraging me
and instilling in me the idea that I could truly be whatever I wanted to be as long as I worked
hard at it.
Last, but not least, I want to thank my fiancé, James Lucas for his constant support and
encouragement and for allowing me to ramble on about my research, when often he had no idea
what I was talking about.

iv
TABLE OF CONTENTS
Page
ABSTRACT ii
ACKNOWLEDGMENTS iii
LIST OF ABBREVIATIONS vii
LIST OF FIGURES viii-ix
LIST OF TABLES x
CHAPTER 1. INTRODUCTION 1-4
CHAPTER 2. REVIEW OF LITERATURE 5-21
2.1 Nutritional Composition of Potato 6-7
2.2 Potato Starch Structure and Composition 7
2.3 Effects of cooking and cooling on starch structure and 7-8
digestibility
2.4 Measurement and Classification of Dietary Carbohydrates 9-12
2.4.1 Glycaemic Index 9-10
2.4.2 In vitro Starch Digestibility 10-12
2.5 Potato Digestibility and the Glycaemic Index 12-15
2.6 The Role of Rapidly Digestible Starch, Slowly Digestible 15-17
Starch and Resistant Starch in Health
2.7 Physicochemical Properties that Affect Starch 17-19
Digestibility of Potato
2.7.1 Amylose:Amylopectin 17-18
2.7.2 Fine Structure of Amylopectin 18-19
2.7.3 Phosphorous Content 19

v
2.7.4 Maturity 19
2.8 Summary and Research Objectives 20-21
2.8.1 Summary 20
2.8.2 Research Objectives 21
2.8.3 Hypotheses 21
CHAPTER 3. STUDY 1- THE EFFECT OF COOLING
ON THE GLYCAEMIC INDEX OF NOVEL
POTATO VARIETIES 22-44
3.1 Introduction 23-24
3.2 Study Design and Methods 23-32
3.2.1 Subjects 25
3.2.2 Test Meals 27-28
3.2.3 Protocol 29
3.2.4 Calculation of Glycaemic Index 30-31
3.2.5 Statistical Analysis 31-32
3.3 Results and Discussion 33-43
3.4 Conclusion 44
CHAPTER 4. STUDY 2- THE ROLE OF STARCH
PHYSICOCHEMICAL PROPERTIES IN
DETERMINING THE GLYCAEMIC INDEX OF
POTATO 45-76
4.1 Introduction 46-47
4.2 Study Design and Methods 48-50
4.2.1 Subjects 48
4.2.2 Test Meals 48
4.2.3 Protocol 49
4.2.4 Calculation of Glycaemic Index 50
4.2.5 Statistical Analysis 50

vi
4.3 Materials and Methods- In vitro starch digestibility 51
4.3.1 Preparation of dry Matter 51
4.3.2 Chemical Composition 51
4.3.3 In vitro digestibility of cooked potatoes 54
4.3.4 Statistical Analysis 54
4.4 Results and Discussion 55-74
CHAPTER 5. GENERAL DISCUSSION, CONCLUSIONS AND 75-79
FUTURE DIRECTIONS
5.1.1 Study 1 76
5.1.2 Study 2 76-77
5.2 Conclusions 78
5.3 Future Directions 79
REFERENCES 80-90
vii
LIST OF ABBREVIATIONS
ANOVA Analysis of variance
AUC Area under the curve
avCHO Available carbohydrate
BG Blood glucose
BMI Body mass index
BV Biological value
CHO Carbohydrate
CVD Cardiovascular disease
FBG Fasting Blood Glucose
FC Freshly cooked
GI Glycaemic Index
GR Glycaemic Response
II Insulinaemic Index
SAG Slowly available glucose
SDS Slowly digestible starch
RAG Rapidly available glucose
RDS Rapidly digestible starch
RS Resistant starch
SCFA Short chain fatty acids
SD Standard deviation
SEM Standard error of mean
T2D Type 2 diabetes

viii
LIST OF FIGURES
Page
3.1a Blood glucose response elicited by freshly cooked 37
and cold potatoes for varieties 1, 2, 3 and 4.
Values are means ± SEM (n= 10).
3.1b Blood glucose response elicited by freshly cooked 38
and cold potatoes for varieties 5, 6, 7 and 8.
Values are means ± SEM (n= 10).
3.2 GI of potato chips for group A (n=10) and group B (n=10). 39
3.3 GI of potato varieties 1, 2, 3, 4, 5, 6, 7, and 8 served to subjects 40
(n= 10) freshly cooked and cold.
3.5 Percent reduction in GI upon cooling for potato varieties 1, 2, 3, 41
4, 5, 6, 7 and 8
4.1 Blood glucose response elicited by freshly cooked and 62
cold potatoes for varieties 2, 3, 4 and 5.
Values are means ± SEM (n= 10)
4.2 Insulin response elicited by freshly cooked and 63
cold potatoes for varieties 2, 3, 4 and 5
4.3 GI of potato varieties 2, 3, 4, and 5 served to subjects 64
(n= 10) freshly cooked and cold
4.4 GI of potato varieties 2, 3, 4 and 5 served to ten subjects in two 65
ways, freshly cooked and cold and harvested in 2009 and 2010
4.5 Relationship between glycaemic index (GI) and insulinaemic 66
index (II) values of 50g available carbohydrate portions of
potato varieties 2, 3, 4 and 5 freshly cooked and cold
4.6 Relationship between the amount of rapidly digestible starch (RDS) 67
in a portion of potato containing 50g of available carbohydrate and
the GI freshly cooked and cold potatoes
4.7 Relationship between the amount of slowly digestible starch (SDS) 68
in a portion of potato containing 50g of available carbohydrate and
the GI freshly cooked and cold potatoes

ix
4.8 Relationship between the amount of resistant starch (RS) in a portion 69
of potato containing 50g of available carbohydrate and the GI freshly
cooked and cold potatoes
4.9 Relationship between percent amylose (%) for each potato variety and GI 70
4.10 Relationship between the GI of potato and phosphorous content 71

x
LIST OF TABLES
Page
3.1. Subject Characteristics 26
3.2 Energy and Macronutrient Composition of Test Meals 29
3.3 Blood glucose AUC for potato varieties 1-8 35
served to subjects (n= 10) freshly cooked and Cold
3.4 GI values for potato varieties 1-8 served to subjects 36
(n= 10) freshly cooked and Cold
4.1 Subject Characteristics 56
4.2 Energy and Macronutrient Composition of Test Meals 57
4.3 Blood glucose and Insulin AUC values for potato 58
varieties 2, 3, 4 and 5
4.4 GI values for potato varieties 2, 3, 4 and 5 59
4.5 GI values for potato varieties 2, 3, 4 and 5 harvested in 2009 60
and 2010 and served to subjects (n= 10) freshly cooked and cold
4.6 In vitro digestibility of cooked and cooled potatoes 61

1
CHAPTER 1
INTRODUCTION

2
1. INTRODUCTION
The potato (solanum tuberosum) was first identified over 8,000 years ago in the Andean
mountains of Peru (Lutaladio, 2009). In the late 16th
century they were brought to Europe by the
Spaniards and from there were spread globally (Lutaladio, 2009). Canada has become an
important contributor to potato production worldwide and is currently the 12th
largest producer of
potatoes with over 160 potato varieties and 5 million metric tonnes grown annually (AAFC,
2007). Potatoes are ranked the fourth most important food crop world-wide, after maize, wheat
and rice, making them a staple in the human diet on a global scale (CIP, 1996).
Potatoes are a nutrient dense, low calorie food. Potatoes are a good source of
carbohydrates (CHO), high quality protein and when eaten with the skin contain appreciable
amounts of several micronutrients including vitamin C, phosphorous and potassium (Camire,
Kubow & Donnelly, 2009). Potatoes also contain phenolic compounds such as caffeic acid and
chlorogenic acid, however the composition and amount varies between potato cultivars (Brown
et al., 2003; Brown et al., 2005; Camire, Kubow & Donnelly, 2009). Despite their favourable
nutrient profile, potato consumption has steadily declined in several countries including Canada
(AAFC, 2007). Potatoes represent 44% of all fresh vegetables consumed in Canada, however
consumption has declined by 29% from 1996 to 2005 (AAFC, 2007). Processed potato
consumption including that of frozen potatoes, chips, and other processed potato products have
increased slightly, however not enough to account for the decline in fresh potato consumption
observed in the Canadian population (AAFC, 2007). In 1996 Canadians were consuming 75kg
per person; this declined to 65kg per person in 2005 (AAFC, 2007). So why has potato
consumption declined? There are several potential explanations for this decline, one potential

3
variable is the market saturation of other CHO foods that are often well-marketed to the public
and present with specific health claims such as low-fat, fat-free or reduces cholesterol. In
addition, information found in popular diet books (Brand-Miller, 1996), magazines (Golden,
2002) and scientific literature (Halton et al., 2006; Liu & Willett, 2002) may be to blame for the
paradigm shift from advocating a high CHO diet to the ever popular low CHO diet (Halton et al.,
2006). Moreover, results from some research studies reporting high glycaemic index (GI) values
for potatoes have been extrapolated to all potatoes thus reinforcing the erroneous notion that
potatoes are an unhealthy food choice and should be avoided (Crapo et al., 1977; Crapo et al.,
1980; Soh & Brand-Miller, 1999). Interestingly enough some of the studies showing high GI
values for potatoes were conducted before the GI term was coined and thus the appropriate GI
testing protocol may not have been utilized.
The GI is a ranking system that allows CHO foods to be classified on a scale of 0-100
based on their effects on postprandial blood glucose (BG) levels (Wolever, 2006). Using this
system foods can be classified as either low (≤ 55), medium (≥ 56-69) or high (≥ 70) GI
(Wolever, 2006). High GI foods are disconcerting due to their rapid and exaggerated effects on
postprandial BG and insulin levels (Wolever, 2006). This has significant health implications
considering the association between high GI diets and an increased risk for developing chronic
diseases such as, type 2 diabetes (T2D) and coronary heart disease (CHD) (Salmeron et al., 1997;
Liu et al., 2000). Although potatoes tend to be thought of as high GI there is still no definitive
evidence to support this notion. In fact the GI values reported in the literature vary significantly
from as low as 23 for an unidentified variety to 111 for a baked russet potato (Soh & Brand-
Miller, 1999; Foster-Powell, Holt & Brand-Miller, 2002). The possibility exists that these

4
differences in GI values reported in the literature may be due to random experimental error or
flaws in the GI methodology used by individual laboratories. However, a more plausible
explanation for these variations in reported GI values is that there are inherent differences in the
potatoes‟ starch structure and morphology that affect the way they respond to cooking and
cooling processes.
The following literature review will examine the several factors that are thought to affect
the digestibility of potatoes and hence their GI. Focus will be on the effect of cooking, cooling
as well as starch physicochemical properties in determining the GI of potatoes.

5
CHAPTER 2
REVIEW OF LITERATURE

6
2.1 Nutritional Composition of Potato
Potatoes are comprised of ~80% water and ~20% dry matter; 66-80% of dry matter is
represented as CHO, mainly in the form of starch (Camire, Kubow & Donnelly, 2009). Despite
their reputation as an unhealthy food choice, potatoes are a good source of CHO, high quality
protein and contains appreciable amounts of several micronutrients (Golden et al., 2002; Camire,
Kubow & Donnelly, 2009). One medium size potato (150g, boiled with skin intact) contains 100
kcals and is virtually free of fat, sodium and cholesterol (Monro & Mishra, 2008). Due to their
high water content potatoes are less energy dense than other common staple CHO foods, such as
bread, rice and pasta (Monro and Mishra, 2008; Lynch et al., 2007). This is important to note
considering these foods are often touted as healthy alternatives to potatoes (Brand-Miller, 1996).
Potatoes also contain a small amount protein (2.5g/ 150g serving) compared to other raw
vegetables. Furthermore, the protein it does contain has a high biological value (90-100) which
is comparable to that of whole egg (100) and soybean (84) (Camire, Kubow & Donnelly, 2009).
In addition, potatoes are high in several vitamins and minerals including vitamin C, potassium
and phosphorous (Camire, Kubow & Donnelly, 2009; Monro and Mishra, 2008). One 150g
serving of potato provides 126mg to 218mg of vitamin C (45% of the recommended dietary
allowance), 93mg of phosphorous and 610mg of potassium (Camire, Kubow & Donnelly, 2009;
Monro and Mishra, 2008). The amounts of potassium found in potato are comparable to that
found in banana (118g serving contains 442mg), a food that is often touted for its high potassium
content (Canadian Nutrient File, 2010; Monro and Mishra, 2008). Potatoes are also known to
contain several phytochemicals including anthocyanins and polyphenols, particularly
chlorogenic acid which is the most abundant polyphenol found in potatoes (Camire, Kubow &

7
Donnelly, 2009). An assessment of over 100 diverse potato varieties identified more than 60
different phytochemicals. (Science Daily, 2007).
2.2 Potato Starch Structure and Composition
Potato starch is made up of two α-glucans, amylopectin, a highly branched, high
molecular weight fraction and amylose, a smaller, un-branched linear fraction (Hasjim et al.,
2010). Amylopectin is made up of a series of glucose molecules bound by α1-4 glycosidic bonds
and α1-6 glycosidic bonds at its branch points (Englyst, Liu & Englyst, 2007). Amylose is a
linear fraction comprised of a series of glucose molecules bound by α1-4 glycosidic bonds
(Englyst, Liu & Englyst, 2007). In potato, amylopectin and amylose are contained in large
spherical structures referred to as starch granules (Singh, Kaur, McCarthy, 2008). In its native
form, potato starch exhibits a large granular size and a B-type crystalline structure that is highly
resistant to enzymatic hydrolysis by digestive enzymes, however with cooking, cooling and
processing this structure is altered irreversibly (Englyst & Cummings, 1986; Englyst, Liu &
Englyst, 2007; Lynch et al., 2007). Most potato starch is comprised of 70-80% amylopectin and
20-30% amylose, although the exact amounts vary depending on the potato variety (Hoover,
2001). The composition of potato varies with the cultivar, growing area and fertilization regime,
while the granular structure is determined by genetic factors that govern starch biosynthesis (Liu
et al., 2007; Guilbot & Mercier, 1985).
2.3 Effects of Cooking and Cooling on Starch Structure
Native potato starch is highly resistant to digestive enzymes because it is encapsulated
within starch granules (Ring et al., 1988; Gallant et al., 1992). In order to make the starch in
8
granules become available to α-amylase, they must undergo gelatinization (Englyst and
Cummings, 1987). In the presence of water and heat at temperatures between 60-70°C water
molecules form bonds with the hydroxyl groups of amylose and amylopectin causing potato
starch granules to take in water and swell resulting in irreversible structural changes, this process
is termed gelatinization (Singh, Kaur & McCarthy, 2008). The collapse in crystalline structure
within the starch granule causes irreversible changes to starch properties such as swelling power,
starch solubility and crystalline order (Hoover, 2001). Potato starch granules swell up to 100
times their original size which is significant when compared to other starches such as maize and
wheat which swell up to 30 times their original size (de Willigen, 1976). Gelatinization occurs
more readily in the amylopectin fraction due to its highly branched structure while amylose
restricts granule swelling and hence is resistant to gelatinization (Fredriksson et al., 1998).
Gelatinized starch is rapidly hydrolyzed by digestive enzymes which causes a rapid rise in
postprandial BG and insulin levels (Lehman & Robin, 2007). Conversely, when cooled, starch
granules re-associate forming an irregular structure that is more resistant to digestion; this
process is termed starch retrogradation (Englyst, Liu & Englyst, 2007). When cooled, amylose
re-associates rapidly to form a single or double helical structure that is highly resistant to α-
amylase (Liu et al., 2007; Zhang, Ao & Hamaker, 2008). In contrast, amylopectin is more
resistant to retrogradation due to its highly branched structure and upon cooling re-associates to
form bonds that are less resilient than those formed by amylose (Zhang, Ao & Hamaker, 2008).

9
2.4 Classification and Measurement of Dietary Carbohydrate
Both in vivo and in vitro methods have been employed to measure starch digestibility, a
review of two such methods, the in vivo GI test (Jenkins et al., 1981; FAO, 1998) and the in vitro
starch digestibility assay (Englyst et al. in 1992; Englyst et al., 1999) follows.
2.4.1 The Glycaemic Index
The GI is considered to be a more relevant and practical method of assessing starch
digestibility because it takes into account the physiological changes that occur with food
consumption (Wolever, 2006; Cummings & Englyst, 1995). The GI is a classification system
that allows CHO foods to be classified on a scale of 0-100 based on their effects on postprandial
BG levels (Wolever, 2006). The GI is defined as the incremental area under the BG response
curve (iAUC) elicited by a portion of a given test food which contains 50g of available CHO
(avCHO) (total CHO minus fibre) expressed as a fraction of the incremental area under the BG
response curve (iAUC) elicited by 50g of glucose (reference food) taken by the same subject
(Wolever et al. 1991). The GI classifies foods as either low (≤ 55), medium, (56-69) or high (≥
70) GI. The GI is an assessment of the quality of CHO present in a given food and is
independent of the amount consumed (Wolever, 2006). To correct for the day to day variation
that occurs within subjects, the reference food (glucose) is tested at least two, preferably three
times for each subject (Wolever et al., 1991, 2002). The GI adjusts for each individuals
glycaemic response to a given test food by using their individual response to the reference food
(Wolever, 2006). The GI value for a test food is taken as the mean GI value obtained from at
least 10 subjects, however more subjects are required if greater precision is desired (Brouns et
al., 2005)
10
Prior to 1998 the GI testing protocol was not clearly defined resulting in different
laboratories using their own version of an existing protocol. This often resulted in a wide
variation in GI values reported for seemingly identical foods (Atkinson et al., 2008; Lynch et al.,
2007). In order to prevent this, in 1998 a standard GI testing protocol was developed and
published by the Food and Agriculture Organization (FAO, 1998).
2.4.2 In vitro Starch Digestibility
In vitro methods have been used to estimate starch digestibility in vivo. Using these in
vitro methods starch can be classified into the nutritionally important starch fractions rapidly
digestible starch (RDS), slowly digestible starch (SDS) and resistant starch (RS) (Englyst et al.,
1992). RDS is identified as the amount of starch hydrolyzed in the first 20mins after incubation
with α-amylase, SDS as the amount hydrolyzed between 20-120mins; RS is calculated by
subtracting RDS and SDS from the total starch measured and represents the amount that is not
hydrolyzed at 120 min post incubation (Englyst et al., 1992). This analytical method allows us
to predict the likelihood of a given CHO food to be rapidly digested (RDS), slowly digested
(SDS) or escape digestion (RS) in the human small intestine (Englyst et al., 1992).
In 1999, Englyst et al. modified the existing in vitro digestibility assay for measuring
RDS, SDS and RS in order to measure rapidly available glucose (RAG) and slowly available
glucose (SAG). This modification is designed to reflect the rate at which glucose (from both
starch and sugar) becomes available for absorption in the human small intestine (Englyst et al.,
1999). RAG is the amount of free glucose measured after a given food is incubated with
digestive enzymes for 20 minutes (G20= RAG). SAG is the amount of free glucose measured

11
after 120 minutes of incubation minus that measured at 20 minutes (G120 - G20= SAG). RDS can
be determined by subtracting free sugar glucose (FSG) from RAG and multiplying by 0.9 (G20-
FSG x 0.9= RDS). SDS is determined by subtracting the free glucose measured after 120
minutes incubation from glucose measured after 20 minutes and multiplied by 0.9 [(G120 - G20) x
0.9= SDS]. Finally, RS is calculated by subtracting the glucose measured at G120 from the total
glucose measured and then multiplied by 0.9 (total glucose- G120= resistant starch) (Englyst et
al., 1999). Values for starch fractions are expressed as polysaccharides by using a conversion
factor of 0.9 (Englyst et al., 1999). The modification of the original in-vitro method has allowed
foods which are not predominantly made up of starch to be assessed as well.
In vitro starch digestibility assays have been shown to be a good predictor of the in vivo
glycaemic response of starchy foods (Englyst et al., 1999, Englyst et al., 2003). Foods which
contain high amounts of RDS are rapidly hydrolyzed by α-amylase in the intestinal lumen
causing an rapid influx of RAG which becomes readily available for absorption in the small
intestine; the result is a rapid rise in postprandial BG and insulin levels. Foods containing SDS
are metabolized at a slower rate allowing for a slower more sustained glucose release into the
circulation followed by a slower and lower insulin response (Wolever, 2006; Englyst et al.,
2003). RS is not digested and instead travels to the colon where it can be acted upon by colonic
bacteria to produce short chain fatty acids (SCFA) (Wolever, 2006). There is evidence to
support the efficacy of increasing SDS and RS content in the diet because of its ability to prevent
the exaggerated BG and insulin responses that occur with consumption of high GI foods
(Lehman & Robin, 2007). This very important fact has lead researchers to explore the potential

12
for modifying starch composition with the hope of increasing SDS and RS content in foods
commonly consumed like potatoes.
In vitro starch digestibility assays have been shown to be good predictor of the glycaemic
response of several different CHO foods (Garcia-Alonso and Goni, 2000; Kingston & Englyst,
1994; Mishra et al., 2008) In vitro methods have also been successful in measuring the
proportions of SDS and RS which is advantageous when looking to assess of the effect of
cooling on starch retrogradation (Monro & Mishra, 2008). A study examining the relationship
between the in vitro digestibility of 23 cereal products and their GI showed a close positive
relationship; they also determined that the difference in the relative amounts of RAG and SAG
could explain 68% of the variability in GI between foods (Englyst et al., 2003).
2.5 Potato Digestibility and the Glycaemic Index of Potatoes
It is well accepted that foods which are rapidly digested cause hyperglycaemia and
hyperinsulinaemia which are problematic because of their contribution to the development of the
metabolic syndrome, T2D and secondary conditions affecting the kidney‟s, heart and eyes
(Brownlee, 2001; Ricciardi et al., 2008). The CHO in potatoes is generally thought to be rapidly
digested and thus classified as high GI, however the assumption that all potatoes are high GI is
unwarranted, in fact the GI values reported in the literature show a wide variation from a very
low 23 to a very high 111 (Foster-Powell, 2002; Lynch et al., 2007). According to the 2002
international GI tables, only ~50% of potatoes tested are classified as high GI with 28%
classified as medium and 22% classified as low GI (Brand-Miller, 2002). These variations in
glycaemic responses and resultant GI values may be due to the several factors thought to affect

13
the GI of potatoes, including variety, method of preparation (baked, boiled, mashed etc.), state
consumed (freshly cooked; cooked, cooled and reheated; cooked, cooled), time of harvest (early
vs. mature) and the physicochemical properties of the starch (RDS, SDS, RS, phosphorous and
amylose content) within them (Svegmark et al., 2002; Lynch et al., 2007).
In a study conducted on three Australian potato varieties that were prepared in different
ways (boiled, baked, microwaved) all potato varieties had high GI values that ranged from 87 to
101 (Soh & Brand-Miller, 1999). They also determined there was no effect of variety, cooking
method or maturity on GI despite observing a 36% lower GI in canned new potatoes when
compared to boiled potatoes that presumably were harvested at maturity (Soh and Brand-Miller,
1999). In contrast, a group in the UK found that eight potato varieties had GI values ranging
from 56 to 94 (Henry et al., 2005). So there are definite differences between varieties and within
varieties as well. For example one group in the UK found that the “Nicola” variety had a mean
GI of 56 ± 7 (mean ± SEM) while a group in Finland determined that the same „Nicola‟ variety
had a GI of 104 ± 39 (mean ± SD) (Henry et al., 2005; Tahvonen et al., 2006). These
noteworthy differences in GI could be due to differences in methodology or experimental
inconsistencies, however, it is more likely that their different growing environments may have
resulted in different starch structure and composition, particularly the amylose: amylopectin
which has been thought to play a significant role in determining how potatoes respond to
cooking and cooling processes (Zhang, Ao & Hamaker, 2008).

14
Cooling cooked potatoes results in the formation of retrograded starch, a form of starch
that is resistant to digestion (Lynch et al., 2007). It is thought that increasing the amount of SDS
and RS could lead to a decrease in the glycaemic potency of a potato meal, which from a health
perspective may be seen as beneficial. Monro et al. (2008) looked at the effects of cooking and
cooling on RDS, SDS and RS content of the „Frisia‟ potato variety and found that cooled
potatoes reduced their RDS content by ~20% while increasing the proportion of SDS and RS.
Moreover, a preliminary study conducted in our laboratory found that boiled red potatoes
consumed cold had a lower GI than their freshly cooked counterparts (56 vs. 89) (Fernandes et
al., 2005). Although we did not measure the RDS, SDS or RS content we hypothesize that the
amount of RDS would decrease and the amount of SDS and RS increase with cooling. We
suggest that upon cooling, not only is RS formed but that there is also a conversion of RDS to
SDS. Similarly, another study conducted in our laboratory found that cooling significantly
reduced the GI in some, but not all potato varieties suggesting that the effect of cooling is
dependent on variety (Kinnear et al. 2011). However, what remains unclear is whether or not
this effect of cooling on GI can be seen in other potato varieties. Because people often cook,
cool and re-heat potatoes it is also important to examine whether or not this temperature cycling
affects the GI of potatoes. Previous studies have shown that when a boiled potato was allowed to
cool at 6°C and then re-heated at 70°C the amount of RS increased from 4.5% to 9.8% (P <0.05)
(Leeman et al., 2005). Our laboratory also investigated the effect of cooling and re-heating
cycles on the GI and found no significant differences between freshly cooked and re-heated
potatoes, however we did observe a trend towards re-heated potatoes having a lower GI when
compared to those that were freshly cooked (Kinnear et al., 2011). Thus, there seems to be
15
significant variability in the way different potato varieties respond to various methods of
preparation. Furthermore, when comparing potato varieties it is not only important to know the
structure of the starch composition but it is also important to know how they are prepared and
consumed as this no doubt has an impact on GI. Additional work is needed in order to
understand the reasons for the varied effects of cooking, cooling and re-heating on the GI of
potatoes.
Potato texture may also be used as potential indicator of a potatoes GI. For example,
Henry et al. (2005) found that potatoes exhibiting a waxy like texture often have a lower GI than
those that have a floury texture. They also observed a strong positive relationship between GI
and potato texture rating (scale from 1-9, 1 being most waxy and 9 being most floury) indicating
that potatoes with a floury texture tend to have a higher GI than those that are more firm such as
„new‟ potatoes (Henry et al., 2005).
2.6 Rapidly Digestible Starch, Slowly Digestible Starch and Resistant Starch-
Health Implications
The importance of characterizing the starch fractions RDS, SDS and RS are further
justified due to their potential effects, both negative and positive, on human health. As stated
previously, RDS is rapidly digested and absorbed into the small intestine resulting in a rapid rise
in BG into the circulation and a super compensatory insulin response. These exaggerated insulin
and glucose responses are worrisome because of their potential role in developing the metabolic
syndrome and T2D (Ells et al., 2005; McKeown et al., 2004). Thus, the importance of decreasing
the consumption of foods with significant amounts of RDS is warranted.

16
Conversely, SDS is slowly hydrolyzed by digestive enzymes and is absorbed slowly into
the small intestine allowing for a slow and steady release into the circulation (Lehman & Robin,
2007). The result is a sustained glucose release with a concomitant insulin response that is not
exaggerated like that seen with foods which contain high amounts of RDS. Foods which contain
high amounts of SDS or SAG are often classified as low or medium GI which is important
considering the data suggesting that a low-GI diet may help reduce the risk of developing T2D,
CVD and some cancers (Salmeron et al., 1997; Wong & Jenkins, 2007). A meta-analysis
examining the efficacy of a low-GI diet versus high GI diet on glycaemic control (glycated
haemoglobin A1c (HbA1c) and fructosamine) and found that a low-GI diet reduced HbA1c and
fructosamine by 7.4% (Brand-Miller, 2003). In contrast, Wolever et al. (2008) found that a low-
GI diet had no effect on HbA1c,but significantly reduced C-reactive protein by 30% (2.75mg/ vs.
1.95 mg/ L, P=0.0078) in individuals with T2D.
About 3-5% of starch found in cooked potatoes is RS (Wolever, 2006). RS represents the
portion of starch that cannot be hydrolyzed and thus escapes digestion and ends up in the colon
where it can be acted upon by colonic bacteria (Wolever, 2006). Once in the colon fermentation
by bacteria can occur leading to the formation of the short chain fatty acids (SCFA) acetate,
propionate and butyrate (Cummings & MacFarlene, 1991). SCFA are thought to play a role in
health both locally and systemically. Locally, butyrate acts as a primary fuel source for
colonocytes and aids in regulating cell proliferation and differentiation (Wong & Jenkins, 2007;
Wolever & Vogt, 2003). Acetate and propionate have also been shown to effect lipid
metabolism. Acetate plays a role in cholesterol synthesis while propionate inhibits cholesterol
synthesis. It has been suggested the decreasing the acetate: propionate may reduce blood lipid
17
content and reduce CVD risk (Wong et al., 2006). RS also acts as a bulking agent that helps to
reduce the transit time of faeces resulting in less exposure of coloncytes to potential toxins
(Wolever, 2006; Hill & Fernandez, 1986).
2.7 Physicochemical Properties that Affect Starch Digestibility
As described previously, the relative amounts of RDS, SDS and RS have an impact on
potato digestibility and GI. There is also evidence to suggest that the effects of cooling on GI
may be mediated through the physicochemical properties of the starch present in potatoes. The
following will look at some of the factors thought to play an important role in starch digestibility
and GI.
2.7.1 Amylose: amylopectin
The ratio between the two starch fractions, amylose and amylopectin plays an important
role in the way potatoes respond to the processes of cooking and cooling. As previously stated
potato starch composition is mainly determined by genetic factors, however it is widely accepted
that potato starch is predominantly amylopectin (70-80%) with the remaining 20-30% comprised
of amylose.(Hoover, 2001; Bertoft & Blennow, 2008) The relative composition is important
considering amylose is more resistant to gelatinization and upon cooling forms retrograde starch
more readily. Amylose is mainly responsible for the structural changes occurring within hours
of cooling while amylopectin is responsible for the long-term (several weeks) rheological and
structural changes.(Zhang et al., 2008) In studies examining BG responses to biscuits and rice
containing different amounts of amylose and amylopectin, those containing a greater proportion
of amylose produce a lower glycaemic response than those which contain a greater proportion of

18
amylepectin (Behall et al. 1988 and Goddard et al. 1984). In the case of potatoes, genetic
modification of starch to either increase or decrease the degree of starch branching results in
either high amylose (64%) potatoes or low amylose (1%) potatoes. These modified potatoes
were then cooked and the rate of starch digestion assessed using in vitro methods, the result was
a high RS content in the high amylose potatoes when compared to the low amylose potatoes and
a lower predicted GI, 94 vs. 68, for the low and high amylose potatoes, respectively (Leeman et
al., 2006). Taking this into account we can deduce that potatoes with a greater amylose content
will become less gelatinized upon cooking thus resulting in a lower postprandial BG response
and lower GI. Conversely, when cooled, potatoes containing a greater amount of amylose will
form more retrograde starch and at a faster rate when compared to those with greater amounts of
amylopectin. It is important to note that amylose plays an important role in short-term
retrogradation, occurring within hours of cooling which is more applicable to a real-life situation
since people tend to store potatoes in the refrigerator for a few days at most. On the other hand,
amylopectin is thought to play a role in the long-term (several weeks) retrogradation properties
of starch which may be more applicable to commercial potato production.
2.7.2 Fine Structure of Amylopectin
The structure of amylopectin, particularly its branching pattern and its chain length
distribution has been shown to play a role in starch digestibility.(Zhang et al., 2008) Unlike its
starch counterpart amylose, amylopectin, due to its highly branched structure requires a lower
gelatinization temperature which from a starch digestibility stand-point is important. Zhang et
al. (2008) examined starch samples with various degrees of branching patterns (high amount of
short chains and high amount of long chains) and found whether starch samples had high

19
amounts of long or short chains did not matter, both were associated with a having a greater
proportion of RDS.
2.7.3 Phosphorous Content
Potatoes contain appreciable amounts of phosphorous which may be advantageous for the
GI of potatoes. Phosphorous is present in potato starch as monoesters and phospholipids and is
thought to significantly affect the functional properties of starch (Singh, Kaur & McCarthy,
2008). For example, phospholipids tend to form complexes with amylose and amylopectin
which when heated in water limits its ability to gelatinize. If so, potatoes which contain high
amounts of phosphorous would result in a decrease in gelatinized starch upon cooking (and a
lower GI). Phosphorous content has been shown to be positively associated with retrogradation
suggesting that the more phosphorous a potato contains the greater amount of retrograde starch
that can be formed upon cooling (Liu et al., 2007). The result is a lower glycaemic response and
lower GI.
2.7.4 Maturity
Potatoes which are harvested early (≤90 days) in the season are referred to as “new”
potatoes and tend to have a lower GI than those harvested at maturity (≥120 days). Mature
potatoes are thought to have a higher GI due to a greater degree of amylopectin branching they
contain which, as discussed previously, increases their digestibility (Soh & Brand-Miller, 1999;
Zhang et al., 2008). Indeed one study found that new potatoes had a GI that was 36% lower than
mature potatoes (Soh & Brand-Miller, 1999). The same study also observed a positive
relationship between GI and the average potato tuber size (r= 0.83, P <0.05), an indicator of
maturity (Soh & Brand-Miller, 1999).
20
2.8 SUMMARY, OBJECTIVES AND HYPOTHESES
2.8.1 Summary
Generally speaking potatoes are often thought of as a high GI food. Both, in-vitro and in-
vivo studies have shown that the starch in freshly cooked potatoes is rapidly digested and
absorbed in the small intestine causing a rapid rise in postprandial blood glucose levels. A diet
that is high in foods which are classified as high GI has been associated with an increased risk of
developing chronic diseases such as diabetes, cardiovascular disease and even some cancers.
Data collected by the AAFC (2007) shows that potato consumption has significantly declined in
Canada and this may be due the high GI classification that they have received. There are several
factors which are known to affect starch digestibility that are often not accounted for in research
studies, these include: method of preparation, variety, harvest year and the physicochemical
properties of their starch (i.e. amylopectin:amylose, phosphorous content and RDS:SDS:RS). A
network of scientists and plant breeders (Bio-Potato Network) have been working in concert to
develop low GI potato cultivars by modifying starch composition with the goal of increasing
slowly digestible starch, fibre content as well as some other properties thought to contribute to a
low GI potato. A previous study conducted in our laboratory using novel potato varieties
provided to us by the Bio-Potato network found that the effect of cooking a cooling on GI is
dependent on potato variety (Kinnear et al., 2011). However, only four potato varieties were
tested and thus we were unsure if this effect could be seen in other novel potato varieties. Also,
since the physicochemical properties of starch are also thought to play a significant role in starch
digestibility we were interested in examining some of these properties in relation to GI.

21
2.8.2 Research Objectives
Study 1
- To screen additional novel potato varieties and determine their GI
- To confirm our previous findings that the effect of cooling on the GI is dependent on variety
Study 2
- Re-test the GI of four varieties of interest from 2009 in 2010 and examine the role of the
physicochemical properties (RDS, SDS, RS, amylose and phosphorous content) of their starch
in determining GI
- Determine the mechanism for the low glycaemic responses observed for low GI potatoes
2.8.3 Hypotheses
Study 1
- The effect of cooling is dependent on variety
- Cold potatoes elicit a lower glycaemic response and have a lower GI than freshly
cooked potatoes
Study 2
- The GI of each potato variety does not significantly differ between harvest years- 2009 vs.
2010
- The low GR produced by low GI potatoes is not due to a concomitant increase in postprandial
insulin
- There is a positive relationship between GI and RDS and negative relationship between GI and
SDS, RS, amylose and phosphorous content

22
CHAPTER 3
STUDY 1- THE EFFECT OF COOLING ON THE GLYCAEMIC
INDEX OF NOVEL POTATO VARIETIES

23
3.1 Introduction
The notion that all potatoes have an inherently high GI is unwarranted considering the
wide variation of potato GI values reported in the literature. Generally speaking, both in vitro
and in vivo studies conducted using freshly cooked potatoes have ascertained that they are
rapidly hydrolyzed by digestive enzymes. In vivo, freshly cooked potatoes result in high rises in
BG and insulin levels that are greater in magnitude and more rapid in rise when compared to
cold potatoes. This has significant health implications considering CHO foods that are rapidly
digested (high GI foods) are thought to play a role in developing T2D and CVD. However, not
all potatoes are created equal. There are several factors that are known to affect the GI of potato,
these include, variety, method of preparation (hot vs. cold), year of harvest, time of harvest (new
vs. mature) and the physicochemical properties of starch (amylose content, phosphorous content,
rate of starch digestion, etc.).
The following study is part of a collaborative effort between starch chemists, plant
breeders and nutritional scientists whose goal was to develop low-GI potatoes by modifying
starch composition through cross-breeding existing varieties to develop potatoes with high
amylose content, highly branched amylopectin and more fibre than commercially available
potatoes.
Previously, our laboratory conducted a pilot study to examine the effect of cooking,
cooling and re-heating on the GI of 4 novel potato varieties with varying starch profiles.
(Kinnear et al., 2011) In this study we observed that cooling significantly reduced the GI in
some, but not all potato varieties. Two of four potato varieties tested were classified as medium
24
to high GI when consumed freshly cooked, upon cooling all potatoes were reduced to a low GI
classification (Kinnear et al., 2011).
The objective of study 1 was to screen novel potato varieties, determine their GI and to
confirm our previous findings that the effect of cooling on the GI is dependent on variety. We
conducted these tests using novel potato varieties which were harvested at maturity in October
2009. The varieties tested were not commercially available at the time of the study. In keeping
with what was observed in previous studies conducted in our laboratory, we hypothesized that
the effect of cooling would be dependent on variety. We also hypothesized that cold potatoes
would elicit a lower glycaemic response and would have a lower GI than freshly cooked
potatoes.
25
3.2 STUDY DESIGN AND METHODS
3.2.1 Subjects
Two groups of ten healthy subjects participated in the following study. Group A
consisted of 7 males and 3 females, with a mean age of 24.2 ± 1.0 (range, 20-29), a mean weight
of 74.4 ± 4.5 (60.5- 96.7 kg), and a mean BMI= 25.5 ± 7.7 (21.6-29.4). Group B consisted of 7
males and 3 females with a mean age of 30 ± 2.7y (22-45y), a mean weight of 83.8 ± 7.7 kg
(51.5-131.9) and a mean BMI= 27.1 ± 2.4 (17.9-44.3) (Table 3.1). Two subjects, one female
from group A and one male from group B were unable to continue with the study after 6 visits;
they were replaced by two new, same sex subjects.
Subjects were screened to ensure they met the inclusion criteria for participation in the
study. Subjects were excluded from the study if they had diabetes mellitus or glucose
intolerance or any condition known to adversely affect nutrient absorption, metabolism,
excretion or gastric motility. The study was approved by the University of Toronto Research
Ethics Board and informed consent was obtained from all subjects prior to taking part in the
study.

26
Table 3.1 Subject Characteristics
Variable Group A
(mean ± SEM)
Group A
range
Group B
(mean ± SEM)
Group B
range
n (male: female) 7:3 - 7:3 -
Age (y) 24.2 ± 3.2 21-29 30 ± 8.6 22-45
Weight (kg) 74.5 ± 15.7 55.5-96.7 83.8 ± 24.3 51.5-131.9
Height (m) 1.7 ± 0.1 1.5-1.85 1.8 ± 0.1 1.5-1.9
BMI (kg/ m2) 25.5 ± 3.5 20.1-30.2 27.1 ± 7.5 17.9-44.3
27
3.2.2 Test meals
Eight novel potato varieties with varying starch profiles were tested. The potato varieties
were not commercially available at the time of the study and thus will be identified as potato
varieties 1, 2, 3, 4, 5, 6, 7 and 8. All potato varieties were grown in Lethbridge, Alberta and
were harvested at maturity. Prior to being shipped potatoes were sprout inhibited with
Chlorpropham to prevent premature spoiling. Upon arriving in Guelph, Ontario potatoes were
stored in a temperature controlled chamber at 11°C until required. While at the testing facility in
Toronto, potatoes were stored in a dark cupboard at ambient temperature.
Proximate analysis was performed by Agri-Food Laboratories (Guelph, ON) to determine
the following macronutrient content: protein: AOAC 990.03, fat: AOAC 920.39 and
carbohydrate: by difference. Analysis for total dietary fibre (AOAC 993.43 and 985.29) was
performed by Maxxam Analytics (Mississauga, ON) and the amount of potato (in grams)
required to feed subjects 50g of avCHO (defined as total carbohydrate minus fibre) was
calculated. Energy and macronutrient composition content of potato test meals can be found in
table 3.2.
The study was a randomized block design. Group A and B each tested four novel potato
varieties with varying starch profiles and fibre content. In addition to the potato meals, subjects
also tested white bread (reference food) and potato chips (positive control). The amount of
potato consumed varied depending on the variety and ranged from 227-365g per test meal; each
meal contained 50g of avCHO. Prior to cooking, potatoes were washed thoroughly, cut into 1”
cubes (with skin) and the appropriate amount weighed out individually. Potatoes were served to

28
subjects in two ways; boiled for 13mins (1tsp table salt dissolved in 750mL water) and
consumed immediately (freshly cooked) or prepared as above, cooled at room temperature
(24°C) for 30mins, stored at 4°C for 24-72h and consumed cold. Subjects were allowed to add
table salt to their test meals if they desired. White bread was used as the reference food for GI
calculation and was tested three times throughout the study period (beginning, half-way point
and completion). White bread was made onsite with an automatic bread maker as previously
described (Wolever et al., 2003). White bread was used instead of glucose because subjects tend
to prefer it over a glucose drink (Wolever, 2006). A baked potato chip meal containing 50g of
avCHO (determined using the nutrition label on the package) was used as a positive control to
validate between- group comparisons.
29
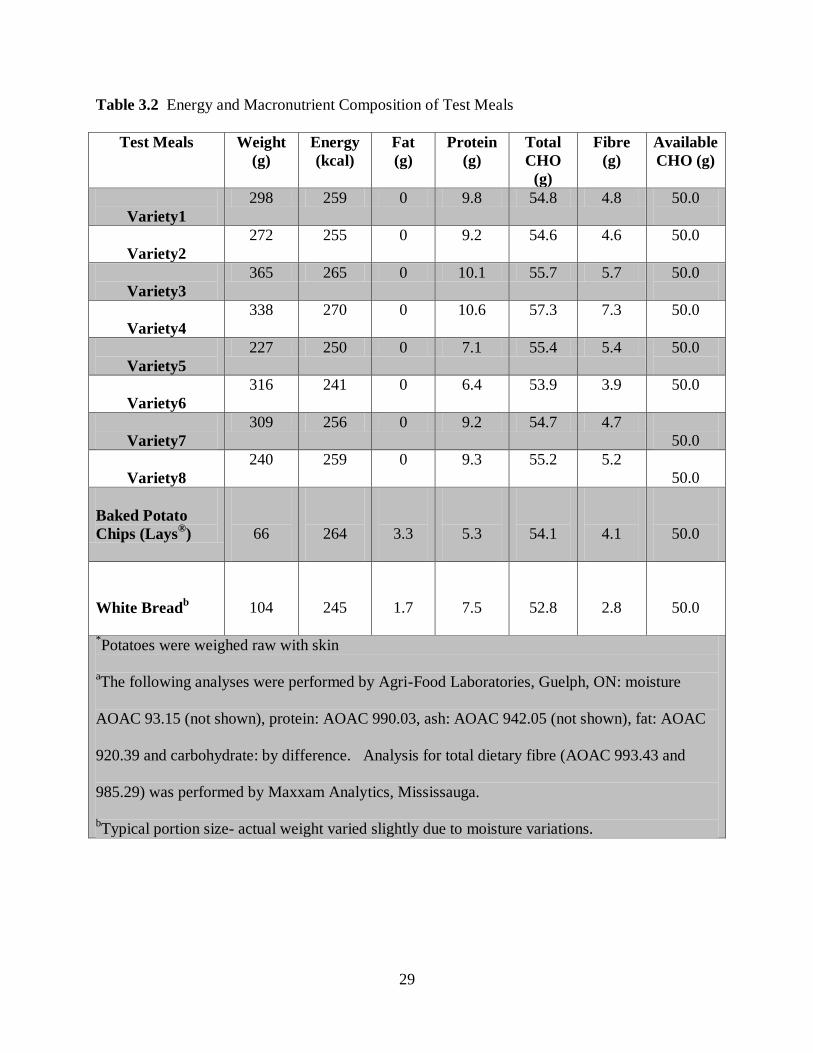
Table 3.2 Energy and Macronutrient Composition of Test Meals
Test Meals Weight
(g)
Energy
(kcal)
Fat
(g)
Protein
(g)
Total
CHO
(g)
Fibre
(g)
Available
CHO (g)
Variety1
298 259 0 9.8 54.8 4.8 50.0
Variety2
272 255 0 9.2 54.6 4.6 50.0
Variety3
365 265 0 10.1 55.7 5.7 50.0
Variety4
338 270 0 10.6 57.3 7.3 50.0
Variety5
227 250 0 7.1 55.4 5.4 50.0
Variety6
316 241 0 6.4 53.9 3.9 50.0
Variety7
309 256 0 9.2 54.7 4.7
50.0
Variety8
240 259 0 9.3 55.2 5.2
50.0
Baked Potato
Chips (Lays®)
66
264
3.3
5.3
54.1
4.1
50.0
White Breadb
104
245
1.7
7.5
52.8
2.8
50.0
*Potatoes were weighed raw with skin
aThe following analyses were performed by Agri-Food Laboratories, Guelph, ON: moisture
AOAC 93.15 (not shown), protein: AOAC 990.03, ash: AOAC 942.05 (not shown), fat: AOAC
920.39 and carbohydrate: by difference. Analysis for total dietary fibre (AOAC 993.43 and
985.29) was performed by Maxxam Analytics, Mississauga.
bTypical portion size- actual weight varied slightly due to moisture variations.

30
3.2.3 Protocol
The study was conducted at Glycaemic Index Laboratories in Toronto, Ontario from
January 2010 through March 2010. Subjects were asked to visit the laboratory on 12 separate
occasions; each test took approximately 2hrs to complete. Prior to their visit, subjects were
asked to refrain from eating, drinking and engaging in strenuous exercise for10-14hrs. Each test
was separated by a 48h washout period. Subjects arrived at the laboratory between 8-10am on
the morning of the test. Prior to consuming their test meal, subjects were weighed and two
fasting capillary blood samples were collected five min apart (-5 min and 0 min) via finger prick
using an ascensia microlet lancet device (Bayer Diagnostics, New York). Subjects then
consumed their test meal plus a beverage of their choice (250ml of water or 220mL of tea or
coffee with or without 30mL of 2% milk and low-calorie sweetener, if desired) type and volume
of beverage remained consistent throughout the study. All subjects consumed their test meal
within 20 min. Six additional blood samples were drawn at 15, 30, 45, 60, 90, and 120mins after
starting the meal. Capillary blood samples were placed into tubes containing fluoro-oxalate (to
prevent clotting), stored at -20°C and analyzed within 72hr using a glucose-oxidase automatic
analyzer (Yellow Spring Instruments, 2300 Stat). Fasting blood glucose (FBG) was taken as the
mean of two fasting blood samples (-5 min, 0 min).
3.2.4 Calculation of Glycaemic Index
The incremental areas under the blood glucose response curves (AUC) were calculated
geometrically for each test meal using the trapezoidal rule ignoring the area below fasting (FAO,
1998). To calculate the GI, the AUC for each test food (potato and potato chip) was expressed as
a fraction of the mean AUC for three white bread tests taken by the same subject. The resultant
values were then multiplied by 0.71 in order to represent them on the glucose scale (GI of
31
glucose= 100). Both glucose and white bread have been used as the reference food for GI
determination. However, because it can be confusing to have two sets of GI values it has been
suggested that all GI values be converted to the glucose scale (glucose= 100).(Wolever, 2006)
The glycaemic response of white bread is 71% of that elicited by glucose and thus all values
obtained using white bread as the reference food must be multiplied by 0.71 to express them on a
glucose scale. (Wolever, 2003) All values in the present study are represented on the glucose
scale. The GI for each test food is determined by taking the mean GI value obtained from 10
individual subjects.
3.2.5 Statistical Analysis
Results are expressed as means ± SEM. In order to pool data from both groups, a
positive control test meal of potato chips was conducted and a two-tailed, un-paired t-test was
used to assess the probability of significant differences.
Statistical analysis was conducted on blood glucose profiles for each variety (V1-V8) and
treatment (fresh cooked, cold). To examine the differences between treatments, data were
analyzed using a three-factor analysis of variance (ANOVA) to examine the effect of time,
variety, treatment and time x variety x treatment interaction. For AUC and GI values two-factor
ANOVA was conducted to examine the effect of variety, treatment and variety x treatment
interaction. After demonstration of significant heterogeneity, Tukey‟s post-hoc test was used to
determine significant differences between individual mean blood glucose concentrations at each
time point, mean AUC and GI. In addition to examine the differences between the GI of each
potato variety to that of white bread we conducted a one-way ANOVA.

32
Differences were considered significant if a two-tailed P ≤ 0.05. Analysis was done using
SPSS Statistical package 18.0.

33
3.3. RESULTS
3.3.1 Blood Glucose Responses
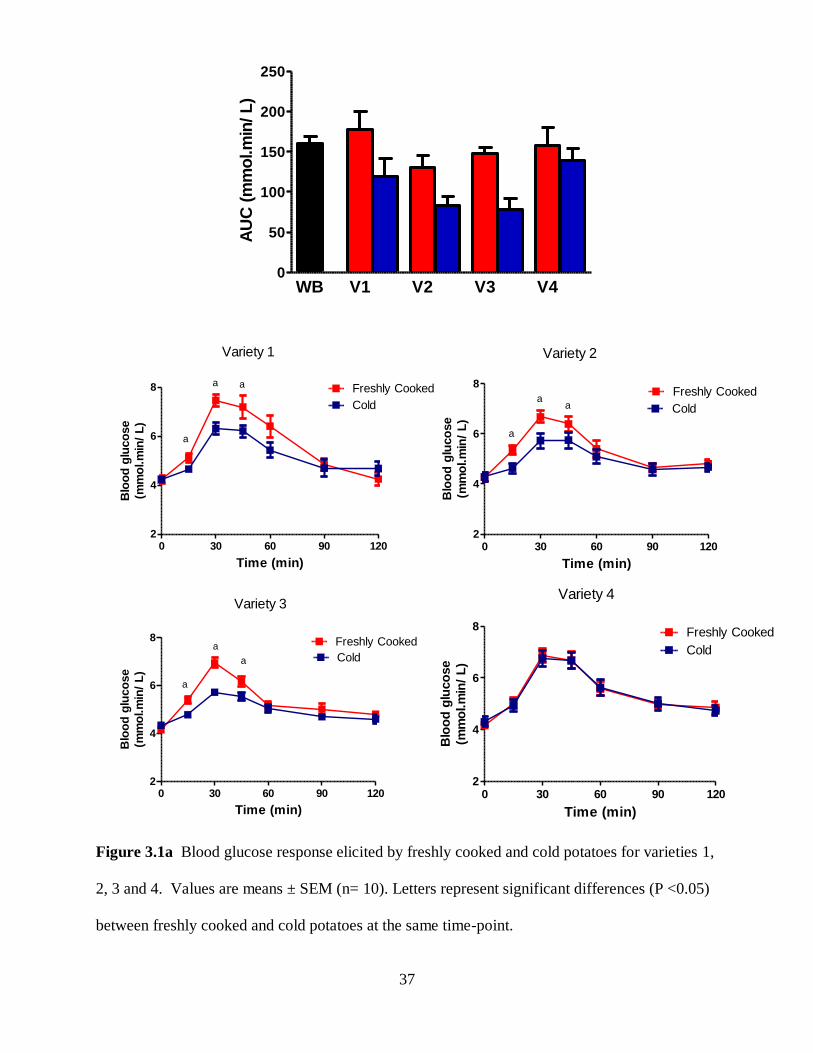
Blood glucose profiles for potato varieties 1, 2, 3 and 4 are shown in Figure 3.1a and
varieties 5, 6, 7 and 8 shown in Figure 3.1b. There was a main effect of variety for the mean
blood glucose AUC (F=2.782, P= 0.006) and a main effect of cooling (F= 30.471, P <0.001)
with freshly cooked potatoes eliciting a significantly greater AUC than cold potatoes (147.4 ±
14.9 vs. 105.9 ± 13.7) (Table 3.3). There was no variety x treatment interaction for the AUC of
freshly cooked and cold potatoes (F=0.656, P= 0.709). Varieties 1, 2 and 3 freshly cooked
elicited a greater blood glucose response at 15, 30 and 45 min when compared to cold. There
were no significant differences in AUC between freshly cooked and cold potatoes for varieties 4
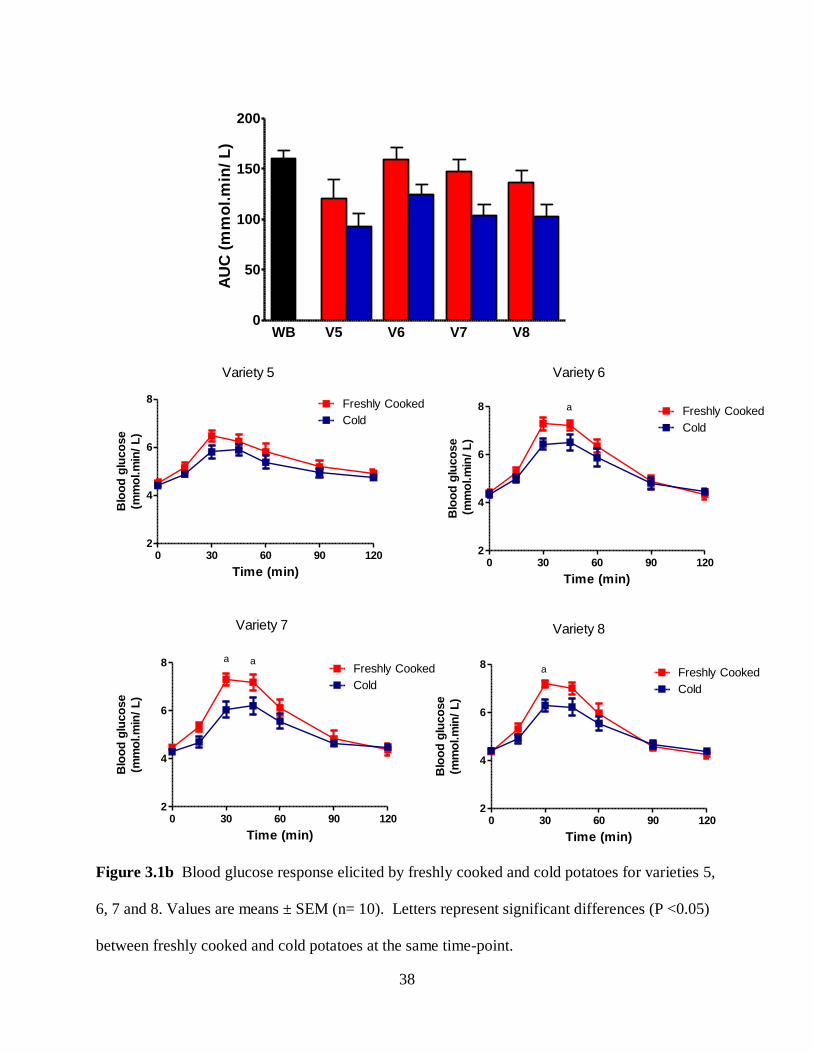
and 5. Potato variety 6 freshly cooked elicited a greater blood glucose response at 45 min.
Variety 7 freshly cooked showed a greater response at 30 and 45 min while variety 8 had a
greater blood glucose response at 30 min when compared to cold potatoes (P <0.05).
3.3.2 Glycaemic Index
Figure 3.2 shows that the GI for baked potato chips was not significantly different
between group A and group B, 78.7 ± 4.9 and 80.7 ± 7.4, respectively (F= 3.277, P= 0.551).
This allowed us to pool the data from group A and B to compare the GI for different potato
varieties. Table 2.4 shows the GI values for potato varieties 1-8 compared to white bread.
ANOVA showed the GI of V2 (35.5 ± 5) and V3 (34.0 ± 6) served cold were significantly
different (P<0.001) from the GI of WB (GI=71). Only 3 of the potato test meals (V1, V6 and
V8) were classified as high GI (≥70) when consumed freshly cooked. Four test meals were
classified as medium GI (55-69) when freshly cooked (V3-V5, V8) and two when consumed
cold (V4, V6). Six of the potato test meals (V1-V3, V5, V7, V8) were classified as low

34
GI (≤ 55) when consumed cold. Two-way ANOVA showed a main effect of variety (F=4.84, p
< 0.001) a main effect of treatment (F=36.33, P <0.001) but no significant variety x treatment
interaction (F= 1.33, P=0.235). Tukey‟s test showed that variety 3 served cold had a
significantly lower GI than freshly cooked (65 ± 6 vs. 34 ± 6; p<0.001). Although no variety x
treatment interaction was observed in our analysis we saw a wide variation in GI values with
cooling. For example, we observed a 50% reduction in GI for V3 while V4 showed no
difference, in fact, it increased slightly with cooling. With this in mind we were convinced that
the lack of interaction was not justified so we conducted a separate analysis by looking at the
percent reduction in GI upon cooling and conducted a one-way ANOVA. We showed that there
was a significant difference between varieties (F= 2.427, P= 0.027) with the reduction in GI for
V3 and V7 significantly different than that observed for V4.

35
Table 3.3 Blood glucose AUC values for potato varieties 1, 2, 3, 4, 5, 6, 7 and 8 served to
subjects (n= 10) freshly cooked and cold
AUC (mmol x min/ L)
Treatment
Mean For Variety
Fresh Cooked
Cold
Variety 1
177.9 ± 22.0
118.7 ± 22.0
148.3 ± 22.0
Variety 2
130.2 ± 14.6a
83.2 ± 11.2b
106.7 ± 12.9
Variety 3
148.0 ± 7.5a
78.0 ± 13.2b
113.0 ± 10.35
Variety 4
158.1 ± 22.5
139.2 ± 15.2
148.7 ± 18.9
Variety 5
120.9 ± 18.4
92.6 ± 13.2
106.8 ± 15.8
Variety 6
159.5 ± 12.1a
124.3 ± 10.0b
141.9 ± 11.1
Variety 7
147.9 ± 10.9a
103.5 ± 11.2b
125.7 ± 11.1
Variety 8
136.9 ± 11.3
108.1 ± 13.0
122.5 ± 12.2
Mean for Treatment
147.4 ± 14.9a
105.9 ± 13.7b
Values mare means ± SEM a b
AUC values not sharing the same letter subscripts differ significantly (P<0.05) from each
other within each row.

36
Table 3.4 GI values for potato varieties 1, 2, 3, 4, 5, 6, 7 and 8 served to subjects (n= 10) freshly
cooked and cold
Treatment
Mean for
Variety
Fresh Cooked
Cold
Variety 1
72 ± 4
53 ± 6
63 ± 5
Variety 2
52 ± 4
35 ± 5x
44 ± 5
Variety 3
65 ± 6a
34 ± 6bx
50 ± 6
Variety 4
59 ± 6
61 ± 5
60 ± 6
Variety 5
57 ± 8
45 ± 6
51 ± 7
Variety 6
81 ± 9
62 ± 6
72 ± 8
Variety 7
74 ± 6
46 ± 6
60 ± 6
Variety 8
69 ± 5
53 ± 5
61 ± 5
Mean for Treatment
66 ± 6a
49 ± 6b
Values mare means ± SEM
a bGI values not sharing the same letter subscripts differ significantly (P<0.05) from each other
within each row.
x GI values differ significantly from the GI of white bread
37
0 30 60 90 1202
4
6
8Freshly Cooked
Cold
Variety 2
a
aa
Time (min)
Blo
od
glu
co
se
(mm
ol.m
in/
L)
0 30 60 90 1202
4
6
8 Freshly Cooked
Cold
Variety 3
a
a
a
Time (min)
Blo
od
glu
co
se
(mm
ol.m
in/
L)
0 30 60 90 1202
4
6
8Freshly Cooked
Cold
Variety 4
Time (min)
Blo
od
glu
co
se
(mm
ol.m
in/
L)
0 30 60 90 1202
4
6
8 Freshly Cooked
Cold
Variety 1
a
a a
Time (min)
Blo
od
glu
co
se
(mm
ol.m
in/
L)
Figure 3.1a Blood glucose response elicited by freshly cooked and cold potatoes for varieties 1,
2, 3 and 4. Values are means ± SEM (n= 10). Letters represent significant differences (P <0.05)
between freshly cooked and cold potatoes at the same time-point.
WB V1 V2 V3 V40
50
100
150
200
250
AU
C (
mm
ol.m
in/ L
)
38
WB V5 V6 V7 V80
50
100
150
200
AU
C (
mm
ol.
min
/ L
)
0 30 60 90 1202
4
6
8 Freshly Cooked
Cold
Variety 5
Time (min)
Blo
od
glu
co
se
(mm
ol.m
in/
L)
0 30 60 90 1202
4
6
8 Freshly Cooked
Cold
Variety 6
a
Time (min)
Blo
od
glu
co
se
(m
mo
l.m
in/
L)
0 30 60 90 1202
4
6
8Freshly Cooked
Cold
Variety 7
a a
Time (min)
Blo
od
glu
co
se
(mm
ol.m
in/
L)
0 30 60 90 1202
4
6
8Freshly Cooked
Cold
Variety 8
a
Time (min)
Blo
od
glu
co
se
(mm
ol.m
in/
L)
Figure 3.1b Blood glucose response elicited by freshly cooked and cold potatoes for varieties 5,
6, 7 and 8. Values are means ± SEM (n= 10). Letters represent significant differences (P <0.05)
between freshly cooked and cold potatoes at the same time-point.

39
A B0
20
40
60
80
100
Gly
caem
ic In
dex
Figure 3.2 GI of baked potato chips for group A (n=10) and group B (n=10).
Bars represent means ± SEM. There is no significant difference between the GI
of baked potato chips tested in group A compared to group B. (P≥ 0.05)

40
V1 V2 V3 V4 V5 V6 V7 V80
20
40
60
80
100 Fresh CookedCold
a
b
Gly
caem
ic In
dex
Figure 3.3 GI of potato varieties 1, 2, 3, 4, 5, 6, 7 and 8 served to subjects (n= 10)
in two ways, freshly cooked and cold. Bars represent means ± SEM. A significant
effect of treatment and variety but no variety x treatment interaction was observed.
Bars with different letters within each variety group (freshly cooked and cold) are
significantly different (P <0.05).

41
V1 V2 V3 V4 V5 V6 V7 V8-40
-30
-20
-10
0
10
a
b
a
Red
ucti
on
in
Gly
caem
ic In
dex (
%)
Figure 3.4 Percent reduction in GI upon cooling for potato varieties 1, 2, 3, 4, 5, 6, 7 and
8. Each bar represents the percent reduction in GI after cooling a freshly cooked potato.
Bars with different letters are significantly different from each other (P <0.05).

42
3.4 DISCUSSION
It has been suggested that people reduce their intake of potatoes because they have a high
GI, however there is no definitive evidence to support this notion. In fact, according to the 2002
international GI tables, only ~50% of potatoes tested are classified as high GI with 28%
classified as medium and 22% classified as low GI (Brand-Miller, 2002). There seems to be a
wide variation in the reported GI values for different potato varieties, from a very low 23 to a
high 111 (Soh & Brand-Miller, 1999; Foster-Powell, Holt & Brand-Miller, 2002). The
differences seen between varieties and different cooking methods (mashed, baked, fried) are
thought to be mainly due to the properties of the starch within each potato variety as this affects
the way they respond to cooking and cooling processes. In addition, starch properties are known
to be affected by several factors including their growing environment (soil nutrient composition,
sunlight, rainfall), year of harvest and time of harvest (new vs. mature harvest).
In the present study we observed that potatoes which were cooked (boiled) and then
cooled for at least 24h at 4°C tended to elicit a lower glycaemic response (AUC) than those that
were consumed freshly cooked. Not unlike some previous studies conducted by us (Fernandes et
al., 2005; Kinnear et al., 2011) and others (Henry et al., 2005) in the present study we found that
cooling reduced the GI of freshly cooked potatoes by 10-50% in 7 of the 8 novel potato varieties
tested. This is important for individuals who are looking to reduce their dietary GI, particularly
people with diabetes who need to tightly control their blood glucose levels. This reduction in GI
may be due to an increase in the amount of RS that is formed upon cooling, however this is
unlikely. In a fully gelatinized potato there is about 7% RS; this increases to around 13% with
cooling so the minimal 6% increase RS content with cooling cannot explain these rather

43
significant reductions in GI. Instead the more likely and probable explanation for these
reductions in GI is that the starch in these potatoes converts from RDS (in gelatinized starch) to
SDS when cooled. Thus, the starch available for digestion is slowly hydrolyzed and released
slowly into the circulation resulting in a lower AUC and GI.
In this study the potato varieties we tested generally had a lower GI than those readily
available on the market. Only 3 of the potato test meals (V1, V6 and V8) were classified as high
GI (≥70) when consumed freshly cooked, although they were only moderately high with the
highest GI being 81. Four test meals were classified as medium GI (55-69) when freshly cooked
(V3-V5, V8) and two when consumed cold (V4, V6). Six of the potato test meals (V1-V3, V5,
V7, V8) were classified as low GI (≤ 55) when consumed cold. As stated previously, these
potato varieties were cross-bred specifically to increase the content of the starch properties
thought to be associated with a low GI. Although we did not measure the physicochemical
properties of these particular potato varieties we believe that the cross-breeding program was
successful considering 5 of the 8 varieties were classified as low to medium GI and only 3 were
classified as high GI when freshly cooked, this is important considering people often consume
their potatoes freshly cooked.

44
3.5 CONCLUSION
The above data supports the hypothesis that not all potatoes are high GI and that when
prepared in certain ways (ie. cold) can produce a lower glycaemic response and as a result will
have a lower GI. We also demonstrated that cooling produce a wide range of effects as we
observed an increase in GI with cooling in 1 variety while reducing the GI by 10-50% in 7 other
varieties. We were not able to show that the effect of cooling is dependent on variety, however
the wide range of effects observed (0-50% reduction in GI upon cooling) in different varieties
suggests otherwise.

45
CHAPTER 4
STUDY 2- THE ROLE OF STARCH PHYSICOCHEMICAL
PROPERTIES IN DETERMINING THE GLYCAEMIC INDEX
OF POTATO

46
4.1 INTRODUCTION
In study 1 we ascertained that the GI of potato varies between varieties and that cooling
reduces the GI in some potato varieties and may do so to different extents. However, it is
unknown why different potatoes respond to cooking and cooling processes differently. There are
several factors thought to affect the GI of potatoes as stated previously, of particular interest are
the physicochemical properties of the starch (RDS, SDS, RS, phosphorous and amylose content)
found within them (Svegmark et al., 2002; Lynch et al., 2007). Research suggests that utilizing
in vitro methodology to assess starch composition and digestibility may be a more practical and
economical way of assessing the potential glycaemic impact of CHO foods. There is some
debate as to whether or not the in-vitro measurements are reflective of how they would behave
physiologically, however several studies have demonstrated this through correlation with the in-
vivo glycaemic response (Englyst et al.,1999;Englyst et al., 2003). Studies examining the
relationship between the proportion of RAG in cereals and GI show that foods which contain a
greater proportion of RAG tend to have a higher GI than foods which contain greater amounts of
SAG (Englyst et al., 2003). Moreover, other starch properties such as amylose and phosphorous
have been shown to affect starch digestibility and ultimately GI. As stated previously amylose is
resistant to gelatinization and with cooling is more readily retrograded. In the case of
phosphorous, it is known to form complexes with starch and resist its ability to gelatinize.
The objective of study 2 is to examine the relationship between the physicochemical
properties of starch and the GI of potato. To assess these relationships, we re-tested four potato
varieties previously tested in study 1 (V2, V3, V4 and V5; newly harvested). These potato
varieties were chosen for a variety of reasons including; cooling reduced their GI significantly,
47
no significant change was observed with cooling or were classified as low-GI. We were also
interested in examining the mechanism by which cold potatoes produce a lower GI than freshly
cooked potatoes. To examine the potential mechanism responsible for the lower glycaemic
response and GI elicited by cold potatoes we measured serum insulin. To examine the role of
starch properties in determining GI we assessed some physicochemical properties thought to play
a role in starch digestibility.

48
4.2 STUDY DESIGN AND METHODS- GLYCAEMIC INDEX TESTING
4.2.1 Subjects
One group of ten healthy subjects (8 males, 2 females) with a mean age of 39.3 ± 4.2, a
mean weight of 80. 9 ± 5.2 (60.9-111.4), a mean BMI= 26.4 ± 0.8 (22.3-30.9) participated in the
following study (Table 4.1). Two subjects were unable to continue with the study after 3 visits
and were replaced by two new, same sex subjects. All subjects met the inclusion criteria as
described in section 3.2.1. The study protocol was approved by the University of Toronto
Research Ethics Board and informed consent was obtained from all subjects prior to taking part
in the study.
4.2.2 Test Meals
Four novel potato varieties tested in study 1 (V2, V3, V4 and V5) were re-tested during
the present study. These potatoes were grown in a different location (Guelph, Ontario) than
those from study 1 (Lethbridge, Alberta) and were harvested at maturity in October
2010. All varieties were stored as described previously in section 3.2.2. To determine the
amount of potato required to feed subjects 50g of available carbohydrate proximate analysis was
conducted as previously described in section 3.2.2. In addition to potato meals subjects also
tested white bread three times (reference food) and potato chips. The amount of potato
consumed varied depending on the variety and ranged from 236-309g per test meal; each meal
contained 50g of avCHO (table 4.2).
49
4.2.3 Protocol
The study was conducted at Glycaemic Index Laboratories in Toronto, Ontario from
October 2010 through December 2010. The protocol for study 2 was identical to that described
in section 3.2.3 for study 1. However, for the present study six additional blood samples were
drawn at each time point (0-120min) in order to measure serum insulin (pmol/ L). Blood glucose
was measured as described in section 3.2.3. For insulin, capillary blood samples were placed
into tubes and allowed to clot for 20 minutes at ambient temperature. Samples were then spun at
3300rpm for 15mins, serum was removed and samples stored at -70°C pending analysis. Serum
insulin was measured using an ALPCO insulin EIA kit (Cat.# 80-INSHU-E10; Salem, NH).

50
4.2.4 Calculation of Glycaemic Index
The GI for all test meals was calculated as describe in section 3.2.4.
4.2.5 Statistical Analysis
Results are expressed as means ± SEM. Statistical analysis was conducted on blood
glucose and insulin profiles for each variety (V2-V5) and treatment (fresh cooked, cold). To
examine the differences between treatments, data was analyzed using a three-factor analysis of
variance (ANOVA) to examine the effect of time, variety, treatment and time x variety x
treatment interaction. For AUC and GI values two-factor ANOVA was conducted to examine
the effect of variety, treatment and variety x treatment interaction. After demonstration of
significant heterogeneity, Tukey‟s post-hoc test was used to determine significant differences
between individual mean blood glucose and insulin concentrations at each time point, mean
AUC and GI. In addition, to examine the differences between the GI of each potato variety to
that of white bread we conducted a one-way ANOVA. Simple un-paired t-test was used to
determine if there were significant differences between the GI of each variety both freshly
cooked and cold between harvest years (2009 vs. 2010).
Differences were considered significant if a two-tailed P ≤ 0.05. Analysis was done
using SPSS statistical package 18.0.

51
4.3 MATERIALS AND METHODS- IN VITRO STARCH DIGESTIBILITY
Physicochemical measurements were performed by the laboratory Dr. Qiang Liu from
Agriculture and Agri-Food Canada.
4.3.1 Materials
Potato varieties 2, 3, 4 and 5
4.3.2 Preparation of dry matter and starch
Potato dry matter and starch were obtained according to the methods of Liu, Yada and
Arul (2002) and Liu, Weber, Currie and Yada (2003). The samples were kept in air-tight plastic
bags at room temperature until further use.
4.3.3 Chemical Composition
Total starch content of potato dry matter was determined based on AACC (2000) method
76-13. Protein content of dry matter was determined using Thermoquest CE Instrument (NA
2100 Protein, Thermo-Quest Italia S.P.A., Ann Arbor, MI, USA). The instrument determines the
nitrogen content of the sample. Protein content was calculated by multiplying the nitrogen
content by a factor of 6.25. Atropine (4.84% N), DL-methionine (9.39% N), acetanilide (10.36%
N), and nicotinamide (22.956% N) were used as standards to produce a standard curve.
Apparent amylose content in potato starch was determined by iodine colorimetry according to
Williams, Kuzina and Hlynka (1970). Starch and dry matter sample (1.000 g) was weighed into
a tared porcelain crucible, and then heated one hour at 250ºC and four hours at 475ºC in a muffle
oven. After cooling, the ash was dissolved with 10.0 mL of 1.0 M HCl for 30 min, and then the
contents were transferred to a 50 mL plastic volumetric vial and brought up to volume, mixed
and allowed to stand for one hour before analysis. Total phosphorus, potassium, magnesium and

52
calcium content in starch and dry matter were determined using a Varian Vista Pro ICP-OES
(Inductively Coupled Plasma-Optical Emission Spectrometer; Mississauga, ON, Canada).
4.3.4 In vitro digestibility of cooked and cooled potatoes
In vitro starch digestibility was determined using the method of Englyst, Kingman and
Cummings (1992) with modifications (Chung, Lim & Lim, 2006). The potatoes were cooked
and cooled according to the procedure described for the GI protocol in section 2.2.2 and then put
into freezer at -80ºC before freeze drying. The freeze-dried samples were manually ground by a
mortar and pestle, and passed through a 125 µm sieve. Percentages of rapidly digestible starch
(RDS, % digestible starch at 20 min), slowly digestible starch (SDS, % digestible starch at 120
min - % digestible starch at 20 min), and resistant starch (RS, total starch % - % digestible starch
at 120 min) were calculated.
4.3.5 Statistical Analysis
All samples were tested in duplicate in each analytical technique. Percentages for RDS,
SDS and RS were converted into grams per serving (amount consumed in vivo GI test) for each
potato variety. Simple linear regression was used to assess the relationships between the
physicochemical properties amylose, phosphorous and in vitro digestibility products RDS, SDS
and RS and the GI of potato varieties for 2, 3, 4 and 5 consumed freshly cooked and cold.
Differences were considered significant if a two-tailed P ≤ 0.05. Analysis was done using
SPSS statistical package 18.0.
53
4.4 RESULTS
4.4.1 Blood Glucose Responses
Blood glucose profiles for potato varieties 2, 3, 4 and 5 are shown in figure 4.1. There
was no main effect of variety for the mean blood glucose AUC (F=1.739, P= 0.157) and no
variety x treatment interaction for the AUC of freshly cooked and cold potatoes (F=0.656, P=
0.709). However, a main effect of cooling (F= 6.729, P= 0.010) was observed with freshly
cooked potatoes eliciting a significantly greater AUC than cold potatoes (154.1 ± 28.0 vs. 107.3
± 18.6) (table 4.3). Varieties 2 and 5 freshly cooked elicited a greater blood glucose response at
30 and 45 min when compared to cold (P <0.05). Variety 3 freshly cooked elicited a greater
blood glucose response at 30 min when compared to cooled potatoes (P <0.05). Variety 5
consumed freshly cooked caused a greater rise in blood glucose at 15 mins when compared to
cooled potatoes (P <0.05). There were no significant differences between the blood glucose
response elicited by variety 4, both freshly cooked and cold.
4.4.2 Insulin Responses
Serum insulin profiles for potato varieties 2, 3, 4 and 5 are shown in figure 4.3. There
was no main effect of variety for the mean insulin AUC (F=1.61, P= 0.184) and no variety x
treatment interaction for the AUC of freshly cooked and cold potatoes (F= 0.44, P= 0.730).
However, a main effect of cooling (F= 6.24, P=0.012) was observed with freshly cooked
potatoes eliciting a significantly greater insulin AUC than cold potatoes (434.7 ± 96.5 vs. 275.7
± 61.6) (table 3.3). Variety 3 cold elicited a significantly lower insulin response than freshly
cooked (P<0.05). Figure 4.5 shows the relationship between the GI and II. There was a
significant positive relationship between the GI and II for all potato meals (freshly cooked and
cold) (r2= 0.59, P= 0.03).
54
4.4.3 Glycaemic Index
Table 4.4 shows the GI values for potato varieties 2, 3, 4 and 5 compared to white bread.
ANOVA showed the GI of V2 (38 ± 5) and V5 (39 ± 4) served cold were significantly different
(P< 0.001) from the GI of WB (GI=71). Only 2 of the potato test meals (V4 and V5) were
classified as high GI (≥70) when consumed freshly cooked. Only two test meals were classified
as medium GI (55-69) when freshly cooked (V2 and V3) and one when consumed cold (V4).
Three of the potato test meals (V2, V3 and V5) were classified as low GI (≤ 55) when consumed
cold. ANOVA showed a main effect of variety (F=4.84, P < 0.001), a main effect of treatment
(F=36.33, P <0.001) and a variety x treatment interaction (F= 1.33, P=0.235). Tukey‟s test
showed that variety 5 served cold had a significantly lower GI than freshly cooked (71 ± 7 vs. 39
± 4, P<0.001). A comparison between like potato varieties harvested in 2009 versus those
harvested in 2010 showed that there were no significant differences in GI for variety 2 fresh
cooked (F= 1.790, P= 0.335) and cold (F=1.050, P= 0.634), variety 3 fresh cooked (F= 1.96,
P=0.277) cold (F= 1.40, P= 0.508), variety 4 fresh cooked (F=2.040 , P= 0.3087) and cold (F=
1.146, P= 0.842), and variety 5 fresh cooked (F= 2.27, P= 0.197) and cold (F= 2.09, P= 0.672).

55
4.4.4 Starch Physicochemical Properties and GI
Figure 4.6 shows the relationship between the amounts of RDS (in grams) found in a
portion of potato containing 50g of available carbohydrate and the GI of cooked and cooled
potatoes. There is a significant positive relationship between RDS content and the GI (r2= 0.85,
P= 0.001). Figure 4.7 shows the relationship between SDS content (g) and the GI of freshly
cooked and cooled potatoes. There was a significant inverse relationship between SDS content
and GI (r2= -0.60, P= 0.02). Figure 4.8 shows the relationship between the amount of resistant
starch (RS) in a portion of potato containing 50g of available carbohydrate and the GI freshly
cooked and cold potatoes. No significant relationship (r2= -0.19, P= 0.28) was observed between
RS content (g/ serving) and the GI of freshly cooked and cold potatoes. Figure 4.9 shows the
relationship between percent amylose for each potato variety and the GI of freshly cooked and
cold potatoes. A significant inverse relationship was observed between percent amylose content
and the GI of freshly cooked and cold potatoes (r2= -0.98, p= 0.006). Figure 4.10 shows the
relationship between the GI of freshly cooked and cold potatoes and phosphorous content. A
significant inverse relationship between the GI of freshly cooked potatoes and phosphorous
content (r2= -0.97, P<0.01). No significant relationship was observed between the mean GI for
freshly cooked and cold potatoes and phosphorous content (r2=0.03 , P= 0.839).

56
Table 4.1 Subject Characteristics
Variable mean ± SEM Range
n (male: female) 8:2 -
Age (y) 39.3 ± 4.2 25-61
Weight (kg) 80. 9 ± 5.2 60.9-111.4
Height (m) 1.74 ± 0.03 1.57-1.93
BMI (kg/ m2) 26.4 ± 0.8 22.3-30.9
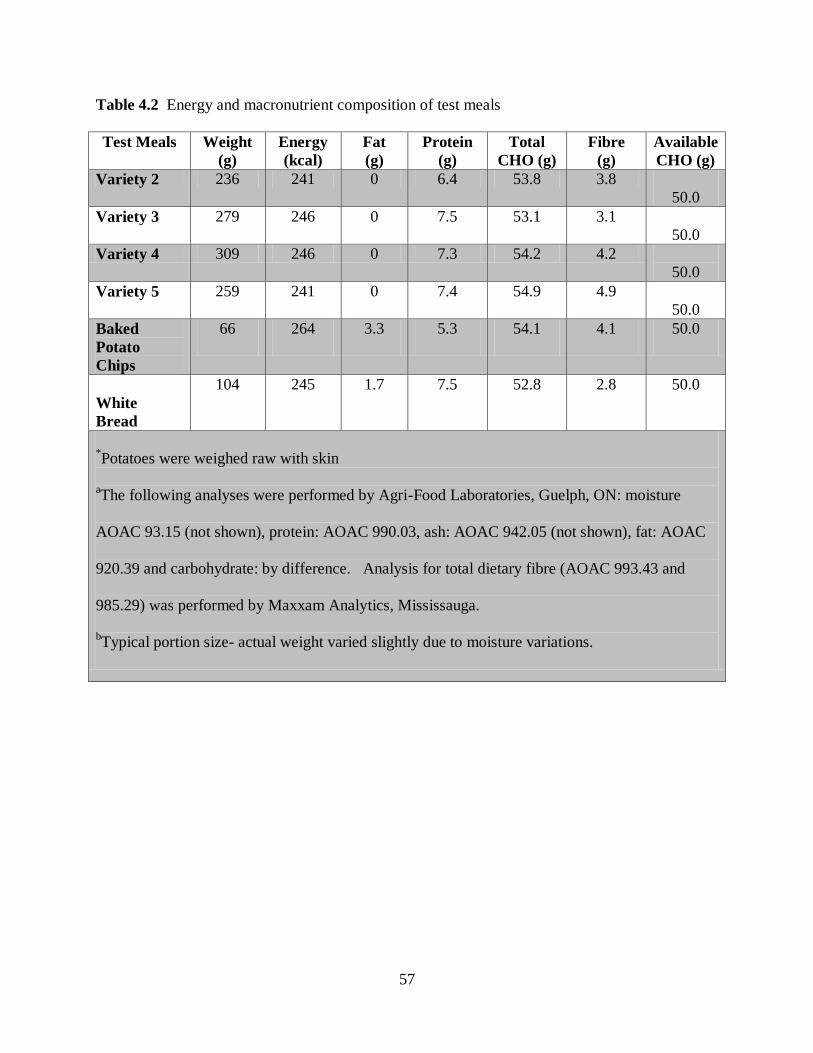
57
Table 4.2 Energy and macronutrient composition of test meals
Test Meals Weight
(g)
Energy
(kcal)
Fat
(g)
Protein
(g)
Total
CHO (g)
Fibre
(g)
Available
CHO (g)
Variety 2 236 241 0 6.4 53.8 3.8
50.0
Variety 3 279 246 0 7.5 53.1 3.1
50.0
Variety 4 309 246 0 7.3 54.2 4.2
50.0
Variety 5 259 241 0 7.4 54.9 4.9
50.0
Baked
Potato
Chips
66 264 3.3 5.3 54.1 4.1 50.0
White
Bread
104 245 1.7 7.5 52.8 2.8 50.0
*Potatoes were weighed raw with skin
aThe following analyses were performed by Agri-Food Laboratories, Guelph, ON: moisture
AOAC 93.15 (not shown), protein: AOAC 990.03, ash: AOAC 942.05 (not shown), fat: AOAC
920.39 and carbohydrate: by difference. Analysis for total dietary fibre (AOAC 993.43 and
985.29) was performed by Maxxam Analytics, Mississauga.
bTypical portion size- actual weight varied slightly due to moisture variations.

58
Table 4.3 Blood glucose and Insulin AUC values for potato varieties 2, 3, 4 and 5
Glucose AUC
(mmol.min/ L)
Treatment Mean for Variety
Fresh Cooked Cold
Variety 2
119.94 ± 9.75
83.02 ± 12.14
101.48 ± 10.95a
Variety 3
137.22 ± 28.47
102.25 ± 13.83
119.74 ± 21.15
Variety 4
168.83 ± 33.21
139.48 ± 26.57
154.16 ± 29.89b
Variety 5
190.50 ± 40.47a
104.42 ± 21.74b
147.46 ± 31.11
Mean for Treatment
154.12 ± 27.98a
107.29 ± 18.57b
Insulin AUC
(pmol/ L)
Treatment
Fresh Cooked Cold Mean for Variety
Variety 2
399.3 ± 73.7
277.4 ± 69.0
338.3 ± 71.4
Variety 3
437.9 ± 103.8
291.3 ± 63.0
364.6 ± 83.4
Variety 4
419.1 ± 105.2
229.1 ± 35.9
324.1 ± 70.6
Variety 5
410.9 ± 60.5a
228.3 ± 36.9b
319.6 ± 48.7
Mean for Treatment
416.8 ± 85.8 a
256.5 ± 51.2b
Values mare means ± SEM
abAUC values not sharing the same letter subscripts differ significantly (P<0.05) from each
other within each row.

59
Table 4.4 GI values for potato varieties 2, 3, 4 and 5
Glycaemic Index
Treatment
Mean for Variety Fresh Cooked Cold
Variety 2
57 ± 5
38 ± 5x
48 ± 6a
Variety 3
62 ± 6
50 ± 6
56 ± 6
Variety 4
74 ± 6
66 ± 6
70 ± 6b
Variety 5
71 ± 7a
39 ± 4bx
55 ± 6
Mean for
Treatment
66 ± 6a
48 ± 5b
Values are means ± SEM
a bGI values not sharing the same letter subscripts differ significantly (P<0.05) from each other
within each row.
x GI values differ significantly from the GI of white bread.

60
Table 4.5 GI values for potato varieties 2, 3, 4 and 5 harvested in 2009 and 2010 and served to
subjects (n= 10) freshly cooked and cold
2009 Harvest 2010 Harvest
Treatment Treatment
Fresh Cooked Cold Fresh Cooked Cold
Variety 2
52 ± 4
35 ± 5z
57 ± 5
38 ± 5z
Variety 3
65 ± 6a
34 ± 6bz
62 ± 6
50 ± 6
Variety 4
59 ± 6
61 ± 5
74 ± 6
66 ± 6
Variety 5
57 ± 8
45 ± 6
71 ± 7a
39 ± 4bz
Mean for
Treatment
58 ± 6
44 ± 6
66 ± 6a
48 ± 5b
Values are means ± SEM
a bGI values not sharing the same letter subscripts differ significantly (P<0.05) from each other
within each row and harvest year.
z GI values differ significantly from the GI of white bread.

61
Table 4.6 In vitro digestibility of cooked and cooled potatoes
Variety Samples RDS (%)
mean ± SD
SDS (%)
Mean ± SD
RS (%)
Mean ± SD
Variety 2
Cooked
45.8 ± 0.5
5.8 ± 0.8
21.2± 0.9
Cooled
43.0 ± 1.2
8.3 ± 0.7
22.5± 0.6
Variety 3
Cooked
43.4 ± 0.4
5.7 ± 0.4
23.1± 0.8
Cooled
41.2 ± 0.2
6.7 ± 0.1
23.5± 0.1
Variety 4
Cooked
47.7 ± 0.5
3.5 ± 1.3
22.5± 0.9
Cooled
46.4 ± 1.0
5.8 ± 0.7
23.3± 0.9
Variety 5
Cooked
45.7 ± 0.3
5.9 ± 0.6
22.0± 0.6
Cooled
43.2 ± 0.3
8.1 ± 0.6
24.6± 0.4
* For cooked and cooled potatoes, the RDS, SDS and RS content are based on total mass
of dry matter

62
WB V2 V3 V4 V50
50
100
150
200
250a
b
AU
C (
mm
ol.m
in/ L
)
0 30 60 90 1203
4
5
6
7
8 Freshly Cooked
Cold
Variety 2
aa
Time (min)
Ch
an
ge in
blo
od
glu
co
se
(mm
ol.m
in/
L)
Variety 3
0 30 60 90 1203
4
5
6
7
8Freshly Cooked
Cold
Time (min)
Ch
an
ge in
blo
od
glu
co
se
(mm
ol.m
in/
L)
a
0 30 60 90 1203
4
5
6
7
8Freshly Cooked
Cold
Variety 4
Time (min)
Ch
an
ge in
blo
od
glu
co
se
(mm
ol.m
in/
L)
Variety 5
0 30 60 90 1204
5
6
7
8
9 Freshly Cooked
Cold
a
a a
Time (min)
Ch
an
ge in
blo
od
glu
co
se
(mm
ol.m
in/
L)
Figure 4.1 Incremental AUC and change in blood glucose after consuming potato varieties 2, 3, 4 and 5 served to
ten subjects two ways, freshly cooked and cold. Values are means ± SEM.Letters represent significant differences
(P <0.05) between freshly cooked and cold potatoes at the same time-point. For AUC, different letters represent
significant differences between each treatment (P <0.05).

63
WB V2 V3 V4 V50
200
400
600
800
Insu
lin A
UC
(p
mo
l/ L
)
a
b
0 30 60 90 1200
100
200
300
400
500 Freshly Cooked
Cold
Variety 2
Time (min)
Ch
an
ge
in
in
su
lin (
pm
ol/ L
)
0 30 60 90 1200
100
200
300
400
500 Freshly Cooked
Cold
Variety 3
Time (min)
Ch
an
ge
in
in
su
lin (
pm
ol/ L
)
a
0 30 60 90 1200
100
200
300
400
500Freshly Cooked
Cold
Variety 4
Time (min)
Ch
an
ge
in
in
su
lin (
pm
ol/ L
)
0 30 60 90 1200
100
200
300
400
500 Freshly Cooked
Cold
Variety 5
Time (min)
Ch
an
ge
in
in
su
lin (
pm
ol/ L
)
Figure 4.2 Incremental AUC and change in insulin after consuming potato varieties 2, 3, 4 and5 served to ten
subjects two ways, freshly cooked and cold. Values are means ± SEM . Letters represent significant differences (P
<0.05) between freshly cooked and cold potatoes at the same time-point. For mean AUC, different letters represent
significant differences between each treatment (P <0.05).

64
Figure 4.3 GI of potato varieties 2, 3, 4 and 5 served to ten subjects in two ways, freshly cooked
and cold. Bars represent means ± SEM. A significant effect of treatment and variety and a
variety x treatment interaction was observed. Bars with different letters within each variety
group (freshly cooked and cold) are significantly different (P <0.05). (upper left) Percent
reduction in GI upon cooling a cooked potato. Each bar represents the difference in GI between
freshly cooked and cold potatoes for each variety. Values are means ± SEM. Different subscripts
indicate that the reduction in GI with cooling were significantly different from each other.
V2 V3 V4 V50
20
40
60
80
100 Hot
Cold a
b
Gly
ca
em
ic I
nd
ex
V2 V3 V4 V5-60
-40
-20
0
-33%
-40%
-25%
-9%
a b
Gly
caem
ic In
dex-
% D
iffe
ren
ce

65
Figure 4.4 GI of potato varieties 2, 3, 4 and 5 served to ten subjects in two ways, freshly cooked
and cold and harvested in two separate years, 2009 and 2010. Bars represent means ± SEM. No
significant differences were observed between like varieties and preparation methods between
years.
V2
09
V2
09
V2
10
V2
10
V3
09
V3
09
V3
10
V3
10
V4
09
V4
09
V4
10
V4
10
V5
09
V5
09
V5
10
V5
10
0
20
40
60
80
100
Gly
ca
em
ic I
nd
ex
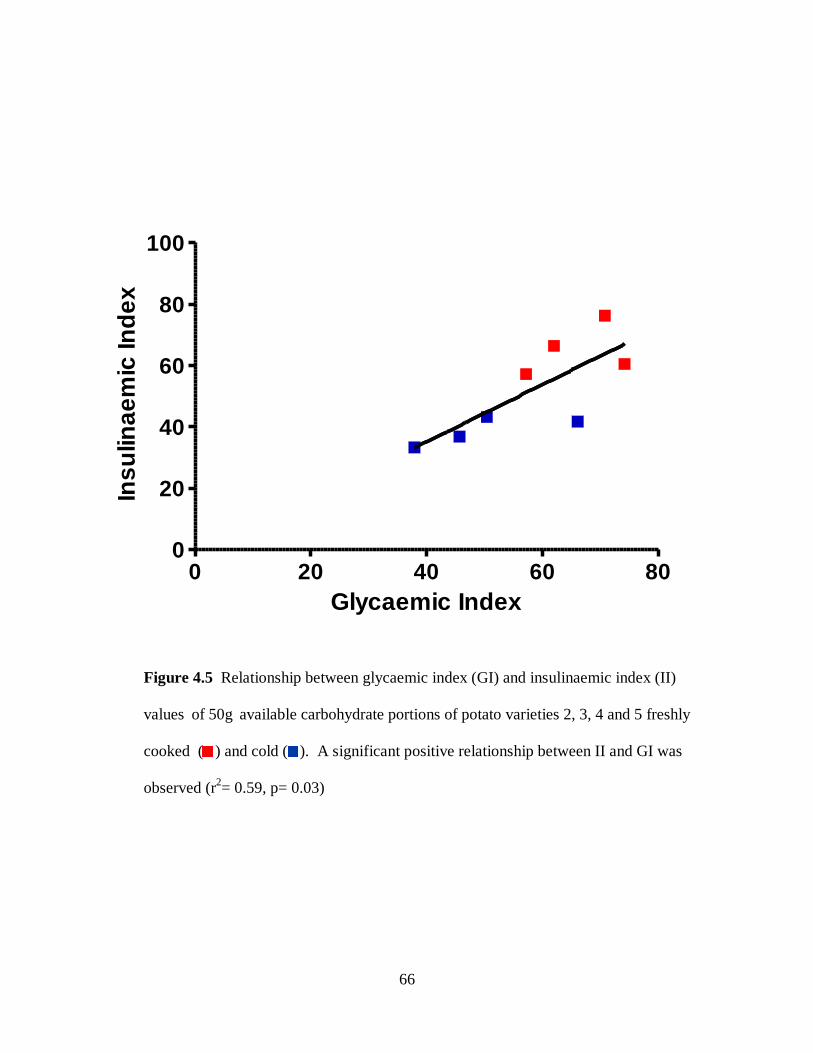
66
0 20 40 60 800
20
40
60
80
100
Glycaemic Index
Ins
ulin
ae
mic
In
de
x
Figure 4.5 Relationship between glycaemic index (GI) and insulinaemic index (II)
values of 50g available carbohydrate portions of potato varieties 2, 3, 4 and 5 freshly
cooked ( ) and cold ( ). A significant positive relationship between II and GI was
observed (r2= 0.59, p= 0.03)

67
24 26 28 30 32 340
20
40
60
80
100
Rapidly Digestible Starch (g/ serving)
Gly
ca
em
ic In
de
x
Figure 4.6 Relationship between the amount of rapidly digestible starch (RDS) in
a portion of potato containing 50g of available carbohydrate and the GI freshly cooked
( ) and cold ( ) potatoes. A significant positive relationship (r2= 0.85, p= 0.001) was
observed between RDS content (g/ serving) and GI.

68
0 2 4 60
20
40
60
80
Slowly Digestible Starch (g/ serving)
Gly
caem
ic In
dex
Figure 4.7 Relationship between the amount of slowly digestible starch (SDS) in a portion of
potato containing 50g of available carbohydrate and the GI freshly cooked ( ) and cold ( )
potatoes. A significant inverse relationship (r2= -0.60, p= 0.02) was observed between SDS
content (g/ serving) and the GI of freshly cooked and cold potatoes.

69
12 13 14 15 16 170
20
40
60
80
Resistant Starch (g/ serving)
Gly
caem
ic In
dex
Figure 4.8 Relationship between the amount of resistant starch (RS) in a portion of
potato containing 50g of available carbohydrate and the GI freshly cooked ( ) and
cold ( ) potatoes. No significant relationship (r2= -0.19, p= 0.28) was observed
between RS content (g/ serving) and the GI of freshly cooked and cold potatoes.

70
30 35 40 4540
50
60
70
80
Amylose (%)
Gly
caem
ic In
dex
Figure 4.9 Relationship between percent amylose for each potato variety and GI. A
significant inverse relationship (r2= -0.98, p= 0.006) was observed between amylose
content (%) and the mean GI of freshly cooked and cold potato.
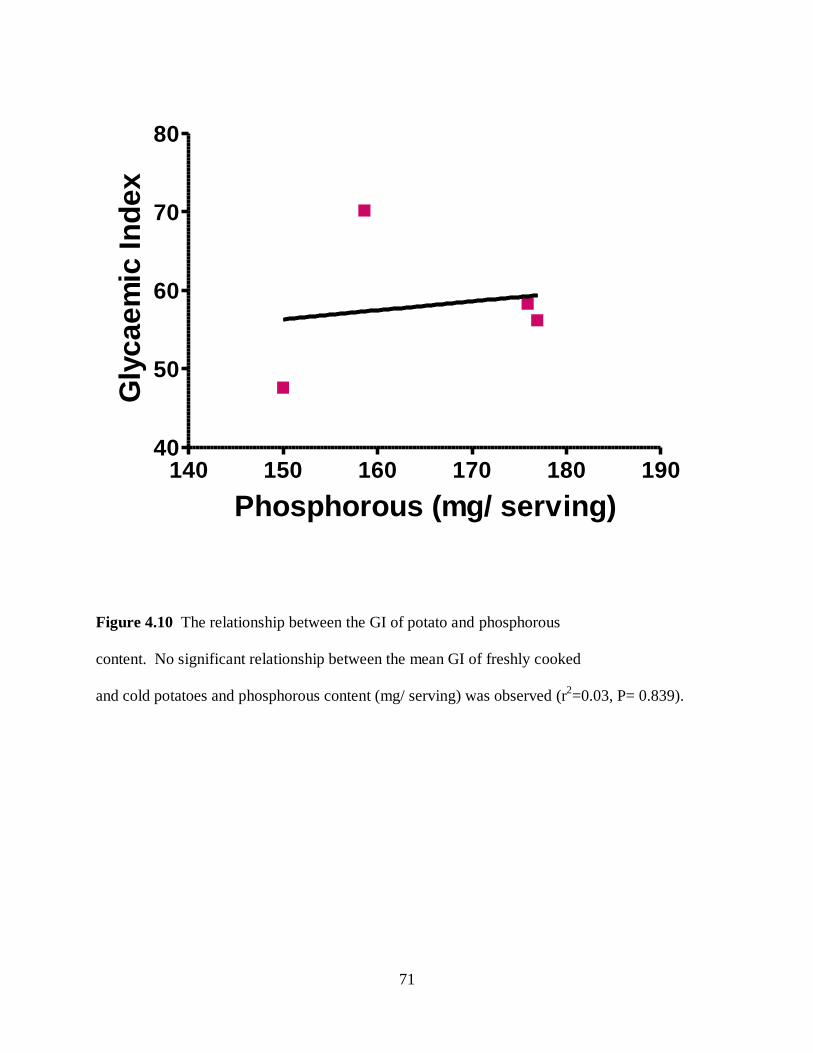
71
140 150 160 170 180 19040
50
60
70
80
Phosphorous (mg/ serving)
Gly
ca
em
ic I
nd
ex
Figure 4.10 The relationship between the GI of potato and phosphorous
content. No significant relationship between the mean GI of freshly cooked
and cold potatoes and phosphorous content (mg/ serving) was observed (r2=0.03, P= 0.839).

72
4.5 Discussion and Conclusions
Previously we determined that the effect of cooling on GI is dependent on variety and
that these effects can vary significantly between varieties. In the present study we also found
that the effect of cooling is dependent on variety with cooling significantly reducing the GI of V5
while having no significant effect in V2, V3 and V4. Only 2 of the potato test meals, V4 and V5
were classified as high GI (≥70) when consumed freshly cooked. Cooling reduced 3 of 4 potato
varieties tested to a low GI classification.
Examination of the blood glucose raising ability of freshly cooked versus cold potatoes
showed no main effect of variety but a main effect of cooling with cold potatoes tending to elicit
a lower glycaemic response than freshly cooked. The lower glycaemic response elicited by cold
potatoes may be attributed to an increase in postprandial insulin levels or may be due to an
increase in the proportion of SDS and RS often found in cold potatoes. In order to test our
hypothesis that cold potatoes do not produce a higher insulin response we measured serum
insulin. As expected the low GI of cold potatoes was not due to an increase in postprandial
insulin. In fact, ANOVA showed a main effect of cooling (F= 6.24, P=0.012) with freshly
cooked potatoes eliciting a significantly greater insulin AUC than cold potatoes (416.8 ± 85.8 vs.
256.5 ± 51.2) (table 4.3).
It is generally accepted that cooking followed by cooling reduces the GI of potato,
however it is still unknown what is responsible for this reduction. Upon cooling, some of the
starch in potato retrogrades to form a starch product which is resistant to digestion, this is
thought to be partly responsible for the reduction in glycaemic response and the lower GI often
73
seen with cold potatoes. Although an increase in RS may help reduce the glycaemic impact of a
potato meal it seems only to play a diminutive role as there is typically only a 6 percent increase
in RS content when comparing a freshly cooked gelatinized potato to a cooked and cooled
potato.(Wolever, 2006) A more plausible explanation for the decrease in GI often observed with
cooling may be that some RDS is converted to SDS; the result is a greater proportion of SDS and
a lower GI. To explore the relationship between starch properties measured in vitro and GI we
conducted in vitro starch analysis with potato dry matter and related these properties to GI values
measured in vivo. In vitro analysis was conducted using potato dry matter so in order to make it
more physiologically relevant the amounts of RDS, SDS, RS were converted from percentages to
grams per portion of potato containing 50g of available carbohydrate. Our in vitro analysis
showed that potatoes with a lower GI had significantly higher amounts of SDS. Conversely,
potatoes with higher GI values had significantly higher amounts of RDS.
Amylose, due to its linear structure is more resistant to gelatinization and is more readily
retrograded with cooling. Potatoes which contain greater amylose:amylopectin are thought to
have a lower GI, this is due to the fact that amylopectin is more readily hydrolyzed because of its
highly branched structure; this coupled with reasons stated previously lead to the hypothesis that
increasing the proportion of amylose in potatoes may be beneficial for the GI of potatoes. We
found a strong significant inverse relationship between percent amylose content and the GI of
freshly cooked and cold potatoes (r2= -0.98, p= 0.006) which supports our hypothesis.
Potatoes are also known to contain an appreciable amount of phosphorous which is
thought to affect the functional properties of the starch in potato. Phosphorous is known to form
complexes with amylose and amylopectin effectively limiting the ability for the starch to

74
gelatinize. If this is correct potatoes containing a greater proportion of phosphorous would be
advantageous from a GI stand-point because of its ability to resist starch gelatinization.
Conversely, phosphorous has been positively associated with starch retrogradation suggesting
that potatoes containing a greater proportion of phosphorous will have a lower GI than potatoes
which contain lower amounts of phosphorous. In the present study phosphorous content did not
seem to be related to GI however, this may be due to the fact that with cooking, particularly
boiling, phosphorous tends to leach out into the cooking liquid. The phosphorous measurements
for this study were conducted using the dry matter of potatoes that were boiled and then freeze-
dried which may have significantly affected the amount of phosphorous.

75
CHAPTER 5
OVERALL DISCUSSION, CONCLUSIONS AND FUTURE
DIRECTIONS

76
5.1 DISCUSSION
5.1.1 Study 1
The overall objective of this thesis was to identify low-GI potatoes and to examine the
role of the physicochemical properties of starch in determining the GI of potato. In study 1 we
screened additional novel potato varieties provided to us by the Bio-Potato Network and we were
able to ascertain that the GI of potato varies between varieties and that cooling reduces the GI in
some potato varieties and may do so to different extents. Although we did not observe a
statistically significant treatment x variety interaction we found that cooling produced a wide
range of effects from no reduction in GI with cooling to a 50% reduction in GI with cooling.
The GI values for the freshly cooked varieties tested ranged from 52 to 81 for freshly cooked
potatoes and 35 to 62 for cooled potatoes; these values were generally lower than those reported
in the literature (Soh & Brand-Miller, 1999; Henry et al., 2005).
5.1.2 Study 2
The objectives of study 2 were to re-test the GI of four varieties of interest from 2009 in
2010 and to examine the role of the physicochemical properties (RDS, SDS, RS, amylose and
phosphorous content) of their starch in determining GI. As we hypothesized, potato varieties
which contained a greater proportion of their starch in the form of RDS had a higher GI than
those which contained a greater proportion of SDS. RS did not seem to have a significant impact
on the GI of potato for reasons explained in section 4.7. Amylose content was strongly
negatively related to GI which as stated previously in section 4.7 may be due to several factors
including reduced gelatinization with cooking and enhanced retrogradation with cooling.

77
Unfortunately, contrary to what we had hypothesized we were unable to see a negative
relationship between phosphorous content and GI.
The GI values for varieties 2, 3, 4 and 5 did not significantly differ between harvest years
despite being grown in two different locations (Lethbridge, Alberta vs. Guelph, Ontario). The
fact that there was no statistically significant difference between harvest years is interesting
considering factors such as soil nutrient content, rainfall and time of harvest are thought to play
an important role in starch formation and may influence GI.
In both studies we saw that cooling tended to reduce the GI of potato, however we were
unsure of the precise mechanism(s) responsible for this reduction. To explore the possibility that
cold potatoes elicit a higher insulin response, we measured postprandial serum insulin and as
expected we were able to determine that cold potatoes have a lower GI not because they increase
postprandial insulin but because overall they tend to elicit a lower glycaemic and insulinaemic
response.

78
5.2 CONCLUSIONS
In this thesis, three main objectives were identified in order to test the hypotheses. The
first objective was to screen additional novel potato varieties, determine their GI, and to confirm
our previous findings that the effect of cooling on the GI is dependent on variety. In study 1 we
identified a few potato varieties that were classified as low GI. Unlike previous findings from
our laboratory we were unable to identify a significant variety x treatment interaction but
observed significant differences in GI between varieties with cooling reducing GI by 0-50%. In
study 2 we identified a significant variety x treatment interaction, with cooling significantly
reducing the GI in some potato varieties while having no effect in other varieties.
The second objective was to examine the role of the physicochemical properties (RDS,
SDS, RS, amylose and phosphorous content) of their starch in determining GI. As expected
potato varieties with a greater proportion of their starch in the form of RDS had a high GI than
those with a greater proportion of their starch in the form of SDS. Amylose was negatively
related to GI as we hypothesized. RS and phosphorus content did not seem to be related to GI.
The third objective was to determine if the low GI of cold potatoes is due to an increase
in postprandial insulin. In keeping with our hypothesis, cold potatoes did not produce an
exaggerated increase in postprandial insulin.

79
5.3 FUTURE DIRECTIONS
The potatoes tested in the present study tended to have lower GI values than some
potatoes currently available on the market which suggest that the work done by the breeders and
starch chemists was successful, however more work is definitely needed. During our series of
tests we identified some potato varieties that were low GI when freshly cooked and cold,
however unfortunately most of these varieties were identified as poor crops that were not
agronomically sound, meaning they were not a viable product and thus would not be a candidate
to bring to the fresh potato market. Our in vitro analysis showed some interesting data which
were in line with our hypotheses, however these analyses were conducted using potato dry
matter and not fresh potato. Future in vitro analysis conducted using fresh potato samples should
be conducted as this more accurately reflects what is consumed in vivo. In addition, examining
the effect of maturity on the physicochemical properties of starch would be an important aspect
to explore. Maturity was a factor that we had planned on exploring as part of this thesis but due
to unforeseen circumstances we were unable to obtain early harvest potatoes for our analyses.

80
REFERENCES

81
AAFC. (2007). Canadian potato situation and trends 2006-2007. Retrieved September 9, 2011
from www.agr.gc.ca
Åkerberg A, Liljeberg H, and Björck I. Effects of amylose/amylopectin ratio and baking
conditions on resistant starch formation and glycaemic indices. Journal of Cereal
Science 1998;28:71-80.
Atkinson FS, Foster-Powell K and Brand-Miller JC. International tables of glycemic index and
glycemic load values. Diabetes Care 2008;31:2281-2283.
Augustin, LS, Franceschi S, Jenkins DJA, Kendall CW and La Vecchia C. Glycemic index in
chronic disease: a review. European Journal of Clinical Nutrition 2002;56:1049-1171.
Behall KM, Scholfield DJ, Canary J. Effect of starch structure on glucose and insulin response in
adults. American Journal of Clinical Nutrition 1998;47:428–432.
Bertoft E & Blennow A. Structure of Potato Starch. In: Singh J and Kaur L (Eds.) Advances in
Potato Chemistry and Technology 2008 (pp. 83-98). Elsevier, Oxford, UK.
Bethke PC. The effects of boiling and leaching on the content of potassium and other minerals in
potatoes. Journal of Food Science 2008;73:H80-85.
Brand-Miller J, Hayne S, Petocz P & Colagiuri S. Low-glycemic index diets in the management
of diabetes: A meta-analysis of randomized controlled trials. Diabetes Care
2003;26(8):2261-2267.

82
Brouns F, Bjorck I, Frayn KN, Gibbs AL , Lang V, Slama G, Wolever TMS. Glycaemic index
methodology. Nutrition Research Reviews 2005;18(1):145-171.
Brownlee M. Biochemistry and molecular cell biology of diabetic complications. Nature
2001;414:813-820.
Brown, CR. Antioxidants in potato. American Journal of Potato Research 2005;82:163-172.
Camire M, Kubow S and Donnelly DJ. Potatoes and human health. Critical Reviews Food
Science Nutrition 2009;49:823-840.
Chung HJ, Lim HS, & Lim ST. Effect of partial gelatinization and retrogradation on the
enzymatic digestion of waxy rice starch. Journal of Cereal Science 2006;43(3): 353-359.
Crapo PA, Reaven G, Olefsky J. Postprandial plasma-glucose and -insulin responses to different
complex carbohydrates. Diabetes 1977;26(12):1178-1183.
Crapo PA, Kolterman OG, Waldeck N. Postprandial hormonal responses to different types of
complex carbohydrate in individuals with impaired glucose tolerance. American Journal
of Clinical Nutrition 1980;33(8):1723-1728.
de Willigen AHA.(1976) The rheology of starch. In: J.A Radley (Ed.) Examination and Analysis
of starch and starch products (pp. 61-90). Applied Science Publishers Ltd., London.
Ells LJ, Seal CJ, Kettlitz B, Bal W, & Mathers, JC. Postprandial glycaemic, lipaemic and
haemostatic responses in ingestion of rapidly and slowly digested starches in healthy
young women. British Journal of Nutrition 2005;94(6):948-955.
83
Englyst H & Cummings J. Digestion of polysaccharides of potato in the small intestine of man.
American Journal of Clinical Nutrition 1987;45(2):423-431.
Englyst KN, & Englyst HN. Carbohydrate bioavailability. British Journal of Nutrition 2005;
94(1):1-11.
Englyst HN, Kingman SM, Cummings JH. Classification and measurement of nutritionally
important starch fractions. European Journal of Clinical Nutrition 1992;46:S33-S50.
Englyst KN. Glycaemic index of cereal products explained by their content of rapidly and slowly
available glucose. British Journal of Nutrition 2003;89:329-39.
Englyst KN, Englyst HN, Hudson GJ, Cole TJ and Cummings JH. Rapidly available glucose in
foods: An in vitro measurement that reflects the glycemic response. American Journal of
Clinical Nutrition 1999;69:448-454.
Englyst KN, Vinoy S,Englyst HN and Lang V. Glycaemic index of cereal products
explained by their content of rapidly and slowly available glucose. British Journal of
Nutrition 2003;89:329-339.
Englyst H, Cummings J. Digestion of polysaccharides of potato in the small intestine of man.
American Journal of Clinical Nutrition 1987;45(2):423-431.
Food and Agriculture Organization/ World Health Organization. Report of a Joint FAO/ WHO
Expert Consultation. Carbohydrates in Human Nutrition. 1998.

84
Fernandes G, Velangi A, Wolever TMS. Glycemic index of potatoes commonly consumed in
North America. Journal of the American Dietetic Association 2005;105:557-62.
Foster-Powell K, Holt SH, Brand-Miller JC. International table of glycemic index and glycemic
load values: 2002. American Journal of Clinical Nutrition 2002;76:5-56.
Fredriksson H, Silverio J, Andersson R, Eliasson A-, Åman P. The influence of amylose and
amylopectin characteristics on gelatinization and retrogradation properties of different
starches. Carbohydrate Polymers 1998;35(3-4):119-134.
Gallant DJ., Bouchet B, Buleon A, & Perez S. Physical characteristics of starch granules and
susceptibility to enzymatic degradation. European Journal of Clinical Nutrition
1992;46(Suppl.2):S3-S16.
García-Alonso A, Goñi I. Effect of processing on potato starch: In vitro availability and
glycaemic index. Nahrung 2000;44:19-22.
Garsetti M, Vinoy S, Lang V, Holt S, Loyer S and Brand-Miller JC. The glycemic and
insulinemic index of plain sweet biscuits: relationships to in Vitro starch digestibility.
Journal of the American College of Nutrition 2005;24:441-447.
Goddard MS, Young G and Marcus R. The effect of amylose content on insulin and glucose
responses to ingested rice. American Journal of Clinical Nutrition 1984;39:388-392.
Golden F. And now the bad news: Potatoes. Time Magazine, 21 January 2002, 55-56.

85
Guilbot A & Mercier C. (1985) Starch. In: Aspinall GO (Ed.) The polysaccharides (p.209).
Academic Press, New York.
Halton TL, Willett WC, Liu S, et al. Low-carbohydrate-diet score and the risk of coronary heart
disease in women. New England Journal of Medicine 2006;355:1991-2002.
Hasjim J, Lavau GC, Gidley MJ, Gilbert RG. In Vivo and In Vitro Starch Digestion: Are
Current In Vitro Techniques Adequate?. Biomacromolecules 2010;11:3600-3608.
Henry CJK, Lightowler HJ, Strik CM, Storey M. Glycaemic Index values for commercially
available potatoes in Great Britain. British Journal of Nutrition 2005;94:917-921.
Hoover R. Composition, molecular structure and physicochemical properties of tuber and root
starches: a review. Carbohydrate Polymers 2001;45:253-267.
Jenkins D, Wolever T, Taylor R, Barker H, Fielden H, Baldwin J, et al. Glycemic index of foods:
a physiological basis for carbohydrate exchange. American Journal of Clinical Nutrition
1981;34(3):362-366.
Kingman, SM, & Englyst, HN. The influence of food preparation methods on the in- vitro
digestibility of starch in potatoes. Food Chemistry 1994;49:181-186.
Kinnear T, Wolever TMS, Murphy AM, Sullivan JA, Liu Q, Bizimungu B. Effect of preparation
method on the glycaemic index of novel potato clones. Food & Function 2011;8(2):438-
444.

86
Lehmann U, Robin F. Slowly digestible starch - its structure and health implications: a review.
Trends In Food Science and Technology 2007;18:346-55.
Liu S, Willett WC, Stampfer MJ, et al. A prospective study of dietary glycemic load,
carbohydrate intake, and risk of coronary heart disease in US women. American Journal
of Clinical Nutrition 2000;71:1455-61.
Liu S and Willett WC. Dietary glycemic load and atherothrombotic risk. Current Atherosclerosis
Reports 2002;4:454-461.
Liu Q, Tarn R, Lynch D, Skjodt NM. Physicochemical properties of dry matter and starch from
potatoes grown in Canada. Food Chemistry 2007;105:897-907.
Liu Q, Tarn R, Lynch D and Skjodt NM. Physicochemical properties of dry matter and starch
from potatoes grown in Canada. Food Chemistry 2007;105:897-907.
Liu Q, Weber E, Currie V and Yada R. Physicochemical properties of starches during potato
growth. Carbohydrate Polymers 2003;51:213-221
Leeman M, Östman E and Björck I. Glycaemic and satiating properties of potato products.
European Journal of Clinical Nutrition 2008;62:87-95.
Lutaladio N. Potato: The hidden treasure. Journal of Food Composition and Analysis
2009;22:491-3.

87
Lynch DR, Liu Q, Tarn TR, Bizimungu B, Chen Q, Harris P, Chik CL, Skjodt NM. Glycemic
Index- A review and implications for the potato industry. American Journal of Potato
Research 2007;84:179-190.
McKeown NM., Meigs JB, Liu, S, Saltzman E , Wilson, PWF, & Jacques PF. Carbohydrate
nutrition, insulin resistance, and the prevalence of the metabolic syndrome in the
framingham offspring cohort. Diabetes Care 2004;27(2):538-546.
Mishra S, Monro J, Hedderley D. Effect of Processing on Slowly Digestible Starch and Resistant
Starch in Potato. Starch - Stärke 2008;60:500-507.
Riccardi G, Clemente G, Giacco R. Glycemic Index of Local Foods and Diets: The
Mediterranean Experience. Nutrition Reviews 2003;61:S56-S60.
Riccardi G, Rivelellese AA & Giacco R. Role of the glycaemic index and glycaemic load in the
healthy state, in prediabetes, and in diabetes. American Journal of Clinical Nutrition
2008;87:269S-274S.
Ring, S. G., Gee, J. M., Whittam, M., Orford, P. D., & Johnson, I. T. (1988). Resistant starch: Its
chemical form in foodstuffs and effect on digestibility in vitro. Food Chemistry
1988;28:97-109.
Salmeron J, Ascherio A, Rimm EBSCD, et al. Dietary Fiber, Glycemic Load, and Risk of
NIDDM in Men. Diabetes Care 1997;20:545-50.

88
Singh J, Kaur L, McCarthy OJ.(2008) Potato Starch and its Modifications. In: Singh J and Kaur
L (Eds.) Advances in Potato Chemistry and Technology (pp. 83-98). Elsevier, Oxford,
UK.
Soh NL, Brand-Miller J. The glycaemic index of potatoes: the effect of variety, cooking method
and maturity. European Journal of Clinical Nutrition 1999;53:249-254.
Svegmark K, Helmersson K, Nilsson G, Nilsson P-, Andersson R, Svensson E. Comparison of
potato amylopectin starches and potato starches- influence of year and variety.
Carbohydrate Polymers 2002;47:331-40.
Tahvonen R, Hietanen RM, Sihvonen J, Salminen E. Influence of different processing methods
on the glycemic index of potato (Nicola). Journal of Food Composition and Analysis
2006;19:372-378.
Vega-López S, Ausman LM, Griffith JL and Lichtenstein AH. Inter-individual variability and
intra-individual reproducibility of glycemic index values for commercial white bread.
Diabetes Care 2007;30:1412-1417.
Willet WC, Manson J, Liu S. Glycemic index, glycemic load and risk of type 2 diabetes.
American Journal of Clinical Nutrition 2002;76:S274-S280.
Williams, PC, Kuzina, FD, Hlynka, I. A rapid colorimetric procedure for estimating the
amylose content of starches and flours. Cereal Chemistry 1970;47:411-420.
89
Williams SM, Venn BJ, Perry T, Brown R, Wallace A, Mann JI, Green TJ. Another approach to
estimating the reliability of glycaemic index. British Journal of Nutrition 2008;100:364–
372.
Wolever TMS Glycemic index vs glycemic response: non-synonymous terms. Diabetes Care
1992;15:1436-1437.
Wolever TMA and Bolognesi C. Source and amount of carbohydrate affect postprandial glucose
and insulin in normal subjects. Journal of Nutrition 1996;126:2798-2806.
Wolever TMS. The Glycaemic Index: A Physiological Classification of Dietary Carbohydrate.
Wallingford, UK: CABI, 2006.
Wong JM, de Souza R, Kendall CW, Emam A, Jenkins DJ. Colonic health: fermentation and
short chain fatty acids. Journal of Clinical Gastroenterology. 2006;40(3):235-243.
Wong, J. M. W., & Jenkins, DJA. Carbohydrate digestibility and metabolic effects. Journal of
Nutrition 2007;137(11):2539S-2546S.
Zhang G, Ao Z, Hamaker BR. Nutritional Property of Endosperm Starches from Maize Mutants:
A Parabolic Relationship between Slowly Digestible Starch and Amylopectin Fine
Structure. Journal of Agriculture and Food Chemistry 2008;56:4686-94.
Zhang, G, & Hamaker, BR. Slowly digestible starch: Concept, mechanism, and proposed
extended glycemic index. Critical Reviews in Food Science and Nutrition
2009;49(10):852-867.

90
Zhou Z, Topping DL, Morell MK and Bird AR. Changes in starch physical characteristics
following digestion of foods in the human small intestine. British Journal of Nutrition
2010;104:573-581.