the role of relaxin in left ventricular fibrosis...
TRANSCRIPT

THE ROLE OF RELAXIN IN LEFT VENTRICULAR FIBROSIS: ENDOGENOUS EXPRESSION AND THERAPEUTIC POTENTIAL
by
Jamie Lee Haney
B.S., Bioengineering, University of Pittsburgh, 2008
Submitted to the Graduate Faculty of
Swanson School of Engineering in partial fulfillment
of the requirements for the degree of
Doctor of Philosophy
University of Pittsburgh
2014

UNIVERSITY OF PITTSBURGH
SWANSON SCHOOL OF ENGINEERING
This dissertation was presented
by
Jamie Lee Haney
It was defended on
November 11th, 2014
and approved by
Harvey S. Borovetz, Ph.D. Distinguished Professor and Former Chair, Department of Bioengineering
Charles F. McTiernan, Ph.D. Research Associate Professor, Department of Medicine
David S. Schwartzman, M.D. Professor of Clinical and Translational Science, Department of Medicine
Yadong Wang, Ph.D. William Kepler Whiteford Professor, Department of Bioengineering
Dissertation Director: Sanjeev G. Shroff, Ph.D. Chair, Distinguished Professor, and Gerald McGinnis Chair, Department of Bioengineering
ii

Copyright © by Jamie Lee Haney
2014
iii

Currently, there is a largely unmet need for therapeutic strategies to combat diastolic heart
failure. The prevention and reversal of left ventricular (LV) fibrosis, a known contributor to
diastolic dysfunction, may provide a solution for this clinical problem. Relaxin, via activation of
its primary receptor RXFP-1, blocks collagen synthesis and enhances collagen degradation and
thus, is a potent antifibrotic agent. The work presented here tested the hypotheses that the natural
relaxin receptor-ligand system is upregulated in the fibrotic LV with diastolic dysfunction and
exogenous relaxin administration can reverse LV fibrosis and restore diastolic function.
Several rat models of age- and hypertension-associated LV fibrosis were studied: young
versus aged spontaneously hypertensive rats (SHR), normotensive Wistar-Kyoto rats (WKY)
versus SHR, and control Sprague-Dawley (SD) rats versus renin overproducing transgenic
(MREN) rats. An upregulation of the endogenous relaxin receptor-ligand system determined by
quantitative real-time PCR was present in each of the fibrotic animal models, specifically a ~2-
4.5 fold increase in mRNA expression of RXFP-1 and a tendency towards increased relaxin
expression (~1.5 fold).
In the MREN rat model, this endogenous upregulation of the relaxin receptor-ligand
system occurred in parallel with significantly elevated LV mRNA expression of known fibrotic
biomarkers (TGFβ, BNP, and MMP2), suggesting an adaptive response. MREN rats also
exhibited significant LV hypertrophy, fibrosis, and diastolic dysfunction (increased LV and
THE ROLE OF RELAXIN IN LEFT VENTRICULAR FIBROSIS: ENDOGENOUS EXPRESSION AND THERAPEUTIC POTENTIAL
Jamie Lee Haney, Ph.D.
University of Pittsburgh, 2014
THE ROLE OF RELAXIN IN LEFT VENTRICULAR FIBROSIS: ENDOGENOUS EXPRESSION AND THERAPEUTIC POTENTIAL
Jamie Lee Haney, Ph.D.
University of Pittsburgh, 2014
iv

myocardial passive stiffness and slowed relaxation), while systolic function was unaltered.
Administration of recombinant human relaxin (rhRLX, 0.5 mg/kg/day for 14 days) to MREN
rats did not affect hypertension or hypertrophy. However, rhRLX administration significantly
reversed mRNAs of fibrotic biomarkers and RXFP-1 and LV fibrosis in MREN rats. These
changes were associated with significantly reduced passive stiffness and this beneficial effect
was consistent even under the condition of stress (increased heart rate). In contrast, rhRLX
administration did not alter LV relaxation.
We conclude that the endogenous LV relaxin receptor-ligand system exerts an adaptive
response in a fibrotic environment. The ability of exogenous relaxin administration to reverse LV
fibrosis and improve diastolic function may provide a novel strategy for treating diastolic heart
failure.
v

TABLE OF CONTENTS
ACKNOWLEDGEMENTS .................................................................................................... XIV
1.0 INTRODUCTION................................................................................................................ 1
1.1 LEFT VENTRICULAR FIBROSIS AND DIASTOLIC DYSFUNCTION ............ 2
1.1.1 Animal Models of Diastolic Dysfunction ....................................................... 4
1.2 RELAXIN ...................................................................................................................... 5
1.3 MYOCARDIAL COLLAGEN REGULATION: A ROLE FOR RELAXIN ......... 6
1.4 EXOGENOUS RELAXIN AS AN ANTIFIBROTIC THERAPY ........................... 9
2.0 HYPOTHESES .................................................................................................................. 11
3.0 SPECIFIC AIMS ............................................................................................................... 12
4.0 MATERIALS AND METHODS ...................................................................................... 13
4.1 ENDOGENOUS RELAXIN RECEPTOR-LIGAND EXPRESSION IN AN
ENVIRONMENT OF FIBROSIS ..................................................................................... 13
4.1.1 Animals ........................................................................................................... 13
4.1.2 Isolation of Left Ventricular Total RNA ..................................................... 14
4.1.3 Reverse Transcription of RNA to Complimentary DNA ........................... 15
4.1.4 Quantitative Real-Time PCR ....................................................................... 16
4.2 ASSESSMENT OF LV FIBROSIS AND DIASTOLIC DYSFUNCTION IN
RELAXIN-TREATED RATS ........................................................................................... 18
vi
4.2.1 Animals ........................................................................................................... 18
4.2.2 Administration of Recombinant Human Relaxin (rhRLX) ....................... 18
4.2.3 Experimental Design Overview .................................................................... 19
4.2.4 Gene-Level Expression of Fibrosis ............................................................... 19
4.2.5 Protein-Level Expression of Fibrosis ........................................................... 20
4.2.5.1 Left Ventricular Cross-Sections ........................................................ 21
4.2.5.2 Picrosirius Red Staining ..................................................................... 21
4.2.5.3 Brightfield Microscopy ....................................................................... 21
4.2.5.4 Image Processing and Analysis .......................................................... 22
4.2.6 Non-Invasive Blood Pressure Measurement ............................................... 24
4.2.7 Whole Heart-level Measurement of LV Function ...................................... 25
4.2.7.1 Animal Preparation ............................................................................ 25
4.2.7.2 Isolated Perfused Heart Preparation ................................................ 26
4.2.7.3 Frank-Starling Protocol ..................................................................... 26
4.2.7.4 Pacing Trials ........................................................................................ 27
4.2.7.5 Analysis of Left Ventricular Function .............................................. 27
4.2.8 Heart Weights and Tibia Lengths ................................................................ 29
4.3 STATISTICAL ANALYSES ..................................................................................... 30
4.3.1 Expression of Endogenous Relaxin Receptor-Ligand System ................... 30
4.3.2 Assessment of LV Fibrosis and Cardiac Function ..................................... 30
4.3.3 Left Ventricular Function Relationships ..................................................... 31
5.0 RESULTS ........................................................................................................................... 33
vii

5.1 ENDOGENOUS RELAXIN RECEPTOR-LIGAND EXPRESSION IN AN
ENVIRONMENT OF FIBROSIS ..................................................................................... 33
5.1.1 Endogenous Relaxin Expression in Transgenic MREN Rats .................... 33
5.1.2 Endogenous Relaxin Expression in Hypertensive SHR Rats .................... 35
5.1.3 Endogenous Relaxin Expression in Age-Associated LV Fibrosis ............. 37
5.1.4 Summary ........................................................................................................ 39
5.2 ASSESSMENT OF LV FIBROSIS AND DIASTOLIC DYSFUNCTION IN
RELAXIN-TREATED RATS ........................................................................................... 39
5.2.1 Administration of rhRLX in Experimental Treatment Groups ............... 40
5.2.2 Hypertension and Hypertrophy in rhRLX-Treated MREN Rats............. 41
5.2.3 Gene-Level Expression of Fibrosis in Relaxin-Treated Rats..................... 43
5.2.4 Interstitial and Perivascular Fibrosis in Relaxin-Treated Rats ................ 45
5.2.5 Contractility Parameters in Relaxin-Treated Rats .................................... 48
5.2.6 Diastolic Function in Relaxin-Treated Rats ................................................ 53
5.2.7 Summary ........................................................................................................ 61
6.0 DISCUSSION ..................................................................................................................... 63
6.1 ENDOGENOUS RELAXIN IN AN ENVIRONMENT OF FIBROSIS ................ 63
6.1.1 Relaxin Isoforms in the Rat Left Ventricle ................................................. 64
6.1.2 Adaptive Upregulation of Endogenous Relaxin in Hypertension-
Associated Fibrosis ..................................................................................................... 65
6.1.3 Adaptive Upregulation of Endogenous Relaxin in Aging-Associated
Fibrosis ........................................................................................................................ 67
6.1.4 Relaxin: A Natural Player in Cardiac Fibrosis........................................... 67
viii
6.2 EXOGENOUS RELAXIN ADMINISTRATION REVERSES LV FIBROSIS
AND IMPROVES DIASTOLIC FUNCTION ................................................................. 68
6.2.1 Gene-Level Regulation of Fibrotic Biomarkers .......................................... 69
6.2.2 Reversal of Interstitial and Perivascular Fibrosis ...................................... 71
6.2.3 Left Ventricular Contractility ...................................................................... 72
6.2.4 Improvements to Diastolic Function ............................................................ 72
6.2.5 Targeted Effects of Relaxin to Fibrotic Environment ................................ 74
6.2.6 Study Limitations .......................................................................................... 74
7.0 TAKE HOME MESSAGES .............................................................................................. 77
8.0 FUTURE DIRECTIONS ................................................................................................... 78
8.1 COMBINATION THERAPIES ................................................................................ 78
8.1.1 Exogenous Relaxin and Anti-Hypertensive Medication ............................ 79
8.1.2 Exogenous Relaxin and Anti-Inflammatory Medication ........................... 80
8.2 FUNCTIONAL STUDIES AT THE LEVEL OF CARDIOMYOCYTES............ 81
APPENDIX A .............................................................................................................................. 83
APPENDIX B .............................................................................................................................. 90
APPENDIX C .............................................................................................................................. 95
APPENDIX D ............................................................................................................................ 102
APPENDIX E ............................................................................................................................ 104
APPENDIX F ............................................................................................................................ 109
BIBLIOGRAPHY ..................................................................................................................... 127
ix
LIST OF TABLES
Table 1. Functional effects of rhRLX administration in models of HHD and LV fibrosis .......... 10
Table 2. Gene-specific endogenous relaxin primer assays for qPCR experiments ...................... 17
Table 3. Gene-specific fibrotic biomarker primer assays qPCR experiments .............................. 20
Table 4. General Characteristics of SD and MREN ..................................................................... 34
Table 5. General Characteristics of WKY and SHR..................................................................... 36
Table 6. General Characteristics of young and aged SHR............................................................ 38
Table 7. Hypertension in the SHR rat ........................................................................................... 84
Table 8. Blood pressures in the WHAN normotensive rat ........................................................... 96
Table 9. Error Propagation in Interstitial Collagen:Total Tissue Area Ratio Calculation .......... 106
Table 10. Error Propagation in RXFP-1 Gene Expression Calculation...................................... 108
x

LIST OF FIGURES
Figure 1. Antifibrotic pathways of relaxin [27] .............................................................................. 8
Figure 2. Image processing for collagen:total tissue area ratio calculation .................................. 23
Figure 3. Image processing for perivascular collagen:lumen area ratio calculation..................... 24
Figure 4. Sample output from isolated heart experiments ............................................................ 28
Figure 5. Tissue-level myocardial fibrosis in transgenic MREN vs. SD rats ............................... 34
Figure 6. Endogenous relaxin expression in transgenic MREN vs. SD rats ................................. 35
Figure 7. Tissue-level myocardial fibrosis in aged SHR vs. aged WKY rats ............................... 36
Figure 8. Endogenous relaxin expression in aged SHR vs. aged WKY rats ................................ 37
Figure 9. Endogenous relaxin expression in young SHR vs. aged SHR....................................... 38
Figure 10. Circulating levels of rhRLX in experimental treatment groups .................................. 41
Figure 11. Hypertension and heart rate measurements in the MREN rat ..................................... 42
Figure 12. LV hypertrophy in the MREN rat ............................................................................... 43
Figure 13. Expression of profibrotic biomarkers .......................................................................... 44
Figure 14. Endogenous relaxin expression in rhRLX-treated MREN .......................................... 45
Figure 15. Picrosirius red staining ................................................................................................ 47
Figure 16. Regional quantification of picrosirius red staining ..................................................... 48
Figure 17. Peak-pressure volume relationships in MREN rat ...................................................... 49
Figure 18. Developed-pressure volume relationships ................................................................... 50
xi

Figure 19. Developed stress-midwall strain relationships ............................................................ 51
Figure 20. Maximal rate of pressure development ....................................................................... 52
Figure 21. Rise time ...................................................................................................................... 53
Figure 22. V0 values for all experimental groups ......................................................................... 54
Figure 23. End-diastolic pressure-volume relationships ............................................................... 55
Figure 24. End-diastolic stiffness coefficient-pressure relationship ............................................. 56
Figure 25. End-diastolic stress-midwall strain relationship .......................................................... 57
Figure 26. End-diastolic stress-strain stiffness coefficient ........................................................... 58
Figure 27. Maximal rate of pressure relaxation ............................................................................ 59
Figure 28. Relaxation time ............................................................................................................ 60
Figure 29. End-diastolic function in pacing studies...................................................................... 61
Figure 30. Circulating levels of rhRLX in SHR rat model ........................................................... 84
Figure 31. Fibrotic biomarker expression in rhRLX-treated SHR ............................................... 85
Figure 32. Tissue-level LV fibrosis in rhRLX-treated SHR ......................................................... 86
Figure 33. Kinetic properties of contraction in rhRLX-treated SHR ............................................ 87
Figure 34. Kinetic properties of relaxation in rhRLX-treated SHR .............................................. 88
Figure 35. EDPVR in rhRLX-treated SHR................................................................................... 88
Figure 36. Gene-level fibrosis in SHR after variable rhRLX treatment durations ....................... 91
Figure 37. Tissue-level fibrosis in SHR after variable rhRLX treatment durations ..................... 92
Figure 38. End-diastolic function in SHR after variable rhRLX treatment durations .................. 93
Figure 39. Heart weights in the normotensive WHAN rats .......................................................... 96
Figure 40. Regional collagen quantification in rhRLX-treated normotensive rats ....................... 97
Figure 41. PPVR for rhRLX-treated normotensive rats ............................................................... 98
xii

Figure 42. DevPVRs for rhRLX-treated normotensive rats ......................................................... 98
Figure 43. Kinetic properties of contraction for rhRLX-treated normotensive rats ..................... 99
Figure 44. EDPVRs for rhRLX-treated normotensive rats ........................................................... 99
Figure 45. Kinetic properties of relaxation for rhRLX-treated normotensive rats ..................... 100
Figure 46. V0 values for rhRLX-treated normotensive rats ........................................................ 100
xiii

ACKNOWLEDGEMENTS
I would like to thank my co-advisors, Dr. Sanjeev Shroff and Dr. David Schwartzman for
their continued guidance and support throughout the process of this work. Despite all challenges
or unexpected circumstances, you have encouraged me to be resourceful and helped me to
establish an unwavering perseverance. I particularly appreciate the mentorship from Dr. Shroff
as I pursued my professional development – you have always considered my best interests and
inspired me to excel. I would also like to express gratitude towards the rest of my committee: Dr.
Charlie McTiernan, Dr. Harvey Borovetz, and Dr. Yadong Wang, for their invaluable time and
advice while completing this work of which I am very proud.
I owe everything I have learned about the methods and techniques I used to complete this
work to my friends in the Cardiovascular Systems Laboratory (past and present): Caroline Evans,
Steve Smith, and Jonathan Kirk. It has been an absolute pleasure working with you over the last
6 years and I will always hold you in the highest regard. And thank you to my undergraduate
research assistants: Karuna, Casey, Sagar, and Riddhi, who have helped me with my experiments
but more importantly, provided a refreshing reminder of the excitement of research.
I would like to thank the people who have helped me with the less glamorous aspects of
animal research – Dave Fischer and Judy Thoma who expertly navigated me through everything
surgical required for the animal experiments, Dr. Jasmina Varagic and Jessica VonCannon at
xiv

Wake Forest University for so generously contributing their time and efforts so that I could use
the MREN rat model at Pitt. Above all, thank you to the rats, so many rats.
I would like to acknowledge the sources of funding that have supported me to complete
my research and graduate tenure – the Swanson School of Engineering Department of
Bioengineering, the McGinnis Chair Endowment, the National Institutes of Health, and the
National Science Foundation.
Finally, I want to thank my family and friends who have given me their unconditional
love and support. Mom, Jim, Carolyn, James, Alyssa, and Micky – you all make me so happy
and proud on a daily basis. They say, “You can’t pick your family”, but in our case, I am glad
that our parents picked each other. I love us. Aunt Annie, whether or not I like to admit it, you
have been the driving force behind all of my most-prized academic accomplishments. “Thank
you” is an understatement. I appreciate all my friends in Pittsburgh and in Bethlehem who have
always bent an ear for me and expressed genuine (?) excitement about the research I was
conducting. I especially appreciate Jon for his hugs when I was anxious, his pep talks when I felt
defeated, and his unending confidence in me; you helped me reach the finish line.
Finally, I would like to take a moment to appreciate the most loyal and loving cheerleader
in my life, my sister Micky. You are never far away when I need you and you always have a way
of putting me at ease when I am stressed (sometimes the other way around). You are my best
friend and I love you, you have no idea how much you inspire me. I would like to dedicate this
work to the memory of our dad, Jim Haney. I hope that my small contributions can make an
impact on improving heart disease outcomes for all the other dads out there.
xv

1.0 INTRODUCTION
Heart failure is a serious epidemic affecting 5.1 million people in the United States, half of
whom die within 5 years of diagnosis [1]. Heart failure occurs when the left ventricle (LV) is
unable to adequately supply oxygenated blood to tissues of the body either by reduced pumping
ability (systolic heart failure) or by impaired capacity for filling (diastolic heart failure), or both.
The most commonly used determinant of systolic heart failure is reduced ejection fraction
(measured by noninvasive echocardiography). However, nearly half of heart failure patients have
preserved ejection fraction but severe diastolic dysfunction defined as increased LV passive
stiffness and poor ventricular relaxation. This cohort seems to be increasing in number because
of aging of the general population and increasing prevalence of pathological precursors to
diastolic dysfunction, such as hypertension [2]. Despite therapeutic developments to improve
systolic function, there is still a largely unmet need for effective therapy to improve diastolic
function [3]. A primary cause of diastolic heart failure is hypertensive heart disease (HHD),
which results in significant LV hypertrophy and fibrosis [4, 5]. While clinical evidence has
shown that antifibrotic therapies hold the potential for improving diastolic function, there are
currently no clinically available treatment options specific to LV fibrosis [6, 7].
1
1.1 LEFT VENTRICULAR FIBROSIS AND DIASTOLIC DYSFUNCTION
Heart tissue is made up of contractile cardiomyocytes, fibroblasts, vascular structures, and
extracellular matrix proteins (primarily collagen) and its material properties and ability to
function depend greatly on its compositional environment. The development of LV fibrosis
occurs when mature, cross-linked collagen accumulates within the myocardium, causing
compositional remodeling of the heart tissue. By mechanisms which remain unclear, the natural
process of aging results in the loss of collagen regulation (accelerated synthesis outweighs
degradation), and certain pathologies – such as hypertension – exacerbate this response.
Hypertension contributes to LV fibrosis through mechanical and chemical mechanisms that
ultimately result in diastolic dysfunction.
In response to hypertension, increases in cardiac mechanical work force compositional
remodeling. Increased LV wall stress is compensated by an increase in the size of cardiomyocyte
contractile units and LV wall thickness to improve contractile function of the LV against the
elevated afterload. To prevent ventricular deformation (ie. dilation), collagen production is
stimulated by activated fibroblasts to increase the tensile strength of the LV and transmit the
contractile force from the cardiomyocytes to the entire ventricle [8]. When the LV is subjected to
prolonged cardiac work, these physiological responses to hypertension can develop into
pathological hypertrophy and LV fibrosis, the major contributors to diastolic dysfunction.
In addition to its mechanical contributions, hypertension stimulates cardiomyocyte
hypertrophy and LV fibrosis through chemical means by inducing a systemic proinflammatory
state that has downstream effects on myocardial structure and function. According to a recently
proposed paradigm, hypertension (among other comorbidities of heart failure) induces a
proinflammatory state that causes inflammation in the perivascular endothelium and reduces the
2

bioavailability and activity of important myocardial cytokines [9]. Reduced bioavailability of
nitric oxide (NO), cyclic guanosine monophosphate (cGMP) content, and protein kinase G
(PKG) activity results in cardiomyocyte hypertrophy and stiffness that disrupts their ability to
actively relax to an unstressed length and force during diastole [8, 10]. Additionally,
inflammatory cells and ventricular fibroblasts are known to release the profibrotic cytokine,
transforming growth factor-beta (TGFβ), which activates the transition of fibroblasts to their
high collagen-yielding myofibroblast form, upregulates the gene encoding for collagen
production, and facilitates the cross-linking between mature collagen fibers, further driving LV
fibrosis [11]. Mechanisms are naturally in place for collagen degradation where proteinases
called MMPs break apart the collagen network and degrade the collagen fibers. This system is
highly regulated and includes multiple MMPs with specific roles and inhibitors to the MMPs
called TIMPs. In a fibrotic environment, however, collagen regulation is off balance in favor of
collagen synthesis, mostly involving pathways downstream of TGFβ.
Together, LV fibrosis and structural and functional changes to cardiomyocytes lead to
increased passive stiffness and impaired LV relaxation, which are hallmark of diastolic
dysfunction. An overabundance of myocardial collagen and increased cross-linking between
fibers has detrimental effects on LV passive stiffness properties that affect the end-diastolic
pressure-volume relationship (EDPVR) [10]. In a hypertensive and fibrotic environment,
molecular mechanisms are at play that act on cardiomyocyte cellular mechanics to delay active
relaxation, and this is especially apparent at higher heart rates where the cardiac cycle time is
shortened. By the mechanisms described here, it appears that blocking collagen production
downstream of TGFβ and returning NO to the system may be most beneficial for preventing and
reversing diastolic dysfunction. The active and passive components of diastolic dysfunction have
3

been studied in several animal models of hypertension and LV fibrosis to elucidate potential
targets for therapeutic intervention.
1.1.1 Animal Models of Diastolic Dysfunction
The heterozygous transgenic (mREN2)27 rat (MREN), which exhibits an overactive renin-
angiotensin system (RAS), is a model of severe hypertension and LV hypertrophy that has been
shown to develop LV fibrosis as early as 8 weeks of age [12, 13]. The MREN model was created
in 1990 by Mullins et al. by introducing the mouse REN-2 gene into the germline of
normotensive Sprague-Dawley (SD) rats [12]. The overexpression of renin in this model drives
the production of angiotensin-II (ATII) by the activated RAS, which results in LV hypertrophy
and hypertension through vasoconstriction, fluid retention, and facilitation of catecholamine
release [14]. Furthermore, diastolic dysfunction has been identified in this model compared to its
species-background SD control as early as 12 weeks of age.
A long-standing and widely utilized animal model of hypertension, the spontaneously
hypertensive rat (SHR), has been bred for a predisposition to hypertension. In this model,
hypertension (defined as systolic blood pressures > 150 mmHg) develops after 14 weeks of age
and, similar to human hypertension, develops more rapidly and severely in males [15]. As in
diastolic heart failure, normal cardiac output is maintained in these animals presumably due to a
compensated hypertrophic response that increases cardiac contractility [16, 17]. Compared to
normotensive Wistar-Kyoto (WKY) control rats, adult SHR (~12 months of age) manifest
diastolic dysfunction as impaired active relaxation as well as increased passive stiffness [17]
which worsens as heart failure develops after 18 months of age [18]. The SHR model has been a
major source of information for HHD and heart failure pathophysiology, but a common criticism
4

is the indeterminate origin of their hypertension and the advanced age required to manifest heart
failure conditions. Particularly, comparing SHR to outbred normotensive WKY controls results
in a wide variation in disease effects secondary to hypertension [19].
1.2 RELAXIN
An emerging player in diastolic heart failure research and antifibrotic collagen regulation is the
naturally occurring peptide hormone relaxin [3, 20, 21]. Relaxin, once known as a pregnancy
hormone, has shown promise as an antifibrotic hormone in multiple organ systems in both males
and females [22-26]. Humans express three isoforms of relaxin: H1 and H2 relaxin have
historically been associated with reproductive physiology while the gene for H3 relaxin has been
localized to the brain and testis [27, 28]. In 2001, a study using human failing heart tissue
showed that circulating serum levels as well as myocardial gene expression of H2 relaxin was
significantly elevated, suggesting an involvement of the relaxin system in a situation of cardiac
distress [29].
Rodents express two homologs of the three known human relaxin genes corresponding to H2 and
H3 and termed relaxin-1 (Rln1) and relaxin-3 (Rln3), respectively. Relaxin-1 and relaxin-3
ligands bind with their primary G-protein coupled membrane receptor, RXFP-1, in multiple cell
types leading to the stimulation of several downstream antifibrotic signaling pathways [30]. Mice
lacking the Rln1 gene (Rln-/-) have demonstrated an age-dependent increase in lung [31], renal
[32], and LV fibrosis [33]. Du, et al. provided evidence that relaxin-1 deficiency results in
elevated myocardial collagen accumulation and impaired diastolic filling [33]. In rat ventricular
fibroblasts, relaxin receptor-ligand binding has been associated with a reduction in profibrotic
5

cytokine release, inhibition of fibroblast to myofibroblast transformation, increases in expression
and activity of collagen-degrading matrix metalloproteinases (MMPs) and decreases in
expression of tissue inhibitors to MMPs (TIMPs), among other antifibrotic actions that control
collagen turnover [23]. These studies support the necessity for a functioning endogenous relaxin
receptor-ligand system as a regulator of collagen turnover and proper LV diastolic function.
1.3 MYOCARDIAL COLLAGEN REGULATION: A ROLE FOR RELAXIN
Several in vitro and in vivo studies have been reviewed which provide insight regarding the
antifibrotic cellular mechanisms associated with relaxin [20, 27, 30, 34]. It has been postulated
that relaxin ligands interact with RXFP-1 to antagonize fibrotic pathways by both inhibiting
collagen synthesis and stimulating collagen degradation. The major contributor to fibrotic
collagen accumulation is the transition of cardiac fibroblasts to their myofibroblast form that is
facilitated by the cytokine TGFβ and its downstream Smad signaling cascade. The antifibrotic
interference of relaxin receptor-ligand binding on this myofibroblast differentiation has been
confirmed in several cell types and linked to simultaneous pathways in which collagen is
degraded by activated MMPs [20].
In an early pioneer study by Samuel et al., rat ventricular fibroblasts were found to elicit
a temporary and biphasic rise in cAMP upon relaxin stimulation [23] and since, this cAMP-
mediated pathway has been the most extensively investigated for RXFP-1 signaling [34]. It has
been reviewed that the initial phase of the biphasic cAMP accumulation observed upon receptor
stimulation is a combination of GαS-mediated cAMP accumulation and GαOB-mediated cAMP
inhibition. The second phase then occurs, involving downstream Gβγ, released from recruited
6

Gαi3 proteins, to stimulate phosphatidylinositol 3 kinase (PI3K) and protein kinase C (PKC)
activation [30]. Activated PKC is capable of translocating to the membrane of cardiac fibroblasts
to activate adenylate cyclase (AC), which produces the second phase of cAMP accumulation.
The primary effector of intracellular cAMP is activated protein kinase A (PKA), which
phosphorylates signaling proteins involved with various gene transcription mechanisms
including those related to fibrosis.
The MAPK pathway is another pathway activated by RXFP-1. In rat renal myofibroblasts
there is a rapid and sustained increase in ERK1/2 phosphorylation that is associated with the
anti-apoptotic action of relaxin in rat cardiomyocytes [35, 36]. Relaxin binding to RXFP-1 has
also been associated with two other possible pathways that lead to increased nitric oxide (NO)
synthesis [30, 36]. In one pathway, Akt is stimulated by activated PI3K and intracellular NO is
produced by activated endothelial NO synthase (eNOS). In another, activated PKA can block
gene transcription of NOSII which upregulates the inhibitor of NO synthase (iNOS) via nuclear
transcription factors (IκB, NFκB) [37]. The importance of NO production in response to
activated RXFP-1 was originally associated strictly with relaxin’s known vasodilatory action but
has since been implicated in the differentiation of renal myofibroblasts [36] and the upregulation
of matrix metalloproteinases [38]. The work by Mookerjee et al. provided evidence that NO is
involved in the nNOS–NO–cGMP pathway, which results in the inhibition of Smad2
phosphorylation and nuclear translocation (by formation of the Smad2/3 complex) that is
necessary for TGFβ signaling. This in turn inhibits the TGFβ-mediated transition of cardiac
fibroblasts to myofibroblasts and stunts collagen production. In 2012, Ahmad et al. showed that
increased NO production may also drive the collagen degradation pathway by upregulation of
7

MMP-9 through the P13K, ERK1/2, and Akt pathways [39]. These collective findings were
mapped out by Bathgate et al. and illustrated in Figure 1.
Figure 1. Antifibrotic pathways of relaxin [27]
8

1.4 EXOGENOUS RELAXIN AS AN ANTIFIBROTIC THERAPY
Recent suggestions that the endogenous relaxin receptor-ligand system behaves in a way to
regulate collagen and reduce fibrosis targets this hormone as a potential therapy [40].
Administration of recombinant human relaxin (rhRLX) via osmotic minipump for 14 days
reverses established LV fibrosis in several models of hypertension and heart failure, including
SHR [41], transgenic MREN rats with experimental diabetes [42], mice overexpressing β2-
adrenergic receptors (β2-TG) and hence developing fibrotic cardiomyopathy [23], and relaxin-1
deficient mice (Rln−/−) mice [23].
At the cellular level, it has been established in vitro that rat atrial and ventricular
fibroblasts, which express the RXFP-1 receptor, show a reduced fibrotic phenotype in response
to administration of rhRLX [23]. In this study, Samuel, et al. stimulated plated fibroblasts with
profibrotic factors (TGFβ or ATII) and observed the expected transition of the fibroblasts to
myofibroblasts accompanied by increased collagen synthesis and accumulation. When
exogenous relaxin was added to the medium, the fibrotic phenotype was reversed; fibroblast
proliferation and differentiation was reduced, collagen overexpression was decreased, and MMP
expression was elevated. Additionally, a study by Hossain, et al. suggests that relaxin-3 may
enhance the antifibrotic effects of exogenous relaxin through its action on the RXFP-1 receptor
in rat ventricular fibroblasts [43]. Evidence from these in vitro studies confirm that the collagen
regulation effect of exogenous relaxin administration involves both a decrease in collagen
synthesis as well as an increase in degradation, but specifics surrounding this mechanism remain
unclear.
When the antifibrotic potential of exogenous relaxin was tested at the cardiac tissue and
whole animal levels of organization, true therapeutic potential became evident. Lekgabe, et al.
9

showed that excessive LV interstitial collagen deposition was reversed in adult SHR that had
received 14 days of rhRLX administration [41]. Evidence is often incomplete or not available
regarding effects of exogenous relaxin administration on functional outcomes in the LV relating
to reduced active relaxation or passive stiffness. Table 1 was adapted from Du, et al. as a review
of the major findings and research gaps in recent exogenous relaxin administration studies [40].
Table 1. Functional effects of rhRLX administration in models of HHD and LV fibrosis
Model Fibrosis Functional outcome(s) Reference
Isoproterenol-induced cardiac injury (rats) Reduced
Improved ventricular contractility and lowered LV
end-diastolic pressure [44]
Myocardial infarction (mice)
Reduced scar density Unchanged
Samuel CS, et al., unpublished
data Fibrotic cardiomyopathy (β2-TG mice) Reduced Not determined [23]
SHR (9 months old) Reduced Unchanged [41]
SHR (18 months old) Unchanged Unchanged Xu Q, et al., unpublished data
Rln-/- mice Reduced Not determined [23]
Diabetic MREN rats Reduced Partially improved LV diastolic function by echocardiography [42]
Despite promising in vitro and in vivo evidence that rhRLX administration can prevent
and reverse fibrotic collagen accumulation in established models of hypertension and LV
fibrosis, there is a general lack of information towards relaxin’s therapeutic potential to restore
diastolic function in these models.
10

2.0 HYPOTHESES
The current understanding that relaxin binding and activating its primary receptor RXFP-1 has
downstream effects to block collagen synthesis and stimulate collagen degradation suggests an
antifibrotic mechanism for the endogenous relaxin receptor-ligand system. We postulate that this
system is naturally adaptive in animal models of hypertension and aging with established LV
fibrosis and diastolic dysfunction. Furthermore, we propose that exogenous administration of
recombinant human relaxin (rhRLX) will therapeutically reverse established LV fibrosis and
improve diastolic function. Based on these postulates, we developed the following specific aims
to determine the role of relaxin in LV fibrosis and diastolic dysfunction focusing on endogenous
expression of the relaxin receptor-ligand system and therapeutic effects of exogenous rhRLX
administration.
11
3.0 SPECIFIC AIMS
Hypothesis 1. Endogenous relaxin receptor-ligand system expression is upregulated with LV
fibrosis in animal models of hypertension and aging.
Specific Aim 1A. To quantify the mRNA expression of relaxin message (relaxin-1 and
relaxin-3) and receptor (RXFP-1) in LV tissue from two rat models of hypertension-associated
LV fibrosis: Transgenic MREN vs. normotensive SD controls and aged SHR vs. aged,
normotensive WKY controls.
Specific Aim 1B. To quantify the mRNA expression of relaxin message (relaxin-1 and
relaxin-3) and receptor (RXFP-1) in LV tissue from young SHR compared to aged SHR as a
model of age-associated LV fibrosis.
Hypothesis 2. Exogenous administration of recombinant human relaxin (rhRLX) can inhibit
and reverse LV fibrosis and restore diastolic function in hypertensive rats.
Specific Aim 2. To determine the effect of exogenous relaxin administration on
established LV fibrosis and diastolic dysfunction in transgenic MREN rats compared to
normotensive SD controls.
12

4.0 MATERIALS AND METHODS
4.1 ENDOGENOUS RELAXIN RECEPTOR-LIGAND EXPRESSION IN AN
ENVIRONMENT OF FIBROSIS
Gene-level expression of endogenous relaxin peptides was measured by quantitative real-time
PCR (qPCR). By this two-step method, LV tissue is purified to total RNA and reverse
transcribed to complimentary DNA (cDNA) that is used as template material for amplification
and quantification of genes of interest (GOI). For Aims 1A and 1B, gene expression of relaxin
peptides from experimental fibrosis groups is expressed relative to healthy controls. The
procedure for qPCR is also used for Aim 2 where gene expression of fibrotic biomarkers from
experimental treatment groups is expressed relative to healthy controls.
4.1.1 Animals
To understand the effects of aging and disease on the endogenous expression of relaxin peptides,
three experimental models of hypertension- and aging-associated LV fibrosis were used and
compared to their respective healthy controls. Pilot studies conducted in our lab demonstrated
that gene expression of a known profibrotic biomarker (TGFβ) was significantly increased in
hypertensive SHR compared with healthy WKY controls; we used the results of this study to
determine the statistical power and sample size required for the following experiments. From this
13

pilot study, we determined that an effect size of 1.882 was reasonably likely to predict a
difference in a sample of 16 (n=8 animals/group) when the difference exists in the population to
80% certainty. Based on this finding and in anticipation of pre-completion mortality rate within
group of 20%, at least 6 rats per group was reasonable to support detection of significant
differences at a P-value of 0.05.For hypertension-associated fibrosis, the mRen2(27) transgenic
rat model (MREN, n=13) aged ~4 months was compared to species-background, age-matched
Sprague-Dawley controls (SD, n=6). As a second model of hypertension-associated fibrosis,
aged SHR (~12 months, n=11) were compared to sex- and age-matched, normotensive Wistar-
Kyoto (WKY, n=9) controls. Young SHR (~4 months, n=8) were also compared to aged SHR as
a model of age-associated fibrosis. All animals used in the study were male. Transgenic MREN
rats were provided by Dr. Jasmina Varagic and the Hypertension and Vascular Research Center
at Wake Forest University (Winston-Salem, NC), all other species were purchased from Charles
River Laboratories (Wilmington, MA).
4.1.2 Isolation of Left Ventricular Total RNA
Total RNA was purified from frozen LV tissue using the miRNeasy Mini Kit (Qiagen, Inc.,
Valencia, CA). Briefly, 50 mg of tissue was isolated from frozen, basal LV cross-sections and
submerged in lysis buffer (phenol/guanidine-based) and subjected to mechanical disruption with
a Tissue Tearor homogenizer (BioSpec, Bartlesville, OK). Homogenized tissue lysate was
centrifuged and the aqueous, RNA-containing partition was applied to an RNeasy Mini Spin
Column where RNA binds to the membrane and other contaminants are washed away and
discarded. After multiple washing steps, the total RNA was eluted with 50 μl of RNase-free
water and the concentration was quantified using a spectrophotometer.
14

The total RNA eluent for each sample was diluted 1:20 in RNase-free water and
absorbance at 260 nm wavelength (A260) was measured using a Visible Spectrophotometer (Cole
Parmer, Vernon Hills, IL). Wavelength correction was performed at 280 nm (A280) and all
samples were adjusted by a blank sample absorbance containing RNase-free water alone. To
insure that the nucleic acid preparation was sufficiently free from protein contamination, all
samples were required to satisfy A260 > 0.15 and RNA purity (A260 /A280 ) > 1.8. These
measurements were based on the report by Glasel et al. which describes that ratio values lower
than 1.8 indicate the presence of protein, phenol, or other contaminants that absorb strongly near
280 nm [45]. Total RNA absorbance was converted to concentration by the equation: A260
reading of 1 = 44 μg/ml RNA based on the miRNeasy Handbook. Total RNA obtained by this
method was used as template material for reverse transcription to cDNA used for qPCR
experiments in Aims 1A, 1B, and Aim 2.
4.1.3 Reverse Transcription of RNA to Complimentary DNA
To prepare single-stranded cDNA suitable for qPCR experiments, the High Capacity Reverse
Transcription cDNA Kit (Applied Biosystems Inc., Carlesbad, CA) was used. Based on the
calculation of total RNA concentration explained in Section 4.1.2, a starting volume of RNA that
corresponded to 1 μg was mixed with reverse transcription (RT) reaction master mix for a total
volume of 20 μl. The components that made up the RT reaction master mix included: 10X RT
Buffer, 10X RT Random Primers (to bind across the length of the RNA being transcribed), 25X
dNTP Mix (containing 4 nucleotides: dATP, dCTP, dGTP, and dTTP), Multiscribe Reverse
Transcriptase (a DNA polymerase), and RNase Inhibitor. The RT reaction was prepared in
MicroAmp Fast Reaction Tubes (Applied Biosystems Inc., Carlesbad, CA) for thermal cycling
15

and long-term storage at -20°C. Each sample reaction went through thermal cycling in the
PCRSprint Thermal Cycler (Cole Parmer, Vernon Hills, IL). The 4-step thermal cycling program
included 10 min at 25°C, 120 min at 37°C, 5 sec at 85°C, and a final holding stage at 4°C.
4.1.4 Quantitative Real-Time PCR
The fundamental chemistry of real-time qPCR includes the repeat heating and cooling of DNA
template material in the presence of gene-specific primers and DNA polymerase to produce
double-stranded DNA (amplicons) that can be detected by fluorescent dye. With each heating
and cooling cycle, the amount of template that incudes the gene of interest, and hence the
fluorescent tag, is doubled and can be quantified in real-time.
To amplify and detect select gene targets, qPCR was performed using single-stranded
cDNA templates created following the procedure in Section 4.1.3, SYBR Green Master Mix
(Applied Biosystems Inc., Carlesbad, CA), and gene-specific Quantitect Primer Assays (Qiagen,
Inc., Valencia, CA) for each gene of interest. The SYBR Green Master Mix contained SYBR
GreenER dye which detects double-stranded DNA amplicon, AmpliTaq Gold DNA Polymerase,
dNTP nucleotides including dUTP, and ROX passive reference dye. Quantitect Primer Assays
including both forward and reverse primers for endogenous rat relaxin (relaxin-1, relaxin-3, and
RXFP-1) and endogenous reference control gene (GAPDH) were used to make working qPCR
mixes based on the experiments required for Aims 1A, 1B, and Aim 2. Detailed information
regarding these primer assays can be seen in Table 2. All qPCR experiments were prepared in
duplicate on MicroAmp Fast Optical 96-well Reaction Plates (Applied Biosystems Inc.,
Carlesbad, CA) and underwent 40 cycles of PCR cycling and optical LED recording using the
StepOnePlus Real-Time PCR System (Applied Biosystems Inc., Carlesbad, CA).
16

Table 2. Gene-specific endogenous relaxin primer assays for qPCR experiments
qPCR Target Gene of Interest Animal
GenBank ID
Base Pairs
Amplicon Length
Dye Label
Qiagen Catalog Number
Endogenous control GAPDH Rat NM_017008 1306 149 bp SYBR QT00199633 Relaxin-1 Rln1 Rat NM_013413 800 101 bp SYBR QT00381444 Relaxin-3 Rln3 Rat NM_170667 470 137 bp SYBR QT01796298 Relaxin receptor Rxfp1 Rat NM_201417 2277 94 bp SYBR QT00448371
The output from the real-time qPCR for each sample is the cycle number at which the
SYBR fluorescence crosses a pre-defined threshold (CT). To ensure that PCR results reflected
the amplification of gene template and not artifact, we required that CT values from usable data
be less than 35 (i.e. gene amplification after cycles 35-40 was attributed to artifact). Results for
each gene of interest (GOI) were normalized by the endogenous reference gene GAPDH (ΔCT =
CT,GOI - CT,GAPDH) to correct for variations in starting template between samples. The
comparative CT method was used to express experimental data as fold change relative to healthy
controls (2-ΔΔCT). The comparative CT method comes from a derivation of the equation for
exponential amplification by PCR and makes several assumptions, including that the efficiency
of the PCR is close to 1 and the PCR efficiency of the target gene is similar to the endogenous
control gene GAPDH [46]. To check that results from qPCR meet these assumptions,
morphology of amplification plots and melting temperature curves were validated qualitatively.
17

4.2 ASSESSMENT OF LV FIBROSIS AND DIASTOLIC DYSFUNCTION IN
RELAXIN-TREATED RATS
The MREN rat model is an established model of LV fibrosis at ~4 months age. To satisfy Aim 2,
fibrosis in this model was measured at all levels of organization – from gene-level expression of
profibrotic biomarkers, to tissue-level collagen area within the myocardium, to the whole-heart
translation of fibrosis as diastolic dysfunction. To study the treatment effects of exogenous
relaxin on established LV fibrosis, rhRLX was administered to the fibrotic MREN rat model and
the degree of LV fibrosis and diastolic dysfunction was compared to vehicle-treated MREN rats
as well as non-treated normotensive SD controls.
4.2.1 Animals
Male, transgenic MREN rats aged ~15 weeks were divided into two treatment groups: rhRLX-
treated MREN (MREN-R, n=6-7) and VEH-treated MREN (MREN-V, n=5-12). Age-matched
Sprague-Dawley rats were used as healthy controls (SD, n=6). Based on the analysis of power
and sample size explained in Section 4.1.1, and in anticipation of pre-completion mortality rate
within group of 20%, at least 6 rats per group was reasonable to support detection of significant
differences at a P-value of 0.05.
4.2.2 Administration of Recombinant Human Relaxin (rhRLX)
At 15-16 weeks of age, animals were briefly anesthetized with isofluorane in preparation for
subcutaneous minipump implantation surgery. Under sterile conditions, osmotic minipumps
18

(ALZET model 2ML2, Durect Corporation) containing either rhRLX (Novartis, Cambridge,
MA) or VEH (20 mM sodium acetate, pH 5.0) were implanted subcutaneously in the peritoneal
cavity. The 2ML2 osmotic minipumps were designed to administer drug-containing solution at
an uninterrupted rate of 0.5 mg/kg/d for 14 days. Prior to implantation, the minipumps were
primed for ~1 hour in sterile saline and weighed to ensure complete filling. At completion of
treatment duration, the minipumps were removed from the animal, weighed, and aspirated for
remaining solution. For all animals, <0.4 ml of solution remained in the minipump at the end of
the treatment duration. To ensure proper administration of exogenous relaxin, circulating serum
concentration of rhRLX was quantified by Quantikine rhRLX ELISA Assay (R&D Systems,
Minneapolis, MN).
4.2.3 Experimental Design Overview
Upon completion of the treatment period, all animals underwent the same experimental protocol.
First, body weights were recorded and blood pressures were taken by non-invasive tail blood
pressure cuff. Animals were then euthanized and hearts were removed for functional testing by
the isolated perfused heart method. After completion of functional trials (explained in Section
4.2.7), hearts were removed from the apparatus, left and right ventricles were separated and
weighed, and LV cross-sections were prepared for subsequent histological and molecular testing.
4.2.4 Gene-Level Expression of Fibrosis
Basal LV cross-sections were fresh frozen in liquid nitrogen and stored at -80°C until processed
for total RNA as described in Section 4.1.2. Total RNA was reverse transcribed to cDNA as
19

described in Section 4.1.3. Real-time qPCR was performed as described in Section 4.1.4 using
Quantitect Primer Assays (Qiagen, Valencia, CA) specific for fibrotic biomarker genes:
transforming growth factor-beta (TGFβ), brain natriuretic peptide (BNP), and matrix-
metalloproteinases (MMP2 and MMP9). Detailed information regarding these primer assays can
be seen in Table 3.
Table 3. Gene-specific fibrotic biomarker primer assays qPCR experiments
qPCR Target Gene of Interest Animal
GenBank ID
Base Pairs
Amplicon Length
Dye Label
Qiagen Catalog Number
Endogenous control GAPDH Rat NM_017008 1306 149 bp SYBR QT00199633 TGFβ-1 TGFβ Rat NM_021578 1482 145 bp SYBR QT00187796 BNP BNP Rat NM_031545 628 94 bp SYBR QT00183225 MMP2 MMP2 Rat NM_031054 3053 103 bp SYBR QT00996254 MMP9 MMP9 Rat NM_031055 2986 149 bp SYBR QT00178290
As described in Section 4.1.4, the comparative CT method was utilized to express the
level of fibrotic mRNA expression in treatment groups (MREN-V and MREN-R) relative to non-
treated healthy controls (SD).
4.2.5 Protein-Level Expression of Fibrosis
Interstitial and perivascular collagen content was measured by picrosirius red staining (PSR).
When dissolved in saturated picric acid, sirius red dye aligns itself with collagen fibers and
provides a visual, quantifiable distribution of collagen in tissue [47]. Combining brightfield
microscopy (Section 4.2.5.3) and computational image analysis (Section 4.2.5.4), the amount
20

and spatial distribution of stained myocardial collagen was quantified for experimental groups
(MREN-V and MREN-R) and compared to SD controls.
4.2.5.1 Left Ventricular Cross-Sections Apical cross-sections isolated from LV samples
were fixed in 10% neutral buffered formalin for >48 hours. Tissue samples were embedded in
paraffin blocks, cut into 6 μm sections, and plated on charged microscope slides for histological
staining.
4.2.5.2 Picrosirius Red Staining The protocol for PSR staining of LV was adapted from that
used by Dr. Joseph Janicki at the University of South Carolina; the detailed protocol can be
found in Appendix D. Before staining, tissue slides were deparaffined and rehydrated along a
decreasing ethanol gradient. Phosphomolybdic acid, 0.2% (PMA) was used as a background
treatment to remove cytoplasmic staining to increase collagen-to-tissue contrast. Next, slides
were submerged for 60 minutes in 0.1% PSR solution containing Sirius red dye (Direct Red 80,
Sigma Aldrich, St. Louis, MO) in saturated picric acid. The dye was washed from the slides with
hydrochloric acid (HCl), dehydrated along an ascending ethanol gradient, cleared with xylenes,
and mounted with a glass coverslip.
4.2.5.3 Brightfield Microscopy Stained tissue slides were imaged on the Olympus Provis
AX70 brightfield microscope (Olympus Center Valley, PA) in the University of Pittsburgh
Center for Biological Imaging Lab. For each slide, one representative image was taken by a
blinded operator at 10X magnification for the endocardium to mid-myocardium region as well as
the mid-myocardium to epicardium region. For perivascular images, a representative ventricular
21

arteriole was chosen and focused at 20X. All images were manually focused, and set to the same
exposure time and level of transmitted light.
4.2.5.4 Image Processing and Analysis Images were saved as .tif files and imported into a
custom analysis program written in MATLAB (Appendix F.1). Briefly, the program processed
the RGB images by separating out the green-filtered image which showed the highest contrast
between collagen and tissue staining. Background correction to remove non-tissue regions (i.e.
white space) was performed by thresholding. The corrected, green-filtered image was inverted so
that all stained collagen appeared white across a varying dark gray – black background (Figure
2). A graphic-user interface was developed which prompted the blinded user to manually select
three regions of positive collagen stain. The three selected intensity values were averaged (we
required that the standard deviation between intensities <15%) and used as the threshold for
collagen staining. All pixels greater than or equal to this threshold were counted and saved. A
visual representation of the final collagen count was displayed to the user as a quality check.
This method was used for all interstitial and perivascular collagen quantification. To determine
the tissue area, ImageJ software (NIH, Bethesda, MD) was used which includes a powerful color
thresholding tool [48]. Original images were sharpened and contrast was enhanced so that tissue
could be computationally differentiated from background. The color thresholding slider was used
to manually determine and save the amount of tissue positive pixels (Figure 2C-D). For
calculating the collagen:total tissue area ratio, the number of pixels of positive collagen
determined from MATLAB (Figure 2E-F) was divided by the number of pixels of tissue
determined by ImageJ.
22

Figure 2. Image processing for collagen:total tissue area ratio calculation
Sample output from each phase of the computational quantification of tissue and interstitial collagen area in picrosirius red stained LV cross sections. Representations of the original image for MREN-R and MREN-V are shown in panels A and B, respectively. Panels C and D demonstrate the procedure for quantifying total tissue area by thresholding in ImageJ. Panels E and F represent the collagen area (white) which was determined by the custom MATLAB algorithm explained in previously.
To determine the lumen area of a given arteriole, the original image was opened with
ImageJ and processed similarly as the interstitial images explained above. The freehand draw
tool was used to trace the innermost luminal wall and the area of the trace was recorded (Figure
3C-D). For determining the collagen:lumen area ratio, the number of pixels of positive collagen
determined from MATLAB (Figure 3E-F) was divided by the number of pixels of lumen area
determined by ImageJ.
A
B
C
D
E
F
23

Figure 3. Image processing for perivascular collagen:lumen area ratio calculation
Sample output from each phase of the computational quantification of lumen and perivascular collagen area in picrosirius red stained LV cross sections. Representations of the original image for MREN-R and MREN-V are shown in panels A and B, respectively. Panels C and D demonstrate the procedure for quantifying lumen area (red) manually in ImageJ. Panels E and F represent the collagen area (white) which was determined by the custom MATLAB algorithm explained in previously.
4.2.6 Non-Invasive Blood Pressure Measurement
After the treatment period, awake animals were contained in a holding tube while repeat
measurements of tail blood pressure were recorded on the CODA non-invasive blood pressure
system (Kent Scientific, Torrington, CT). As part of the CODA system, an occlusion cuff was
placed on the tail to occlude blood flow up to 250 mmHg while a distal differential pressure
A
B
C
D
E
F
24

transducer called the Volume Pressure Recording (VPR) sensor measured diastolic and systolic
pressures as well as heart rate [49]. The occlusion cuff (OCC-L) and VPR sensor (VPR-L)
underwent diagnostic testing before each experiment by pressure-hold testing with an allowable
tolerance of <5% deviations in pressure over the length of the test. For each study pressure
recording experiment, animals were maintained between 35-38°C by a heated stage and 10
acclimation cycles were conducted before data was recorded for use. At least 5 occlusion cycles
were used for calculations of average diastolic, systolic, and mean pressure and heart rate for
each animal.
4.2.7 Whole Heart-level Measurement of LV Function
The isolated perfused heart preparation, evolved from the technique originally described by
Langendorff in 1898, is still a very powerful approach to measuring ventricular function [50]. By
this method, the intact heart may remain viable outside of the circulation by retrograde perfusion
through the coronary arteries so that ex vivo experimentation may be performed under highly
controlled and repeatable conditions. A major advantage of this method is the ability to observe
mechanical and material properties of the heart independent of influences from other organ
systems, systemic circulation, or interferences from the central or autonomic nervous system. In
our application, the relationship between volume step perturbations and simultaneous
measurement of LV pressure provides the information necessary to determine the functional
diastolic properties of active relaxation and passive stiffness.
4.2.7.1 Animal Preparation Following non-invasive blood pressure measurement,
animals were anesthetized with an intraperitoneal injection of Euthasol (250 mg/kg, Henry-
25

Schein, Dublin, OH). Animals were then anticoagulated using 100 units of heparin, delivered via
intramuscular injection, and the heart was excised by thoracotomy.
4.2.7.2 Isolated Perfused Heart Preparation Once the heart was excised from the animal,
the aorta was quickly cannulated and retrograde aortic perfusion was started at a constant
pressure of 75 – 90 mmHg using a perfusate solution (modified Krebs solution) consisting of
(mM): NaCl 113, KCl 4.7, MgSO4 1.2, Na-EDTA 0.5, NaHCO3 28.0, Glucose 5.5, Pyruvate 5.0,
CaCl2 2.5. The solution was oxygenated with 95% O2 and 5% CO2, maintained at 37°C, and pH
adjusted to 7.4. The left and right atria were removed and a balloon made from high-density
polyethylene (HDPE, from a plastic biohazard bag) was placed in the left ventricle through the
mitral valve and secured with a suture though the LV apex. A catheter-tip pressure transducer
(MPC-500, Millar Instruments, Houston, TX) was used to measure LV pressure as force
generated on the balloon. The balloon volume was altered using a thumbscrew-controlled 500 μl
microsyringe (Hamilton Gas Tight, Reno, NV). Platinum pacing electrodes were placed on the
heart, which was then paced at an interbeat interval of 250 ms (240 bpm) using a Pace-1A
cardiac stimulator (Radionics, Burlington, MA). Pressure data were digitized for later offline
analysis at 1000 Hz based on the Nyquist-Shannon sampling theorem.
4.2.7.3 Frank-Starling Protocol Steady-state isovolumic LV pressure waveforms were
recorded over a wide range of balloon volumes from an initial volume (V0) corresponding to an
end-diastolic pressure of 0 mmHg and increasing by manually-controlled 5±0.5 μl increments.
The maximal left ventricular volume (Vmax) corresponded to the volume that produced end-
diastolic pressure greater than 25 mmHg.
26

4.2.7.4 Pacing Trials Diastolic dysfunction is typically more severe when the heart is
subjected to stressors that increase the heart rate and shorten the interval for LV relaxation (i.e.
exercise). Clinically, the symptoms of diastolic heart failure will often present in patients
undergoing a stress test [2]. To test LV mechanical and material properties under stressed
conditions, pacing trials were conducted at a shortened interbeat interval. Following the
“baseline” Frank-Starling trials, the interbeat interval was reduced to 200 ms (300 bpm) and a
“stressed” Frank-Starling trial was performed. The effect of stress was studied by comparing
end-diastolic pressure-volume relationships (EDPVRs, defined in Section 4.2.7.5) from
“baseline” trials to “stressed” trials across all treatment groups.
4.2.7.5 Analysis of Left Ventricular Function Left ventricular developed pressure (Pdev)
was defined as the difference between peak end-systolic pressure and end-diastolic pressure (Ped)
[51]. Rates of pressure development (+dP/dt) and relaxation (-dP/dt) were calculated as positive
and negative segments of the first derivative of the pressure waveform, respectively, and
maximal rates of each were used to compare contractility (+dP/dtmax) and relaxation (-dP/dtmin).
To account for differences in both left ventricular mass and volume, a thick walled spherical
model of the LV (previously justified for appropriateness [52]) was used to convert pressures to
developed or end-diastolic wall stress (σ) according to the following formula:
where M, ρ, and V are left ventricular muscle mass, muscle density (1.05 g/ml), and balloon
volume, respectively [53, 54]. The relaxation time (Trelax) was defined as the time required for
pressure to decay from 75% to 25% of the maximum. Similarly, the rise time (Trise) was defined
27

as the time required for pressure to rise from 25% to 75% of the maximum [55]. Raw output data
from a representative Frank-Starling trial can be seen in Figure 4 which includes (clockwise
from left) average pressure waveforms, developed pressure, rise time, rate of pressure
development, rate of relaxation, relaxation time, end-diastolic pressure, and incremental volume
steps.
Figure 4. Sample output from isolated heart experiments Averaged pressure waveforms (A), infused volume steps (B), developed pressure-volume relationship with linear fit (C), end-diastolic pressure-volume relationship with nonlinear fit (D), rise time (E), relaxation time (F), +dP/dt (G), and -dP/dt (H).
To measure contractile function from the Frank-Starling protocol, each volume step was
normalized to V0, and first-order linear regression was performed to determine the relationships
between volume and peak pressure (PPVR) and developed pressure (DevPVR).
To calculate myocardial midwall strains, a spherical model of the LV was used to
determine the LV chamber radius from the balloon volume at each volume increment (rLV).
Myocardial muscle density (1.05 g/ml) and ½ LV mass were used to estimate the volume of the
28

midwall myocardium (radius calculated from spherical assumption, rwall). Together, these
provided the midwall radius, rmid = rLV + rwall. A reference radius value (r0) was calculated from
V0 (initial volume corresponding to Ped=0 mmHg) and used to calculate end-diastolic myocardial
midwall strain by the following equation:
0
0
rrrmid
mid−
=ε
To determine diastolic passive stiffness from the Frank-Starling protocol raw data,
nonlinear regression was performed to determine the relationships between volume and end-
diastolic pressure (EDPVR) according to the equation:
[ ]1)( 0 −= −VVbed eAP
where A and b are coefficients determined by iterative curve fitting using a standard Levenberg-
Marquardt least squares algorithm (nlinfit.m) in MATLAB. Details of the nonlinear curve fitting
are expanded in Appendix F.
The relationship between end-diastolic stress and end-diastolic midwall strain was
determined by fitting the nonlinear equation:
[ ]1−= edbed eA σε
where A and b are coefficients determined by iterative curve fitting using a standard Levenberg-
Marquardt least squares algorithm (nlinfit.m, MATLAB). The exponential fit coefficient, b, is
referred to as the stress-strain stiffness coefficient.
4.2.8 Heart Weights and Tibia Lengths
Upon completion of experimentation, the heart was removed from the isolated perfused heart
setup, blotted to dry, and segmented into left and right ventricle sections. Sections were weighed
29

and fresh frozen in liquid nitrogen for use in compositional evaluation of fibrosis. The tibia
length was measured and recorded for each animal for normalization of heart weights.
4.3 STATISTICAL ANALYSES
Data are presented as mean ± SEM and P<0.05 was deemed significant.
4.3.1 Expression of Endogenous Relaxin Receptor-Ligand System
Student’s unpaired ‘t’ test was used to compare the mean values of relative mRNA expression (2-
ΔΔCT) of relaxin-1, relaxin-3, and RXFP-1 among all three fibrotic models: Young SHR vs. Aged
SHR, Aged SHR vs. Aged WKY, and MREN vs. SD. Student’s ‘t’ test is based on the
assumption that samples are normally distributed; hence, normality was confirmed in each data
set by the Shapiro-Wilk test which tests the null-hypothesis that the data are normally
distributed. A P-value >0.05 resulting from the Shapiro-Wilk test means that the null-hypothesis
cannot be rejected and the sample set is normally distributed.
4.3.2 Assessment of LV Fibrosis and Cardiac Function
For all quantitative comparisons (fibrotic biomarker mRNA expression, picrosirius red staining,
and functional data) single-factor ANOVA was used with three levels corresponding to the
vehicle- and rhRLX-treated MREN rats and the SD controls. If a significant main effect was
observed, then post hoc comparisons among groups were performed using Fisher’s least
30

significant difference (LSD) test. As explained in Section 4.3.1, normality is also an assumption
of ANOVA statistical testing and therefore normality was confirmed in each sample set by the
Shapiro-Wilk test. ANOVA also assumes homogeneity of variances, so to confirm that this
assumption was met, Levene’s test was performed for each ANOVA test. Levene’s test
hypothesizes that the variances of all data sets are not equal, therefore a P-value <0.05 rejects
this hypothesis and confirms homogeneity of variances.
4.3.3 Left Ventricular Function Relationships
Raw pressure or stress data were fitted by a built-in MATLAB function for iterative least squares
regression (nlinfit.m) of the equations outlined in Section 4.2.7.5. Goodness of fit (R2) was
calculated as the ratio of the sum of squares of the regression (SSR) to the total sum of squares
(SST) as outlined in the following equations.
( )
( )
( )
SSTSSE
SSTSSRsquareR
yywSST
yywSSR
yywSSE
n
iii
n
iii
n
iiii
−==−
−=
−=
−=
∑
∑
∑
−
−
−
1
ˆ
ˆ
1
2
1
2
1
2
where wi is a weighting factor which was not used. All fitted data were required to meet R2>0.8
to be included in group comparison analyses.
Single-factor repeated measures ANOVA was used to compare mean values of pressure-
volume or stress-strain relationships between vehicle- and rhRLX-treated MREN and SD
controls. This method was also used to compare mean values of pressure-volume relationships at
31

different pacing durations (baseline vs. stressed). If significant main effects within variables or
between variables occurred or if a significant interaction effect was observed, post hoc
comparisons between groups were performed using Fisher’s LSD test.
32

5.0 RESULTS
5.1 ENDOGENOUS RELAXIN RECEPTOR-LIGAND EXPRESSION IN AN
ENVIRONMENT OF FIBROSIS
Specific Aim 1A. To quantify the mRNA expression of relaxin message (relaxin-1 and relaxin-3)
and receptor (RXFP-1) in LV tissue from two rat models of hypertension-associated LV fibrosis:
Transgenic MREN vs. SD controls and aged SHR vs. aged, normotensive WKY.
Specific Aim 1B. To quantify the mRNA expression of relaxin message (relaxin-1 and relaxin-3)
and receptor (RXFP-1) in LV tissue from young SHR compared to aged SHR as a model of
aging-associated LV fibrosis.
5.1.1 Endogenous Relaxin Expression in Transgenic MREN Rats
Transgenic MREN were compared to sex- and age-matched normotensive SD controls (Table
4). Fibrosis was confirmed in MREN at this age compared to SD controls by quantification of
picrosirius red stained myocardial collagen:total tissue area (Figure 5). Relaxin message
(relaxin-1 and relaxin-3) and receptor (RXFP-1) mRNA expression was quantified by real-time
qPCR in LV tissue from the transgenic MREN rat and compared to SD controls (Figure 6). In
this model of hypertension and fibrosis, the relative mRNA expression of relaxin-1 was elevated
slightly, but not significantly, in MREN (1.59±0.57) vs. SD (1±0.24). Similarly, there was a
33

slight, non-significant increase in relative mRNA expression of relaxin-3 in MREN (1.15±0.17)
vs. SD (1±0.19). The mRNA expression of receptor RXFP-1 was significantly upregulated in
fibrotic MREN (4.48±0.87) vs. SD (1±0.23, P=0.01).
Table 4. General Characteristics of SD and MREN
Animals Age, m BW, g SBP, mmHg HR, bpm SD (n=6) 4.3±0.05 552±35 153±4 371±12 MREN (n=5) 4.4±0.03 496±11 198±4* 396±19 BW indicates body weight; SBP, systolic blood pressure; HR, heart rate *P<0.05
Figure 5. Tissue-level myocardial fibrosis in transgenic MREN vs. SD rats
Myocardial collagen was quantified by picrosirius red staining of LV cross-sections from MREN (n=5) and sex- and age-matched SD controls (n=6). Fibrosis was determined in MREN rats as significantly increased interstitial collagen:total tissue area compared to SD controls. *P<0.05 vs. SD by Student’s t-test.
34

Figure 6. Endogenous relaxin expression in transgenic MREN vs. SD rats
Endogenous mRNA expression for relaxin message (relaxin-1 and relaxin-3) and receptor (RXFP-1) from LV tissue of MREN (n=5) were expressed relative to sex- and age-matched SD controls (n=6). Gene expression was quantified by real-time qPCR using specific primer assays for the genes of interest normalized by endogenous control gene, GAPDH. No significant differences exist between groups for relaxin message; however, RXFP-1 expression was significantly increased in MREN vs. SD. *P<0.05 vs. SD by Student’s t-test.
5.1.2 Endogenous Relaxin Expression in Hypertensive SHR Rats
As a second model of hypertension-associated LV fibrosis, the aged SHR animal model was
compared to sex- and age-matched normotensive Wistar-Kyoto (WKY) controls (Table 5). LV
interstitial collagen was stained by immunohistochemistry using a primary antibody specific for
collagen-1 (staining and quantification performed by Dr. Charles McTiernan). Myocardial
fibrosis was confirmed in SHR compared to WKY controls as increased interstitial collagen:total
tissue area (Figure 7). Gene expression of relaxin message (relaxin-1 and relaxin-3) and receptor
(RXFP-1) was quantified in LV tissue from aged SHR and WKY controls (Figure 8). The
relative mRNA expression of relaxin-1 was elevated slightly, but not significantly, in SHR
(1.39±0.44) vs. WKY (1±0.46). Similarly, there was a slight, non-significant increase in relative
35

mRNA expression of relaxin-3 in aged SHR (1.57±0.36) vs. young SHR (1±0.16). Expression of
the relaxin receptor RXFP-1 was elevated in LV tissue from the fibrotic SHR (2.02±0.46) vs.
WKY (1±0.21), however this trend did not reach significance (P=0.07).
Table 5. General Characteristics of WKY and SHR
Animals Age, m BW, g SBP, mmHg HR, bpm WKY (n=6) 11.8 432±9 153±6 344±18 SHR (n=15) 11.4 394±6* 190±5* 408±12 BW indicates body weight; SBP, systolic blood pressure; HR, heart rate *P<0.05
Figure 7. Tissue-level myocardial fibrosis in aged SHR vs. aged WKY rats
Myocardial collagen was quantified by immunohistochemical staining of LV cross-sections (primary antibody: anti-Collagen-1) from SHR (n=8) and sex- and age-matched WKY controls (n=6). Fibrosis was determined in SHR rats as significantly increased interstitial collagen:total tissue area compared to WKY controls. *P<0.05 vs. WKY by Student’s t-test.
36

Figure 8. Endogenous relaxin expression in aged SHR vs. aged WKY rats
Endogenous mRNA expression for relaxin message (relaxin-1 and relaxin-3) and receptor (RXFP-1) from LV tissue of SHR (12 months, n=8) were expressed relative to sex- and age-matched WKY (12 months, n=6). Gene expression was quantified by real-time qPCR using specific primer assays for the genes of interest normalized by endogenous control gene, GAPDH. No significant differences exist between groups for relaxin message or receptor expression; however, RXFP-1 expression showed a trend of upregulated mRNA expression relative to WKY (P=0.07).
5.1.3 Endogenous Relaxin Expression in Age-Associated LV Fibrosis
We studied young SHR rats (~4 months) compared to aged SHR rats (~12 months) to represent a
model of age-related fibrosis accelerated by hypertension (Table 6). Unfortunately we did not
examine myocardial collagen to confirm fibrosis is this cohort, however we found that age was
associated with an upregulation in the relaxin receptor-ligand system similar to the other models.
Gene expression of relaxin message (relaxin-1 and relaxin-3) and receptor (RXFP-1) was
quantified in LV tissue from aged SHR and presented relative to young SHR (Figure 9). The
relative mRNA expression of relaxin-1 was elevated, but not significantly different, in aged SHR
(1.92±0.73) vs. young SHR (1±0.12). Similarly, there was a slight, non-significant increase in
37

relative mRNA expression of relaxin-3 in aged SHR (1.25±0.29) vs. young SHR (1±0.03). The
mRNA expression of relaxin receptor RXFP-1 was significantly upregulated in aged SHR
(2.43±0.55) vs. young SHR (1±0.15, P=0.04).
Table 6. General Characteristics of young and aged SHR
Animals Age, m BW, g SBP, mmHg HR, bpm YOUNG SHR (n=8) 4.6±1 346±5 124±3 308±2 AGED SHR (n=15) 11.4 394±6* 190±5* 408±12* BW indicates body weight; SBP, systolic blood pressure; HR, heart rate *P<0.05
Figure 9. Endogenous relaxin expression in young SHR vs. aged SHR
Endogenous mRNA expression for relaxin message (relaxin-1 and relaxin-3) and receptor (RXFP-1) from LV tissue of aged SHR (12 months, n=8) expressed relative to young SHR (4 months, n=8). Gene expression was quantified by real-time qPCR using specific primer assays for the genes of interest normalized by endogenous control gene, GAPDH. No significant differences exist between groups for relaxin message; however, RXFP-1 expression was significantly increased in aged SHR vs. young SHR. *P<0.05 vs. young SHR by Student’s t-test.
38

5.1.4 Summary
Quantitative real-time PCR was performed on LV tissue samples from three different known
animal models of LV fibrosis. In each model, the relaxin receptor-ligand system showed a
pattern of adaptive upregulation in response to a fibrotic environment. The relaxin message
genes (relaxin-1 and relaxin-3) were slightly elevated in each model, however this trend never
reached significance in any of the models. Interestingly, each model of LV fibrosis demonstrated
a significant ~2-4.5-fold increase in the gene expression of the relaxin receptor RXFP-1. These
data suggest, consistent with our hypothesis, that the relaxin system, at least in part, is naturally
upregulated in the environment of fibrosis. Our next mission was to provide exogenous relaxin to
the system to observe its therapeutic potential in this fibrotic environment.
5.2 ASSESSMENT OF LV FIBROSIS AND DIASTOLIC DYSFUNCTION IN
RELAXIN-TREATED RATS
Specific Aim 2. To determine the effect of exogenous relaxin administration on established LV
fibrosis and diastolic dysfunction in transgenic MREN rats compared to normotensive SD
controls.
A preliminary assessment was performed in rhRLX- and vehicle-treated hypertensive
SHR rats and compared to normotensive WKY control rats. Due to limited availability of SHR
rats at the age which LV fibrosis becomes apparent, studies in this animal model were
discontinued and replaced with the MREN rat model. Evidence of beneficial rhRLX
39

administration effects in aged SHR is presented in Appendix A, and while this study lacks
evidence of functional improvements, compositional results tend to agree with the findings
presented below in transgenic MREN rats.
5.2.1 Administration of rhRLX in Experimental Treatment Groups
Effective administration of exogenous relaxin was confirmed by rhRLX ELISA assay of blood
serum with selective conjugate antibodies for recombinant human relaxin-2 (Figure 10). As
expected, animals that had been administered rhRLX by osmotic minipump showed an average
serum concentration of 112±24 ng/ml, comparable with dosages used in similar antifibrotic
treatment studies [23, 43]. Animals that had received no treatment (SD) or vehicle treatment
(MREN-V) had no detectable amounts of circulating rhRLX (0.51±0.05 and 0.36±0.99 ng/ml,
respectively).
40

Figure 10. Circulating levels of rhRLX in experimental treatment groups
Blood serum was collected from all experimental treatment groups. MREN-R, which had received rhRLX by osmotic minipump for 14 days, had significantly elevated serum rhRLX concentration respective to non-treated SD and vehicle-treated MREN-V. *P<0.001 vs. SD, #P<0.001 vs. MREN-R by single-factor ANOVA with post hoc Fisher’s LSD analysis.
5.2.2 Hypertension and Hypertrophy in rhRLX-Treated MREN Rats
It has been well reported that the upregulated renin-angiotensin system characteristic of the
transgenic MREN rat model results in significant hypertension and LV hypertrophy [12, 14].
This pathological adaptation was confirmed in experimental MREN groups versus SD controls
despite rhRLX or vehicle treatment. The blood pressure and heart rate measurements (Figure 11)
were collected by serial non-invasive blood pressure tail-cuff cycles and averaged for each
animal and across groups.
41

Figure 11. Hypertension and heart rate measurements in the MREN rat
There was a significant main effect of group for diastolic, systolic, and mean blood pressures with MREN-V and MREN-R demonstrating significant hypertension compared to SD controls (A). There was a significant increase in heart rate in MREN-R compared to the other two groups (B). *P<0.05 vs. SD by single-factor ANOVA with post hoc Fisher’s LSD analysis
Hypertrophy was determined by whole heart and ventricle weights normalized by body
weight or tibia length for each experimental treatment group (Figure 12). LV weights of MREN-
V and MREN-R normalized by body weight (3.8±0.1 and 3.8±0.1, respectively) and tibia length
(0.58±0.02 and 0.60±0.02, respectively) were significantly increased vs. LV weights of SD
normalized by body weight (2.8±0.1, P<0.001) and tibia length (0.44±0.02, P<0.001). There
was no significant difference between MREN treatment groups by Fisher’s LSD post hoc
analysis. RV weights of MREN-V and MREN-R normalized by body weight (0.64±0.02 and
0.64±0.04, respectively) did not differ from RV weights of SD normalized by body weight
(0.76±0.05, P=0.07). There was a significant difference between RV weights normalized by tibia
length for MREN-V (0.09±0.002) vs. RV weights normalized by tibia length from SD
(0.12±0.007, P=0.04), this effect was not significant in MREN-R (0.10±0.002, P=0.06)
compared to SD.
A B
42

Figure 12. LV hypertrophy in the MREN rat
Left ventricular hypertrophy was evidenced in all MREN independent of treatment by significantly increased heart weights (HW) and LV weights when normalized by either (A) body weight (BW) or (B) tibia length (TL). There were no significant differences in normalized RV weight across all groups. *P<0.001 by single-factor ANOVA with Fisher’s LSD post hoc to compare between MREN-V and MREN-R (no differences).
5.2.3 Gene-Level Expression of Fibrosis in Relaxin-Treated Rats
Gene-level indicators of an active fibrotic environment were measured by quantitative real-time
PCR using targets specific for transforming growth factor-β (TGFβ), brain natriuretic peptide
(BNP), and matrix metalloproteinases-2 and -9 (MMP2 and MMP9, Figure 13). As expected,
LV tissue from MREN-V rats had significantly elevated mRNA expression of TGFβ (1.89±0.16
vs. 1±0.15, P=0.001), BNP (3.56±0.47 vs. 1±0.15, P=0.001), and MMP2 (2.60±0.24 vs. 1±0.19,
P<0.001) versus SD controls, indicating active collagen turnover. Exogenous rhRLX treatment
was able to significantly reduce this fibrotic expression for TGFβ (1.28±0.14, P=0.01) and
MMP2 (1.44±0.13, P<0.001) versus MREN-V and showed no significant differences compared
to SD controls. The elevated expression of BNP was not different between MREN-V and
A B
43

MREN-R groups (3.56±0.47 vs. 3.01±0.50, respectively), suggesting that rhRLX administration
has no effect on the upregulation of BNP in the MREN model of LV fibrosis. There were no
differences in MMP9 expression across all experimental groups.
Figure 13. Expression of profibrotic biomarkers
Fibrotic biomarker mRNA expression for TGFβ, BNP, MMP2, and MMP9 from LV tissue of experimental treatment groups was expressed relative to SD controls. Gene expression was quantified by real-time qPCR using specific primer assays for the genes of interest normalized by endogenous control gene, GAPDH. MREN-V had significantly elevated expression of TGFβ and MMP2 versus SD, and MREN-R showed a significant reduction from the fibrotic response. Expression of BNP was significantly elevated in both MREN groups vs. SD controls, regardless of rhRLX administration. There were no significant differences in mRNA expression of MMP9 across all experimental groups. *P<0.05 vs. SD, #P<0.05 vs. MREN-R by single-factor ANOVA with Fisher’s LSD post hoc analysis. As described in Section 5.1.3., endogenous relaxin message (relaxin-1 and relaxin-3) is slightly
elevated and receptor (RXFP-1) is significantly elevated in fibrotic MREN-V versus SD
controls. Administration of rhRLX attenuated this upregulation in MREN-R (Figure 14).
Compared to MREN-V, MREN-R had reduced relaxin-1 mRNA expression (0.76±0.27 vs.
44

1.59±0.57, P=0.13), reduced relaxin-3 expression (0.71±0.11 vs. 1.15±0.17, P=0.08), and
significantly reduced RXFP-1 expression (2.44±0.67 vs. 4.48±0.87, P=0.03).
Figure 14. Endogenous relaxin expression in rhRLX-treated MREN
Expression of endogenous relaxin-1, relaxin-3, and RXFP-1 from experimental treatment groups was expressed relative to SD controls. Gene expression was quantified by real-time qPCR using specific primer assays for the genes of interest normalized by endogenous control gene, GAPDH. MREN-V had significantly elevated expression of RXFP-1 vs. SD controls that was significantly attenuated by rhRLX treatment in MREN-R. *P<0.05 vs. SD, #P<0.05 vs. MREN-R by single-factor ANOVA with Fisher’s LSD post hoc analysis.
5.2.4 Interstitial and Perivascular Fibrosis in Relaxin-Treated Rats
To measure LV fibrosis on the protein-level, tissue sections were stained by picrosirius red
(PSR) dye, imaged, quantified, and compared across experimental groups. Tissue samples were
divided by region to specifically focus on interstitial collagen in the epicardial region (Figure
15A,D,G) and endocardial region (Figure 15B,E,H) separately. Arterioles to represent
perivascular collagen were chosen based on morphology of the vessel and location within the
endocardial region (Figure 15C,F,I).
45

In the outer epicardial region, no significant differences in collagen protein:total tissue
area were detected across the groups (Figure 16A). In the MREN-V group, the epicardial
collagen ratio was moderately increased (0.01±0.002) when compared to SD and MREN-R
(0.007±0.002 and 0.008±0.002, respectively). However, the inner endocardial regions of MREN-
V were significantly more collagen-rich than SD controls (0.023±0.003 vs. 0.006±0.001,
P<0.001) suggesting a spatial disparity of fibrotic collagen deposition (Figure 16B). This
interstitial fibrosis in the endocardial region was significantly reduced in MREN-R versus
MREN-V (0.01±0.001 vs. 0.023±0.003, P=0.003) to where it was not statistically different from
SD controls.
Perivascular collagen was also quantified and normalized to arteriolar lumen area as a
measure of protein-level fibrosis (Figure 16C). Similar to the interstitial collagen deposition,
MREN-V demonstrated significantly increased perivascular collagen versus SD controls
(0.91±0.11 vs. 0.58±0.06, P=0.032) and rhRLX administration was able to significantly reverse
this fibrosis (0.37±0.06 vs. 0.91±0.11, P=0.001) to levels not statistically different from SD
controls.
46

Figure 15. Picrosirius red staining
Epicardial (A,D,G) and endocardial (B,E,H) regions of PSR-stained LV cross-sections were imaged at 10X magnification and arterioles (C,F,I) were focused at 20X magnification for interstitial and perivascular collagen, respectively. Qualitatively, MREN-V appear to have increased collagen in the endocardium and perivascular regions when compared to MREN-R and SD controls.
47

Figure 16. Regional quantification of picrosirius red staining
Images were processed computationally and interstitial and perivascular collagen was quantified for each of the experimental groups. There was no difference in interstitial collagen at the level of the LV epicardium (A) across the groups. However, at the endocardial (B) and perivascular (C) levels, MREN-V were significantly more collagen-rich compared to both SD controls and rhRLX administration reduced this fibrotic phenotype in MREN-R. *P<0.05 vs. SD, #P<0.05 vs. MREN-R by single-factor ANOVA with Fisher’s LSD post hoc analysis.
5.2.5 Contractility Parameters in Relaxin-Treated Rats
The isolated perfused heart experiments produced raw LV pressure waveforms at varying
balloon volumes based on the Frank-Starling protocol. Contractility was determined based on
peak and developed pressures and corresponding stresses, the rates of pressure development, and
the rise time.
Peak pressure, or maximum pressure, was plotted against incremental volume steps and
fitted with a linear relationship defined in Section 4.2.7.5 to determine the peak pressure-volume
relationship (PPVR) for each experimental group. There was a significant difference in Vmax
across the groups with MREN-V and MREN-R reaching significantly higher maximum volumes
(184±3 and 188±5, respectively) compared to SD controls (136±13). Hence, for comparative
purposes, the PPVR was plotted using a normalized volume (V/V0). There were no significant
differences in PPVR across all experimental groups (Figure 17) though the PPVR was elevated
48

slightly in MREN-R versus MREN-V and SD controls, though this increase did not reach
statistical significance (P=0.265).
Figure 17. Peak-pressure volume relationships in MREN rat
Contractile function, determined by PPVR, tended to be higher in MREN-R vs. MREN-V and SD controls, though no significant main effects were observed by single-factor repeated-measures ANOVA.
Similar to the PPVR, the developed pressure was fitted with a linear relationship defined
in Section 4.2.7.5. This relationship, the developed pressure-volume relationship (DevPVR), was
not significantly different between all experimental groups by repeated-measures ANOVA
(P=0.285).
49

Figure 18. Developed-pressure volume relationships
Contractile function, determined by DevPVR and plotted against normalized volume, was not significantly different across all experimental groups by repeated-measures ANOVA.
End-diastolic myocardial midwall strain was calculated using a reference radius
corresponding to the initial volume where Ped=0 mmHg (V0). Developed stress was calculated
from developed pressure, volume, and LV weight following Section 4.2.7.5. Raw developed
stress was plotted against end-diastolic midwall strain and fitted with a linear relationship
defined in Section 4.2.7.5 (Figure 19). This relationship, the developed stress-midwall strain
relationship, was not distinguishable across all groups (P=0.465).
50

Figure 19. Developed stress-midwall strain relationships
Developed stress-midwall strain relationships were determined for each experimental group by fitting data by first-order linear regression. Midwall strains were calculated using a reference strain based on LV initial volume (V0). There were no significant differences across all groups by repeated measures ANOVA.
The rate of pressure development (+dP/dt) was calculated for each cardiac cycle along
incremental volume steps and the maximum rates (+dP/dtmax) are presented for each
experimental group in Figure 20. The maximal rate of pressure development was significantly
reduced in MREN-V versus SD controls (2602±198 vs. 3564±78 mmHg/s, P=0.001) but no
differences existed between MREN-R and the two groups (3011±143 mmHg/s).
51

Figure 20. Maximal rate of pressure development
Contractility as measured by maximum rate of pressure (+dP/dtmax) development was significantly blunted in MREN-V compared to SD controls. There was no significant effect of rhRLX administration. *P<0.05 vs. SD controls by single-factor ANOVA with Fisher’s LSD post hoc analysis.
Rise time was also calculated for each cardiac cycle and averaged across incremental
volume steps. Rise time was not significantly different between any of the treatment groups
(Figure 21), though MREN-V was slightly increased (0.024±0.006 s) compared to SD controls
(0.022±0.004 s) and MREN-R (0.022±0.006 s).
52

Figure 21. Rise time
Contractility as measured by the time required for pressure to rise from 25% to 75% of the maximum (rise time) was not significantly different across all experimental groups, despite a modest increase in MREN-V.
5.2.6 Diastolic Function in Relaxin-Treated Rats
The volume where Ped=0 mmHg (V0) provides information about the chamber dilation between
experimental groups (Figure 22). Compared to SD controls, V0 was significantly increased in
MREN-R (115±0.03 vs. 56±0.02 μl, P<0.001) and MREN-V (113±0.02 vs. 56±0.02 μl,
P<0.001). Hence, for comparative purposes, all pressure-volume relationships were plotted
against normalized volumes (V/V0). LV passive stiffness was evaluated for each experimental
group by the following relationships: end-diastolic pressure-volume relationship (EDPVR,
Figure 23), stiffness coefficient (dPed/dV)-end-diastolic pressure relationship (dPed/dV-Ped,
Figure 24), and end-diastolic stress-midwall strain relationship (Figure 25).
53

Figure 22. V0 values for all experimental groups
Initial volume where Ped=0 mmHg (V0) was determined for each group by interpolation of raw pressure-volume step data. Both MREN experimental groups had increased V0 compared to SD controls, regardless of rhRLX administration. *P<0.001 vs. SD controls by single-factor ANOVA with Fisher’s LSD post hoc analysis.
EDPVR was calculated by non-linear curve fitting of raw end-diastolic pressures at
increasing volume increment steps as described in Section 4.2.7.5. By comparison of EDPVR,
LV from MREN-V were significantly stiffer vs. SD controls (P<0.001) and rhRLX
administration was able to significantly reverse this stiffness (P=0.005) to levels not different
from controls (P=0.284). Similarly, the relationship between stiffness coefficient (dPed/dV) and
end-diastolic pressure demonstrated significantly stiffer MREN-V compared to SD controls
(P<0.001) and MREN-R (P=0.001) with no significant difference between rhRLX-treated
MREN-R and SD controls (P=0.578). Finally, the relationship between end-diastolic stress and
myocardial midwall strain was determined to account for differences in ventricular size and
chamber mass across experimental groups. End-diastolic midwall strain was calculated using a
reference radius corresponding to an initial LV volume where Ped=0 mmHg (V0). The averaged
end-diastolic stress-midwall strain relationship was significantly elevated in MREN-V versus SD
54

controls (P=0.02) and rhRLX administration was able to significantly reverse the stiffness
(P=0.03) to levels not different from controls (P=0.821).
Figure 23. End-diastolic pressure-volume relationships
End-diastolic pressure-volume relationships (EDPVR) were obtained for each group by non-linear curve fitting using an exponential model of end-diastolic pressure as a function of LV volume. Results were averaged within experimental groups and plotted against normalized volume (V/V0). MREN-V had significantly stiffer LV as evidenced by an upward shift in EDPVR vs. SD controls. This stiffness was significantly reduced by rhRLX administration in MREN-R. *P<0.05 vs. SD, #P<0.05 vs. MREN-R by repeated-measures ANOVA with post hoc analysis by Fisher’s LSD test.
55

Figure 24. End-diastolic stiffness coefficient-pressure relationship
As a measure of LV passive stiffness, the end-diastolic stiffness coefficient (dPed/dV) was plotted against end-diastolic pressure (Ped) for each experimental group. MREN-V had significantly stiffer LV as evidenced by increased dPed/dV vs. SD controls over the range of end-diastolic pressures. This stiffness was significantly reduced by rhRLX administration in MREN-R. *P<0.05 vs. SD, #P<0.05 vs. MREN-R by repeated-measures ANOVA with post hoc analysis by Fisher’s LSD test.
56

Figure 25. End-diastolic stress-midwall strain relationship
End-diastolic stress-midwall strain relationships were determined for each experimental group by non-linear regression. End-diastolic midwall strains were calculated using a reference strain based on LV initial volume (V0 corresponding to a volume where PED=0). There was a significant increase in passive LV stiffness in MREN-V vs. SD controls that was normalized with rhRLX treatment in MREN-R. *P<0.05 vs. SD, #P<0.05 vs. MREN-R by repeated-measures ANOVA with post hoc analysis by Fisher’s LSD.
The exponential stiffness coefficient from the end-diastolic stress-midwall strain
relationship was determined by iterative curve fitting (Figure 26). There was a significant main
effect of treatment (P=0.008) and post hoc analysis showed that MREN-V had significantly
increased stress-strain coefficients versus SD controls (133±18 vs. 72±9, P=0.006) and MREN-R
(133±18 vs. 77±6, P=0.01). There were no differences between SD and MREN-R.
57

Figure 26. End-diastolic stress-strain stiffness coefficient
The coefficient of end-diastolic stiffness was determined by non-linear curve fitting of the exponential model of end-diastolic stress-midwall strain. LV from the MREN-V group had significantly increased stiffness vs. SD controls and this stiffness was reduced with rhRLX-treatment in MREN-R. *P<0.05 vs. SD, #P<0.05 vs. MREN-R by single-factor ANOVA with post hoc analysis by Fisher’s LSD.
The rate of pressure relaxation (-dP/dt) was calculated for each cardiac cycle along
incremental volume steps and the maximum relaxation rates (-dP/dtmin) are presented for each
experimental group in Figure 27. The maximal rate of pressure relaxation was significantly
blunted compared to SD controls in both MREN-V (1305±84 vs. 1925±74 mmHg/s, P<0.001)
and MREN-R (1487±75 vs. 1925±74 mmHg/s, P=0.01).
58

Figure 27. Maximal rate of pressure relaxation
Maximal rate of pressure relaxation (-dP/dtmin) was blunted in MREN-V and MREN-R compared to SD controls. There was no significant effect of rhRLX-treatment between the experimental groups; however, modest improvements in relaxation were present in MREN-R. *P<0.05 vs. SD controls by single-factor ANOVA with Fisher’s LSD post hoc analysis.
Relaxation time was also calculated for each cardiac cycle and averaged across
incremental volume steps. Compared to SD controls, relaxation time (Figure 28) was
significantly slower in both MREN-V (0.048±0.001 vs. 0.041±0.001 s, P=0.001) and MREN-R
(0.048±0.001 vs. 0.041±0.001 s, P=0.003).
59

Figure 28. Relaxation time
Relaxation as measured by the time required for pressure to fall from 75% to 25% of the maximum (relaxation time) was significantly elongated for both MREN groups vs. SD controls, despite rhRLX administration. *P<0.05 vs. SD by single-factor ANOVA with Fisher’s LSD post hoc analysis.
To test diastolic function under stressed conditions, cardiac pacing was increased and a final
Frank-Starling protocol was run. LV passive stiffness increased in each experimental group under the
stressed condition versus baseline based on the upward shifted EDPVR (Figure 29A-C). The difference
between the EDPVRs of the stressed and baseline conditions (ΔEDP) revealed that the beneficial effect of
rhRLX administration to improve diastolic passive stiffness persisted despite the stress perturbation
(Figure 29D).
60

Figure 29. End-diastolic function in pacing studies
Diastolic function was observed under stressed conditions (increased pacing) and EDPVRs were compared between baseline and stressed condition for each experimental group (A-C). The difference in end-diastolic pressure from each condition (ΔEDP) was plotted for all groups against normalized volume. *P<0.05 vs. SD, #P<0.05 vs. MREN-R by repeated-measures ANOVA with post hoc analysis by Fisher’s LSD.
5.2.7 Summary
Here we have shown that 14 days of exogenous rhRLX administration is capable of reversing
LV fibrosis on both the gene- and protein-levels in the MREN rat model. We have shown that
endogenous relaxin expression responds in a compensatory manner in an active fibrotic
61

environment, similar to the other biomarkers presented. As such, the reversal of LV fibrosis by
rhRLX administration also normalized the endogenous expression of RXFP-1 and reduced the
expression of relaxin-1 and relaxin-3. While exogenous relaxin administration had no significant
effect on contractile function in the MREN model, the reversal of LV fibrosis was associated
with a reduction in diastolic passive stiffness as evidenced by a significant downward shift of the
EDPVR and stress-strain relationship compared to MREN-V. In contrast to the improvements in
passive stiffness, rhRLX administration had no effect on LV diastolic relaxation in MREN.
62

6.0 DISCUSSION
6.1 ENDOGENOUS RELAXIN IN AN ENVIRONMENT OF FIBROSIS
Gene expression patterns of relaxin family peptides and their respective receptors have been
studied in several different animal models by several different methods over the last two decades
[27]. The primary relaxin receptor, RXFP-1, is the only receptor to date that has been localized
in heart tissue and has the ability to bind both rat relaxin isoforms (relaxin-1 and relaxin-3) as
well as human relaxin-2. For this reason, the mRNA expression of the RXFP-1 receptor and its
two primary ligands, relaxin-1 and relaxin-3, was quantified in LV tissue from aged SHR and
transgenic MREN rats to characterize the response of the endogenous relaxin receptor-ligand
system in an environment of LV fibrosis.
Both hypertension- and age-associated models of LV fibrosis presented a similar trend: a
~1.5-fold, non-significant increase in relaxin message (both relaxin-1 and relaxin-3) and a ~2-
4.5-fold, significant increase in mRNA expression for the relaxin receptor RXFP-1 compared to
respective controls. Previous studies with genetically modified mouse models have shown that
deficiency of relaxin (message and/or receptor knock-out) leads to fibrosis [23, 40, 56]. Here we
show a compensatory response in which the endogenous relaxin receptor-ligand system is
upregulated in an environment of established fibrosis, at least at the level of gene expression.
Together, these findings clearly demonstrate that relaxin plays a role in the homeostasis of
63

fibrosis. In a healthy setting it acts to regulate collagen and when fibrosis sets in it adapts in
attempt to fight back. However, the adaptive response is not powerful enough to prevent or
reverse fibrotic collagen accumulation.
There are few comparable studies available that consider endogenous relaxin receptor-
ligand expression in an environment of established fibrosis. However, when considering
precursors to fibrosis – either acute or chronic stressors – an adaptive response of the
endogenous relaxin receptor-ligand system in the direction of a compensatory mechanism has
been observed which agrees with our findings. Dschietzig et al. showed that an acute increase in
LV end-diastolic pressure from 5 to 25 mmHg in male Wistar rats for two hours correlated with
elevated mRNA expression of relaxin-1 in LV tissue [29]. Furthermore, they correlated increased
circulating plasma levels of human relaxin to severe congestive heart failure (CHF) in human
patients; this, they predicted, was indicative of a compensatory mechanism in which the relaxin
system is upregulated in the failing heart.
6.1.1 Relaxin Isoforms in the Rat Left Ventricle
The current understanding is that endogenous relaxin message is expressed in heart tissue and
works locally as a ligand to RXFP-1 to facilitate cardiovascular adaptations to fibrosis [27].
However, there is not yet a definitive characterization of which isoforms of relaxin exist in rat
left atria and/or ventricles and how they are distributed. There is gene-level evidence that the
relaxin-3 isoform is expressed in rat atria and ventricles, and this mRNA expression is
upregulated with cardiac remodeling after myocardial infarction [57]. This study by Kompa et al.
also concluded by RT-PCR that relaxin-1 is not expressed in rat atria or ventricles, which
contradicts previous observations. In 1995, Gunnersen et al. demonstrated by Northern blot that
64

relaxin-1 is expressed in rat heart tissue, though there was no separation between atria and
ventricles and the expression was lower than that in other organ systems such as reproductive
tissues and brain [58]. It must also be noted, that this review of previous findings comes from
reports utilizing different qualitative or quantitative techniques and the gene targets were not
always characterized for cross-reactivity between different relaxin isoforms [27].
The Quantitect gene primers used for endogenous relaxin receptor-ligand expression
experiments described herein are commercially-available and bioinformatically validated based
on the GenBank NCBI reference sequences for rat relaxin-1 (NM_013413.1), relaxin-3
(NM_170667.2), and RXFP-1 (NM_201417.1). Visual inspection of amplification plots and
melting temperature curves was performed after each experiment to validate primer specificity
and to ensure no primer-dimer formation (indicated by single representative peaks for each
primer assay, explained in Section 4.1.4.). To our knowledge, the results presented here
represent the first conclusive evidence that relaxin message (relaxin-1 and relaxin-3) and
receptor (RXFP-1) are expressed locally in male rat LV tissue and this system is upregulated in
the environment of LV fibrosis.
6.1.2 Adaptive Upregulation of Endogenous Relaxin in Hypertension-Associated Fibrosis
We looked at the transgenic hypertensive MREN rat compared to its age-matched, species-
background Sprague-Dawley controls as a model of hypertension-associated LV fibrosis. The
genetic manipulation in MREN rats allowed for the development of severe hypertension and LV
fibrosis at a young age and we found that in this model of fibrosis, there tended to be minor
increases in relaxin-1 and relaxin-3 compared to SD with only the 4.5-fold increase in RXFP-1 in
MREN reaching significance. These results confirmed for us that the relaxin receptor-ligand
65

system is upregulated in the fibrotic LV of MREN rats compared to their normotensive controls,
at least regarding the RXFP-1 receptor. Next we wanted to see if this was a generalized
phenomenon by testing a second model of hypertension-associated LV fibrosis. We continued
the study with the aged, hypertensive SHR compared to age-matched, normotensive WKY rats to
provide a second model of hypertension-associated fibrosis. We confirmed that SHR had
significantly higher blood pressures and significantly increased myocardial collagen compared to
the WKY controls, confirming LV fibrosis in this model. As we saw in the MREN model, this
LV fibrosis in SHR was associated with elevations in the endogenous mRNA expression of the
relaxin receptor-ligand system, though in this case, the effect did not reach statistical
significance. The increased mRNA expression for RXFP-1 was more dramatic in the MREN
model compared to the SHR model of fibrosis, though both were elevated above their respective
controls. This finding suggests a mechanism for relaxin receptor-ligand system upregulation that
is independent of hypertension. Instead, we suspect that contributions from the fibrotic
environment trigger the expression of endogenous relaxin receptor-ligand expression and Pinto
et al. concluded that at the same age, MREN demonstrate significantly more severe LV
hypertrophy, fibrosis, and impaired diastolic function (reduced -dP/dtmin) compared to SHR [13].
Despite the lack of statistical significance in mRNA expression of the relaxin receptor-
ligand system in SHR compared to WKY, this data, in addition to the results from the MREN
model allowed us to conclude that there are trends towards an upregulation of the relaxin
receptor-ligand system in a setting of fibrosis. Consequently, we wanted to test if this trend
would also present in a condition of aging, which is known to naturally contribute to fibrosis.
66

6.1.3 Adaptive Upregulation of Endogenous Relaxin in Aging-Associated Fibrosis
We studied young SHR rats (~4 months) compared to aged SHR rats (~12 months) to represent a
model of age-related fibrosis accelerated by hypertension. Unfortunately we did not examine
myocardial collagen to confirm fibrosis is this cohort, however we found that aging was
associated with an upregulation in the relaxin receptor-ligand system similar to the other models.
Our results showed a modest increase in relaxin-1 and relaxin-3 expression, as seen before,
suggesting that relaxin production is not impaired as a function of aging. Instead, the relaxin
receptor RXFP-1 seems to be adaptive in this model of aging-associated LV fibrosis as
evidenced by the significant 2.5-fold increase in mRNA expression in LV tissue from aged SHR
versus young SHR.
6.1.4 Relaxin: A Natural Player in Cardiac Fibrosis
While significant research has gone into understanding the antifibrotic actions downstream of
relaxin receptor-ligand binding, mostly involving NO-mediated mechanisms, limited information
is available regarding regulators of endogenous relaxin expression. Most recently, Moore et al.
made substantial progress to elucidate mechanisms of heart failure that contribute to RXFP-1
expression. Using rat cardiomyocytes, they found that RXFP-1 expression was upregulated 2-3-
fold after stimulation by alpha-adrenergic receptor agonists (α-AR) and this response was
inhibited by beta-adrenergic receptor agonists (β-AR). They suggested a potential connection to
current heart failure therapies that utilize β-AR blockers; speculating that in heart failure, where
circulating levels of norepinephrine (a non-specific adrenergic receptor agonist) are known to be
elevated [59], β-AR blockers might act to disinhibit the upregulation of endogenous RXFP-1 and
67

downstream antifibrotic effects. Furthermore, Moore et al. showed that the α-AR-mediated
RXFP-1 upregulation was abolished by selectively inhibiting the PKC or ERK signaling
pathways, suggesting their involvement in the mechanism of RXFP-1 regulation [60]. Since both
of these pathways are activated downstream of RXFP-1 activation, this finding could indicate a
potential positive feedback mechanism. Further studies are required, possibly involving gene
silencing or targeted inactivation of players in the fibrosis pathway, to elucidate the molecular
mechanisms and pathological significance of the regulation of the endogenous relaxin receptor-
ligand system.
6.2 EXOGENOUS RELAXIN ADMINISTRATION REVERSES LV FIBROSIS AND
IMPROVES DIASTOLIC FUNCTION
Previous treatment studies have shown that exogenous relaxin administration has the ability to
reverse established fibrosis and repair diastolic dysfunction in vitro [23] and at least partially in
vivo (Table 1). Our work has confirmed that 14 days of rhRLX administration is capable of
significantly improving diastolic function at the whole organ level, presumably through the
reversal of LV fibrosis by NO-mediated mechanisms. We first confirmed that the MREN rats
exhibit significant hypertension and hypertrophy, and administration of rhRLX had no effect on
these precursors to diastolic dysfunction. Hence, we wanted to assess the presence and
expression patterns of gene-level biomarkers of fibrosis in MREN rats and how administration of
rhRLX may interfere at the level of mRNA expression.
68

6.2.1 Gene-Level Regulation of Fibrotic Biomarkers
The significant upregulation of the profibrotic cytokine TGFβ in MREN-V was consistent with
other studies in this model [61]. As detailed in Section 1.3, TGFβ plays a major role in collagen
synthesis by activating the Smad signaling pathway that results in profibrotic gene transcription
and fibroblast to myofibroblast transition. Administration of rhRLX was capable of reversing the
profibrotic upregulation of TGFβ in MREN-R to baseline levels not different from SD controls.
The inhibition of collagen synthesis via TGFβ regulation has been confirmed in other rhRLX-
treatment studies [23, 26, 62] and in the MREN model, specifically [42, 61]. While no assays
were performed to quantify collagen synthesis directly, it has been shown that rat TGFβ-treated
fibroblasts have significantly increased protein-level expression of α-SMA which facilitates
myofibroblast transition, and administration of rhRLX recovers this profibrotic response to
baseline levels of non-treated cells [23]. Furthermore, Samuel et al. showed in their 2008 study
utilizing the MREN rat model that diabetic (streptozotocin-treated) MREN rats treated with
rhRLX had significantly reduced α-SMA compared with vehicle-treated MREN and this was
associated with a significant reduction in cardiac collagen concentration [42].
Brain natriuretic peptide (BNP) is locally expressed by the ventricles in conditions of
cardiac overload and is known to act as a natural diuretic in response to an overactive renin-
angiotensin system. With respect to fibrosis, BNP has been identified as a bioactive signaling
molecule that activates downstream pathways of collagen turnover, including the matrix
metalloproteinases (MMPs) [63]. It is likely that the upregulation of BNP expression in LV from
both MREN-V and MREN-R is related to their genotype of an overactive RAS, and less to do
with fibrosis mechanisms.
69

While the biological role of MMPs is to degrade mature collagen networks, a pillar of
diastolic heart failure is the excessive turnover of collagen, with both synthesis and degradation
mechanisms activated [4]. Fibrotic overexpression of MMP-2 was present in the MREN-V
model, and as in the aged SHR model [62], this phenotype was reversed by rhRLX
administration and normalized to baseline levels. There were no detectable differences in the
expression of MMP-9 across all groups. These results conflict with previous in vitro experiments
that report an increase in MMP-2 and MMP-9 gene expression and activity in TGFβ-treated
fibroblasts after receiving rhRLX treatment. Because of the gene-level evidence that
administration of rhRLX inhibits TGFβ production and does not increase MMP expression, it
seems that the antifibrotic effects of relaxin are targeted to collagen synthesis and less involved
with degradation pathways. A better understanding of the degradation mechanisms involved with
the reversal of fibrosis by administration of rhRLX will require a broader examination of the
gene- and protein-level expression and activity of multiple MMPs and of their endogenous
inhibitors (tissue inhibitors of metalloproteinases, TIMPs).
In agreement with our findings that endogenous relaxin receptor-ligand expression is
upregulated in a fibrotic environment (Section 6.1), the reversal of LV fibrosis by administration
of rhRLX also normalized the endogenous expression of RXFP-1 and reduced the expression of
relaxin-1 and relaxin-3. Since the regulatory mechanisms that govern endogenous relaxin
receptor-ligand system expression are still widely disputed, we can only speculate that
profibrotic pathways (possibly involving TGFβ) may contribute to adaptive upregulation of the
endogenous relaxin receptor-ligand system and by eliminating this stimulus, administration of
rhRLX restores the endogenous relaxin system to baseline levels for healthy collagen regulation.
70

6.2.2 Reversal of Interstitial and Perivascular Fibrosis
Pronounced LV interstitial and perivascular fibrosis is hallmark of the hypertensive MREN
model [13, 42, 64-66]. Here, we have confirmed that 14 days of rhRLX administration is capable
of reversing both interstitial and perivascular fibrosis in MREN, as shown previously [42], and
we have expanded on this finding to include an element of regional dependence of collagen
accumulation in this model.
Perivascular fibrosis has long been associated with the progression of HHD to diastolic
dysfunction because of the perivascular inflammation that occurs in response to the pressure-
overloaded LV. In the early stages of HHD, LV fibrosis is mainly observed in the perivascular
space where the vascular endothelium is in contact with profibrotic cytokines (like TGFβ) and
extends radially outward to the interstitial space [8]. For these reasons, perivascular fibrosis in
the MREN model has been used as an indicator of a fibrotic phenotype [65, 66] and was
consistent in our results. The concept of a collagen gradient in the radial direction from the
blood-contacting endothelium outward can be adapted from the vasculature to explain the
heterogeneity of collagen deposition in the LV endocardium versus the epicardium. The
chemical influences occurring at the LV endothelium may work alone or in concert with
mechanical influences of the endocardium itself which is known to behave as a stiffer material
than epicardium [67], to promote the region-dependent progression of fibrosis within the
myocardial interstitium. Having confirmed that the MREN rat model demonstrates the precursors
to diastolic dysfunction – hypertension, hypertrophy, and fibrosis measured at the gene- and
tissue-level – and administration of rhRLX was capable of removing the insult of fibrosis, we
predicted that MREN would demonstrate impaired LV function and the effects of relaxin would
carry through to therapeutically improve this condition.
71

6.2.3 Left Ventricular Contractility
Exogenous relaxin administration had no significant effect on contractile function in the MREN
model. While some previous in vitro and in vivo studies in rodents suggest a positive inotropic
effect in the atria [57], this response was not present in larger animals or humans, nor has a direct
effect been confirmed in ventricular tissue [68]. More importantly, we were interested in how
diastolic dysfunction would manifest in the fibrotic MREN rats and what effect administration of
rhRLX would have on diastolic passive stiffness and LV relaxation.
6.2.4 Improvements to Diastolic Function
The significant reduction in profibrotic gene expression and tissue-level interstitial and
perivascular collagen within the LV endocardium after administration of rhRLX was associated
with a significant improvement in diastolic function. These compositional level improvements
that translate to reduced passive stiffness are due to the increase in nitric oxide (NO)-dependent
collagen turnover which occurs downstream of relaxin receptor-ligand binding [27, 30, 36]. The
production of NO in response to activated RXFP-1 prevents myofibroblast transition [36] and
indirectly upregulates collagen degradation [38] to remodel the myocardial collagen network of
cross-linked fibers that contributes to passive stiffness. Evidence of reduced LV passive stiffness
after administration of rhRLX was observed in MREN-R as a significant downward shift in slope
of the EDPVR compared to MREN-V. This reduction was further validated by the dPed/dV-Ped
relationship which showed that at the same end-diastolic pressures, MREN-R had significantly
reduced stiffness coefficients. The downward shifted slope of the end-diastolic stress-midwall
strain relationship provided evidence that administration of rhRLX also improved the material
72

stiffness of the myocardium, most likely due to reduced cardiomyocyte stiffness in response to
increased bioavailability of NO.
Diastolic function is defined by both properties of passive stiffness and relaxation. We
expected that both properties would be improved in LV treated with rhRLX because of the
significant collagen remodeling in the endocardium and increased availability of NO. However,
our results showed that rhRLX administration had no effect on LV relaxation in MREN. The
maximal rate of pressure relaxation (-dP/dtmin) was significantly blunted in MREN-V and could
not be recovered by rhRLX administration in MREN-R. The relaxation time was also
significantly prolonged in both MREN groups versus SD controls with no improvement from
rhRLX administration. Hypertension is associated with elevated reactive oxygen species (ROS)
that in the presence of increased NO from rhRLX administration may form peroxynitrite
(ONOO-). High levels of peroxynitrite have been shown to slow diastolic relaxation by
modifying myocardial protein structure and function, particularly affecting Ca2+ reuptake by the
sarcoplasmic reticulum [9]. Therefore, we suspect that while diastolic passive stiffness is
improved by relaxin’s NO-mediated reduction in myocardial collagen, the adverse pathways
involving ONOO- may still be at play preventing an improvement in relaxation.
Despite the persistent relaxation dysfunction, we conducted a final experiment to test the
effect of administration of rhRLX under cardiac stress, which is a clinical problem from patients
with diastolic heart failure. We increased the pacing during the Frank-Starling protocol to
simulate increased heart rate as a condition of cardiac stress. By examination of the EDPVR,
passive stiffness was slightly elevated in the SD controls consistent with what is seen clinically.
The fibrotic MREN-V rats had a much more dramatic response to the elevated heart rate and
passive stiffness was significantly increased, which would pose a danger for patients in diastolic
73

heart failure. Administration of rhRLX to MREN-R effectively reduced this passive stiffness
(evidenced by a significant reduction in ΔEDP-volume relationship) and these rats were
significantly less affected by the cardiac stress condition compared to MREN-V that had not
received treatment, which is an important clinically relevant finding.
6.2.5 Targeted Effects of Relaxin to Fibrotic Environment
A major therapeutic advantage of exogenous relaxin therapy is the ability of the hormone to
selectively prevent and reverse a fibrotic phenotype without damaging baseline collagen levels.
While fibrotic dysregulation of collagen is detrimental to proper cardiac function, healthy
collagen turnover is responsible for many structural and mechanical properties of the
myocardium. Disease-targeted effects of rhRLX administration have been observed in models of
renal [25, 26], lung [26], and cardiac [62] fibrosis. For these reasons, we omitted the treatment
control group (SD-R) from our analysis of exogenous relaxin administration. We have
previously confirmed that rhRLX administration elicits no unwanted treatment effects in a
similar normotensive rat model (Wistar-Hannover, WHAN). These data are presented in
Appendix C.
6.2.6 Study Limitations
One of the major findings of this work is that administration of exogenous relaxin is capable of
reducing myocardial collagen, and we attribute this to mechanisms associated with collagen
synthesis downstream of TGFβ. However, no assays beyond the gene-level mRNA expression of
TGFβ were performed to confirm this conclusion. Previously, the MREN rat was studied as a
74

model of diabetic cardiomyopathy (streptozotocin-treated) and exogenous relaxin was
administered for 14 days following the same methods used here [42]. In this study, the reversal
of interstitial fibrosis by relaxin was associated with reduced protein-level expression of alpha-
smooth muscle actin (αSMA), which is commonly used as an indicator of fibroblast to
myofibroblast transition and hence collagen synthesis. Because of this previous report, we did
not include this assay as part of our experimental design.
We found that the MREN rat model did not have increased contractility despite its
hypertensive and hypertrophic state, like we expected (Section 5.2.5). The nature of the isolated,
perfused heart protocol requires the assessment of cardiac function outside of known contributors
to contractility like the sympathetic nervous system. This is a limitation that might have led to
the unexpected results we observed; however, since the scope of this work did not require a
complete assessment of contractile function, we did not include further analysis. To assess the
contractile function and kinetics of contraction in the MREN model, future studies could be
designed which involve the conductance catheter method that measures LV systolic and diastolic
function in vivo or the cardiomyocytes could be isolated and tested for contractile force using
methods described in Section 8.2.
We acknowledge that the systemic delivery of exogenous rhRLX may not be optimal
since high dosages are required to achieve therapeutic antifibrotic effects. For the purposes of
this work, we implemented a dosage and treatment duration for administration of rhRLX which
was shown previously to be therapeutic [21, 25, 40-42, 62] and validated by our own preliminary
studies (Appendix B). However, the half-life of recombinant human relaxin-2 is relatively short
and clearance through the kidneys can occur in as little as 5 hours (in non-pregnant rabbits [69]),
therefore continued systemic infusion of rhRLX is necessary for therapeutic reversal of fibrosis
75

but may have off-target effects. This speaks to the development of a localized delivery scheme
and future studies are currently being considered which include localized infusion of exogenous
rhRLX in the pericardial space.
Finally, it is acknowledged that myocardial collagen plays an important role in healthy
heart function; it provides structural support and prevents excessive chamber dilation (or
myocyte stretch). Therefore, theoretically, reducing collagen may have adverse consequences.
While we provide evidence that 14 days of rhRLX administration is effective for reversing
interstitial and perivascular fibrosis and providing functional improvements during diastole, we
did not include specific in vivo experiments to confirm that administration of relaxin has no
detrimental effects on the structural integrity of the LV. We have, however, shown that
administration of relaxin has no effect on LV dilation under ex vivo conditions since there are no
differences between V0 (Figure 22) or Vmax between MREN rats treated with rhRLX or vehicle
treatment (Vmax: 184±3 and 188±5 μl, respectively). We also conducted a study in normotensive
Wistar-Hannover rats and confirmed that administration of rhRLX has no collagen-reducing
effects in healthy tissue (Appendix C). Thus, relaxin-induced reduction in collagen
concentration appears to be selective (“intelligent”): it reduces collagen only when there is
fibrosis. Furthermore, there is no evidence of any adverse effects of relaxin treatment on
ventricular structure. Additional studies are necessary to identify mechanisms underlying this
“intelligent” antifibrotic effect of relaxin.
76

7.0 TAKE HOME MESSAGES
Endogenous mRNA expression of the relaxin receptor-ligand was measured in three models of
aging and hypertension to detect the natural response of the relaxin system to an environment of
fibrosis. The aged SHR model and the transgenic MREN model both represent severe
hypertension and LV hypertrophy that progresses toward heart failure in a similar fashion to that
seen in humans [15, 16, 70]. In all models, evidence of modest upregulation of relaxin-1 and
relaxin-3 and significant upregulation of RXFP-1 was detected in LV from the fibrotic group.
This finding confirms a natural adaptive response of the relaxin system in failing heart tissue, yet
this compensatory mechanism is not sufficient to reverse the fibrotic phenotype in these animal
models. Administering exogenous relaxin treatment for 14 days can reverse the fibrotic
phenotype and improve diastolic passive stiffness. These findings may contribute to a clinically
relevant strategy for treating diastolic heart failure.
77

8.0 FUTURE DIRECTIONS
The topics and findings discussed herein present several opportunities for future studies
addressing the antifibrotic effects downstream of relaxin receptor-ligand binding to improve
diastolic function. Specifically, we have reviewed that exogenous relaxin binding its primary
receptor RXFP-1 acts to regulate collagen synthesis, presumably through mechanisms involving
NO. Therefore, future efforts focusing on NO upregulation may be as effective, or more
effective, for achieving the therapeutic effects seen in the exogenous relaxin administration
studies. Similarly, combination therapies may also be considered which include known anti-
hypertensive drugs or anti-inflammatories in addition to antifibrotic relaxin to improve diastolic
function by both reducing passive stiffness and improving ventricular relaxation. It will also be
beneficial to study the functional effects of such therapies zoomed in to the level of
cardiomyocyte and myofilament dynamics. Potential strategies for developing these future
studies are considered below.
8.1 COMBINATION THERAPIES
It has been shown that relaxin binding to its primary receptor RXFP-1 initiates a signaling
cascade that results in the upregulation of NO production that has downstream antifibrotic effects
(Figure 1). Therefore, the question presents, “Why not simply upregulate NO production as a
78

therapeutic approach?” This is a reasonable consideration, and will likely be addressed as further
studies implementing antifibrotic approaches against diastolic dysfunction are developed. Below,
we propose a few possible therapeutic strategies and their implications in models of diastolic
heart failure.
8.1.1 Exogenous Relaxin and Anti-Hypertensive Medication
As described in Section 1.1, hypertension is the primary precursor to diastolic dysfunction since
it provides stimuli for increasing hypertrophy (elevated afterload) and fibrosis (increased TGFβ
and production and cross-linking of myocardial collagen). Therefore, it seems logical that
including anti-hypertensive medication along with antifibrotic relaxin may improve diastolic
function by reducing the precursors to diastolic function.
There are currently several anti-hypertensive drugs available clinically which serve to
reduce blood pressure by different pathways. Diuretics (many involving vasodilatory properties)
help the kidneys eliminate excess salt and water from the body's tissues and blood. ACE
inhibitors inhibit the activation of angiotensin-converting enzyme (ACE), an enzyme responsible
for the conversion of angiotensin I into angiotensin II, a potent vasoconstrictor. Similar to ACE
inhibitors, angiotensin II receptor blockers (ARBs) work by antagonizing the activation of
angiotensin receptors. Diuretics, ACE inhibitors, and ARBs may be beneficial for reducing the
mechanical work of the heart and thereby removing the stimuli that increase hypertrophy and
TGFβ production that contribute to fibrosis and diastolic dysfunction. However, these therapies
do little to reverse already established fibrosis and diastolic dysfunction. Hence, harnessing the
anti-hypertensive effects of these drugs, in concert with relaxin’s ability to reverse fibrosis and
79

restore proper collagen regulation, may be an effective strategy for improving diastolic heart
failure.
8.1.2 Exogenous Relaxin and Anti-Inflammatory Medication
The newly proposed paradigm that hypertension leads to a systemic proinflammatory state which
increases ROS and ONOO-, in addition to other profibrotic mechanisms, introduces another
potential target for intervention. Furthermore, we attributed the lack of improvement to
ventricular relaxation after exogenous relaxin administration to the persistence of ONOO-
disabling proper cardiomyocyte relaxation. To improve this condition, research has focused on
the use of substances with antioxidative properties such as statins and resveratrol. It may be that
including an anti-inflammatory to improve ventricular relaxation in addition to the reversal of
fibrosis by exogenous relaxin administration would provide solutions to both impaired relaxation
and increased passive stiffness seen in diastolic heart failure.
From Figure 1, which was developed as a compilation of many previous studies
elucidating the effects downstream of relaxin receptor-ligand binding, we know that the
antifibrotic effects of relaxin are attributed mainly to the upregulation of NO production in target
tissues. For this reason, we acknowledge that a more appropriate therapeutic approach for
reversing the diastolic dysfunction that occurs from increased LV fibrosis may be to focus on
NO specifically, and how it can be delivered or upregulated clinically. Sildenafil is a drug that
increases NO production by blocking the destruction of NO-producing cGMP by PDE-5. A
recent study showed that sildenafil was not able to increase levels of cGMP or improve LV
diastolic function, likely because of the reduced bioavailability of NO in heart failure [71];
therefore one could imagine that supplementing the sildenafil-treated system with NO through
80

exogenous relaxin administration could symbiotically improve diastolic dysfunction by
improving ventricular relaxation.
8.2 FUNCTIONAL STUDIES AT THE LEVEL OF CARDIOMYOCYTES
Some questions still remain after completion of Aim 2. Mainly, is the reversal of LV passive
stiffness that we see after administration of relaxin attributable to the reduction in myocardial
collagen, or are there underlying mechanisms at play regarding the stiffness and relaxation
properties of the cardiomyocytes? Future studies may be developed to address these questions
and provide further detail to the implementation of exogenous relaxin as a therapy for diastolic
heart failure.
The functional experiments that we performed provided information about LV contractile
and diastolic function in response to administration of relaxin. As explained in Section 1.1, the
LV is a composite structure that is made up contractile cardiomyocytes, cardiac fibroblasts and
extracellular matrix proteins. Therefore, as an addendum to the functional experiments
performed on the isolated, perfused heart, we could zoom in to the level of cardiac muscle fibers
and cardiomyocytes dissected from animals that have been treated with exogenous relaxin to
observe cellular properties of contraction, as well as passive stiffness and relaxation. Isolated
fibers are typically representative of the intact myocardium in measurements of cardiac
mechanics yet are free from connective tissue and endothelium, which cause significant
modification of tissue viscoelastic and contractile properties [72]. Therefore, they are very
useful, and sometimes superior, tools for investigating cellular mechanisms of the LV. Recently,
researchers have questioned whether the increased myocardial passive stiffness seen in diastolic
81

heart failure is attributable completely to increased myocardial collagen, or if subcellular
contributions involving titin may be responsible.
Cardiomyocyte stiffness is partially dependent on distensibility of the giant cytoskeletal
protein titin, which spans half the length of the sarcomere from the Z disk to the M line. Titin
functions as a bidirectional spring responsible for early diastolic recoil and late diastolic
relaxation of cardiomyocytes [73]. To test the separate influences of titin and collagen in
diastolic dysfunction and how administration of relaxin may be beneficial, studies could be
designed to disable titin in an environment of fibrosis. For example, a study conducted by Chung
et al. tested the passive force-length relations of skinned fibers before and after KI/KCl
administration. KI/KCl extracts thick and thin filaments leaving titin unanchored and therefore
measurements after this perturbation relate to the elasticity of the extracellular matrix alone. By
subtracting this relation from the baseline passive force-length relation before KI/KCl
administration, the elasticity attributable to titin can be calculated [74]. Borrowing this method,
cardiomyocytes isolated from rhRLX-treated animals (or isolated cardiomyocytes pretreated
with exogenous relaxin in vitro) would provide information about how administration of relaxin
reduces passive stiffness – either through mechanisms involving titin or through regulation of
collagen at the tissue level. These experiments will provide further understanding of the
mechanisms of relaxin’s antifibrotic actions and how it can therapeutically improve diastolic
heart failure.
82

APPENDIX A
EXOGENOUS RELAXIN ADMINISTRATION IN SHR RAT MODEL
This preliminary study was designed to test the compositional (gene- and protein-level indices of
LV fibrosis) and functional changes that occur after 14 days of rhRLX administration in the SHR
rat model of hypertension. SHR rats aged ~12 months were administered rhRLX (SHR-R, n=14)
or vehicle (SHR-V, n=5) by subcutaneous osmotic minipump for 14 days (0.5 mg/kg/day) and
effective administration was measured by rhRLX ELISA Assay (Figure 30). Hypertension was
confirmed in the SHR groups by noninvasive blood pressure tail-cuff (Table 7). Sex- and age-
matched WKY rats were used as normotensive controls (n=4). Animals were sacrificed at several
different experimental end-points and data was shared among collaborative research groups.
Gene-level mRNA expression of known profibrotic biomarkers (TGFβ, BNP, MMP2, MMP9)
was performed by qPCR. Interstitial LV fibrosis was determined by immunohistochemistry using
a primary antibody against collagen-1 protein in frozen LV tissue samples and quantified by
image analysis. All qPCR and immunohistochemistry assays in this preliminary study were
performed by Wenyu Xiang under the guidance of Dr. Charlie McTiernan. Indices of LV
function (systolic and diastolic properties) were measured by the pressure-volume admittance
83
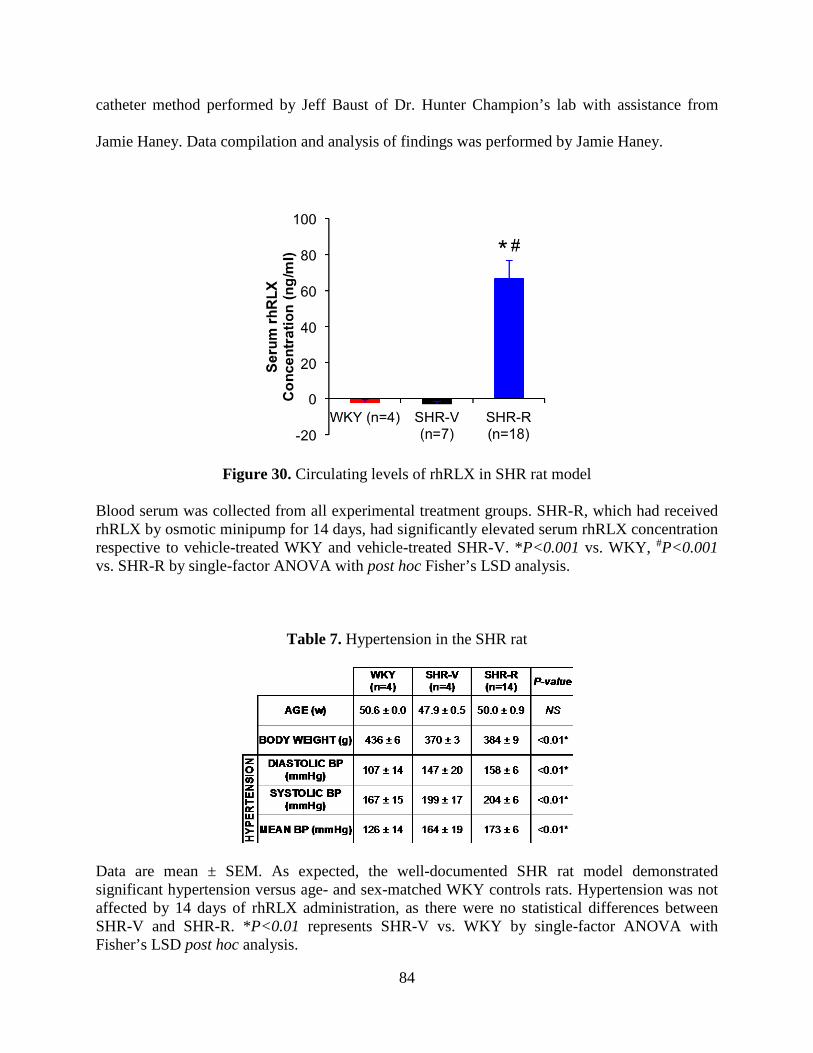
catheter method performed by Jeff Baust of Dr. Hunter Champion’s lab with assistance from
Jamie Haney. Data compilation and analysis of findings was performed by Jamie Haney.
Figure 30. Circulating levels of rhRLX in SHR rat model
Blood serum was collected from all experimental treatment groups. SHR-R, which had received rhRLX by osmotic minipump for 14 days, had significantly elevated serum rhRLX concentration respective to vehicle-treated WKY and vehicle-treated SHR-V. *P<0.001 vs. WKY, #P<0.001 vs. SHR-R by single-factor ANOVA with post hoc Fisher’s LSD analysis.
Table 7. Hypertension in the SHR rat
Data are mean ± SEM. As expected, the well-documented SHR rat model demonstrated significant hypertension versus age- and sex-matched WKY controls rats. Hypertension was not affected by 14 days of rhRLX administration, as there were no statistical differences between SHR-V and SHR-R. *P<0.01 represents SHR-V vs. WKY by single-factor ANOVA with Fisher’s LSD post hoc analysis.
84

When compared to WKY controls, SHR-V showed upregulated mRNA expression of all
known biomarkers of fibrosis: TGF-β, BNP, MMP2, and MMP9. After rhRLX administration,
this fibrotic phenotype was reversed significantly to baseline levels (Figure 31).
Figure 31. Fibrotic biomarker expression in rhRLX-treated SHR
Fibrotic biomarker mRNA expression for TGFβ, BNP, MMP2, and MMP9 from LV tissue of experimental treatment groups was expressed relative to WKY controls. Gene expression was quantified by real-time qPCR using specific primer assays for the genes of interest normalized by endogenous control gene, GAPDH. SHR-V had significantly elevated expression of all biomarkers versus WKY, and SHR-R showed a significant reduction from the fibrotic response. *P<0.05 vs. WKY, #P<0.05 vs. SHR-R by single-factor ANOVA with Fisher’s LSD post hoc analysis.
Interstitial collagen was measured by immunohistochemistry in frozen endocardial LV
samples from all experimental groups. Exogenous relaxin administration significantly reduced
LV collagen area fraction (displayed in Figure 32 as percentage of total tissue area) in SHR-R
when compared to SHR-V (2.9% vs. 15.1%, P<0.05). LV fibrosis was unaffected by rhRLX
administration in normotensive WKY-R compared to WKY-V rats (1.1% vs. 0.73%, P=0.31),
hence vehicle-treated WKY are used as the control group. Figure 32 also includes the qualitative
85

immunostaining of a representative SHR-R and SHR-V samples illustrating the positively
stained collagen fraction in red, cytoplasmic staining in green, and nuclear stain in blue.
Figure 32. Tissue-level LV fibrosis in rhRLX-treated SHR
Interstitial LV collagen antibody expression (as percentage of total tissue area) was significantly higher in SHR-V compared to WKY. Relaxin administration was able to reverse this expression in SHR-R to where it was not significantly different from WKY. *P<0.05 vs. WKY and #P<0.05 vs. SHR-R by single-factor ANOVA with Fisher’s LSD post hoc analysis.
Although rhRLX administration to SHR-R was able to significantly reverse LV fibrosis
on the compositional level, there was no conclusive evidence for functional improvements. There
were no significant differences in kinetic indices of contractility (+dP/dtmax and rise time) across
all experimental groups (Figure 33).
SHR-V SHR-R
86
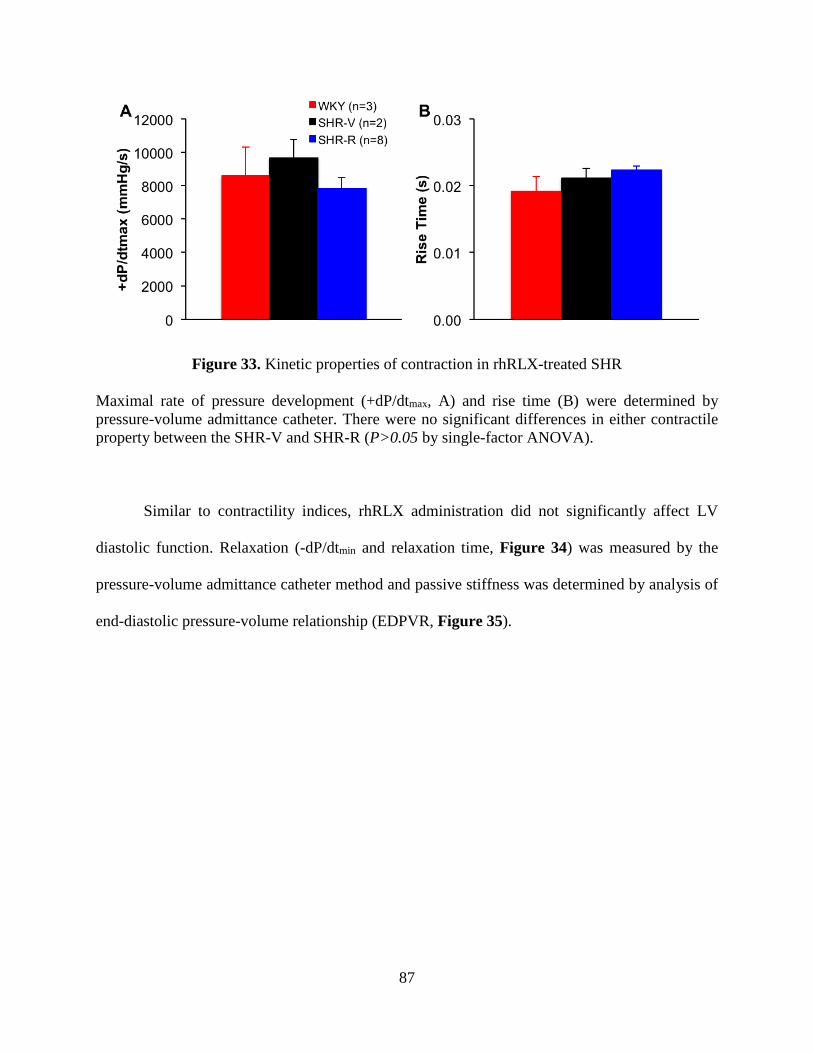
Figure 33. Kinetic properties of contraction in rhRLX-treated SHR
Maximal rate of pressure development (+dP/dtmax, A) and rise time (B) were determined by pressure-volume admittance catheter. There were no significant differences in either contractile property between the SHR-V and SHR-R (P>0.05 by single-factor ANOVA).
Similar to contractility indices, rhRLX administration did not significantly affect LV
diastolic function. Relaxation (-dP/dtmin and relaxation time, Figure 34) was measured by the
pressure-volume admittance catheter method and passive stiffness was determined by analysis of
end-diastolic pressure-volume relationship (EDPVR, Figure 35).
87

Figure 34. Kinetic properties of relaxation in rhRLX-treated SHR
Maximal rate of pressure relaxation (-dP/dtmin, A) and relaxation time (B) were determined by pressure-volume admittance catheter. There were no significant differences in either relaxation property between the SHR-V and SHR-R (P>0.05 by single-factor ANOVA).
Figure 35. EDPVR in rhRLX-treated SHR
End-diastolic pressure-volume relationships (EDPVR) were obtained for SHR-V and SHR-R by non-linear curve fitting using an exponential model of end-diastolic pressure as a function of LV volume. Results were averaged within experimental groups and plotted against normalized volume (V/V0). There were no significant differences between groups by repeated-measures ANOVA.
88

Results from this preliminary work provided evidence that exogenous rhRLX
administration is capable of reducing established LV fibrosis on the compositional level by
reversing upregulated mRNA expression of fibrotic biomarkers and reducing interstitial collagen
area fraction. However, no significant functional improvements were observed following rhRLX
administration. This was most likely due to small sample sizes due to limited availability of
aged rats and complications with the pressure-volume admittance catheter method. The strong
antifibrotic response seen in SHR-R provided rationale for continuing the study of exogenous
rhRLX administration using a different model of LV fibrosis and diastolic dysfunction (ie.
transgenic MREN rat model) and alternate methods for functional measurements (ie. isolated
perfused heart method and Frank-Starling protocol).
89

APPENDIX B
ANTIFIBROTIC EFFECTS OF EXOGENOUS RELAXIN AS A FUNCTION OF
TREATMENT DURATION
As a supplement to the preliminary study in Appendix A, we set out to determine how the
antifibrotic effects of administration of exogenous relaxin would present at longer treatment
durations. Previously, we have shown that 14 days of exogenous rhRLX administration is
capable of eliciting a molecular and compositional rectification from fibrosis in SHR.
Interestingly, this effect did not translate to functional changes as assessed through pressure-
volume relationships. The goal of this series of experiments was to investigate whether or not a
functional change from rhRLX may occur with longer treatment duration.
SHR rats aged ~12 months were administered rhRLX for either two- (SHR-R-2wk, n=4)
or four-weeks (SHR-R-4wk, n=4) or vehicle (SHR-V, n=2) by subcutaneous osmotic minipump
(0.5 mg/kg/day). Age- and sex-matched WKY rats were used as healthy controls (WKY, n=4).
Gene-level mRNA expression of known profibrotic biomarkers (TGFβ, BNP, MMP2, MMP9)
was performed by qPCR. Interstitial LV fibrosis was determined by immunohistochemistry using
a primary antibody against collagen-1 protein in frozen LV tissue samples and quantified by
image analysis. All qPCR and immunohistochemistry assays in this study were performed by
90

Wenyu Xiang under the guidance of Dr. Charlie McTiernan. Functional parameters of end-
diastolic pressure and volume were determined by echocardiography (W. Xiang) in anesthetized
animals. Data compilation and analysis of findings was performed by Jamie Haney.
When compared to WKY controls, SHR-V showed upregulated mRNA expression of all
known biomarkers of fibrosis: TGF-β, BNP, MMP2, and MMP9. After both rhRLX
administration treatment durations, this fibrotic phenotype was reversed significantly to baseline
levels (Figure 36). Interestingly, prolonged administration of rhRLX did not down-regulate the
mRNA expression of these biomarkers of fibrosis past a baseline that was comparable to WKY
and there were no differences between the SHR-R-2wk and SHR-R-4wk experimental groups.
Figure 36. Gene-level fibrosis in SHR after variable rhRLX treatment durations
Fibrotic biomarker mRNA expression for TGFβ, BNP, MMP2, and MMP9 from LV tissue of experimental treatment groups was expressed relative to WKY controls. Gene expression was quantified by real-time qPCR using specific primer assays for the genes of interest normalized by endogenous control gene, GAPDH. SHR-V had significantly elevated expression of all biomarkers versus WKY, and administration of rhRLX showed a significant reduction from the fibrotic response in both SHR-R-2wk and SHR-R-4wk groups. *P<0.01 vs. WKY, #P<0.01 vs. SHR-R-2wk, łP<0.01 vs. SHR-R-4wk by single-factor ANOVA with Fisher’s LSD post hoc analysis.
91

Interstitial collagen was measured by immunohistochemistry in frozen endocardial LV
samples from all experimental groups. Exogenous relaxin administration significantly reduced
LV collagen area fraction to a similar extent regardless of treatment duration (displayed in
Figure 37 as a ratio to total tissue area). This result suggests that 14 days of administration of
rhRLX is capable of fully reversing fibrotic collagen deposition and prolonged treatment does
not lead to continued collagen degradation past healthy levels (i.e. there were no significant
differences between either rhRLX treatment group and healthy WKY controls).
Figure 37. Tissue-level fibrosis in SHR after variable rhRLX treatment durations
Interstitial LV collagen antibody expression (as ratio to total tissue area) was significantly higher in SHR-V compared to WKY. After two (SHR-R-2wk) and four (SHR-R-4wk) weeks, rhRLX administration was able to reverse this expression to where it was not significantly different from WKY. *P<0.01 vs. WKY, #P<0.01 vs. SHR-R-2wk, łP<0.01 vs. SHR-R-4wk by single-factor ANOVA with Fisher’s LSD post hoc analysis.
Both durations of rhRLX administration were able to significantly reverse LV fibrosis on
the compositional level to a similar extent, therefore we assumed that functional effects resulting
92

from administration of rhRLX would be similar in these groups. We did not perform a full
characterization of LV contractile and diastolic function. Instead, we performed non-invasive
echocardiography to determine the parameters of end-diastolic volume and pressure which
would suggest any further improvement to diastolic function than presented in Appendix A at
the prolonged treatment duration (Figure 38). There was no conclusive evidence for functional
improvements after four weeks of administration of rhRLX; while the end-diastolic pressure was
modestly reduced in SHR-R-4wk compared to SHR-V and SHR-R-2wk, this finding
corresponded with modestly reduced end-diastolic volume, so the LV passive stiffness (inferred
loosely from this measurement) was unchanged.
Figure 38. End-diastolic function in SHR after variable rhRLX treatment durations
End-diastolic volume (A) and pressure (B) were determined by non-invasive echocardiography for each of the experimental groups. There were no significant differences between all experimental groups by single-factor ANOVA. The results from this study provided evidence that 14 days of administration of rhRLX is
sufficient for the reversal of compositional-level LV fibrosis and extending this treatment
93

duration does not seem to further improve diastolic function nor damage healthy collagen
deposition in the LV. This study provided the rationale for the dose and duration of exogenous
relaxin used in Aim 2. A final pilot study was developed following the results presented here. In
the study presented in Appendix C, we wanted to confirm that 14 days of administration of
rhRLX had no unwanted treatment effects on the healthy deposition of collagen or the proper
function of the LV in a normotensive animal model.
94

APPENDIX C
EXOGENOUS RELAXIN ADMINISTRATION IN A NORMOTENSIVE RAT MODEL
In previous work, it has been confirmed that exogenous rhRLX treatment is targeted to fibrosis
and does not have an effect on hypertension, hypertrophy, collagen degradation, or functional
parameters in healthy animal models [40, 75]. To validate that there were no significant effects
of rhRLX administration in a non-fibrotic environment, we utilized the Wistar-Hannover
(WHAN) normotensive rat as a treatment control group because of its availability and similarity
to other outbred rats, such as SD and WKY [76]. Male, WHAN rats aged ~15 weeks were
divided into two treatment groups: rhRLX-treated WHAN (WHAN-R, n=5) and VEH-treated
WHAN (WHAN-V, n=4). Exogenous relaxin was administered by osmotic minipump at the
same dose and duration as explained in Section 4.2.2.
Administration of rhRLX had no effect on blood pressure (as measured by noninvasive
blood pressure tail-cuff, Table 8) nor heart weights (Figure 39) in normotensive WHAN rats.
95

Table 8. Blood pressures in the WHAN normotensive rat
Data are mean±SEM. Blood pressure was not affected by 14 days of rhRLX administration in age- and sex-matched normotensive WHAN rats (P>0.05 by Student’s t-test).
Figure 39. Heart weights in the normotensive WHAN rats
There were no significant effects of rhRLX administration on normalized heart weights (HW), LV, or RV weights in normotensive WHAN rats (P>0.05 by Student’s t-test). Interstitial and perivascular LV fibrosis was determined by PSR staining on apical LV
cross-sections for vehicle- and rhRLX-treated normotensive WHAN rats. There were no
significant differences in interstitial collagen within either the epicardial or endocardial region,
96

and there was not heterogeneity between these regions (Figure 40A). Similarly, there were no
differences in perivascular collagen between WHAN-V and WHAN-R (Figure 40B).
Figure 40. Regional collagen quantification in rhRLX-treated normotensive rats
Images were processed computationally and interstitial and perivascular collagen was quantified for each of normotensive WHAN groups. There were no statistical differences in interstitial or perivascular collagen at the levels of the LV epicardium or endocardium across the groups, regardless of rhRLX administration (P>0.05 by Student’s t-test). LV function was assessed by the isolated perfused heart method and Frank-Starling
protocol as explained previously. Exogenous relaxin administration had no significant effect on
PPVR (Figure 41), DevPVR (Figure 42), or kinetic contractility parameters (+dP/dtmax and rise
time, Figure 43) in normotensive WHAN rats. Similarly, diastolic function was unaffected by
rhRLX administration as evidenced by EDPVR (Figure 44), and relaxation properties (-dP/dtmin
and relaxation time, Figure 45) in WHAN rats. All pressure-volume relationships are displayed
with normalized volume (V/V0); however, there were no significant differences in LV chamber
geometry as indicated by similar V0 between WHAN-V and WHAN-R (Figure 46).
97

Figure 41. PPVR for rhRLX-treated normotensive rats
LV contractile function, determined by PPVR and plotted against normalized volume, was not significantly affected by rhRLX administration in WHAN rats (P=0.912 by repeated-measures ANOVA).
Figure 42. DevPVRs for rhRLX-treated normotensive rats
LV contractile function, determined by DevPVR and plotted against normalized volume, was not significantly affected by rhRLX administration in WHAN rats (P=0.745 by repeated-measures ANOVA).
98

Figure 43. Kinetic properties of contraction for rhRLX-treated normotensive rats
Maximal rate of pressure development (+dP/dtmax, A) and rise time (B) were determined by the isolated perfused heart method and Frank-Starling protocol. There were no significant differences in either contractile property between the WHAN-V and WHAN-R (P>0.05 by single-factor ANOVA).
Figure 44. EDPVRs for rhRLX-treated normotensive rats
LV passive stiffness, determined by EDPVR and plotted against normalized volume, was not significantly affected by rhRLX administration in WHAN rats (P=0.101 by repeated-measures ANOVA).
99

Figure 45. Kinetic properties of relaxation for rhRLX-treated normotensive rats
Maximal rate of pressure relaxation (-dP/dtmin, A) and relaxation time (B) were determined by the isolated perfused heart method and Frank-Starling protocol. There were no significant differences in either relaxation property between the WHAN-V and WHAN-R (P>0.05 by single-factor ANOVA).
Figure 46. V0 values for rhRLX-treated normotensive rats
Exogenous rhRLX administration had no effect on LV dilation as evidenced by similar initial chamber volumes corresponding to Ped=0 mmHg (V0) between WHAN-V and WHAN-R (P=0.51 by Student’s t-test).
100

These studies in the WHAN rat model provide conclusive evidence that exogenous
rhRLX administration does not negatively affect physiological LV structure and function in a
normotensive, healthy environment.
101

APPENDIX D
DETAILED PROTOCOLS
D.1 PICROSIRIUS RED STAINING
This protocol was adapted from that used by Dr. Joseph Janicki at the University of South
Carolina. The purpose of this stain is to detect interstitial and perivascular collagen in LV tissue
based on the capacity for Sirius red dye to bind fibrillar collagen.
Reagent Preparation 0.2% Phosphomolybdic Acid (PMA)
Phosphomolybdic acid 1 g
ddH20 500 ml
1.2% Saturated Picric Acid (Sigma Aldrich) Picrosrius Red Dye (PSR)
Sirius Red/Direct Red 0.4 g
Saturated Picric Acid 400 ml
0.01 N Hydrochloric Acid (HCl)
6N Hydrochloric Acid 0.7 ml
ddH20 420 ml
102

Procedure Deparaffin
Rehydration Staining:
0.2% PMA 8 min
ddH20 5 min
PSR 60 min
0.01 HCl 4 min x 2 Dehydration
ddH20 1 min
70% EtOH 30 s
90% EtOH 30 s
100% EtOH 30 s
100% EtOH 30 s Mounting
Xylenes 1 min
Xylenes 1 min
Xylenes 1 min Mount with Cytoseal XYL and coverslip
103

APPENDIX E
PREDICTED UNCERTAINTY IN CALCULATED VARIABLES DUE TO
MEASUREMENT INACCURACIES
Several variables are calculated using two or more experimental measurements that are
associated with individual measurement inaccuracies, which contribute to the uncertainty of the
calculated variables. Let us assume that a calculated variable, Y, is a function of three
experimental measurements, x1, x2, and x3, (Eqn. E1). The propagated error in Y (ΔY) can be
calculated from the individual measurement errors (Δx1, Δx2, Δx3) as shown in Eqn. E2.
where | | denotes absolute value. Two examples of the calculation of the propagated error are
provided below: interstitial collagen:total tissue area ratio calculation (Section E.1) and gene
expression calculation of 2-ΔΔCt for RXFP-1 (Section E.2).
(E1)
(E2)
104

E.1 COLLAGEN:TOTAL TISSUE AREA RATIO CALCULATIONS
We used the ratio of interstitial collagen to total tissue area ratio (Eqn. E3) to quantify fibrosis in
LV from the experimental groups.
Both collagen area and total tissue area were determined by quantifying the positively stained
tissue by computational methods. The error associated with these computational methods was
determined by running each analysis program three times and calculating the standard deviation
of the mean. The ratio of collagen:total tissue area (Aratio) is a function of two measured
variables: collagen area (Acollagen) and total tissue area (Atissue) and therefore the predicted
uncertainty in Aratio (ΔAratio) can be expressed in terms of the measurement inaccuracies of
Acollagen and Atissue (ΔAcollagen and ΔAtissue, respectively) as follows:
where δAratio/δAcollagen and δAratio/δAtissue are partial derivatives given by (from Eqn. E3):
Using Eqns. E5-E6 the partial derivates can be calculated at nominal values of Acollagen and Atissue
as shown in Table 9. These derivative values can then be substituted in to Eqn. E4 to obtain the
error in Aratio. For this example, the uncertainty of the collagen:total tissue ratio is estimated to be
12.5%.
(E4)
(E5)
(E6)
(E3)
105

Table 9. Error Propagation in Interstitial Collagen:Total Tissue Area Ratio Calculation
Nominal Value Error Error
Measured Acollagen 9721 pixels 725 pixels 7.5%
Measured Atissue 1207907 pixels 60395 pixels 5.0%
Calculated Aratio 0.008 0.001 12.5%
E.2 GENE EXPRESSION CALCULATIONS
To calculate the relative expression of genes of interest for Aims 1 and 2, we used representative
measurements from qPCR experiments and the 2-ΔΔCT method. The calculation of 2-ΔΔCT depends
on the CT values of the gene of interest and the endogenous reference control gene GAPDH
(CT,GOI and CT,GAPDH) and this calculation is performed to compare two (or more) experimental
groups (ie. CT1, CT2, CT1,GAPDH, and CT2,GAPDH).
Therefore, the predicted uncertainty in 2-ΔΔCT (Y) can be expressed in terms of the measurement
inaccuracies of CT1, CT2, CT1,GAPDH, and CT2,GAPDH (ie. ΔCT1, ΔCT2, ΔCT1,GAPDH, and ΔCT2,GAPDH)
as follows:
The partial derivatives are given by (from Eqn. E7):
(E7)
(E8)
(E9)
106

Using Eqns. E9-E12 the partial derivatives can be calculated at nominal values of CT1, CT2,
CT1,GAPDH, and CT2,GAPDH. These derivative values can then be substituted in to Eqn. E8 to obtain
the uncertainty in 2-ΔΔCT.
To demonstrate the propagation of error in gene expression calculations from qPCR
measurements, we analyzed RXFP-1 gene expression data from MREN-V compared to SD
controls (where there is a large fold change in gene expression between groups) and MREN-R
compared to SD controls (where there is a small, near 1, fold change in gene expression between
groups). The nominal values used for the error analysis of this experiment are shown in Table
10. For this example, we assumed that the inaccuracies are the same for each of the four
measured variables since they are collected using the same protocol and the same PCR cycler.
The PCR cycler is capable of interpolating between cycles and it reports CT values to the second
decimal place. For illustration, we assumed two different accuracies of the PCR cycler: (1) the
PCR cycler is capable of measuring accurately within 0.1 cycles (this is the pessimistic scenario)
and (2) the PCR cycler is capable of measuring accurately within 0.05 cycles (this is the likely
scenario). The uncertainty of the calculated variable, 2-ΔΔCT, is 27.7% and 13.9% corresponding
to the PCR cycler accuracy of 0.1 cycle and 0.05 cycle, respectively (Table 10).
(E10)
(E11)
(E12)
107

Table 10. Error Propagation in RXFP-1 Gene Expression Calculation
Nominal Value Error-1 (pessimistic)
Error-1 (%) (pessimistic)
Error-2 (likely)
Error-2 (%) (likely)
Measured CT1 21.5 cycles 0.1 cycles 0.5% 0.05 cycles 0.2%
Measured CT2 23.4 cycles 0.1 cycles 0.4% 0.05 cycles 0.2%
Measured CT1,GAPDH 18.0 cycles 0.1 cycles 0.6% 0.05 cycles 0.3%
Measured CT2,GAPDH 16.9 cycles 0.1 cycles 0.6% 0.05 cycles 0.3%
Calculated 2-ΔΔCT 8.0 2.2 27.7% 1.1 13.9%
108

APPENDIX F
MATLAB PROGRAMS
F.1 QUANTIFICATION OF INTERSTITIAL AND PERIVASCULAR COLLAGEN
FROM PICROSIRIUS RED STAINED IMAGES
Two programs were used to compute the interstitial collagen:total tissue area and perivascular
collage:lumen area ratios used for the quantification of protein-level fibrotic deposition in images
for picrosirius red stained slides. The first program, ImageJ, was used to manually color
threshold whole tissue images to determine total tissue area in pixels. A manual trace tool was
used to measure the lumen area in pixels for perivascular tissue images. Both of these
measurements were exported from ImageJ and used as the normalization factor for interstitial or
perivascular collagen pixel measurements made from a custom MATLAB program. This
program is used to computationally quantify positive collagen staining based on intensity
thresholding at 3 user-designated representative sections of each image. The code for the
program is as follows:
clear all close all clc [datafile,pathname] = uigetfile('*.tif','Choose Data File');
109

addpath(pathname) I=imread(datafile); %Separating out the green filter from RGB and converting to grayscale G=I(:,:,2); G2=mat2gray(G); %Eliminating uneven exposure background G2inv=imcomplement(G2); background=imopen(G2inv,strel('disk',15)); G3inv=G2inv-background; %Selecting regions of collagen for intensity thresholding G3inv_orig=G3inv; figure;imshow(G3inv_orig) title('Pick 3 areas that represents positive collagen stain') selection=ginput(3); x=round(selection(:,1)); y=round(selection(:,2)); for i=1:1:3 colthresh(i)=G3inv(y(i),x(i)); results(i)=colthresh(i); end i=i+1; close all %Defining, displaying, and saving collagen pixel area meancolthresh=(mean(colthresh)-(mean(colthresh)*0.15)); G3inv(G3inv>=meancolthresh)=1; figure; H2=imshow(G3inv); filename=['coll_',datafile]; saveas(H2,filename); %Calculate collagen collagen=length(find(G3inv==1)); results(i)=collagen; G3inv=G3inv_orig; fid1 = fopen('PSR Provis Results.txt', 'a'); fprintf(fid1,' %9.4f %9.4f %9.4f %9.4f',results); fprintf(fid1,'%s\n','');
110

F.2 ANALYSIS OF FRANK-STARLING DATA FROM ISOLATED PERFUSED
HEART SYSTEM
The purpose of this program is to analyze data collected from LabChart for isolated heart studies
on the rat left ventricle. The code for the program is as follows:
clear close all current=cd; [datafile,pathname] = uigetfile('*.txt','Choose Data File'); addpath(pathname) data = textread(datafile,'','delimiter',' ','headerlines',9); [rows,columns] = size(data); Frank_time = data(:,1); %unit: s Frank_Pressure = data(:,3); %unit: mmHg Frank_trig = data(:,2); %unit: n/a %Changes Frank Starling trigger to digital (on/off) signal for n = 1:length(Frank_trig) if Frank_trig(n) < 1 %Baseline trigger = ~0.155 Frank_trig(n) = 0; else Frank_trig(n) = 1; %Trigger spike = ~3.34 end end %Cleaning up any noise in the trigger spikes for n=length(Frank_trig):-1:2 if Frank_trig(n-1)>0 Frank_trig(n)=0; end end % FRANK STARLING ANALYSIS % Do_Frank_Analysis = questdlg('Perform Frank Starling Analysis?',... 'FS Analysis','Yes','No','???','Yes'); if Do_Frank_Analysis == 'Yes' islast = 'n';
111

counter = 1; % Opens files for data export and writes datafile name fid1 = fopen('Matlab Analysis Results.txt', 'a'); textheader = ['Pdev Pes Ped Volume relax_time rise_time sdev',... 'dSdt_max dSdt_min dPdt_max dPdt_min']; fprintf(fid1,'%s',datafile); fprintf(fid1,'%s\n',''); fprintf(fid1,'%s %s %s %s %s %s %s %s %s %s %s',textheader); fprintf(fid1,'%s\n',''); %User enters muscle mass (g) for Stress Calculation prompstr = {'What is the LV mass (g)? '}; titlestr = 'LV Mass'; initstr = {'1.0'}; n = inputdlg(prompstr,titlestr,1,initstr); m = str2double(n); %Insert Balloon Vol for Stress Calculation prompstr = {'What is the balloon volume (ul)? '}; titlestr = 'Balloon Vol'; %Determined by calculation 3/2014 (mass = 0.0123g, density = 0.93g/cm3) initstr = {'13'}; n = inputdlg(prompstr,titlestr,1,initstr); RefVol = str2double(n); rho=1.05; %MacGowan et al. (2004, Circ Res) while islast == 'n' %Allows the user to enter iterative volumes %Sampling frequency *unit=1/s sample_freq=1/(data(2,1)-data(1,1)); deltat = 1/sample_freq; section='y'; %Allows the user to pick different sections on the pressure graph while section=='y' %Plots Frank Starling data figure(2) plot(Frank_time,Frank_Pressure); title(‘Pick starting and ending points of the pressure section') %Select section of graph to average [x,y]=ginput(2); find_point1=1; while abs(Frank_time(find_point1)-x(1,1)) > 0.1;
112

find_point1=find_point1+1; end find_point2=find_point1+1; while abs(Frank_time(find_point2)-x(2,1)) > 0.01; find_point2=find_point2+1; end %Plot the selected section figure(3) subplot(2,1,1,'replace'); plot(Frank_time(find_point1:find_point2), ... Frank_Pressure(find_point1:find_point2)) ylabel('Pressure (mmHg)'); xlabel('Time (sec)'); %In case the section you chose was not clean waveforms prompstr = {'Do you want to pick a different section? (y/n)'}; titlestr = 'Formatting Data ...'; initstr = {'n'}; n = inputdlg(prompstr,titlestr,1,initstr); section=(n{1}); end clf Frank_Pressure_segment = Frank_Pressure(find_point1:find_point2); Frank_time_segment = Frank_time(find_point1:find_point2); Frank_trig_segment = Frank_trig(find_point1:find_point2); % Makes sure each segment is the same size (should match pacing, 250) x = find(Frank_trig_segment>0); xmin = min(diff(x)); %Compiles Pressure waveforms for n = 1:length(x)-1 Pres_compilation(:,n) = Frank_Pressure_segment(x(n):x(n)+xmin-1); end %Averages each pressure waveform Avg_Pressure = mean(Pres_compilation')'; seg_time = [1/sample_freq:1/sample_freq:xmin/sample_freq]; %Added 3/2014: allows user to select point for calculation of EDP figure plot(Avg_Pressure,'*') title('Select a point for EDP')
113

%Calculates indices of average pressure waveform systolic(counter) = max(Avg_Pressure); [diast_x(counter),diast_y(counter)] = ginput(1); diast_x(counter) = round(diast_x(counter)); diastolic(counter) =
mean(Avg_Pressure(diast_x(counter):diast_x(counter)+2)); Pdev(counter) = systolic(counter) - diastolic(counter); min_dPdt(counter) = min(gradient(Avg_Pressure))/deltat; max_dPdt(counter) = max(gradient(Avg_Pressure))/deltat; %t25 count = 1; Avg_Pressure2 = Avg_Pressure - diastolic(counter); for n=1:find(Avg_Pressure2==max(Avg_Pressure2)); if Avg_Pressure2(n)<0.25*(systolic(counter)-diastolic(counter)) count = count+1; end end t25_rise = seg_time(count); %t75 count = 1; for n=1:find(Avg_Pressure2==max(Avg_Pressure2)); if Avg_Pressure2(n)<0.75*(systolic(counter)-diastolic(counter)) count = count+1; end end t75_rise = seg_time(count); %Calculates Rise Time rise_time(counter) = t75_rise - t25_rise; %Calculates Relax Time count = find(Avg_Pressure2==max(Avg_Pressure2)); for n=find(Avg_Pressure2==max(Avg_Pressure2)):xmin; if Avg_Pressure2(n)>0.75*(systolic(counter)-diastolic(counter)) count = count+1; end end t75_relax = seg_time(count); count = find(Avg_Pressure2==max(Avg_Pressure2)); for n=find(Avg_Pressure2==max(Avg_Pressure2)):xmin; if Avg_Pressure2(n)>0.25*(systolic(counter)-diastolic(counter)) count = count+1;
114

end end t25_relax = seg_time(count); relax_time(counter) = t25_relax - t75_relax; %Plots average waveform figure plot(seg_time,Avg_Pressure) hold on plot([0 xmin/sample_freq],[systolic(counter) systolic(counter)]) plot([0 xmin/sample_freq],[diastolic(counter) diastolic(counter)]) hold off %Dialog box requesting volume and if this is the last volume run prompstr = {'Current balloon volume (ul)?',... 'Is this the final volume? '}; titlestr = 'Frank Starling Protocol'; initstr = {'','n'}; n = inputdlg(prompstr,titlestr,1,initstr); volume(counter) = str2num(n{1}) %in ul
%Calculates developed stress for the specific pressure waveform stressconstant(counter)=(1+(m./(rho.*... ((volume(counter)+RefVol)/1000)))).^(2/3)-1; sdev(counter)=Pdev(counter)/stressconstant(counter) stotal=Avg_Pressure/stressconstant(counter); min_dSdt(counter) = min(gradient(stotal))/deltat; max_dSdt(counter) = max(gradient(stotal))/deltat; FinalVol(counter)=(RefVol+volume(counter)); %ul %Writes to file Rltnshps=[Pdev(counter);systolic(counter);diastolic(counter);... FinalVol(counter);... relax_time(counter);rise_time(counter);... sdev(counter);max_dSdt(counter);min_dSdt(counter);... max_dPdt(counter);min_dPdt(counter);]; if counter == 1 AvePW(:,counter)=Avg_Pressure; end k=length(Avg_Pressure); k1=length(AvePW); if k>k1
115

Avg_Pressure=Avg_Pressure(1:k1); elseif k1>k AvePW=AvePW(1:k,:); end AvePW(:,counter)=Avg_Pressure; Vol(:,counter)=linspace(volume(counter),volume(counter)); fprintf(fid1,' %9.4f %9.4f %9.4f %9.4f %9.4f %9.4f %9.4f %9.4f',... '%9.4f %9.4f %9.4f %9.4f ',Rltnshps); fprintf(fid1,'%s\n',''); islast=(n{2}); %check for last volume run counter = counter + 1; clear Pres_compilation; close all end %end of while loop %Finish writing data files and close border = ['------']; fprintf(fid1,'%s',border); fprintf(fid1,'%s\n',''); fclose(fid1); elseif Do_Frank_Analysis == '???' errordlg('Im going to assume that means no.') pause end %Creates graph of Frank Starling data and certain parameters subplot(2,3,1) plot((0:deltat:(deltat*length(AvePW))-deltat),AvePW,(diast_x/1000),diastolic,'r*') xlabel('Time') ylabel('Pressure (mmHg)') title(datafile(1:end-4)) subplot(2,3,2) plot(volume,Pdev,'bs','LineWidth',1,... 'MarkerEdgeColor','k','MarkerFaceColor','g', 'MarkerSize',5) xlabel('Volume (uL)') ylabel('Developed Pressure (mmHg)') title(date) subplot(2,3,3) plot(volume,rise_time,'bd','LineWidth',1,... 'MarkerEdgeColor','b','MarkerFaceColor','b', 'MarkerSize',5) xlabel('Volume (uL)')
116

ylabel('Rise Time (ms)') axis([0 max(volume) 0 0.1]) subplot(2,3,4) plot(Vol) ylabel('Volume (uL)') subplot(2,3,5) plot(volume,diastolic,'bs','LineWidth',1,... 'MarkerEdgeColor','k','MarkerFaceColor','g', 'MarkerSize',5) xlabel('Volume (uL)') ylabel('Diastolic Pressure (mmHg)') subplot(2,3,6) plot(volume,relax_time,'bd','LineWidth',1,... 'MarkerEdgeColor','b','MarkerFaceColor','b', 'MarkerSize',5) xlabel('Volume (uL)') ylabel('Relax Time (ms)') axis([0 max(volume) 0 0.1])
The output from the Isolated Heart Program produces raw end-diastolic pressures at increasing
volume steps (in addition to other hemodynamic parameter outputs). These raw data are fitted to
the equation for Ped in Section 4.2.7.5 by MATLAB iterative nonlinear regression using the
following code:
clear all global V0 [datafile,pathname] = uigetfile('*.txt','Choose Data File'); addpath(pathname) data = textread(datafile,'','delimiter',' '); [rows,cols] = size(data); %Initial values A0=1; B0=0.001; V0=10; %Reading in end-diastolic pressure/volume data as .txt file Vol=data(:,2);
117

Ped=data(:,1); Newx=Vol; Newy=Ped; %Condition 1 - Check for initial negative pressures if Ped(1)<0 %Separating Ped into positive and negative segments j=1; k=1; for i=1:1:length(Ped) if Ped(i)<0 NegPed(k)=Ped(i); VolSeg_Neg(k)=Vol(i); k=k+1; elseif Ped(i)>0 PosPed(j)=Ped(i); VolSeg_Pos(j)=Vol(i); j=j+1; elseif Ped(i)==0 PosPed(j)=0.00001; VolSeg_Pos(j)=Vol(i); j=j+1; end end %Finding the two points that flank Ped=zero to interpolate Ped1 = NegPed(end); Ped2 = PosPed(1); Vol1 = VolSeg_Neg(end); Vol2 = VolSeg_Pos(1); %Interpolation to find V0 NewPed = linspace(Ped1,Ped2,10000); NewVol = linspace(Vol1,Vol2,10000); for i=1:length(NewPed) if NewPed(i) < 0 NewPed(i) = 0; end end %Find the location where the first non-negative Ped occurs LocPed = find(NewPed); LocVol = LocPed(1);
118

%Use that location to set the new first point of the dataset, where %Ped~=0 and the corresponding Volume Ped0 = NewPed(LocVol); V0 = NewVol(LocVol); %Reset the original datasets using the new initial points Newx = [V0 VolSeg_Pos]; Newy = [Ped0 PosPed]; %Condition 2 - Check if starting Ped is greater than 0 elseif Ped(1)>0 %Use the first 3 data points to fit a linear line y = Ped(1:3); x = Vol(1:3); coeff = polyfit(x,y,1); %Determine the x-intercept to find a new V0 V0 = (-coeff(2))/coeff(1); end %Exponential curve fitting for 2 coefficients with preset V0 beta0=[A0,B0]; beta=nlinfit(Newx,Newy,@edpvr,beta0); A=beta(1); b=beta(2); %Determining the Volume where Ped=25 by linear extrapolation if max(Newy)<25 V25_x = Vol(length(Vol)-2:end); V25_y = Ped(length(Ped)-2:end); V25_coeff = polyfit(V25_x,V25_y,1); V25 = (25-V25_coeff(2))/V25_coeff(1); else for i=1:length(Newy) if Newy(i)>20 && Newy(i)<30 V25=Newx(i); break end end end if exist('V25')==1
119

deltaV=V25-V0; else deltaV=0; V25=0; end NewPed=beta(1)*(exp(beta(2)*(Newx-V0))-1); figure; plot(Vol,Ped,'k*',Newx,NewPed,'r') xlabel('Volume(ul)') ylabel('End-diastolic Pressure (mmHg)') plot_res = [beta(1),beta(2),V0]; %Goodness of fit calculations edpvr_resid=Newy-NewPed; SS_edpvr_resid=sum(edpvr_resid.^2); edpvr_resid_total=Newy-(mean(Newy)); SS_edpvr_resid_total=sum(edpvr_resid_total.^2); edpvr_R2=1-SS_edpvr_resid/SS_edpvr_resid_total; gtext(['R2 = ',num2str(edpvr_R2)]) % Opens file for data export and writes datafile name and column headers fid1 = fopen('EDPVR Analysis Results.txt', 'a'); Rltnshps = [beta(1);beta(2);V0;V25;deltaV;edpvr_R2]; fprintf(fid1,' %9.4f %9.4f %9.4f %9.4f %9.4f %9.4f',Rltnshps); fprintf(fid1,'%s\n',''); The code for the model fitting function call ‘edvpr’ is as follows:
function NewPed=edpvr(beta0,Newx) global V0 NewPed=beta0(1)*(exp(beta0(2)*(Newx-V0))-1);
The output from the Isolated Heart Program produces raw end-diastolic stresses at increasing
volume steps that can be transformed to end-diastolic midwall strain following the equations in
120

Section 4.2.7.5. To make this transformation, V0 is required from the interpolation output from
MATLAB end-diastolic pressure-volume relationship program (Appendix F.2.2). These end-
diastolic stress and strain data are fitted to the model equation (Section 4.2.7.5) by MATLAB
iterative nonlinear regression using the following code:
clear all [datafile,pathname] = uigetfile('*.txt','Choose Data File'); addpath(pathname) data = textread(datafile,'','delimiter',' '); [rows,cols] = size(data); %Initial starting values for curve fitting A0=1; B0=10; beta0=[A0,B0]; %Reading in end-diastolic stress/strain data as .txt file %Strain must be calculated using V0 from fitedpvr.m code x=data(:,2); %strain y=data(:,1); %stress %Check for initial negative stresses if y(1)<0 %Separating stress into positive and negative sections j=1; k=1; for i=1:1:length(y) if y(i)<0 Negy(k)=y(i); xSeg_Neg(k)=x(i); k=k+1; elseif y(i)>0 Posy(j)=y(i); xSeg_Pos(j)=x(i); j=j+1; elseif y(i)==0 Posy(j)=0.00001; xSeg_Pos(j)=x(i); j=j+1; end end
121

%Finding the two points that flank y=zero to interpolate y1 = Negy(end); y2 = Posy(1); x1 = xSeg_Neg(end); x2 = xSeg_Pos(1); %Interpolation Newy = linspace(y1,y2,10000); Newx = linspace(x1,x2,10000); for i=1:length(Newy) if Newy(i) < 0 Newy(i) = 0; end end %Find the location where the first non-negative stress occurs Locy = find(Newy); Locx = Locy(1); %Use that location to set the new first point of the dataset, where %stress~=0 and the corresponding strain y0 = Newy(Locx); x0 = Newx(Locx); %Reset the original datasets using the new initial points Newx = [x0 xSeg_Pos]; Newy = [y0 Posy]; end beta=nlinfit(Newx,Newy,@stressstrain,beta0); NewStress=beta(1)*(exp(beta(2)*(Newx))-1); figure; plot(x,y,'k*',Newx,NewStress,'r') xlabel('Strain') ylabel('End-diastolic Stress (mmHg)') %Goodness of fit calculation stressstrain_resid=Newy-NewStress; SS_stressstrain_resid=sum(stressstrain_resid.^2); stressstrain_resid_total=Newy-(mean(Newy)); SS_stressstrain_resid_total=sum(stressstrain_resid_total.^2); stressstrain_R2=1-SS_stressstrain_resid/SS_stressstrain_resid_total
122

gtext(['R2 = ',num2str(stressstrain_R2)]) % Opens file for data export and writes datafile name and column headers fid1 = fopen('SS Analysis Results.txt', 'a'); Rltnshps = [beta(1);beta(2);stressstrain_R2]; fprintf(fid1,' %9.4f %9.4f %9.4f',Rltnshps); fprintf(fid1,'%s\n',''); The code for the model fitting function call ‘stressstrain’ is as follows:
function NewStress=stressstrain(beta0,Newx) NewStress=beta0(1)*(exp(beta0(2)*(Newx))-1);
The output from the Isolated Heart Program produces raw peak and developed pressures at
increasing volume steps (in addition to other hemodynamic parameter outputs). These raw data
are fitted to the equation in Section 4.2.7.5 by MATLAB iterative first-order polynomial linear
regression using the following code:
clear all [datafile,pathname] = uigetfile('*.txt','Choose Data File'); addpath(pathname) data = textread(datafile,'','delimiter',' '); [rows,cols] = size(data); %Reading in peak (PP) and developed (Pdev) pressure/volume data as .txt file Vol=data(:,3); Pdev=data(:,1); PP=data(:,2); PP_grad=gradient(PP); PP_cutoff=PP_grad(1)*0.1; %Trim PP data at point where pressures plateau (Vmax) for i=1:length(PP_grad)
123

if PP_grad(i) > PP_cutoff NewPP(i)=PP(i); NewPdev(i)=Pdev(i); NewVol(i)=Vol(i); i=i+1; else break end end %1st order polynomial fit for PPVR PP_coeff=polyfit(NewVol,NewPP,1); E=PP_coeff(1); Vd=PP_coeff(2)/E; FitPP=polyval(PP_coeff,NewVol); figure; plot(NewVol,NewPP,'k*',NewVol,FitPP,'r') xlabel('Volume(ul)') ylabel('Peak Pressure (mmHg)') %Goodness of fit calculations espvr_resid=NewPP-FitPP; SS_espvr_resid=sum(espvr_resid.^2); espvr_resid_total=NewPP-(mean(NewPP)); SS_espvr_resid_total=sum(espvr_resid_total.^2); espvr_R2=1-SS_espvr_resid/SS_espvr_resid_total; gtext(['R2 = ',num2str(espvr_R2)]) %1st order polynomial fit for Developed PVR Pdev_coeff=polyfit(NewVol,NewPdev,1); E_dev=Pdev_coeff(1); Vd_dev=Pdev_coeff(2)/E_dev; FitPdev=polyval(Pdev_coeff,NewVol); figure; plot(NewVol,NewPdev,'k*',NewVol,FitPdev,'r') xlabel('Volume(ul)') ylabel('Developed Pressure (mmHg)') %Goodness of fit calculations devpvr_resid=NewPdev-FitPdev;
124

SS_devpvr_resid=sum(devpvr_resid.^2); devpvr_resid_total=NewPdev-(mean(NewPdev)); SS_devpvr_resid_total=sum(devpvr_resid_total.^2); devpvr_R2=1-SS_devpvr_resid/SS_devpvr_resid_total; gtext(['R2 = ',num2str(devpvr_R2)]) fid1 = fopen('ESPVR Analysis Results.txt', 'a'); Rltnshps = [PP_coeff(1);PP_coeff(2);Vd;espvr_R2;Pdev_coeff(1);... Pdev_coeff(2);Vd_dev;devpvr_R2]; fprintf(fid1,' %9.4f %9.4f %9.4f %9.4f %9.4f %9.4f %9.4f %9.4f ',Rltnshps); fprintf(fid1,'%s\n','');
The output from the Isolated Heart Program produces raw developed stress at increasing volume
steps that can be transformed to end-diastolic midwall strain following the equations in Section
4.2.7.5. To make this transformation, V0 is required. These developed stress and midwall strain
data are fitted to the model equation (Section 4.2.7.5) by MATLAB iterative nonlinear
regression using the following code:
clear all [datafile,pathname] = uigetfile('*.txt','Choose Data File'); addpath(pathname) data = textread(datafile,'','delimiter',' '); [rows,cols] = size(data); %Reading in developed stress/strain data as .txt file x=data(:,2); y=data(:,1); P=polyfit(x,y,1); NewStress=polyval(P,x); figure; plot(x,y,'k*',x,NewStress,'r')
125

xlabel('Strain') ylabel('Developed Stress (mmHg)') %Goodness of fit calculations stressstrain_resid=y-NewStress; SS_stressstrain_resid=sum(stressstrain_resid.^2); stressstrain_resid_total=y-(mean(y)); SS_stressstrain_resid_total=sum(stressstrain_resid_total.^2); stressstrain_R2=1-SS_stressstrain_resid/SS_stressstrain_resid_total gtext(num2str(stressstrain_R2)) % Opens file for data export and writes datafile name and column headers fid1 = fopen('SS Analysis Results.txt', 'a'); Rltnshps = [P(1);P(2);stressstrain_R2]; fprintf(fid1,' %9.4f %9.4f %9.4f',Rltnshps); fprintf(fid1,'%s\n','');
126

BIBLIOGRAPHY
1. Go, A.S., et al., Heart disease and stroke statistics--2013 update: a report from the American Heart Association. Circulation, 2013. 127(1): p. e6-e245.
2. Udelson, J.E., Heart failure with preserved ejection fraction. Circulation, 2011. 124(21): p. e540-3.
3. Filippatos, G., et al., Serelaxin in acute heart failure patients with preserved left ventricular ejection fraction: results from the RELAX-AHF trial. Eur Heart J, 2014. 35(16): p. 1041-50.
4. Martos, R., et al., Diastolic heart failure: evidence of increased myocardial collagen turnover linked to diastolic dysfunction. Circulation, 2007. 115(7): p. 888-95.
5. Berk, B.C., K. Fujiwara, and S. Lehoux, ECM remodeling in hypertensive heart disease. J Clin Invest, 2007. 117(3): p. 568-75.
6. Brilla, C.G., R.C. Funck, and H. Rupp, Lisinopril-mediated regression of myocardial fibrosis in patients with hypertensive heart disease. Circulation, 2000. 102(12): p. 1388-93.
7. Diez, J., Losartan-Dependent Regression of Myocardial Fibrosis Is Associated With Reduction of Left Ventricular Chamber Stiffness in Hypertensive Patients. Circulation, 2002. 105(21): p. 2512-2517.
8. Kai, H., et al., Diastolic dysfunction in hypertensive hearts: roles of perivascular inflammation and reactive myocardial fibrosis. Hypertens Res, 2005. 28(6): p. 483-90.
9. Paulus, W.J. and C. Tschope, A novel paradigm for heart failure with preserved ejection fraction: comorbidities drive myocardial dysfunction and remodeling through coronary microvascular endothelial inflammation. J Am Coll Cardiol, 2013. 62(4): p. 263-71.
127

10. Ferreira-Martins, J. and A.F. Leite-Moreira, Physiologic basis and pathophysiologic implications of the diastolic properties of the cardiac muscle. J Biomed Biotechnol, 2010. 2010: p. 807084.
11. Westermann, D., et al., Cardiac inflammation contributes to changes in the extracellular matrix in patients with heart failure and normal ejection fraction. Circ Heart Fail, 2011. 4(1): p. 44-52.
12. Mullins, J.J., J. Peters, and D. Ganten, Fulminant hypertension in transgenic rats harbouring the mouse Ren-2 gene. Nature, 1990. 344(6266): p. 541-4.
13. Pinto, Y.M., et al., Cardiovascular end-organ damage in Ren-2 transgenic rats compared to spontaneously hypertensive rats. J Mol Med (Berl), 1997. 75(5): p. 371-7.
14. Langheinrich, M., et al., The hypertensive Ren-2 transgenic rat TGR (mREN2)27 in hypertension research. Characteristics and functional aspects. Am J Hypertens, 1996. 9(5): p. 506-12.
15. Doggrell, S.A. and L. Brown, Rat models of hypertension, cardiac hypertrophy and failure. Cardiovasc Res, 1998. 39(1): p. 89-105.
16. Bing, O.H., et al., The spontaneously hypertensive rat as a model of the transition from compensated left ventricular hypertrophy to failure. J Mol Cell Cardiol, 1995. 27(1): p. 383-96.
17. Cingolani, O.H., et al., Increased systolic performance with diastolic dysfunction in adult spontaneously hypertensive rats. Hypertension, 2003. 41(2): p. 249-54.
18. LeGrice, I.J., et al., Progression of myocardial remodeling and mechanical dysfunction in the spontaneously hypertensive rat. Am J Physiol Heart Circ Physiol, 2012. 303(11): p. H1353-65.
19. Engler, S., M. Paul, and Y.M. Pinto, The TGR(mRen2)27 transgenic rat model of hypertension. Regul Pept, 1998. 77(1-3): p. 3-8.
20. McGuane, J.T. and L.J. Parry, Relaxin and the extracellular matrix: molecular mechanisms of action and implications for cardiovascular disease. Expert Rev Mol Med, 2005. 7(21): p. 1-18.
128

21. Samuel, C.S., Relaxin: antifibrotic properties and effects in models of disease. Clin Med Res, 2005. 3(4): p. 241-9.
22. Debrah, D.O., et al., Relaxin regulates vascular wall remodeling and passive mechanical properties in mice. J Appl Physiol, 2011. 111(1): p. 260-71.
23. Samuel, C.S., et al., Relaxin modulates cardiac fibroblast proliferation, differentiation, and collagen production and reverses cardiac fibrosis in vivo. Endocrinology, 2004. 145(9): p. 4125-33.
24. Williams, E.J., et al., Relaxin inhibits effective collagen deposition by cultured hepatic stellate cells and decreases rat liver fibrosis in vivo. Gut, 2001. 49(4): p. 577-83.
25. Garber, S.L., et al., Relaxin decreases renal interstitial fibrosis and slows progression of renal disease. Kidney Int, 2001. 59(3): p. 876-82.
26. Unemori, E.N., et al., Relaxin induces an extracellular matrix-degrading phenotype in human lung fibroblasts in vitro and inhibits lung fibrosis in a murine model in vivo. J Clin Invest, 1996. 98(12): p. 2739-45.
27. Bathgate, R.A., et al., Relaxin family peptides and their receptors. Physiol Rev, 2013. 93: p. 405-480.
28. Sherwood, O.D., Relaxin's physiological roles and other diverse actions. Endocr Rev, 2004. 25(2): p. 205-34.
29. Dschietzig, T., et al., The pregnancy hormone relaxin is a player in human heart failure. FASEB J, 2001. 15(12): p. 2187-95.
30. Kong, R.C., et al., Membrane receptors: structure and function of the relaxin family peptide receptors. Mol Cell Endocrinol, 2010. 320(1-2): p. 1-15.
31. Samuel, C.S., et al., Relaxin deficiency in mice is associated with an age-related progression of pulmonary fibrosis. Faseb J, 2003. 17(1): p. 121-3.
32. Samuel, C.S., et al., Relaxin-1-deficient mice develop an age-related progression of renal fibrosis. Kidney Int, 2004. 65(6): p. 2054-64.
129

33. Du, X.J., et al., Increased myocardial collagen and ventricular diastolic dysfunction in relaxin deficient mice: a gender-specific phenotype. Cardiovasc Res, 2003. 57(2): p. 395-404.
34. Halls, M.L., et al., Relaxin activates multiple cAMP signaling pathway profiles in different target cells. Ann N Y Acad Sci, 2009. 1160: p. 108-11.
35. Moore, X.L., et al., Relaxin antagonizes hypertrophy and apoptosis in neonatal rat cardiomyocytes. Endocrinology, 2007. 148(4): p. 1582-9.
36. Mookerjee, I., et al., Relaxin inhibits renal myofibroblast differentiation via RXFP1, the nitric oxide pathway, and Smad2. FASEB J, 2009. 23(4): p. 1219-29.
37. Nistri, S. and D. Bani, Relaxin receptors and nitric oxide synthases: search for the missing link. Reprod Biol Endocrinol, 2003. 1: p. 5.
38. Ho, T.Y., W. Yan, and C.A. Bagnell, Relaxin-induced matrix metalloproteinase-9 expression is associated with activation of the NF-kappaB pathway in human THP-1 cells. J Leukoc Biol, 2007. 81(5): p. 1303-10.
39. Ahmad, N., et al., Relaxin induces matrix-metalloproteinases-9 and -13 via RXFP1: induction of MMP-9 involves the PI3K, ERK, Akt and PKC-zeta pathways. Mol Cell Endocrinol, 2012. 363(1-2): p. 46-61.
40. Du, X.J., et al., Reversal of cardiac fibrosis and related dysfunction by relaxin. Ann N Y Acad Sci, 2009. 1160: p. 278-84.
41. Lekgabe, E.D., et al., Relaxin reverses cardiac and renal fibrosis in spontaneously hypertensive rats. Hypertension, 2005. 46(2): p. 412-8.
42. Samuel, C.S., et al., Relaxin ameliorates fibrosis in experimental diabetic cardiomyopathy. Endocrinology, 2008. 149(7): p. 3286-93.
43. Hossain, M.A., et al., H3 relaxin demonstrates antifibrotic properties via the RXFP1 receptor. Biochemistry, 2011. 50(8): p. 1368-75.
44. Zhang, J., et al., Effect of relaxin on myocardial ischemia injury induced by isoproterenol. Peptides, 2005. 26(9): p. 1632-9.
130

45. Glasel, J.A., Validity of nucleic acid purities monitored by 260nm/280nm absorbance ratios. Biotechniques, 1995. 18(1): p. 62-3.
46. Schmittgen, T.D. and K.J. Livak, Analyzing real-time PCR data by the comparative C(T) method. Nat Protoc, 2008. 3(6): p. 1101-8.
47. Whittaker, P., et al., Quantitative assessment of myocardial collagen with picrosirius red staining and circularly polarized light. Basic Res Cardiol, 1994. 89(5): p. 397-410.
48. Hartig, S.M., Basic image analysis and manipulation in ImageJ. Curr Protoc Mol Biol, 2013. Chapter 14: p. Unit14 15.
49. Feng, M., et al., Validation of volume-pressure recording tail-cuff blood pressure measurements. Am J Hypertens, 2008. 21(12): p. 1288-91.
50. Skrzypiec-Spring, M., et al., Isolated heart perfusion according to Langendorff---still viable in the new millennium. J Pharmacol Toxicol Methods, 2007. 55(2): p. 113-26.
51. de Leiris, J., D.P. Harding, and S. Pestre, The isolated perfused rat heart: a model for studying myocardial hypoxia or ischemia. Basic Res Cardiol, 1984. 79: p. 313-321.
52. Burkhoff, D., I. Mirsky, and H. Suga, Assessment of systolic and diastolic ventricular properties via pressure-volume analysis: a guide for clinical, translational, and basic researchers. Am J Physiol Heart Circ Physiol, 2005. 289(2): p. H501-12.
53. Berger, D.S., et al., Ejection has both positive and negative effects on left ventricular isovolumic relaxation. Am J Physiol, 1997. 273(6 Pt 2): p. H2696-707.
54. MacGowan, G.A., et al., Troponin I protein kinase C phosphorylation sites and ventricular function. Cardiovasc Res, 2004. 63(2): p. 245-55.
55. MacGowan, G.A., et al., Pressure-calcium relationships in perfused mouse hearts. Am J Physiol Heart Circ Physiol, 2006. 290: p. H2614-H2624.
56. Du, X.J., et al., Increased myocardial collagen and ventricular diastolic dysfunction in relaxin deficient mice: a gender-specific phenotype. Cardiovascular Research, 2003. 57: p. 395-404.
131

57. Kompa, A.R., C.S. Samuel, and R.J. Summers, Inotropic responses to human gene 2 (B29) relaxin in a rat model of myocardial infarction (MI): effect of pertussis toxin. British Journal of Pharmacology, 2002. 137: p. 710-718.
58. Gunnersen, J.M., R.J. Crawford, and G.W. Tregear, Expression of the relaxin gene in rat tissues. Mol Cell Endocrinol, 1995. 110(1-2): p. 55-64.
59. Esler, M., et al., Adrenergic nervous system in heart failure. Am J Cardiol, 1997. 80(11A): p. 7L-14L.
60. Moore, X.L., et al., Diverse Regulation of Cardiac Expression of Relaxin Receptor by alpha- and beta -Adrenoceptors. Cardiovasc Drugs Ther, 2014.
61. Pinto, Y.M., et al., Reduction in Left Ventricular Messenger RNA for Transforming Growth Factor 1 Attenuates Left Ventricular Fibrosis and Improves Survival Without Lowering Blood Pressure in the Hypertensive TGR(mRen2)27 Rat. Hypertension, 2000. 36(5): p. 747-754.
62. Parikh, A., et al., Relaxin suppresses atrial fibrillation by reversing fibrosis and myocyte hypertrophy and increasing conduction velocity and sodium current in spontaneously hypertensive rat hearts. Circ Res, 2013. 113(3): p. 313-21.
63. Tsuruda, T., et al., Brain natriuretic Peptide is produced in cardiac fibroblasts and induces matrix metalloproteinases. Circ Res, 2002. 91(12): p. 1127-34.
64. Trask, A.J., et al., Inhibition of angiotensin-converting enzyme 2 exacerbates cardiac hypertrophy and fibrosis in Ren-2 hypertensive rats. Am J Hypertens, 2010. 23(6): p. 687-93.
65. Zolk, O., et al., Activation of the cardiac endothelin system in left ventricular hypertrophy before onset of heart failure in TG(mREN2)27 rats. Cardiovascular Research, 2001. 53: p. 363-371.
66. Villarreal, F.J., et al., Myocardial remodeling in hypertensive Ren-2 transgenic rats. Hypertension, 1995. 25(1): p. 98-104.
67. Kang, T., J.D. Humphrey, and F.C. Yin, Comparison of biaxial mechanical properties of excised endocardium and epicardium. Am J Physiol, 1996. 270(6 Pt 2): p. H2169-76.
132

68. Du, X.J., et al., Cardiovascular effects of relaxin: from basic science to clinical therapy. Nat Rev Cardiol, 2010. 7(1): p. 48-58.
69. Chen, S.A., et al., The pharmacokinetics and absorption of recombinant human relaxin in nonpregnant rabbits and rhesus monkeys after intravenous and intravaginal administration. Pharm Res, 1993. 10(2): p. 223-7.
70. Conrad, C.H., et al., Myocardial fibrosis and stiffness with hypertrophy and heart failure in the spontaneously hypertensive rat. Circulation, 1995. 91(1): p. 161-70.
71. Redfield, M.M., et al., Effect of phosphodiesterase-5 inhibition on exercise capacity and clinical status in heart failure with preserved ejection fraction: a randomized clinical trial. JAMA, 2013. 309(12): p. 1268-77.
72. Iribe, G., M. Helmes, and P. Kohl, Force-length relations in isolated intact cardiomyocytes subjected to dynamic changes in mechanical load. Am J Physiol Heart Circ Physiol, 2007. 292(3): p. H1487-97.
73. Hamdani, N. and W.J. Paulus, Myocardial titin and collagen in cardiac diastolic dysfunction: partners in crime. Circulation, 2013. 128(1): p. 5-8.
74. Chung, C.S., et al., Shortening of the elastic tandem immunoglobulin segment of titin leads to diastolic dysfunction. Circulation, 2013. 128(1): p. 19-28.
75. Samuel, C.S., E.D. Lekgabe, and I. Mookerjee, The effects of relaxin on extracellular matrix remodeling in health and fibrotic disease. Adv Exp Med Biol, 2007. 612: p. 88-103.
76. Richmond, W., et al., Interstrain differences of in vitro metabolic stability and impact on early drug discovery. J Pharm Sci, 2010. 99(11): p. 4463-8.
133