the role of natural gas in a carbon constrained world€¦ · the role of natural gas in a carbon...
TRANSCRIPT

The Role of Natural Gas in a Carbon Constrained
World
Sergey PaltsevMassachusetts Institute of Technology
IEFE, Bocconi University, Milan, ItalyApril 15, 2011
Questions or comments?
Contact: Sergey Paltsev

Motivation• Carbon content: coal – 24.7 MtC/EJ, crude oil – 19.3
MtC/EJ, gasoline – 18.4 MtC/EJ, natural gas – 13.7 MtC/EJ. Gas is only 55% of coal emissions (add efficiency – numbers cited as low as 30%).
• Shale gas hype• Is gas a big player in a carbon-constrained world?• MIT Future of Natural Gas study • Focus on impacts on the U.S., but world reserves and
trade are important• Model: MIT Emissions Prediction and Policy Analysis
(EPPA)
2

3

4
5

6

77MIT Future of Natural Gas Study
Overarching Conclusion
• Abundant global resources, expanded use, especially electricity
• Increasing share in US, with key role for unconventional resources
• Larger share with CO2 emissions constraints;
• but with very stringent constraints, role of all fossil fuels limited without competitive CCS
• Global gas markets can change dramatically to 2050
7

88
System Studies of Gas Futures• The economic models (EPPA and USREP)
• Strengths• Limitations
• Interactions and uncertainties• Gas Resources (High, Mean, Low)• Greenhouse gas mitigation (3 scenarios)• Technology cost (Sensitivity tests)• International gas markets (Regional vs.
global)
8

9Remaining Recoverable Natural Gas Resources(Excludes unconventional gas outside North America)
Tcf of Gas9

Gas supply curvesGlobal U.S.
10
1111
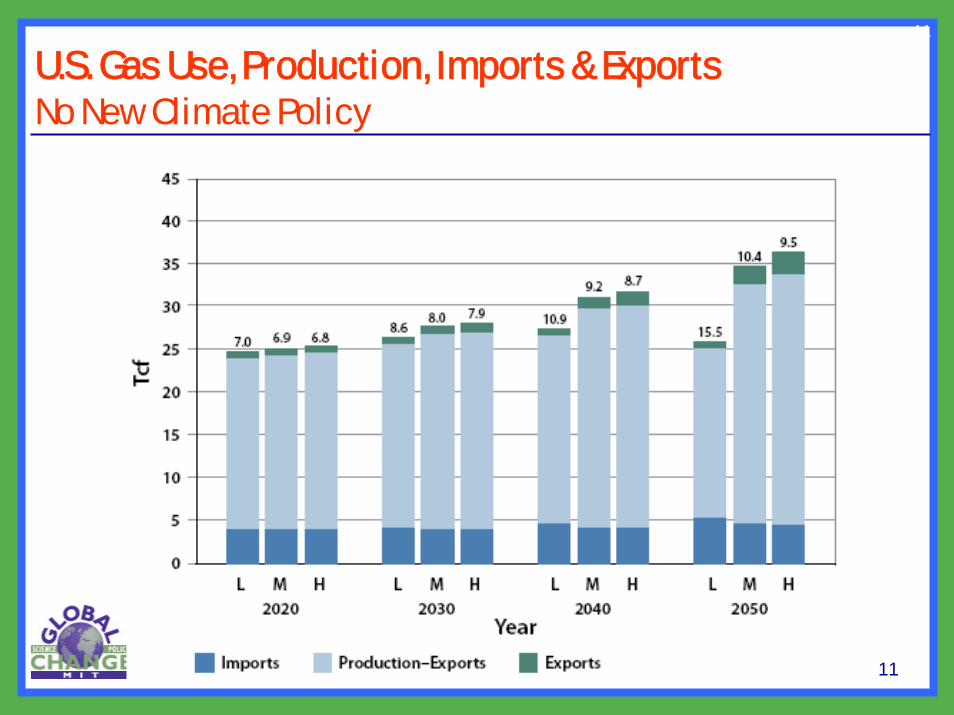
U.S. Gas Use, Production, Imports & ExportsNo New Climate Policy
11

12
U.S. Gas Use, Production, Imports & Exports Price-Based Policy (50% by 2050, No Offsets)
12
7.5 $/Mcf13.3 $/Mcf7.5 $/Mcf
13.3 $/Mcf
12

1313
Price-based mitigation
50% by 2050No offsets
GasCoal Electric sector
Gas
Total energy13

1414
Regulatory mitigation
25% RES 203055% coal retireGas
Electric sector
Renew
Gas
Total energy 14

1515
International Market Evolution
Regional Markets Global Market
7.5 $/Mcf13.3 $/Mcf7.5 $/Mcf
13.3 $/Mcf
5.7 $/Mcf11.4 $/Mcf5.7 $/Mcf
11.4 $/Mcf
15

Case for U.S. gas exports?
• U.S. Producer’s Perspective: floor on U.S. gas prices
• U.S. Consumer’s Perspective: prices would be higher
• U.S. Strategic Perspective: exports today = imports tomorrow? (look at UK example)
• Investment Perspective: price differential between Henry Hub and long-term contracts, competition with lower cost suppliers
16

1717
Regional Gas Markets in 2030 (Tcf)
17

1818
Global Gas Markets in 2030 (Tcf)
18

Global natural gas use (Tcf)
2030
EPPA reg – 130 Tcf
EPPA gl – 160 Tcf
IEA new pol – 152 Tcf
IEA cur pol – 159 Tcf
Exxon – 172 Tcf
BP – 169 Tcf
Shell – 160 Tcf
Nat gas study
19

Cornell Uni - Howarth• Natural gas generation is twice GHG-intensive as
Coal.• Low gas generation efficiency – 28% (other numbers
provided in the table but not in the headlines).• GWP – 20 years vs 100 years.• Legitimate questions about uncertainty.• But:• 28% - efficiency of a peaking gas unit. Gas in NGCC
– 40-54% efficiency, Coal – 30-35%. • GWP – compare near-term impacts with longer-term
impacts (20,100,500-years; need for damage function, but it is highly uncertain).
• Leakage from production can be reduced.• Recalculating using 100-year GWP and efficiency –
gas generation has 50% less GHG than coal.20

“Bridge to where?”
012345678
2010 2020 2030 2040 2050 2060 2070 2080 2090 2100Year
TkW
hReduced Use
Renew
Hydro
Nucl
Gas_CCS
Gas
Oil
Coal_CCS
Coal
A more stringent CO2 reduction, say 80%, would probably require the complete de-carbonization of the power sector. This makes it imperative that the development of competing low carbon technology continues, including CCS for both coal and gas.
21

Main Points• Abundant supplies of natural gas in the world.• Many supplies can be developed and produced at
relatively low cost.• The role of natural gas is likely to continue to expand
as a result of its availability, its utility, and relatively low cost.
• In a carbon-constrained economy, the relative importance of gas is likely to increase even further, as it is one of the most cost-effective means by which to maintain energy supplies while reducing GHGs.
• In the U.S., natural gas sets the cost benchmark against which clean power sources must compete.
• Stringent carbon constraints would require de-carbonization.
22