the role of malaysian residential properties … · correlation between residential properties and...
TRANSCRIPT

14TH PACIFIC RIM REAL ESTATE SOCIETY ANNUAL CONFERENCE Istana Hotel, Kuala Lumpur, Malaysia
20 – 23 January 2008
The Role of Malaysian Residential Properties in a Mixed Asset Portfolio
Tan Chu Yao
School of Built Environment, Heriot-Watt University
Ting Kien Hwa *
Department of Estate Management, Universiti Teknologi MARA
* Contact author: Department of Estate Management Faculty of Architecture, Planning & Surveying Universiti Teknologi MARA 40450 Shah Alam, Selangor Malaysia Tel: 603-5544 4217 Fax: 603-5544 4353 Email: [email protected]

2
The Role of Malaysian Residential Properties in a Mixed Asset Portfolio
Abstract
This study examines the role of Malaysian residential properties in providing portfolio diversification benefits in Malaysian mixed asset portfolios. The mixed asset portfolio comprises shares (represented by Kuala Lumpur Composite Index, Kuala Lumpur Second Board Index, Kuala Lumpur Property Sector Index), bond (represented by Malaysian Government Securities Index) and Malaysian residential properties (represented by the Malaysian House Price Indices for the various house types and geographical locations). The mean-variance framework is used to determine the optimal asset allocations in terms of preferred house types and geographical locations with other financial assets for the 1Q2000-3Q2006 study period. The findings of this study demonstrate that ex-post efficient portfolios typically devote a significant allocation to residential properties (up to 66.68%), which will improve the risk-adjusted performance up to 73.87%. Further improvement of risk-adjusted returns can be achieved (up to 89.79%) by adding one more different residential property class into the mixed asset portfolios that already consists of one residential property class. Investors are also able to construct well diversified mixed asset portfolios by incorporating residential properties from two different districts while achieving higher risk-adjusted performance. This study concludes that there are diversification benefits by incorporating residential properties in a mixed asset portfolio in the Malaysian investment context.
Keywords: Malaysian residential properties, portfolio diversification, mean variance analysis
3
Introduction Residential properties, be it investment or owner-occupied property, is recognised as an
important component in overall wealth. However, the effect and contribution of
residential properties to an investment portfolio is not explicitly acknowledged; hence
the allocation to residential properties is not being systematically determined and
managed. To be consistent with the Modern Portfolio Theory (Markowitz, 1952; 1959),
residential properties should be included in a mixed asset portfolio.
Residential properties, as an asset class, should be evaluated in the light of how it
interacts with other assets (i.e. shares and bonds) within the portfolio perspective and
how it impacts the overall portfolio performance.
Aim and objectives
With increased significance of residential properties as an investment asset and the
potential diversification benefits of Malaysian residential properties in a mixed asset
portfolio, it is essential to assess the roles of Malaysian residential properties within
investment portfolios. This paper aims to examine the benefits of incorporating
Malaysian residential properties in a mixed asset portfolio.
The objectives of this study are:
(a) To investigate the effects and diversification benefits of incorporating residential
properties in mixed asset portfolio
(b) To determine which property types and locations contribute more towards the
improvement of the overall portfolio performance
(c) To determine the optimal allocations of residential properties in an investment
portfolio
The findings of this study will present evidence of whether residential property is a
worthwhile investment within a portfolio perspective. In addition, these findings will
provide suggestions on the optimal asset allocations between residential property and
financial assets, and the preferred house types and geographical locations, which could
help in achieving better diversification benefits. These findings are vital for investors
because of the indivisibility and large initial outlay of acquiring a residential property,
causing them having difficulty to possess a truly diversified residential property portfolio.
Subsequently, this research could serve as a guideline to investors to incorporate
Malaysian residential properties in their investment portfolio with the ultimate aim to
increase wealth with reduced risks.

4
Diversification benefits of residential properties in mixed asset portfolios
A comparable study conducted by Hartzell et al. (1986) use a capital appreciation return,
based on an appraisal price index, to investigate the diversification benefits of US
residential properties investment in a portfolio context for 1973 to 1983. Their findings
confirm earlier evidence that housing assets offer attractive diversification opportunities
for stock and bond portfolios along with considerable inflation hedging. Besides, they
suggest that residential properties are weakly correlated with the non-residential
properties (e.g. office, industrial, hotel, and, to a lesser extent, retail). Therefore, housing
investment seems to provide a property diversification opportunity. In other words,
housing investment could play a potential role of diversifier within portfolios of different
property types. However diversification across property segments involves high cost and
there is administrative burden of selecting and managing the investment.
According to Goetzmann and Ibbotson (1990), residential properties investment total
returns outperformed long-term government bonds but underperformed the stock market,
and that the volatility of housing investment are noticeably lower than the volatility of the
share and long-term government bonds. However, they point out that for the individual
homeowner, who does not have a well-diversified portfolio of residential properties, the
risk is much higher. The risk of investment in an individual home over a year is closer to
12 per cent than the 3 per cent for a large portfolio of houses. Following these, they
claim that returns on residential properties have strong negative correlation with the
returns on long-term government bonds and on shares, and strong positive relationship
with inflation. Additionally, they find that returns on residential properties are only slightly
correlated with the returns on commercial properties. They report that, given the low
correlation between residential properties and financial assets; residential properties are
potential portfolio diversifier in optimal mixed asset portfolios, even if housing returns are
expected to be relatively low and the volatility to be relatively high. Besides, they also
state that substantial reductions in risk may be achieved by diversifying regionally in
residential properties.
Hutchison (1994) investigates the performance of UK housing assets in short-to-medium
holding periods, both in absolute terms and in comparison with financial assets (shares
and government bonds) over the 1984-1992 sample periods. Hutchison (1994)
demonstrate low levels of correlation between the return on housing and those on
shares and government bonds. In contradiction to previous studies, the computed data

5
suggest that the returns adjusted for risk on housing investment underperformed those
on both shares and government bonds during the sample period.
Hoesli and Hamelink (1997) investigate the residential property diversification benefits to
mixed asset portfolios during the period between 1981-1992, in two Swiss housing
markets (Geneva and Zurich). The study confirm earlier studies that housing assets are
effective portfolio diversifiers for multi-asset portfolios even though the illiquidity of
residential properties are accounted for (they use illiquidity premiums of 50, 100 and
150 basis points). Furthermore, they also find that an investor who holds residential
properties in one Swiss housing market would also gain benefits from investing in
another Swiss housing market when only the housing investment asset’s class of the
portfolio is considered.
Ting and Mohd (2004) examine the performance of Malaysian residential property
sectors in comparison with financial assets (shares and fixed deposit) for the 1989 –
2001 period. The research focuses on risk-return, comparison of residential risk-
adjusted performance with financial assets and identification of risk reduction benefits of
residential properties through portfolio diversification. The authors demonstrate that
detached houses provide higher capital appreciation compared to other forms of
housing and these high returns are associated with high risks (higher variability in its
return). In addition, Ting and Mohd (2004) also report that the best performing
residential properties by geographical locations are in Kuala Lumpur, Penang and Johor
(Malaysian states). Whilst in terms of regions, investors would perform well by investing
in Johor Bahru followed by Klang Valley and Penang Island. On an inter-asset
comparison basis, the best risk-adjusted performance comes from detached and semi-
detached houses in Kuala Lumpur which performed better than equities proxied by the
Kuala Lumpur Composite Index (KLCI). The findings indicate that Malaysian residential
properties in selected states and by types have perform well and individual investors
could enjoy considerable risk reduction by incorporating residential properties in their
investment portfolios.
Further to Ting and Mohd’s (2004) work, another comparable research is conducted by
Tan and Ting (2004) to observe the effects and diversification benefits of incorporating
Malaysian residential property in a personal investment portfolio, which consist of
shares and bonds over the 1989 – 2001 periods. Tan and Ting (2004) find that an
allocation portion of 50% to 65% of a total available fund to Malaysian residential
property, mostly in terraced house, in any of the five main regions of Malaysia, and the
remainder invested in bonds and shares will create a more superior personal investment

6
portfolio, both in terms of higher risk-adjusted return and extensive reduction in overall
risks. These findings clearly demonstrate the significance of diversification gain when
residential properties and financial assets are invested as a portfolio.
Research methodology
Data Variables
The return computation for Malaysian residential properties, in terms of quarterly capital
returns, is base on the Malaysian House Price Index (MHPI) series. Due to the
limitations of the MHPI, transaction costs and rental returns are not incorporated in the
returns computation.
The closing quarterly values of the Kuala Lumpur Composite Index (KLCI) are used as a
proxy for the performance of the Bursa Malaysia, representing Malaysian equity
investment returns.
The closing quarterly values of the Kuala Lumpur Second Board Index (KLSBI) are used
as a proxy for Malaysian small capital equity investment returns.
The closing quarterly values of the Kuala Lumpur Property Sector Index (KLPI) are used
as a proxy for the performance of Malaysian property related equity investment returns,
representing Malaysian indirect property investments.
The quarterly Malaysian Government Securities (MGS) Index (Jan 2000 – Sep 2006)
are used as a proxy for Malaysian bond investment returns.
Data Sources
The Malaysian House Price Index (MHPI) is provided by the Valuation & Property
Services Department of the Ministry of Finance, Malaysia. The MHPI is a transaction-
based national house price index published by the National Property Information Centre
(NAPIC) of the Valuation & Property Services Department. Capital values of residential
properties are obtained from the latest MHPI publication covering the study period from
Jan 2000 to Sep 2006 on a quarterly basis. The MHPI has more than two hundred sub-
indexes comprising the national, state and district house price indexes. Among these
two hundred sub-indexes, four house type sub-indexes, fourteen states sub-indexes
and forty-one districts sub-indexes are available and are used in the analyses for this
study. The house type sub-indexes are Terraced, Semi-detached, Detached and High-
rise unit, and the fourteen states are Johor, Kuala Lumpur, Kedah, Kelantan, Melaka,
7
Negeri Sembilan, Pahang, Penang, Perak, Perlis, Sabah, Sarawak, Selangor and
Terengganu.
The quarterly values of the Kuala Lumpur Composite Index (KLCI), Kuala Lumpur
Second Board Index (KLSBI), Kuala Lumpur Property Sector Index (KLPI) and quarterly
Malaysian Government Securities (MGS) Index are obtained from Bloomberg website, a
leading global provider of data, news and analytics.
Study Period
The study period is from Jan 2000 to Sep 2006, which covers six years and nine months.
The beginning period for the year 2000 is chosen because the earliest period for the
Malaysian House Price Index in quarterly series is available only from the year 2000
onwards. A total of twenty-seven quarterly data points are available for analyses.
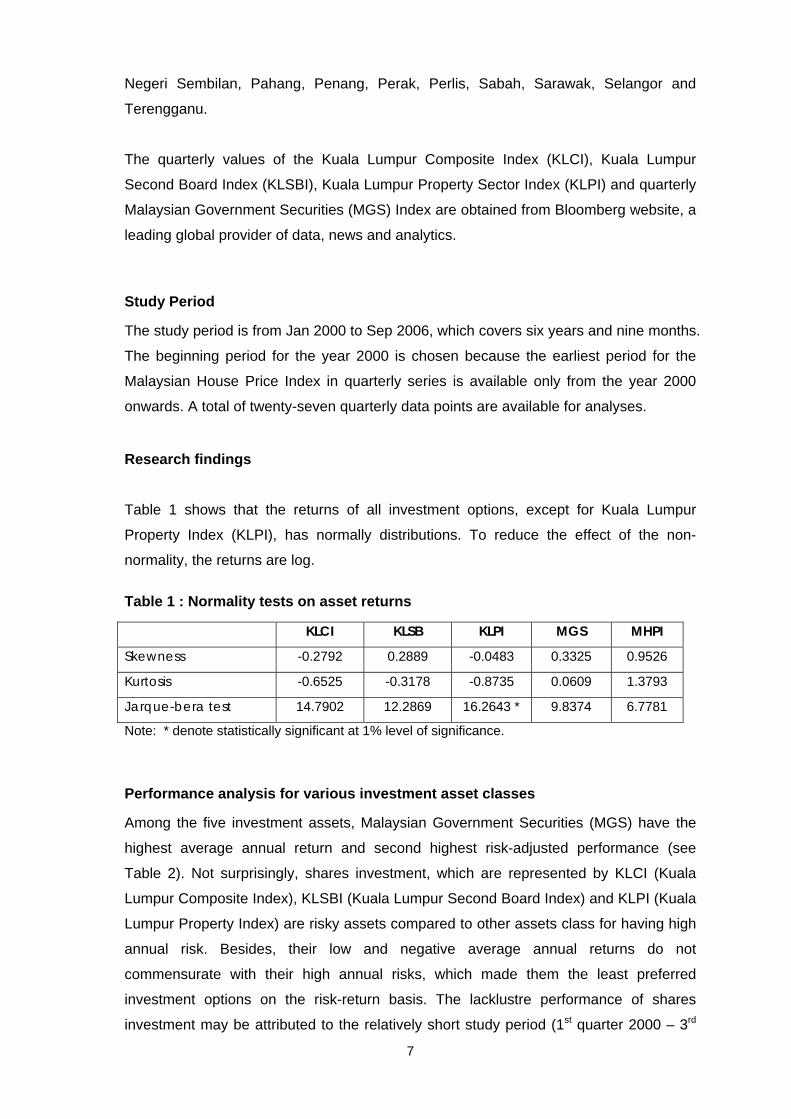
Research findings Table 1 shows that the returns of all investment options, except for Kuala Lumpur
Property Index (KLPI), has normally distributions. To reduce the effect of the non-
normality, the returns are log.
Table 1 : Normality tests on asset returns
KLCI KLSB KLPI MGS MHPI
Skewness -0.2792 0.2889 -0.0483 0.3325 0.9526
Kurtosis -0.6525 -0.3178 -0.8735 0.0609 1.3793
Jarque-bera test 14.7902 12.2869 16.2643 * 9.8374 6.7781
Note: * denote statistically significant at 1% level of significance.
Performance analysis for various investment asset classes
Among the five investment assets, Malaysian Government Securities (MGS) have the
highest average annual return and second highest risk-adjusted performance (see
Table 2). Not surprisingly, shares investment, which are represented by KLCI (Kuala
Lumpur Composite Index), KLSBI (Kuala Lumpur Second Board Index) and KLPI (Kuala
Lumpur Property Index) are risky assets compared to other assets class for having high
annual risk. Besides, their low and negative average annual returns do not
commensurate with their high annual risks, which made them the least preferred
investment options on the risk-return basis. The lacklustre performance of shares
investment may be attributed to the relatively short study period (1st quarter 2000 – 3rd

8
quarter 2006). Moreover, the Malaysian property share market was adversely affected
by the 1997 Asian financial crisis (Kallberg et al, 2002) and had significantly
underperformed the Malaysian residential properties, bond and stock market over the
study period.
For Malaysian residential properties (represented by MHPI), they have the second
highest average annual return and best performance in terms of risk-adjusted return. In
fact, the low standard deviation for MHPI is contributing significantly to the best risk-
adjusted performance among other asset classes and subclasses. A risk-return diagram
for the five investment assets are shown in Figure 1.
Performance analysis of residential properties by house types
In Table 3, among all the residential property types, terraced houses surpass all other
residential property types by having the highest risk-adjusted performance, which is
1.198. In terms of average annual appreciation, Malaysian detached houses have the
highest average annual return of 5.43%; while having second place in terms of risk-
adjusted return, due to medium high standard deviation compared to other residential
property types. The similar case applies to semi-detached houses. In view of that, they
have higher average annual return than terraced houses, but poorer performance (in
terms of risk-adjusted return) than terraced houses due to higher annual risk.
Nevertheless, all these three asset subclasses mentioned are ranked top twenty in
overall ranking. With a high annual risk compared to other housing types, Malaysian
high-rise properties are poorest performing housing type in terms of risk-adjusted
performance.
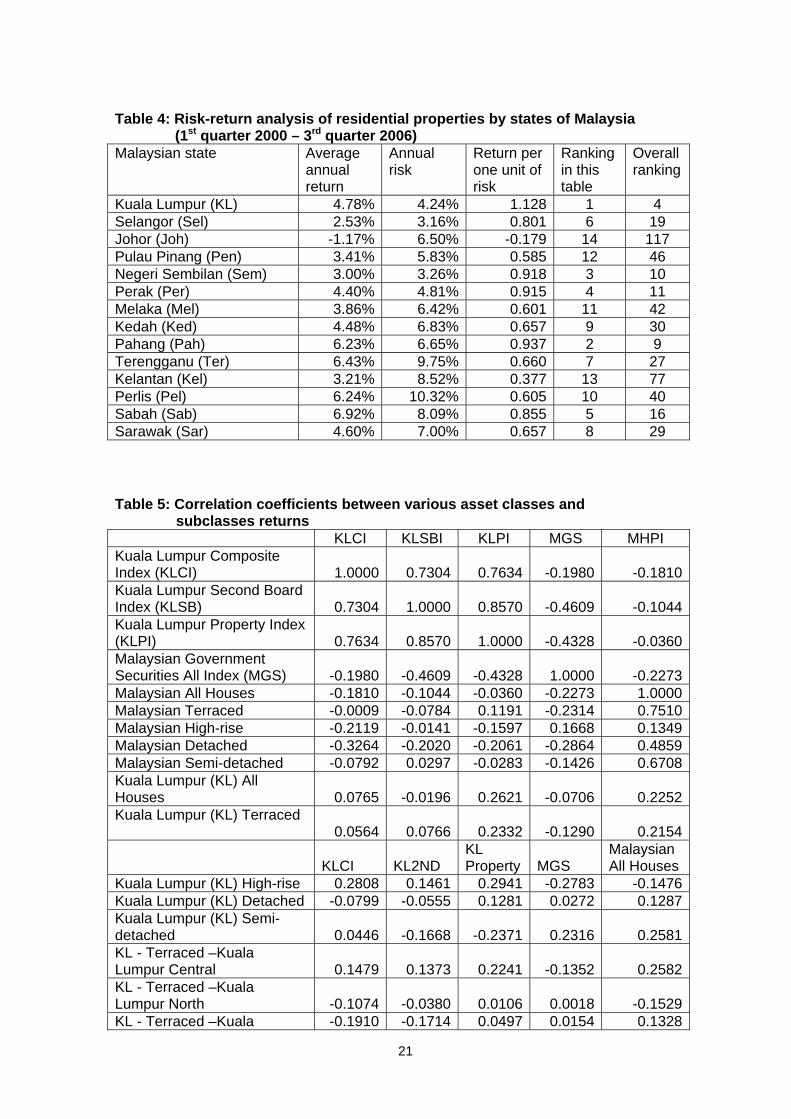
Performance analysis of residential properties by states
Table 4 shows the performance of the residential property sectors by states. As the
Malaysian national capital, Kuala Lumpur ranked first in terms of risk-adjusted return,
followed by Pahang and Negeri Sembilan. Besides, these state achieved top ten in
overall ranking among all the assets (including subclasses). In effect, among all the
Malaysian states, only Kuala Lumpur has an average annual return higher than annual
risk. This result is expected as Kuala Lumpur is the most urbanised state in Malaysia
and there is always high demand for its residential properties. Although Sabah,
Terengganu, Perlis and Pahang have higher average annual returns compared to Kuala
Lumpur, they have lower return per risk ratio due to higher volatility in returns. Johor is
the only state which has negative average annual return and consequently is the worst
performing state. In terms of risk-adjusted return, Johor ranked 118 out of a total

9
number of 121 assets (including asset subclasses). The poor performance of Johor may
be attributed to its residential property market which has not recovered fully from the
Asian financial crisis since 1997.
Portfolio diversification benefits of Malaysian residential properties
Correlation analysis
All indexes employed in this study are based on quarterly basis. Table 5 presents the
correlation coefficients between the various asset classes and subclasses. The
components of housing returns are also considered.
By referring to Table 5, share investment options (KLCI, KLSB and KLPI) are highly
correlated with one another, which are more than 70%. This implies that Malaysian
indirect property investments (represented by KL Property index) do not provide
significant portfolio diversification benefits in share portfolios. However, fixed income
financial asset such as bond (Malaysian Government Securities) is negatively correlated
with share investments (KLCI, KLSB and KLPI). These negative correlations allow
particular fixed income financial asset to be a good candidate for portfolio diversifier in a
mixed asset portfolio that contains shares.
In addition, it is notable that Malaysian residential properties are negatively correlated
with the return of other financial assets, especially for bonds (-22.73%), which is
represented by Malaysian Government Securities (MGS). These results suggest the
existence of possible diversification benefits by including Malaysian residential
properties to form a mixed asset portfolio. Selangor detached houses have the lowest
correlation with share investments, which are lower than -40%. Moreover, Penang
detached houses and Kelantan semi-detached houses have the lowest correlation with
Malaysian Government Securities, which are lower than -48%. However, it should not
be ignored that the results of negative correlation of residential properties could be
partly due to the way the house price indexes are constructed.
Mixed asset portfolio performance (without residential properties)
In order to investigate the portfolio diversification benefits of Malaysian residential
properties, portfolio of four financial assets (KLCI, KLSB, KLPI and MGS, without
Malaysian residential properties) is analysed and studied, for the purpose of
benchmarking and comparison in later part of this section. Figure 2 illustrates the
10
efficient frontier of four financial assets portfolio (without Malaysian residential
properties).
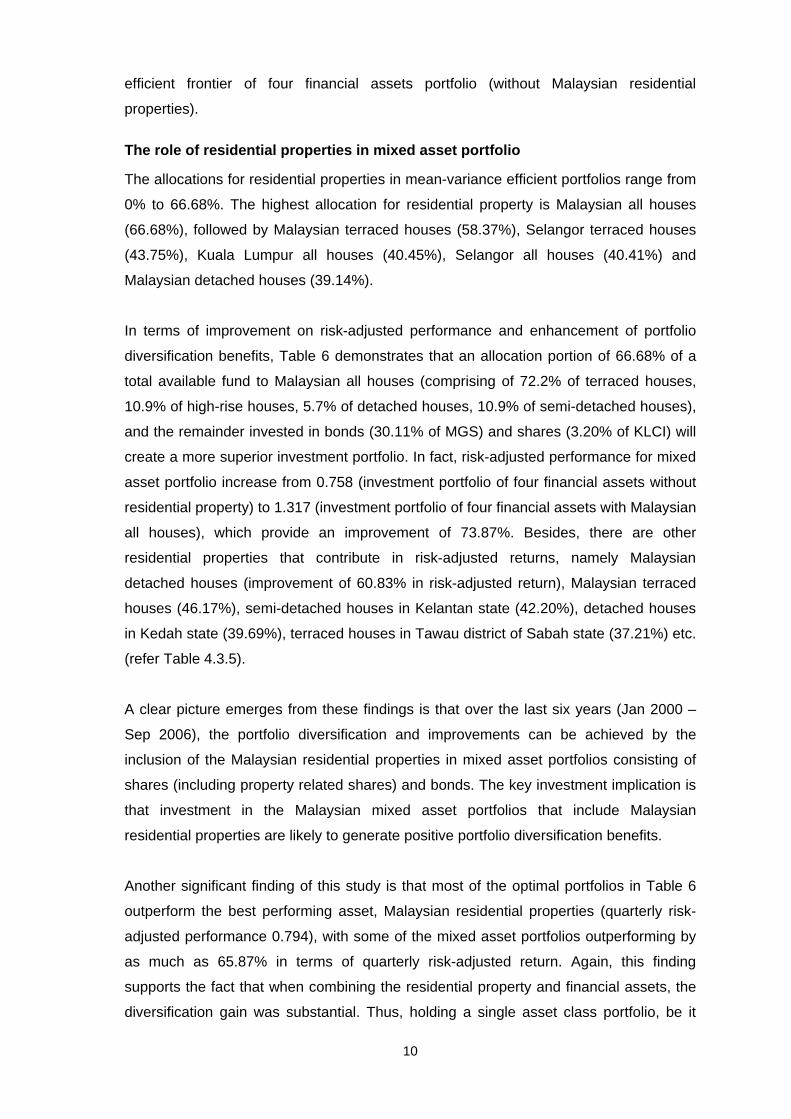
The role of residential properties in mixed asset portfolio
The allocations for residential properties in mean-variance efficient portfolios range from
0% to 66.68%. The highest allocation for residential property is Malaysian all houses
(66.68%), followed by Malaysian terraced houses (58.37%), Selangor terraced houses
(43.75%), Kuala Lumpur all houses (40.45%), Selangor all houses (40.41%) and
Malaysian detached houses (39.14%).
In terms of improvement on risk-adjusted performance and enhancement of portfolio
diversification benefits, Table 6 demonstrates that an allocation portion of 66.68% of a
total available fund to Malaysian all houses (comprising of 72.2% of terraced houses,
10.9% of high-rise houses, 5.7% of detached houses, 10.9% of semi-detached houses),
and the remainder invested in bonds (30.11% of MGS) and shares (3.20% of KLCI) will
create a more superior investment portfolio. In fact, risk-adjusted performance for mixed
asset portfolio increase from 0.758 (investment portfolio of four financial assets without
residential property) to 1.317 (investment portfolio of four financial assets with Malaysian
all houses), which provide an improvement of 73.87%. Besides, there are other
residential properties that contribute in risk-adjusted returns, namely Malaysian
detached houses (improvement of 60.83% in risk-adjusted return), Malaysian terraced
houses (46.17%), semi-detached houses in Kelantan state (42.20%), detached houses
in Kedah state (39.69%), terraced houses in Tawau district of Sabah state (37.21%) etc.
(refer Table 4.3.5).
A clear picture emerges from these findings is that over the last six years (Jan 2000 –
Sep 2006), the portfolio diversification and improvements can be achieved by the
inclusion of the Malaysian residential properties in mixed asset portfolios consisting of
shares (including property related shares) and bonds. The key investment implication is
that investment in the Malaysian mixed asset portfolios that include Malaysian
residential properties are likely to generate positive portfolio diversification benefits.
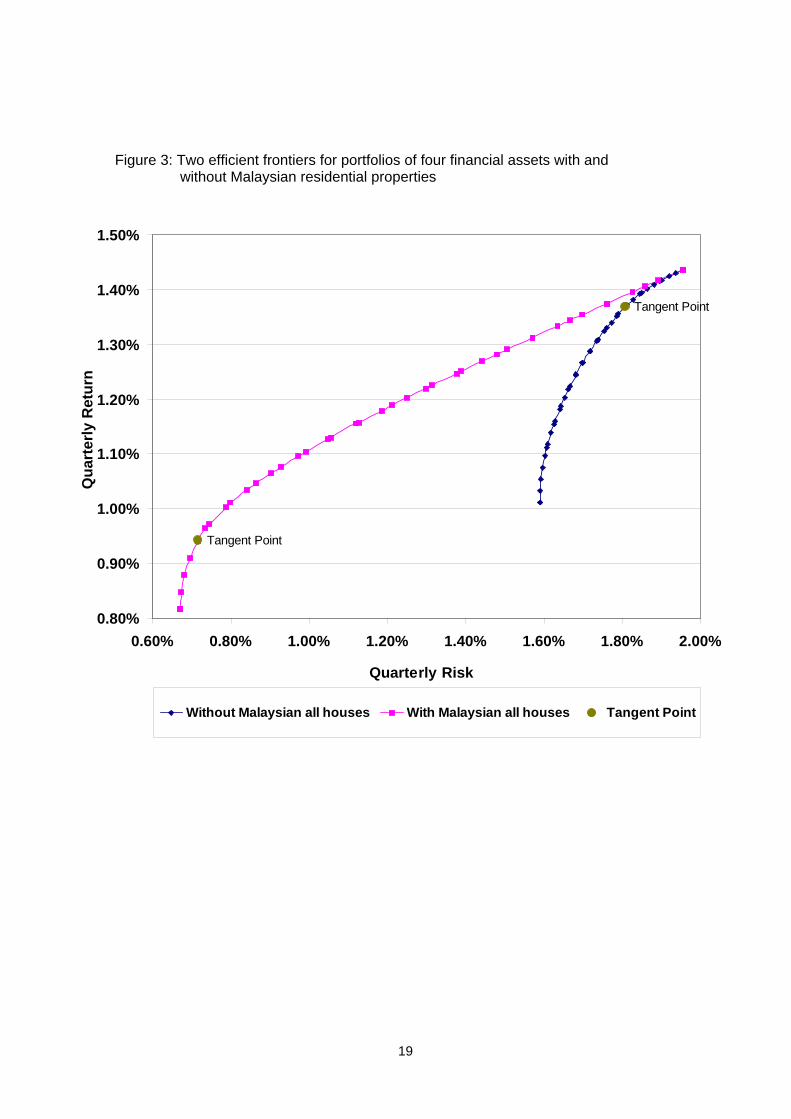
Another significant finding of this study is that most of the optimal portfolios in Table 6
outperform the best performing asset, Malaysian residential properties (quarterly risk-
adjusted performance 0.794), with some of the mixed asset portfolios outperforming by
as much as 65.87% in terms of quarterly risk-adjusted return. Again, this finding
supports the fact that when combining the residential property and financial assets, the
diversification gain was substantial. Thus, holding a single asset class portfolio, be it
11
financial asset or residential property, not only induces unnecessary non-systematic
risk, but also resulted in sub-optimal investment performance. Figure 3 illustrates two
efficient frontiers for portfolios of four financial assets with and without Malaysian
residential properties.
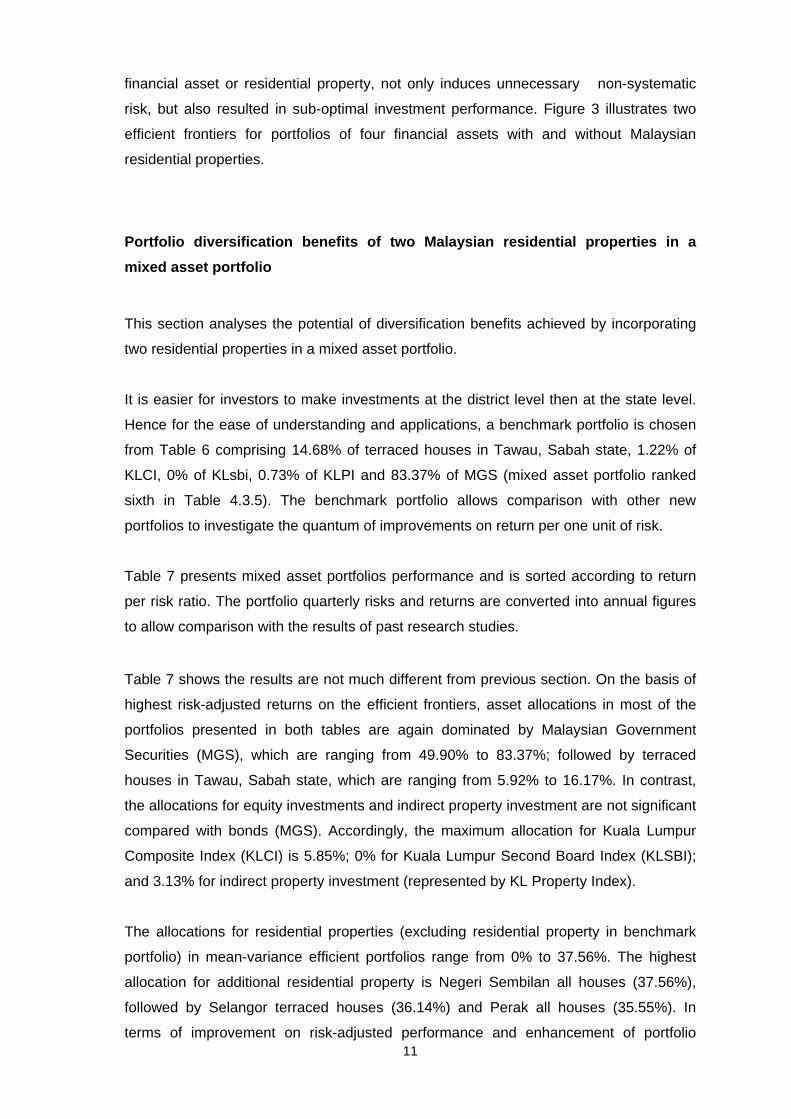
Portfolio diversification benefits of two Malaysian residential properties in a mixed asset portfolio
This section analyses the potential of diversification benefits achieved by incorporating
two residential properties in a mixed asset portfolio.
It is easier for investors to make investments at the district level then at the state level.
Hence for the ease of understanding and applications, a benchmark portfolio is chosen
from Table 6 comprising 14.68% of terraced houses in Tawau, Sabah state, 1.22% of
KLCI, 0% of KLsbi, 0.73% of KLPI and 83.37% of MGS (mixed asset portfolio ranked
sixth in Table 4.3.5). The benchmark portfolio allows comparison with other new
portfolios to investigate the quantum of improvements on return per one unit of risk.
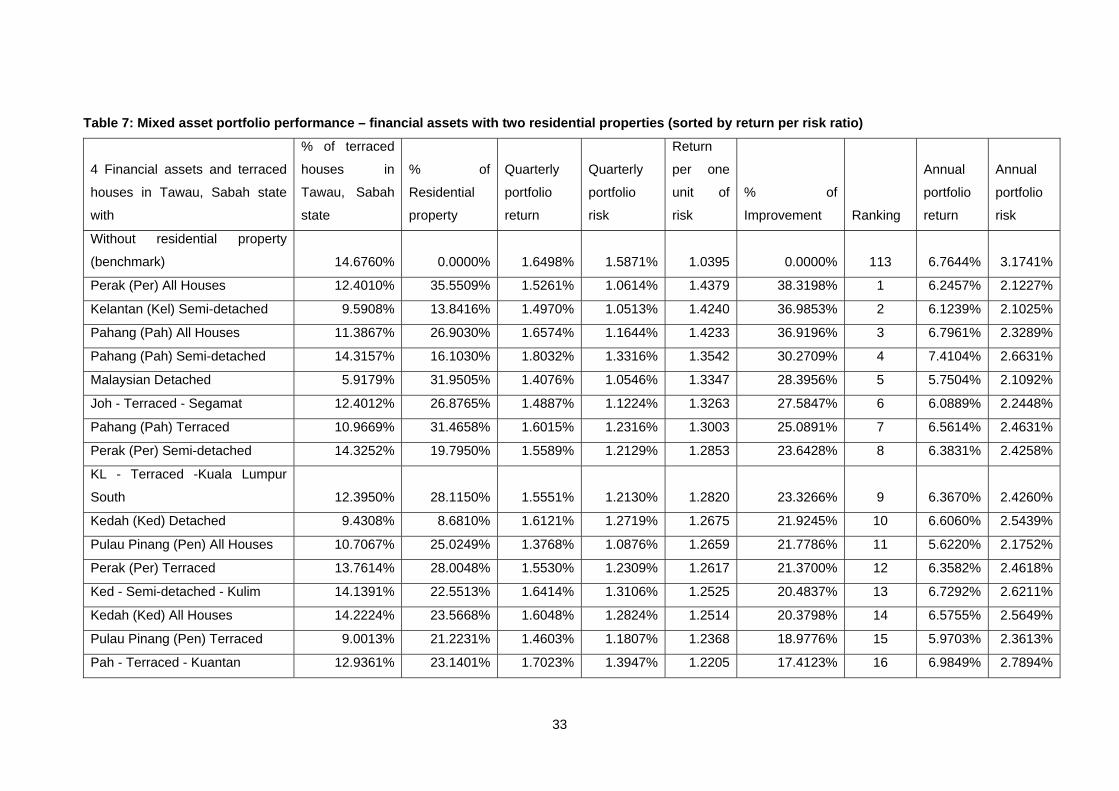
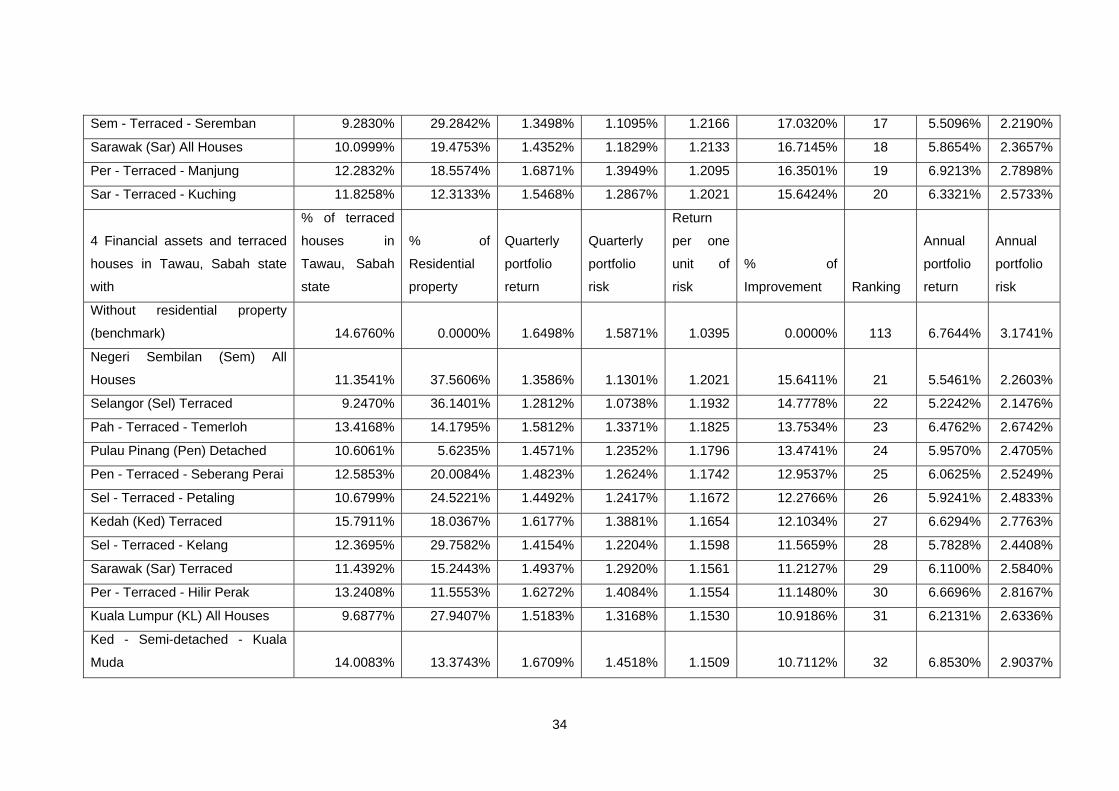
Table 7 presents mixed asset portfolios performance and is sorted according to return
per risk ratio. The portfolio quarterly risks and returns are converted into annual figures
to allow comparison with the results of past research studies.
Table 7 shows the results are not much different from previous section. On the basis of
highest risk-adjusted returns on the efficient frontiers, asset allocations in most of the
portfolios presented in both tables are again dominated by Malaysian Government
Securities (MGS), which are ranging from 49.90% to 83.37%; followed by terraced
houses in Tawau, Sabah state, which are ranging from 5.92% to 16.17%. In contrast,
the allocations for equity investments and indirect property investment are not significant
compared with bonds (MGS). Accordingly, the maximum allocation for Kuala Lumpur
Composite Index (KLCI) is 5.85%; 0% for Kuala Lumpur Second Board Index (KLSBI);
and 3.13% for indirect property investment (represented by KL Property Index).
The allocations for residential properties (excluding residential property in benchmark
portfolio) in mean-variance efficient portfolios range from 0% to 37.56%. The highest
allocation for additional residential property is Negeri Sembilan all houses (37.56%),
followed by Selangor terraced houses (36.14%) and Perak all houses (35.55%). In
terms of improvement on risk-adjusted performance and enhancement of portfolio

12
diversification benefits, Table 7 displays that an allocation portion of 35.55% of a total
available fund to Perak all houses and 12.40% to terraced houses in Tawau, Sabah
state; and the remainder invested in bonds (52.05% of MGS) will create a more superior
investment portfolio. In fact, risk-adjusted performance for particular mixed asset
portfolio increase from 1.040 (benchmark portfolio - portfolio of four financial assets and
terraced houses in Tawau, Sabah state) to 1.438 (investment portfolio of four financial
assets, terraced houses in Tawau, Sabah state and Perak all houses), which record an
improvement of 38.32%. In addition, by comparing the best performing portfolio in Table
6 (investment portfolio of four financial assets with only one residential property class -
Malaysian all houses, with quarterly portfolio risk-adjusted return 1.317), an
improvement of 9.15% is achieved for risk-adjusted return. Furthermore, there are other
residential properties which do contribute toward achieving higher risk-adjusted returns
(compared to benchmark investment portfolio), namely semi-detached houses in
Kelantan (improvement of 36.99% in risk-adjusted return), all houses in Pahang
(36.92%), semi-detached houses in Pahang (30.27%), Malaysian detached houses
(28.40%), terraced houses in Segamat, Johor state (27.59%). In fact, these six
investment portfolios mentioned above achieve higher risk-adjusted performance,
compared to the best performing portfolio in Table 6 (investment portfolio of four
financial assets with only one residential property class - Malaysian all houses, with
quarterly portfolio risk-adjusted return 1.317).
Taking the results as whole, there is a clear evidence that over the last six years (Jan
2000 – Sep 2006), the portfolio diversification and improvement of risk-adjusted returns
benefits of additional Malaysian residential properties (adding one more residential
property class) are present in existing Malaysian mixed asset portfolios, consisting of
one residential property class (terraced house in Tawau, Sabah state in this study),
Malaysian shares (including property related shares) and Malaysian bonds. The key
investment implication is that investment in the Malaysian mixed asset portfolios that
include additional Malaysian residential properties (adding one more residential property
class to investment portfolio that already contains one residential property class) are
likely to generate positive portfolio diversification benefits over the last six years.
Another significant finding of this study is standard institutional investors with limited
fund (size) are able to construct well diversified portfolios by incorporating residential
properties from two different districts (by avoiding residential property classes at state
level and national level), such as terraced houses from Tawau, Sabah state and
Segamat, Johor state; instead of incorporating only one residential property class (such
as Malaysian all houses) in their investment portfolio.

13
Conclusion
This study has focused on the diversification benefits of Malaysian residential properties
in Malaysian mixed asset portfolios and has provided some interesting and important
insights into the dynamics and performance of various Malaysian residential properties
(by types and by geographical locations). The findings of this study demonstrate that ex-
post efficient portfolios typically devote a significant proportion to some residential
properties (for example: Malaysian all houses (66.68%), Malaysian terraced houses
(58.37%), Selangor terraced houses (43.75%), Kuala Lumpur all houses (40.45%),
Selangor all houses (40.41%), Malaysian detached houses (39.14%) etc.).
Malaysian all houses (comprise of 72.2% of terraced houses; 10.9% of high-rise houses,
5.7% of detached houses, 10.9% of semi-detached houses) are one of the best
performing asset classes (in terms of risk-adjusted return) in the study period (Jan 2000
– Sep 2006), followed by Malaysian bonds (MGS). However, placing all funds in a single
asset class has resulted in sub-optimal performance. The results illustrate that an
allocation portion of 66.68% of a total available fund to Malaysian all houses, and the
remainder invested in bonds (30.11% of MGS) and shares (3.20% of KLCI) will create a
superior investment portfolio. In fact, risk-adjusted performance for particular mixed
asset portfolio increase from 0.758 (investment portfolio of four financial assets without
residential property) to 1.317 (investment portfolio of four financial assets with Malaysian
all houses), which is recording an improvement of 73.87%.
Another significant finding of this study is that over the last six years (Jan 2000 – Sep
2006), there are portfolio diversification benefits and improvement of risk-adjusted
returns by adding an additional Malaysian residential properties (adding one more
residential property class) into a Malaysian mixed asset portfolio, that is consisting of
one residential property class (terraced house in Tawau, Sabah state in this study),
Malaysian shares (including property related shares) and Malaysian bonds. For instance,
an allocation portion of 12.40% of a total available fund to terraced houses in Tawau,
Sabah state and 26.88% to terraced houses in Segamat, Johor state, and the remainder
invested in bonds (59.68% of MGS) and shares (1.05% of KLCI), a risk-adjusted return
of 1.326 will be achieved (slightly higher than 1.317, the risk-adjusted return for mixed
asset portfolio mentioned previously). The key investment implication is that investment
in the Malaysian mixed asset portfolios that include additional Malaysian residential
properties (adding one more residential property class to investment portfolio that
already contains one residential property class) are likely to generate positive portfolio
diversification benefits over the last six years (six years and nine months).

14
A better performance can be achieved for a mixed asset portfolios by incorporating
residential properties from two different districts (by avoiding residential property classes
at state level and national level), such as terraced houses from Tawau, Sabah state and
Segamat, Johor state; instead of incorporating only one residential property class (such
as Malaysian all houses) in their investment portfolio.
In fact, the findings confirm that the fund size requirement will be reduced significantly
for building an investment portfolio that contains four financial assets and terraced
houses from two districts (Tawau, Sabah state and Segamat, Johor state in this case),
while achieving higher risk-adjusted performance (compared to investment portfolio that
contains four financial assets and Malaysian all houses).
Other than direct residential property investments, this study also finds that Malaysian
indirect property investments have failed to contribute to mixed asset portfolios of
Malaysian shares, bonds and direct residential properties in terms of improving risk-
adjusted performance and enhancing portfolio diversification benefits over the study
period. This was mainly due to Malaysian indirect property investments’ inferior
investment performance affected by the 1997 Asian economic crisis (Kallberg et al,
2002).
Overall, the findings of this study demonstrate the importance of incorporating
residential properties into an investment portfolio. Therefore investors should
systematically allocate their resources into various asset classes at methodically (i.e.
optimally) determined proportion to achieve a well-diversified portfolio.
15
References
Byrne, P and Lee, S (1994a) Computing Markowitz efficient frontiers using a
spreadsheet optimizer. Journal of Property Finance, Vol. 5, No. 1, 58-66.
Byrne, P and Lee, S (1994b) Real estate portfolio analysis using a spreadsheet
optimizer. Journal of Property Finance, Vol. 5 No. 4, 19-31.
Goetzmann, W N and Ibbotson, R (1990) The performance of real estate as an asset
class. Journal of Applied Corporate Finance, Vol. 3 No. 1, 65-76.
Hartzell, J, Hekman, J and Miles, M (1986) Diversification categories in investment real
estate. Journal of American Real Estate and Urban Economics Association, Vol.
14, No. 2, 230-254.
Hoesli, M and Hamelink, F (1997) An examination of the role of Geneva and Zurich
housing in Swiss institutional portfolios. Journal of Property Valuation &
Investment, Vol. 15, No. 4, 354-371.
Hoesli, M and MacGregor, B (2000) Property Investment – Principles and Practices of
Portfolio Management. Harlow, England: Longman - Pearson Education
Limited.
Hutchison, N E (1994) Housing as an investment? A comparison of returns from
housing with other types of investment. Journal of Property Finance, Vol. 5, No.
2, 47– 61.
Ibbotson, R and Siegel, L (1984) Real estate returns: a comparison with other
investments. Journal of American Real Estate and Urban Economics
Association, Vol. 12, No. 3, 219-242.
MacGregor, B D and Nanthakumaran, N (1992) The allocation to property in the multi
-asset portfolio: the evidence and theory reconsidered. Journal of Property
Research, Vol. 9, 5-32.
Markowitz, H M (1952) Portfolio selection, Journal of Finance, 7, 77-91.
Markowitz, H M (1959) Portfolio selection: efficient diversification of investment,
Cowles Foundation Monograph No.16, Yale University Press.
Montezuma, J and Gibb, K (2003) Evaluation of residential property as an institutional
investment asset group: The Swiss, Dutch and Swedish cases. In: 15th Annual
American Real Estate and Urban Economics Association International
Conference, 15-17 June 2003, Cracow, Poland.
Montezuma, J (2004a) Housing investment in an institutional portfolio context – A
review of the issues. Property Management, Vol. 22, No. 3, 230 – 249.
Montezuma, J (2004b) Owner-occupied housing and household asset allocation – A
review of the issues. Property Management, Vol. 22, No. 4, 267 – 275.
16
National Property Information Centre (2006) The Malaysian House Price Index. Q3 -
Q4 2006. Valuation and Property Services Department, Ministry of Finance
Malaysia.
Newell, G (2003) Diversification Benefits of European and Global Property Stocks,
EPRA Research.
Tan, Y K (1999) An Hedonic Model for house prices in Malaysia. In: 5th Annual
PRRES Conferences, 26-30 January 1999, Kuala Lumpur, Malaysia.
Tan, Y K and Ting, K H (2004) The role of residential property in personal investment
portfolios: the case of Malaysia. Pacific Rim Property Research Journal, Vol.
10, No 4, 467 – 486.
Ting, K H and Mohd, S J (2004) Risk-return analysis of the Malaysian residential
property sector. Journal of Built Environment, Universiti Teknologi MARA
publication, No.1, January, 32 – 48.
Valuation and Property Services Department, Ministry of Finance Malaysia (2001)
Property Market Report. 2001 ed., Kuala Lumpur: Percetakan Nasional
Malaysia Berhad.
Valuation and Property Services Department, Ministry of Finance Malaysia (2005)
Property Market Report. 2005 ed., Kuala Lumpur: Percetakan Nasional
Malaysia Berhad.
Ward, J F (1999) Internal versus external management. Perspectives on
investment management of public pension funds, New Hope, PA: Frank
Fabozzi Associates.

Figure 1 : Risk-return diagram for various asset classes
KLCI
KL2ND
KL Property
MGS
Residential Properties
-20%
-15%
-10%
-5%
0%
5%
10%
0% 5% 10% 15% 20% 25% 30%
Risk (% pa)
Ave
rage
retu
rn (%
pa)

18
Figure 2: Efficient frontier for portfolio of four financial assets without Malaysian Residential properties
Tangent Point
0.90%
1.00%
1.10%
1.20%
1.30%
1.40%
1.50%
1.50% 1.60% 1.70% 1.80% 1.90% 2.00%
Quarterly Risk
Qua
rter
ly R
etur
n
Efficient Frontier Tangent Point
19
Figure 3: Two efficient frontiers for portfolios of four financial assets with and without Malaysian residential properties
Tangent Point
Tangent Point
0.80%
0.90%
1.00%
1.10%
1.20%
1.30%
1.40%
1.50%
0.60% 0.80% 1.00% 1.20% 1.40% 1.60% 1.80% 2.00%
Quarterly Risk
Qua
rter
ly R
etur
n
Without Malaysian all houses With Malaysian all houses Tangent Point

20
Table 1 Normality tests on asset returns
Asset classes KLCI KLSB KLPI MGS Malaysia Residential Properties
Skewness
-0.2792 0.2889 -0.0483
-
0.3325 0.9526
Value of standard errors of skewness x 2 0.9608 0.9608 0.9608 0.9608 0.9608
Kurtosis -0.6525 -0.3178 -0.8735 0.0609 1.3793
Value of standard errors of kurtosis x 2 1.9215 1.9215 1.9215 1.9215 1.9215
Jarque-Bera Test statistic* 14.7902 12.2869 16.2643 9.8374 6.7781
Is Jarque-Bera Test statistic lesser than 15.3791?
Yes Yes No Yes Yes
*At 95% confidence level, the critical chi-square value (n=26) is 15.3791
Table 2: Risk-return analysis of various asset classes (1st quarter 2000 – 3rd quarter 2006)
Asset classes Average annual return
Annual risk
Return per one unit of risk
Ranking Overall ranking
KLCI 1.11% 15.79% 0.071 3 108 KLSB -15.03% 25.43% -0.591 5 121 KLPI -8.91% 23.16% -0.385 4 120 MGS 5.87% 3.99% 1.472 2 2 MHPI 3.04% 1.89% 1.606 1 1
Table 3: Risk-return analysis of residential properties by house types in Malaysia (1st quarter 2000 – 3rd quarter 2006)
House type Average annual return
Annual risk
Return per one unit of risk
Ranking Overall ranking
Terraced 2.72% 2.27% 1.198 1 3 Detached 5.43% 4.95% 1.097 2 6 Semi-detached 3.49% 4.30% 0.811 3 17 High-rise 2.58% 7.69% 0.335 4 88
21
Table 4: Risk-return analysis of residential properties by states of Malaysia (1st quarter 2000 – 3rd quarter 2006)
Malaysian state Average annual return
Annual risk
Return per one unit of risk
Ranking in this table
Overall ranking
Kuala Lumpur (KL) 4.78% 4.24% 1.128 1 4 Selangor (Sel) 2.53% 3.16% 0.801 6 19 Johor (Joh) -1.17% 6.50% -0.179 14 117 Pulau Pinang (Pen) 3.41% 5.83% 0.585 12 46 Negeri Sembilan (Sem) 3.00% 3.26% 0.918 3 10 Perak (Per) 4.40% 4.81% 0.915 4 11 Melaka (Mel) 3.86% 6.42% 0.601 11 42 Kedah (Ked) 4.48% 6.83% 0.657 9 30 Pahang (Pah) 6.23% 6.65% 0.937 2 9 Terengganu (Ter) 6.43% 9.75% 0.660 7 27 Kelantan (Kel) 3.21% 8.52% 0.377 13 77 Perlis (Pel) 6.24% 10.32% 0.605 10 40 Sabah (Sab) 6.92% 8.09% 0.855 5 16 Sarawak (Sar) 4.60% 7.00% 0.657 8 29
Table 5: Correlation coefficients between various asset classes and subclasses returns
KLCI KLSBI KLPI MGS MHPI Kuala Lumpur Composite Index (KLCI) 1.0000 0.7304 0.7634 -0.1980 -0.1810Kuala Lumpur Second Board Index (KLSB) 0.7304 1.0000 0.8570 -0.4609 -0.1044Kuala Lumpur Property Index (KLPI) 0.7634 0.8570 1.0000 -0.4328 -0.0360Malaysian Government Securities All Index (MGS) -0.1980 -0.4609 -0.4328 1.0000 -0.2273Malaysian All Houses -0.1810 -0.1044 -0.0360 -0.2273 1.0000Malaysian Terraced -0.0009 -0.0784 0.1191 -0.2314 0.7510Malaysian High-rise -0.2119 -0.0141 -0.1597 0.1668 0.1349Malaysian Detached -0.3264 -0.2020 -0.2061 -0.2864 0.4859Malaysian Semi-detached -0.0792 0.0297 -0.0283 -0.1426 0.6708Kuala Lumpur (KL) All Houses 0.0765 -0.0196 0.2621 -0.0706 0.2252Kuala Lumpur (KL) Terraced 0.0564 0.0766 0.2332 -0.1290 0.2154
KLCI KL2ND KL Property MGS
Malaysian All Houses
Kuala Lumpur (KL) High-rise 0.2808 0.1461 0.2941 -0.2783 -0.1476Kuala Lumpur (KL) Detached -0.0799 -0.0555 0.1281 0.0272 0.1287Kuala Lumpur (KL) Semi-detached 0.0446 -0.1668 -0.2371 0.2316 0.2581KL - Terraced –Kuala Lumpur Central 0.1479 0.1373 0.2241 -0.1352 0.2582KL - Terraced –Kuala Lumpur North -0.1074 -0.0380 0.0106 0.0018 -0.1529KL - Terraced –Kuala -0.1910 -0.1714 0.0497 0.0154 0.1328

22
Lumpur South KL - High-rise –Kuala Lumpur Central 0.2773 0.1537 0.2863 -0.1980 -0.0808KL - High-rise –Kuala Lumpur North -0.0920 0.0514 -0.0327 -0.1693 -0.1789KL - High-rise –Kuala Lumpur South 0.2260 -0.1643 0.0732 -0.0573 0.0403Selangor (Sel) All Houses -0.3770 -0.2061 -0.2338 0.1122 0.5356Selangor (Sel) Terraced -0.2669 -0.2112 -0.1593 -0.0156 0.5078Selangor (Sel) High-rise 0.0024 0.2030 0.1476 0.1322 0.1503Selangor (Sel) Detached -0.4864 -0.4138 -0.4630 0.2737 0.0441Selangor (Sel) Semi-detached -0.1384 0.0306 -0.0574 0.0390 0.2628Sel - Terraced – Petaling -0.2845 -0.2406 -0.1370 -0.0456 0.5737Sel - Terraced – Kelang -0.0576 -0.0594 -0.0799 0.1553 0.0262Sel - Terraced – Gombak -0.0960 -0.0045 -0.1004 -0.0808 0.1018Sel - Terraced - Hulu Langat 0.0864 0.1797 0.1329 -0.0093 0.0793Sel - High-rise – Petaling 0.0500 0.1970 0.1516 0.1345 0.1476Sel - High-rise - Hulu Langat -0.1820 0.1073 0.0474 0.0296 0.0427Johor (Joh) All Houses -0.0600 0.0360 -0.0468 -0.2584 0.6391Johor (Joh) Terraced -0.0910 0.0541 0.0141 -0.3133 0.5605Johor (Joh) High-rise -0.0103 0.1073 0.0722 0.2761 0.2471Johor (Joh) Detached -0.0132 -0.0300 -0.2143 0.2559 0.0739Johor (Joh) Semi-detached 0.0430 -0.0332 -0.0784 -0.0797 0.2539Joh - Terraced - Johor Bahru / Kota Tinggi / Pontian -0.0741 0.0315 -0.0012 -0.2802 0.5436Joh - Terraced - Batu Pahat -0.1929 -0.0175 0.0340 0.0087 0.4515Joh - Terraced – Muar -0.2716 -0.0791 -0.2378 -0.1242 0.4500Joh - Terraced – Keluang -0.1407 0.0624 -0.0564 -0.1162 -0.1322Joh - Terraced – Segamat -0.0070 -0.0281 0.1037 -0.1863 0.2930Pulau Pinang (Pen) All Houses -0.3720 -0.1303 -0.2885 -0.1088 0.2435Pulau Pinang (Pen) Terraced 0.1174 0.0926 0.0800 -0.3933 0.1362Pulau Pinang (Pen) High-rise -0.2974 -0.1148 -0.2648 0.1725 0.1219Pulau Pinang (Pen) Detached -0.0879 -0.0493 -0.0478 -0.4809 -0.0032Pulau Pinang (Pen) Semi-detached -0.1978 -0.1289 0.0590 -0.2612 0.0717Pen - Terraced – Penang Island 0.0987 0.1591 0.1090 -0.4052 0.0951
KLCI KLSB KLPI MGS Malaysian All Houses
Pen - Terraced - Seberang Perai 0.0927 -0.0764 -0.0038 -0.0903 0.1144Pen - High-rise - Penang Island -0.2961 -0.1142 -0.2626 0.1721 0.1326Pen - High-rise - Seberang Perai -0.1217 -0.0672 -0.0921 -0.0610 -0.3063Negeri Sembilan (Sem) All Houses -0.0583 -0.1756 -0.0033 0.1403 0.0984Negeri Sembilan (Sem) Terraced -0.0572 -0.1535 0.0051 0.2553 -0.0062Negeri Sembilan (Sem) High-rise 0.0703 0.0277 0.2188 -0.0625 0.3147Negeri Sembilan (Sem) -0.1568 -0.1373 -0.2009 -0.1417 0.0062

23
Detached Negeri Sembilan (Sem) Semi-detached 0.0337 0.0295 0.0348 -0.0770 0.1127Sem - Terraced – Seremban -0.1762 -0.2283 -0.0492 -0.2180 0.0604Sem - Terraced – Port Dickson 0.0776 -0.0037 0.0284 0.3218 0.0090Sem - Terraced - Tampin & Others 0.0091 0.0296 0.0483 0.3284 -0.1298Perak (Per) All Houses 0.0812 -0.0726 0.1268 -0.1096 0.1655Perak (Per) Terraced 0.1774 -0.0717 0.1699 0.0046 0.1701Perak (Per) Detached 0.0540 0.1340 0.0202 -0.2975 -0.1044Perak (Per) Semi-detached -0.3229 -0.1496 -0.1001 -0.0005 0.1910Per - Terraced – Kinta 0.1178 -0.1858 0.0649 0.0791 0.2075Per - Terraced – Manjung 0.0813 0.2109 0.1066 -0.1179 -0.0595Per - Terraced – Batang Padang 0.2744 0.0720 0.2603 -0.1787 0.1234Per - Terraced - Hilir Perak 0.2273 0.3252 0.3571 -0.2519 0.2464Per - Terraced – Kuala Kangsar -0.3246 -0.1110 -0.1521 -0.0014 0.1674Melaka (Mel) All Houses -0.0417 -0.2119 -0.0266 0.3322 0.0541Melaka (Mel) Terraced -0.0752 -0.2496 -0.0394 0.2762 -0.0373Melaka (Mel) High-rise 0.2208 0.3003 0.1646 0.0278 0.0475Melaka (Mel) Detached -0.1079 -0.0169 -0.0933 0.1234 0.0466Melaka (Mel) Semi-detached 0.1468 0.0024 0.1114 0.2687 0.3142Mel - Terraced – Melaka Tengah -0.1288 -0.2878 -0.0723 0.2013 -0.0478Mel - Terraced - Alor Gajah-Jasin 0.2089 0.1194 0.1180 0.3573 0.0672Kedah (Ked) All Houses 0.2174 0.0432 0.3175 -0.0301 0.4996Kedah (Ked) Terraced 0.1777 -0.0102 0.2523 0.0972 0.3789Kedah (Ked) Detached -0.2975 -0.0020 -0.0129 -0.4158 0.3106Kedah (Ked) Semi-detached 0.2542 0.1980 0.3262 -0.1305 0.0950Ked - Terraced - Kota Setar 0.1747 0.0076 0.0932 0.0591 0.1770Ked - Terraced - Kuala Muda 0.0955 -0.0765 0.1901 0.1142 0.4197Ked - Terraced - Kubang Pasu -0.0463 0.1540 0.0981 0.0605 0.1472
KLCI KLSB KLPI MGS Malaysian All Houses
Ked - Terraced – Kulim 0.2581 0.0902 0.2538 0.0652 -0.0466Ked - Semi-detached - Kota Setar 0.1915 0.1678 0.2547 -0.2195 0.5096Ked - Semi-detached - Kuala Muda 0.3517 0.0855 0.3048 -0.0919 0.4064Ked - Semi-detached - Kulim -0.0054 -0.0064 0.1155 0.0004 0.2490Pahang (Pah) All Houses 0.3637 0.3676 0.5357 -0.2890 0.3546Pahang (Pah) Terraced 0.2754 0.1507 0.3633 -0.1188 0.1233Pahang (Pah) Detached 0.1785 0.3600 0.3849 -0.2737 0.4012Pahang (Pah) Semi-detached 0.1923 0.1007 0.2086 -0.2058 0.0380Pah - Terraced – Kuantan 0.3730 0.1489 0.3947 -0.0138 -0.0298Pah - Terraced – Temerloh -0.1475 -0.0942 0.0483 -0.1109 -0.0872Pah - Terraced - Bentong Lipis-Raub 0.0826 0.2061 0.1082 -0.3052 0.1125

24
Pah - Terraced – Jerantut -0.0342 -0.0464 -0.0456 0.0607 0.4240Terengganu (Ter) All Houses 0.0958 0.0987 0.0779 -0.2714 0.4089Terengganu (Ter) Terraced 0.0574 0.0528 -0.0879 0.0009 0.0050Terengganu (Ter) Detached 0.1056 -0.0116 0.0619 -0.1814 0.5163Terengganu (Ter) Semi-detached -0.0359 0.0462 0.0580 -0.2715 0.2682Ter - Terraced – Kuala Terengganu 0.1559 -0.0661 -0.0107 0.0771 0.0503Ter - Terraced – Kemaman 0.3033 0.2579 0.2664 -0.0054 0.0155Kelantan (Kel) All Houses 0.2326 0.1639 0.2100 0.0372 0.0689Kelantan (Kel) Terraced 0.1359 0.1227 0.1083 -0.0440 -0.0232Kelantan (Kel) Detached 0.1018 -0.1868 -0.0770 0.0605 0.2631Kelantan (Kel) Semi-detached -0.1944 -0.0463 -0.0411 -0.4952 0.2489Perlis (Per) All Houses 0.4246 0.3607 0.5704 -0.2663 0.0217Perlis (Per) Terraced 0.4755 0.3841 0.2548 0.0935 -0.3883Perlis (Per) Semi-detached -0.0821 0.0733 0.0854 0.0251 -0.1415Sabah (Sab) All Houses 0.3199 0.2218 0.1228 -0.1024 -0.0874Sabah (Sab) Terraced 0.2477 0.2474 0.1967 0.0557 0.0085Sabah (Sab) High-rise 0.1015 -0.0200 -0.1220 0.0700 0.2182Sabah (Sab) Detached 0.1844 -0.0363 -0.0523 -0.1924 -0.1966Sabah (Sab) Semi-detached 0.0567 0.1064 0.0609 -0.0878 0.0905Sab - Terraced – Kota 0.1592 0.0860 0.1027 0.2448 0.0504Sab - Terraced – Sandakan 0.1630 0.0011 0.0818 0.0876 -0.0326Sab - Terraced – Tawau 0.1850 0.3881 0.2023 -0.3819 -0.0716Sarawak (Sar) All Houses -0.0983 -0.0785 -0.2233 -0.1997 0.4378Sarawak (Sar) Terraced 0.0670 -0.2269 -0.2405 -0.1012 0.3107Sarawak (Sar) Detached -0.2446 -0.1009 -0.2067 -0.1331 0.4708Sarawak (Sar) Semi-detached -0.0645 0.1437 -0.0510 -0.1934 0.2280Sar - Terraced – Kuching 0.0401 -0.1967 -0.2110 -0.1675 0.3333Sar - Terraced – Miri 0.0168 -0.1214 -0.1328 -0.0370 0.2130Sar - Terraced – Sibu 0.0885 -0.1138 -0.1224 0.1255 0.0158

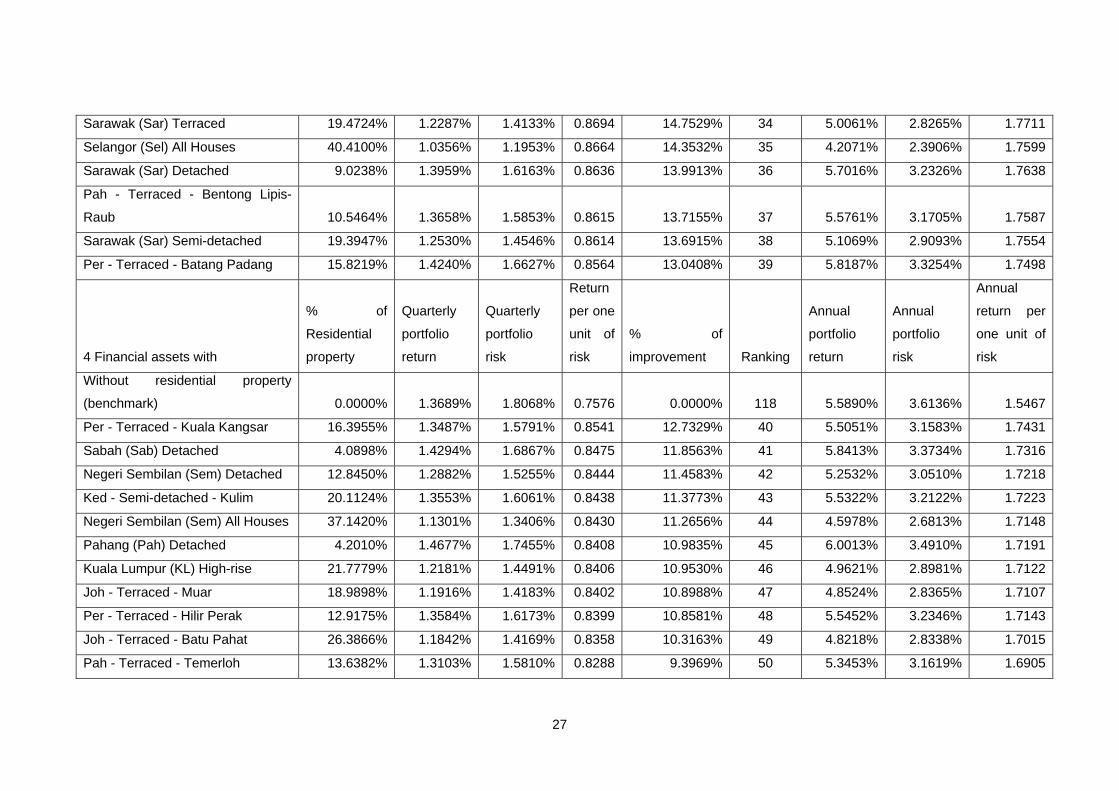
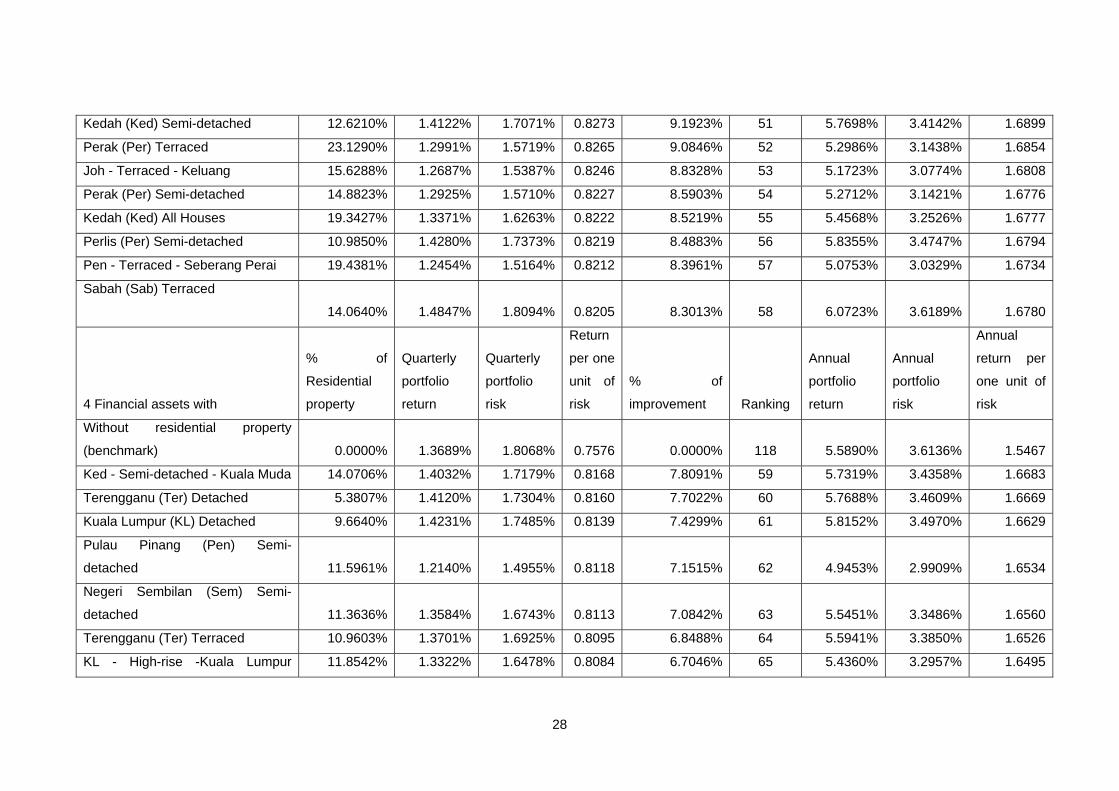
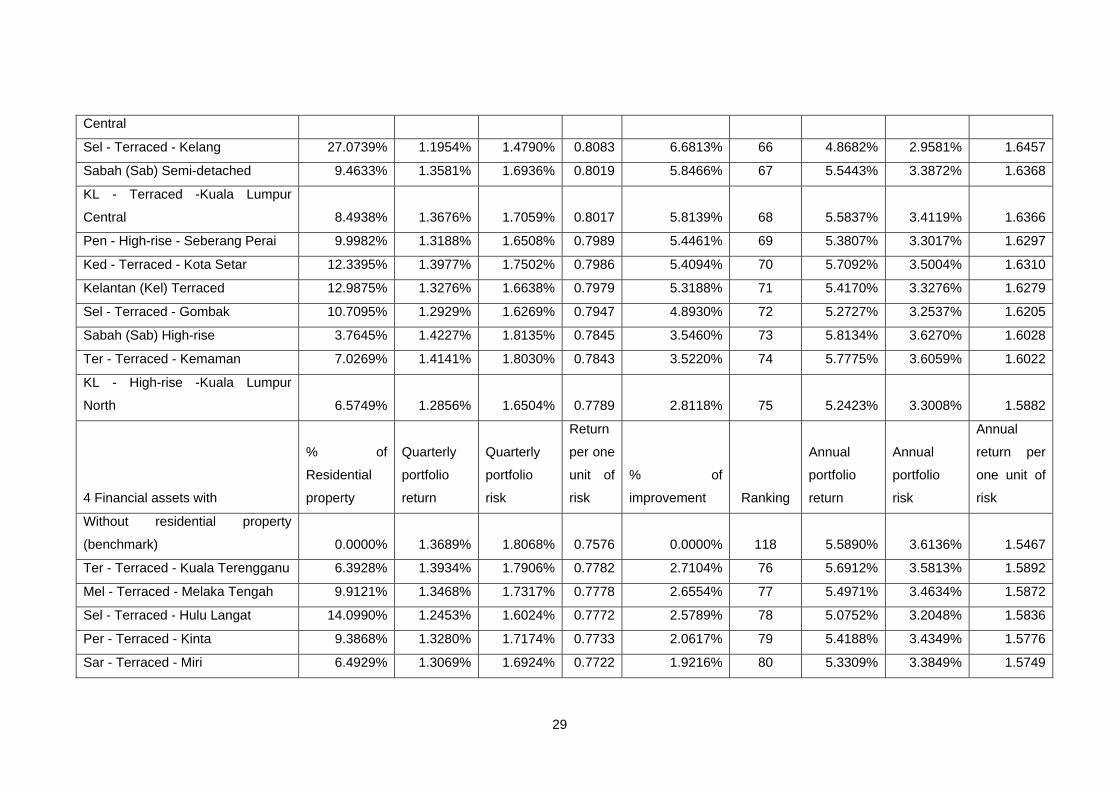
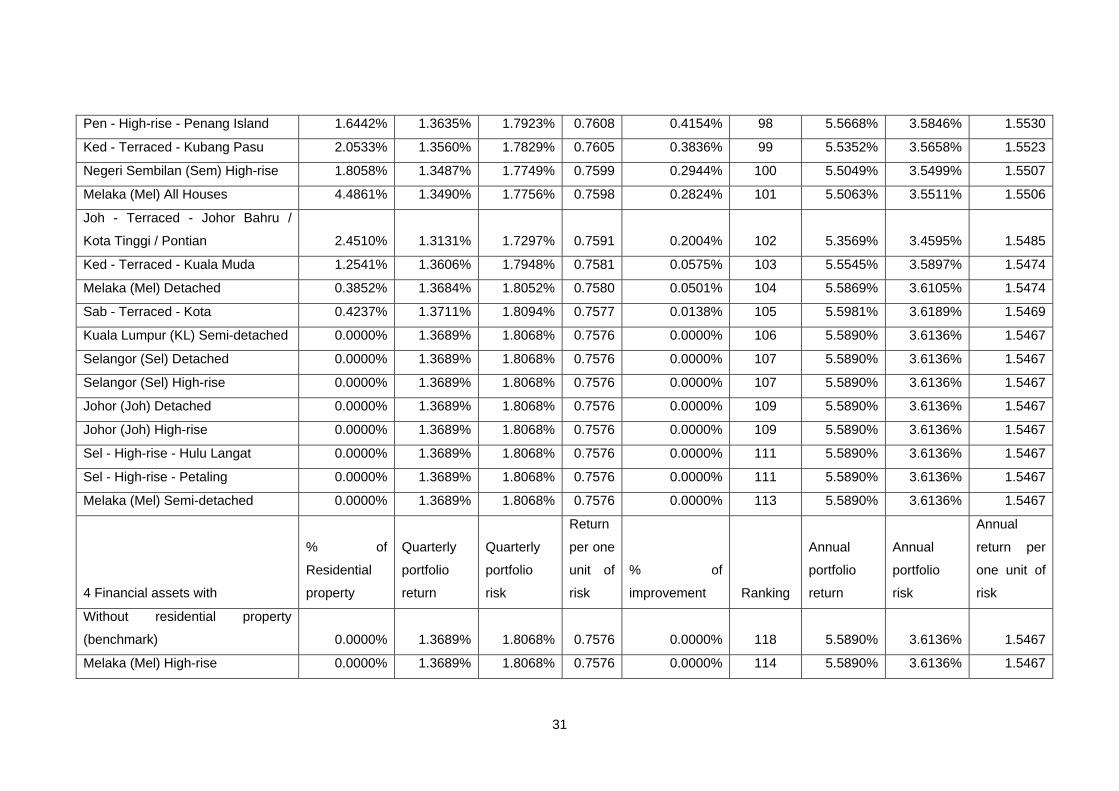
Table 6: Mixed asset portfolio performance – financial assets and residential properties (sorted by return per risk ratio)
4 Financial assets with
% of
Residential
property
Quarterly
portfolio
return
Quarterly
portfolio
risk
Return
per one
unit of
risk
% of
improvement Ranking
Annual
portfolio
return
Annual
portfolio
risk
Annual
return per
one unit of
risk
Without residential property
(benchmark) 0.0000% 1.3689% 1.8068% 0.7576 0.0000% 118 5.5890% 3.6136% 1.5467
Malaysian All Houses 66.6822% 0.9423% 0.7154% 1.3173 73.8719% 1 3.8230% 1.4307% 2.6721
Malaysian Detached 39.1369% 1.2829% 1.0529% 1.2185 60.8270% 2 5.2314% 2.1058% 2.4843
Malaysian Terraced 58.3676% 0.9440% 0.8525% 1.1074 46.1672% 3 3.8299% 1.7049% 2.2464
Kelantan (Kel) Semi-detached 16.1967% 1.3159% 1.2215% 1.0773 42.1974% 4 5.3685% 2.4429% 2.1976
Kedah (Ked) Detached 11.2855% 1.4355% 1.3564% 1.0583 39.6911% 5 5.8668% 2.7127% 2.1627
Sab - Terraced - Tawau 14.6760% 1.6498% 1.5871% 1.0395 37.2090% 6 6.7644% 3.1741% 2.1311
Pahang (Pah) All Houses 31.8972% 1.4637% 1.4331% 1.0214 34.8154% 7 5.9847% 2.8661% 2.0881
Pulau Pinang (Pen) Terraced 27.6899% 1.2509% 1.2301% 1.0169 34.2200% 8 5.0981% 2.4602% 2.0723
Pahang (Pah) Terraced 39.0216% 1.4008% 1.4268% 0.9817 29.5803% 9 5.7220% 2.8537% 2.0051
Pen - Terraced - Penang Island 16.9850% 1.3685% 1.4069% 0.9727 28.3921% 10 5.5875% 2.8138% 1.9858
Kuala Lumpur (KL) All Houses 40.4498% 1.2997% 1.3382% 0.9713 28.1980% 11 5.3011% 2.6763% 1.9807
Sem - Terraced - Seremban 36.2000% 1.1086% 1.1594% 0.9562 26.2029% 12 4.5087% 2.3189% 1.9443
Sarawak (Sar) All Houses 24.4057% 1.1978% 1.2787% 0.9367 23.6406% 13 4.8781% 2.5575% 1.9074
Kuala Lumpur (KL) Terraced 30.5826% 1.3390% 1.4348% 0.9332 23.1790% 14 5.4644% 2.8695% 1.9043
Terengganu (Ter) All Houses 19.0856% 1.3943% 1.4961% 0.9320 23.0164% 15 5.6951% 2.9921% 1.9034
Malaysian Semi-detached 35.5766% 1.1806% 1.2670% 0.9317 22.9798% 16 4.8065% 2.5341% 1.8967
KL - Terraced -Kuala Lumpur 29.9423% 1.3980% 1.5044% 0.9292 22.6486% 17 5.7102% 3.0089% 1.8978

26
North
Perak (Per) All Houses 33.9821% 1.2813% 1.3838% 0.9260 22.2183% 18 5.2246% 2.7675% 1.8878
Per - Terraced - Manjung 23.3958% 1.4664% 1.5907% 0.9218 21.6708% 19 5.9958% 3.1815% 1.8846
Selangor (Sel) Terraced 43.7491% 1.0387% 1.1284% 0.9205 21.4992% 20 4.2200% 2.2568% 1.8699
4 Financial assets with
% of
Residential
property
Quarterly
portfolio
return
Quarterly
portfolio
risk
Return
per one
unit of
risk
% of
improvement Ranking
Annual
portfolio
return
Annual
portfolio
risk
Annual
return per
one unit of
risk
Without residential property
(benchmark) 0.0000% 1.3689% 1.8068% 0.7576 0.0000% 118 5.5890% 3.6136% 1.5467
Pulau Pinang (Pen) Detached 7.2366% 1.2342% 1.3530% 0.9122 20.4073% 21 5.0291% 2.7060% 1.8585
Pahang (Pah) Semi-detached 16.3519% 1.5271% 1.6746% 0.9119 20.3655% 22 6.2498% 3.3492% 1.8661
Pulau Pinang (Pen) All Houses 27.2900% 1.1682% 1.2911% 0.9048 19.4286% 23 4.7553% 2.5821% 1.8416
Sel - Terraced - Petaling 31.0081% 1.1955% 1.3289% 0.8996 18.7425% 24 4.8686% 2.6578% 1.8318
Perlis (Per) All Houses 19.0738% 1.4532% 1.6189% 0.8976 18.4782% 25 5.9406% 3.2378% 1.8348
KL - Terraced -Kuala Lumpur
South 28.8985% 1.3009% 1.4543% 0.8946 18.0737% 26 5.3061% 2.9085% 1.8243
Sabah (Sab) All Houses 22.5833% 1.4376% 1.6073% 0.8944 18.0541% 27 5.8757% 3.2147% 1.8278
Perak (Per) Detached 8.4455% 1.4220% 1.5907% 0.8939 17.9888% 28 5.8105% 3.1815% 1.8263
Ked - Semi-detached - Kota Setar 16.0399% 1.4641% 1.6402% 0.8926 17.8167% 29 5.9862% 3.2804% 1.8248
Pah - Terraced - Kuantan 29.1062% 1.4880% 1.6674% 0.8924 17.7869% 30 6.0862% 3.3349% 1.8250
Sar - Terraced - Kuching 14.6993% 1.2885% 1.4563% 0.8848 16.7864% 31 5.2545% 2.9125% 1.8041
Joh - Terraced - Segamat 25.3714% 1.2436% 1.4078% 0.8834 16.5987% 32 5.0681% 2.8156% 1.8000
Terengganu (Ter) Semi-detached 9.5535% 1.4042% 1.6061% 0.8743 15.3961% 33 5.7360% 3.2121% 1.7857
27
Sarawak (Sar) Terraced 19.4724% 1.2287% 1.4133% 0.8694 14.7529% 34 5.0061% 2.8265% 1.7711
Selangor (Sel) All Houses 40.4100% 1.0356% 1.1953% 0.8664 14.3532% 35 4.2071% 2.3906% 1.7599
Sarawak (Sar) Detached 9.0238% 1.3959% 1.6163% 0.8636 13.9913% 36 5.7016% 3.2326% 1.7638
Pah - Terraced - Bentong Lipis-
Raub 10.5464% 1.3658% 1.5853% 0.8615 13.7155% 37 5.5761% 3.1705% 1.7587
Sarawak (Sar) Semi-detached 19.3947% 1.2530% 1.4546% 0.8614 13.6915% 38 5.1069% 2.9093% 1.7554
Per - Terraced - Batang Padang 15.8219% 1.4240% 1.6627% 0.8564 13.0408% 39 5.8187% 3.3254% 1.7498
4 Financial assets with
% of
Residential
property
Quarterly
portfolio
return
Quarterly
portfolio
risk
Return
per one
unit of
risk
% of
improvement Ranking
Annual
portfolio
return
Annual
portfolio
risk
Annual
return per
one unit of
risk
Without residential property
(benchmark) 0.0000% 1.3689% 1.8068% 0.7576 0.0000% 118 5.5890% 3.6136% 1.5467
Per - Terraced - Kuala Kangsar 16.3955% 1.3487% 1.5791% 0.8541 12.7329% 40 5.5051% 3.1583% 1.7431
Sabah (Sab) Detached 4.0898% 1.4294% 1.6867% 0.8475 11.8563% 41 5.8413% 3.3734% 1.7316
Negeri Sembilan (Sem) Detached 12.8450% 1.2882% 1.5255% 0.8444 11.4583% 42 5.2532% 3.0510% 1.7218
Ked - Semi-detached - Kulim 20.1124% 1.3553% 1.6061% 0.8438 11.3773% 43 5.5322% 3.2122% 1.7223
Negeri Sembilan (Sem) All Houses 37.1420% 1.1301% 1.3406% 0.8430 11.2656% 44 4.5978% 2.6813% 1.7148
Pahang (Pah) Detached 4.2010% 1.4677% 1.7455% 0.8408 10.9835% 45 6.0013% 3.4910% 1.7191
Kuala Lumpur (KL) High-rise 21.7779% 1.2181% 1.4491% 0.8406 10.9530% 46 4.9621% 2.8981% 1.7122
Joh - Terraced - Muar 18.9898% 1.1916% 1.4183% 0.8402 10.8988% 47 4.8524% 2.8365% 1.7107
Per - Terraced - Hilir Perak 12.9175% 1.3584% 1.6173% 0.8399 10.8581% 48 5.5452% 3.2346% 1.7143
Joh - Terraced - Batu Pahat 26.3866% 1.1842% 1.4169% 0.8358 10.3163% 49 4.8218% 2.8338% 1.7015
Pah - Terraced - Temerloh 13.6382% 1.3103% 1.5810% 0.8288 9.3969% 50 5.3453% 3.1619% 1.6905
28
Kedah (Ked) Semi-detached 12.6210% 1.4122% 1.7071% 0.8273 9.1923% 51 5.7698% 3.4142% 1.6899
Perak (Per) Terraced 23.1290% 1.2991% 1.5719% 0.8265 9.0846% 52 5.2986% 3.1438% 1.6854
Joh - Terraced - Keluang 15.6288% 1.2687% 1.5387% 0.8246 8.8328% 53 5.1723% 3.0774% 1.6808
Perak (Per) Semi-detached 14.8823% 1.2925% 1.5710% 0.8227 8.5903% 54 5.2712% 3.1421% 1.6776
Kedah (Ked) All Houses 19.3427% 1.3371% 1.6263% 0.8222 8.5219% 55 5.4568% 3.2526% 1.6777
Perlis (Per) Semi-detached 10.9850% 1.4280% 1.7373% 0.8219 8.4883% 56 5.8355% 3.4747% 1.6794
Pen - Terraced - Seberang Perai 19.4381% 1.2454% 1.5164% 0.8212 8.3961% 57 5.0753% 3.0329% 1.6734
Sabah (Sab) Terraced
14.0640% 1.4847% 1.8094% 0.8205 8.3013% 58 6.0723% 3.6189% 1.6780
4 Financial assets with
% of
Residential
property
Quarterly
portfolio
return
Quarterly
portfolio
risk
Return
per one
unit of
risk
% of
improvement Ranking
Annual
portfolio
return
Annual
portfolio
risk
Annual
return per
one unit of
risk
Without residential property
(benchmark) 0.0000% 1.3689% 1.8068% 0.7576 0.0000% 118 5.5890% 3.6136% 1.5467
Ked - Semi-detached - Kuala Muda 14.0706% 1.4032% 1.7179% 0.8168 7.8091% 59 5.7319% 3.4358% 1.6683
Terengganu (Ter) Detached 5.3807% 1.4120% 1.7304% 0.8160 7.7022% 60 5.7688% 3.4609% 1.6669
Kuala Lumpur (KL) Detached 9.6640% 1.4231% 1.7485% 0.8139 7.4299% 61 5.8152% 3.4970% 1.6629
Pulau Pinang (Pen) Semi-
detached 11.5961% 1.2140% 1.4955% 0.8118 7.1515% 62 4.9453% 2.9909% 1.6534
Negeri Sembilan (Sem) Semi-
detached 11.3636% 1.3584% 1.6743% 0.8113 7.0842% 63 5.5451% 3.3486% 1.6560
Terengganu (Ter) Terraced 10.9603% 1.3701% 1.6925% 0.8095 6.8488% 64 5.5941% 3.3850% 1.6526
KL - High-rise -Kuala Lumpur 11.8542% 1.3322% 1.6478% 0.8084 6.7046% 65 5.4360% 3.2957% 1.6495
29
Central
Sel - Terraced - Kelang 27.0739% 1.1954% 1.4790% 0.8083 6.6813% 66 4.8682% 2.9581% 1.6457
Sabah (Sab) Semi-detached 9.4633% 1.3581% 1.6936% 0.8019 5.8466% 67 5.5443% 3.3872% 1.6368
KL - Terraced -Kuala Lumpur
Central 8.4938% 1.3676% 1.7059% 0.8017 5.8139% 68 5.5837% 3.4119% 1.6366
Pen - High-rise - Seberang Perai 9.9982% 1.3188% 1.6508% 0.7989 5.4461% 69 5.3807% 3.3017% 1.6297
Ked - Terraced - Kota Setar 12.3395% 1.3977% 1.7502% 0.7986 5.4094% 70 5.7092% 3.5004% 1.6310
Kelantan (Kel) Terraced 12.9875% 1.3276% 1.6638% 0.7979 5.3188% 71 5.4170% 3.3276% 1.6279
Sel - Terraced - Gombak 10.7095% 1.2929% 1.6269% 0.7947 4.8930% 72 5.2727% 3.2537% 1.6205
Sabah (Sab) High-rise 3.7645% 1.4227% 1.8135% 0.7845 3.5460% 73 5.8134% 3.6270% 1.6028
Ter - Terraced - Kemaman 7.0269% 1.4141% 1.8030% 0.7843 3.5220% 74 5.7775% 3.6059% 1.6022
KL - High-rise -Kuala Lumpur
North 6.5749% 1.2856% 1.6504% 0.7789 2.8118% 75 5.2423% 3.3008% 1.5882
4 Financial assets with
% of
Residential
property
Quarterly
portfolio
return
Quarterly
portfolio
risk
Return
per one
unit of
risk
% of
improvement Ranking
Annual
portfolio
return
Annual
portfolio
risk
Annual
return per
one unit of
risk
Without residential property
(benchmark) 0.0000% 1.3689% 1.8068% 0.7576 0.0000% 118 5.5890% 3.6136% 1.5467
Ter - Terraced - Kuala Terengganu 6.3928% 1.3934% 1.7906% 0.7782 2.7104% 76 5.6912% 3.5813% 1.5892
Mel - Terraced - Melaka Tengah 9.9121% 1.3468% 1.7317% 0.7778 2.6554% 77 5.4971% 3.4634% 1.5872
Sel - Terraced - Hulu Langat 14.0990% 1.2453% 1.6024% 0.7772 2.5789% 78 5.0752% 3.2048% 1.5836
Per - Terraced - Kinta 9.3868% 1.3280% 1.7174% 0.7733 2.0617% 79 5.4188% 3.4349% 1.5776
Sar - Terraced - Miri 6.4929% 1.3069% 1.6924% 0.7722 1.9216% 80 5.3309% 3.3849% 1.5749

30
Ked - Terraced - Kulim 6.2486% 1.3776% 1.7866% 0.7711 1.7744% 81 5.6253% 3.5732% 1.5743
Negeri Sembilan (Sem) Terraced 15.3276% 1.2565% 1.6301% 0.7708 1.7398% 82 5.1215% 3.2602% 1.5709
Selangor (Sel) Semi-detached 3.7868% 1.3578% 1.7616% 0.7708 1.7317% 83 5.5427% 3.5232% 1.5732
Johor (Joh) Terraced 8.5697% 1.2094% 1.5706% 0.7700 1.6366% 84 4.9260% 3.1412% 1.5682
Pah - Terraced - Jerantut 5.3469% 1.3477% 1.7514% 0.7695 1.5634% 85 5.5007% 3.5028% 1.5703
Kedah (Ked) Terraced 7.4585% 1.3426% 1.7478% 0.7682 1.3887% 86 5.4794% 3.4956% 1.5675
Johor (Joh) Semi-detached 2.8642% 1.3470% 1.7536% 0.7681 1.3851% 87 5.4979% 3.5073% 1.5676
Johor (Joh) All Houses 8.4424% 1.2268% 1.5980% 0.7677 1.3314% 88 4.9983% 3.1960% 1.5639
Kelantan (Kel) All Houses 6.7977% 1.3389% 1.7451% 0.7672 1.2672% 89 5.4642% 3.4903% 1.5656
Sab - Terraced - Sandakan 3.2822% 1.3917% 1.8148% 0.7668 1.2148% 90 5.6839% 3.6296% 1.5660
Melaka (Mel) Terraced 8.0497% 1.3422% 1.7507% 0.7667 1.1918% 91 5.4778% 3.5014% 1.5645
KL - High-rise -Kuala Lumpur
South 7.5045% 1.3024% 1.7002% 0.7660 1.1105% 92 5.3124% 3.4004% 1.5623
Perlis (Per) Terraced 4.0403% 1.3972% 1.8294% 0.7638 0.8087% 93 5.7071% 3.6588% 1.5598
Malaysian High-rise 5.1722% 1.3251% 1.7386% 0.7622 0.5966% 94 5.4066% 3.4772% 1.5549
4 Financial assets with
% of
Residential
property
Quarterly
portfolio
return
Quarterly
portfolio
risk
Return
per one
unit of
risk
% of
improvement Ranking
Annual
portfolio
return
Annual
portfolio
risk
Annual
return per
one unit of
risk
Without residential property
(benchmark) 0.0000% 1.3689% 1.8068% 0.7576 0.0000% 118 5.5890% 3.6136% 1.5467
Kelantan (Kel) Detached 0.8984% 1.3879% 1.8215% 0.7620 0.5722% 95 5.6684% 3.6430% 1.5560
Pulau Pinang (Pen) High-rise 1.8244% 1.3622% 1.7899% 0.7610 0.4501% 96 5.5612% 3.5799% 1.5535
Sar - Terraced - Sibu 4.0009% 1.3466% 1.7697% 0.7609 0.4335% 97 5.4960% 3.5393% 1.5528
31
Pen - High-rise - Penang Island 1.6442% 1.3635% 1.7923% 0.7608 0.4154% 98 5.5668% 3.5846% 1.5530
Ked - Terraced - Kubang Pasu 2.0533% 1.3560% 1.7829% 0.7605 0.3836% 99 5.5352% 3.5658% 1.5523
Negeri Sembilan (Sem) High-rise 1.8058% 1.3487% 1.7749% 0.7599 0.2944% 100 5.5049% 3.5499% 1.5507
Melaka (Mel) All Houses 4.4861% 1.3490% 1.7756% 0.7598 0.2824% 101 5.5063% 3.5511% 1.5506
Joh - Terraced - Johor Bahru /
Kota Tinggi / Pontian 2.4510% 1.3131% 1.7297% 0.7591 0.2004% 102 5.3569% 3.4595% 1.5485
Ked - Terraced - Kuala Muda 1.2541% 1.3606% 1.7948% 0.7581 0.0575% 103 5.5545% 3.5897% 1.5474
Melaka (Mel) Detached 0.3852% 1.3684% 1.8052% 0.7580 0.0501% 104 5.5869% 3.6105% 1.5474
Sab - Terraced - Kota 0.4237% 1.3711% 1.8094% 0.7577 0.0138% 105 5.5981% 3.6189% 1.5469
Kuala Lumpur (KL) Semi-detached 0.0000% 1.3689% 1.8068% 0.7576 0.0000% 106 5.5890% 3.6136% 1.5467
Selangor (Sel) Detached 0.0000% 1.3689% 1.8068% 0.7576 0.0000% 107 5.5890% 3.6136% 1.5467
Selangor (Sel) High-rise 0.0000% 1.3689% 1.8068% 0.7576 0.0000% 107 5.5890% 3.6136% 1.5467
Johor (Joh) Detached 0.0000% 1.3689% 1.8068% 0.7576 0.0000% 109 5.5890% 3.6136% 1.5467
Johor (Joh) High-rise 0.0000% 1.3689% 1.8068% 0.7576 0.0000% 109 5.5890% 3.6136% 1.5467
Sel - High-rise - Hulu Langat 0.0000% 1.3689% 1.8068% 0.7576 0.0000% 111 5.5890% 3.6136% 1.5467
Sel - High-rise - Petaling 0.0000% 1.3689% 1.8068% 0.7576 0.0000% 111 5.5890% 3.6136% 1.5467
Melaka (Mel) Semi-detached 0.0000% 1.3689% 1.8068% 0.7576 0.0000% 113 5.5890% 3.6136% 1.5467
4 Financial assets with
% of
Residential
property
Quarterly
portfolio
return
Quarterly
portfolio
risk
Return
per one
unit of
risk
% of
improvement Ranking
Annual
portfolio
return
Annual
portfolio
risk
Annual
return per
one unit of
risk
Without residential property
(benchmark) 0.0000% 1.3689% 1.8068% 0.7576 0.0000% 118 5.5890% 3.6136% 1.5467
Melaka (Mel) High-rise 0.0000% 1.3689% 1.8068% 0.7576 0.0000% 114 5.5890% 3.6136% 1.5467
32
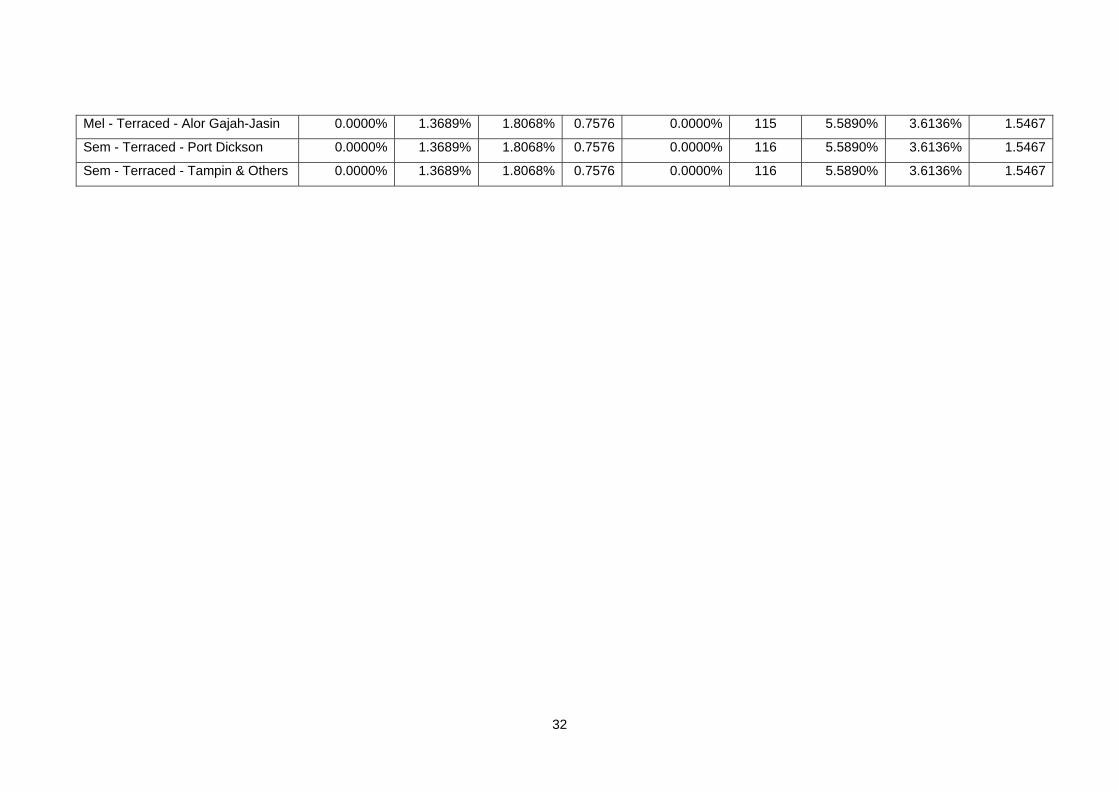
Mel - Terraced - Alor Gajah-Jasin 0.0000% 1.3689% 1.8068% 0.7576 0.0000% 115 5.5890% 3.6136% 1.5467
Sem - Terraced - Port Dickson 0.0000% 1.3689% 1.8068% 0.7576 0.0000% 116 5.5890% 3.6136% 1.5467
Sem - Terraced - Tampin & Others 0.0000% 1.3689% 1.8068% 0.7576 0.0000% 116 5.5890% 3.6136% 1.5467
33
Table 7: Mixed asset portfolio performance – financial assets with two residential properties (sorted by return per risk ratio)
4 Financial assets and terraced
houses in Tawau, Sabah state
with
% of terraced
houses in
Tawau, Sabah
state
% of
Residential
property
Quarterly
portfolio
return
Quarterly
portfolio
risk
Return
per one
unit of
risk
% of
Improvement Ranking
Annual
portfolio
return
Annual
portfolio
risk
Without residential property
(benchmark) 14.6760% 0.0000% 1.6498% 1.5871% 1.0395 0.0000% 113 6.7644% 3.1741%
Perak (Per) All Houses 12.4010% 35.5509% 1.5261% 1.0614% 1.4379 38.3198% 1 6.2457% 2.1227%
Kelantan (Kel) Semi-detached 9.5908% 13.8416% 1.4970% 1.0513% 1.4240 36.9853% 2 6.1239% 2.1025%
Pahang (Pah) All Houses 11.3867% 26.9030% 1.6574% 1.1644% 1.4233 36.9196% 3 6.7961% 2.3289%
Pahang (Pah) Semi-detached 14.3157% 16.1030% 1.8032% 1.3316% 1.3542 30.2709% 4 7.4104% 2.6631%
Malaysian Detached 5.9179% 31.9505% 1.4076% 1.0546% 1.3347 28.3956% 5 5.7504% 2.1092%
Joh - Terraced - Segamat 12.4012% 26.8765% 1.4887% 1.1224% 1.3263 27.5847% 6 6.0889% 2.2448%
Pahang (Pah) Terraced 10.9669% 31.4658% 1.6015% 1.2316% 1.3003 25.0891% 7 6.5614% 2.4631%
Perak (Per) Semi-detached 14.3252% 19.7950% 1.5589% 1.2129% 1.2853 23.6428% 8 6.3831% 2.4258%
KL - Terraced -Kuala Lumpur
South 12.3950% 28.1150% 1.5551% 1.2130% 1.2820 23.3266% 9 6.3670% 2.4260%
Kedah (Ked) Detached 9.4308% 8.6810% 1.6121% 1.2719% 1.2675 21.9245% 10 6.6060% 2.5439%
Pulau Pinang (Pen) All Houses 10.7067% 25.0249% 1.3768% 1.0876% 1.2659 21.7786% 11 5.6220% 2.1752%
Perak (Per) Terraced 13.7614% 28.0048% 1.5530% 1.2309% 1.2617 21.3700% 12 6.3582% 2.4618%
Ked - Semi-detached - Kulim 14.1391% 22.5513% 1.6414% 1.3106% 1.2525 20.4837% 13 6.7292% 2.6211%
Kedah (Ked) All Houses 14.2224% 23.5668% 1.6048% 1.2824% 1.2514 20.3798% 14 6.5755% 2.5649%
Pulau Pinang (Pen) Terraced 9.0013% 21.2231% 1.4603% 1.1807% 1.2368 18.9776% 15 5.9703% 2.3613%
Pah - Terraced - Kuantan 12.9361% 23.1401% 1.7023% 1.3947% 1.2205 17.4123% 16 6.9849% 2.7894%
34
Sem - Terraced - Seremban 9.2830% 29.2842% 1.3498% 1.1095% 1.2166 17.0320% 17 5.5096% 2.2190%
Sarawak (Sar) All Houses 10.0999% 19.4753% 1.4352% 1.1829% 1.2133 16.7145% 18 5.8654% 2.3657%
Per - Terraced - Manjung 12.2832% 18.5574% 1.6871% 1.3949% 1.2095 16.3501% 19 6.9213% 2.7898%
Sar - Terraced - Kuching 11.8258% 12.3133% 1.5468% 1.2867% 1.2021 15.6424% 20 6.3321% 2.5733%
4 Financial assets and terraced
houses in Tawau, Sabah state
with
% of terraced
houses in
Tawau, Sabah
state
% of
Residential
property
Quarterly
portfolio
return
Quarterly
portfolio
risk
Return
per one
unit of
risk
% of
Improvement Ranking
Annual
portfolio
return
Annual
portfolio
risk
Without residential property
(benchmark) 14.6760% 0.0000% 1.6498% 1.5871% 1.0395 0.0000% 113 6.7644% 3.1741%
Negeri Sembilan (Sem) All
Houses 11.3541% 37.5606% 1.3586% 1.1301% 1.2021 15.6411% 21 5.5461% 2.2603%
Selangor (Sel) Terraced 9.2470% 36.1401% 1.2812% 1.0738% 1.1932 14.7778% 22 5.2242% 2.1476%
Pah - Terraced - Temerloh 13.4168% 14.1795% 1.5812% 1.3371% 1.1825 13.7534% 23 6.4762% 2.6742%
Pulau Pinang (Pen) Detached 10.6061% 5.6235% 1.4571% 1.2352% 1.1796 13.4741% 24 5.9570% 2.4705%
Pen - Terraced - Seberang Perai 12.5853% 20.0084% 1.4823% 1.2624% 1.1742 12.9537% 25 6.0625% 2.5249%
Sel - Terraced - Petaling 10.6799% 24.5221% 1.4492% 1.2417% 1.1672 12.2766% 26 5.9241% 2.4833%
Kedah (Ked) Terraced 15.7911% 18.0367% 1.6177% 1.3881% 1.1654 12.1034% 27 6.6294% 2.7763%
Sel - Terraced - Kelang 12.3695% 29.7582% 1.4154% 1.2204% 1.1598 11.5659% 28 5.7828% 2.4408%
Sarawak (Sar) Terraced 11.4392% 15.2443% 1.4937% 1.2920% 1.1561 11.2127% 29 6.1100% 2.5840%
Per - Terraced - Hilir Perak 13.2408% 11.5553% 1.6272% 1.4084% 1.1554 11.1480% 30 6.6696% 2.8167%
Kuala Lumpur (KL) All Houses 9.6877% 27.9407% 1.5183% 1.3168% 1.1530 10.9186% 31 6.2131% 2.6336%
Ked - Semi-detached - Kuala
Muda 14.0083% 13.3743% 1.6709% 1.4518% 1.1509 10.7112% 32 6.8530% 2.9037%

35
Per - Terraced - Kinta 15.0455% 17.5157% 1.5877% 1.3817% 1.1491 10.5433% 33 6.5038% 2.7633%
Pen - Terraced - Penang Island 9.8527% 11.2037% 1.5535% 1.3541% 1.1472 10.3595% 34 6.3603% 2.7083%
Kedah (Ked) Semi-detached 13.9031% 11.3989% 1.6860% 1.4741% 1.1438 10.0298% 35 6.9166% 2.9481%
Mel - Terraced - Melaka Tengah 15.2976% 16.2953% 1.6440% 1.4396% 1.1420 9.8549% 36 6.7402% 2.8793%
Terengganu (Ter) All Houses 10.8793% 12.5406% 1.5888% 1.3950% 1.1389 9.5571% 37 6.5083% 2.7901%
Ter - Terraced - Kemaman 15.4532% 9.2756% 1.7309% 1.5276% 1.1331 8.9985% 38 7.1054% 3.0552%
4 Financial assets and terraced
houses in Tawau, Sabah state
with
% of terraced
houses in
Tawau, Sabah
state
% of
Residential
property
Quarterly
portfolio
return
Quarterly
portfolio
risk
Return
per one
unit of
risk
% of
Improvement Ranking
Annual
portfolio
return
Annual
portfolio
risk
Without residential property
(benchmark) 14.6760% 0.0000% 1.6498% 1.5871% 1.0395 0.0000% 113 6.7644% 3.1741%
Sarawak (Sar) Semi-detached 11.5728% 14.6914% 1.4916% 1.3171% 1.1325 8.9461% 39 6.1014% 2.6342%
Malaysian Semi-detached 9.7398% 24.2637% 1.4230% 1.2568% 1.1322 8.9177% 40 5.8148% 2.5137%
Per - Terraced - Batang Padang 12.9840% 11.7300% 1.6706% 1.4794% 1.1292 8.6277% 41 6.8519% 2.9589%
Terengganu (Ter) Detached 13.9229% 4.8411% 1.6653% 1.4768% 1.1276 8.4759% 42 6.8294% 2.9536%
Perlis (Per) All Houses 11.9283% 12.0173% 1.6543% 1.4674% 1.1273 8.4471% 43 6.7830% 2.9348%
Joh - Terraced - Batu Pahat 11.7188% 21.8507% 1.4545% 1.2944% 1.1237 8.0950% 44 5.9464% 2.5889%
Ked - Semi-detached - Kota
Setar 12.2545% 10.4620% 1.6804% 1.4982% 1.1216 7.8985% 45 6.8931% 2.9964%
Sarawak (Sar) Detached 12.4021% 6.2590% 1.6142% 1.4408% 1.1204 7.7757% 46 6.6149% 2.8816%
Kuala Lumpur (KL) Terraced 10.5979% 19.2112% 1.5658% 1.4012% 1.1175 7.4979% 47 6.4120% 2.8024%
Pahang (Pah) Detached 13.6599% 3.0901% 1.7197% 1.5439% 1.1139 7.1486% 48 7.0581% 3.0878%
Ked - Terraced - Kuala Muda 16.1527% 12.0468% 1.6182% 1.4548% 1.1123 7.0039% 49 6.6318% 2.9096%

36
Ked - Terraced - Kulim 15.4811% 10.4388% 1.6923% 1.5234% 1.1109 6.8607% 50 6.9430% 3.0468%
Ked - Terraced - Kota Setar 14.3170% 11.9293% 1.6724% 1.5057% 1.1107 6.8484% 51 6.8592% 3.0113%
Perak (Per) Detached 11.7634% 5.1305% 1.6209% 1.4613% 1.1092 6.7050% 52 6.6430% 2.9226%
Melaka (Mel) Terraced 15.1858% 16.3252% 1.6239% 1.4651% 1.1084 6.6266% 53 6.6556% 2.9301%
KL - Terraced -Kuala Lumpur
North 10.9444% 17.5129% 1.6087% 1.4565% 1.1045 6.2451% 54 6.5917% 2.9131%
Negeri Sembilan (Sem) Semi-
detached 13.4612% 9.2792% 1.6138% 1.4643% 1.1021 6.0159% 55 6.6130% 2.9286%
Sabah (Sab) Detached 12.9650% 2.5793% 1.6675% 1.5132% 1.1020 6.0048% 56 6.8388% 3.0265%
Negeri Sembilan (Sem)
Detached 12.0893% 8.7688% 1.5351% 1.3943% 1.1009 5.9040% 57 6.2831% 2.7887%
4 Financial assets and terraced
houses in Tawau, Sabah state
with
% of terraced
houses in
Tawau, Sabah
state
% of
Residential
property
Quarterly
portfolio
return
Quarterly
portfolio
risk
Return
per one
unit of
risk
% of
Improvement Ranking
Annual
portfolio
return
Annual
portfolio
risk
Without residential property
(benchmark) 14.6760% 0.0000% 1.6498% 1.5871% 1.0395 0.0000% 113 6.7644% 3.1741%
Melaka (Mel) All Houses 15.4373% 17.5771% 1.6054% 1.4588% 1.1005 5.8626% 58 6.5777% 2.9175%
Kelantan (Kel) All Houses 14.8736% 12.3529% 1.6154% 1.4696% 1.0992 5.7408% 59 6.6199% 2.9392%
Pen - High-rise - Seberang Perai 13.3940% 8.8016% 1.5733% 1.4348% 1.0965 5.4840% 60 6.4434% 2.8696%
Joh - Terraced - Keluang 12.4766% 10.9767% 1.5398% 1.4121% 1.0904 4.8966% 61 6.3029% 2.8242%
KL - High-rise -Kuala Lumpur
South 13.6694% 12.3629% 1.5081% 1.3861% 1.0880 4.6599% 62 6.1701% 2.7722%
Ter - Terraced - Kuala 14.4869% 6.4259% 1.6616% 1.5397% 1.0792 3.8120% 63 6.8140% 3.0795%

37
Terengganu
Negeri Sembilan (Sem) Terraced 13.3658% 18.4423% 1.5058% 1.4018% 1.0742 3.3306% 64 6.1604% 2.8036%
Pulau Pinang (Pen) High-rise 15.0547% 4.1946% 1.6394% 1.5286% 1.0725 3.1712% 65 6.7206% 3.0571%
Pen - High-rise - Penang Island 15.0779% 3.8575% 1.6430% 1.5340% 1.0711 3.0348% 66 6.7359% 3.0680%
Selangor (Sel) All Houses 10.6562% 22.6135% 1.3993% 1.3065% 1.0710 3.0283% 67 5.7159% 2.6131%
Joh - Terraced - Muar 11.8217% 10.2670% 1.4924% 1.3958% 1.0692 2.8524% 68 6.1046% 2.7916%
Kuala Lumpur (KL) High-rise 12.0544% 11.6007% 1.5233% 1.4257% 1.0684 2.7798% 69 6.2338% 2.8514%
Negeri Sembilan (Sem) High-rise 14.8237% 4.8277% 1.6167% 1.5134% 1.0682 2.7615% 70 6.6254% 3.0269%
Kuala Lumpur (KL) Detached 13.7563% 5.4925% 1.6798% 1.5732% 1.0677 2.7129% 71 6.8903% 3.1464%
Kelantan (Kel) Terraced 13.4401% 8.4917% 1.5991% 1.4978% 1.0676 2.7021% 72 6.5514% 2.9956%
Pah - Terraced - Jerantut 14.3466% 6.0740% 1.6180% 1.5159% 1.0674 2.6777% 73 6.6308% 3.0317%
Sel - Terraced - Hulu Langat 13.2578% 12.6486% 1.5257% 1.4313% 1.0660 2.5459% 74 6.2441% 2.8625%
Malaysian High-rise 14.2164% 9.0775% 1.5718% 1.4751% 1.0656 2.5051% 75 6.4371% 2.9502%
4 Financial assets and terraced
houses in Tawau, Sabah state
with
% of terraced
houses in
Tawau, Sabah
state
% of
Residential
property
Quarterly
portfolio
return
Quarterly
portfolio
risk
Return
per one
unit of
risk
% of
Improvement Ranking
Annual
portfolio
return
Annual
portfolio
risk
Without residential property
(benchmark) 14.6760% 0.0000% 1.6498% 1.5871% 1.0395 0.0000% 113 6.7644% 3.1741%
KL - High-rise -Kuala Lumpur
Central 13.3132% 6.8556% 1.6101% 1.5112% 1.0654 2.4891% 76 6.5975% 3.0225%
Sabah (Sab) Semi-detached 13.5416% 5.5316% 1.6210% 1.5237% 1.0639 2.3407% 77 6.6435% 3.0474%
Pah - Terraced - Bentong Lipis-
Raub 12.5071% 4.1408% 1.6022% 1.5145% 1.0579 1.7663% 78 6.5643% 3.0289%

38
Melaka (Mel) Semi-detached 16.1724% 5.0821% 1.6771% 1.5856% 1.0577 1.7484% 79 6.8792% 3.1713%
Terengganu (Ter) Semi-
detached 12.4943% 3.5856% 1.6233% 1.5353% 1.0574 1.7138% 80 6.6531% 3.0705%
Johor (Joh) Semi-detached 14.1031% 2.4359% 1.6040% 1.5235% 1.0528 1.2795% 81 6.5719% 3.0469%
Perlis (Per) Terraced 14.8123% 4.0063% 1.6807% 1.5978% 1.0519 1.1877% 82 6.8944% 3.1957%
Pulau Pinang (Pen) Semi-
detached 12.9747% 5.0580% 1.5655% 1.4885% 1.0517 1.1716% 83 6.4105% 2.9770%
Terengganu (Ter) Terraced 13.5255% 4.3413% 1.6219% 1.5425% 1.0514 1.1456% 84 6.6471% 3.0851%
Per - Terraced - Kuala Kangsar 12.9472% 5.5176% 1.6236% 1.5450% 1.0509 1.0895% 85 6.6543% 3.0900%
Kelantan (Kel) Detached 14.6901% 1.0533% 1.6535% 1.5748% 1.0500 1.0018% 86 6.7798% 3.1496%
KL - Terraced -Kuala Lumpur
Central 13.8999% 2.9143% 1.6450% 1.5713% 1.0468 0.7029% 87 6.7440% 3.1427%
Kuala Lumpur (KL) Semi-
detached 14.6205% 3.0098% 1.6196% 1.5489% 1.0456 0.5853% 88 6.6373% 3.0978%
Sar - Terraced - Miri 13.9349% 3.1470% 1.5969% 1.5281% 1.0450 0.5285% 89 6.5421% 3.0561%
Sel - High-rise - Hulu Langat 13.9734% 6.7298% 1.5532% 1.4882% 1.0437 0.3998% 90 6.3591% 2.9764%
Sab - Terraced - Kota 14.9629% 2.0302% 1.6717% 1.6018% 1.0437 0.3977% 91 6.8565% 3.2035%
Sabah (Sab) High-rise 14.2956% 1.1231% 1.6531% 1.5842% 1.0435 0.3802% 92 6.7782% 3.1684%
4 Financial assets and terraced
houses in Tawau, Sabah state
with
% of terraced
houses in
Tawau, Sabah
state
% of
Residential
property
Quarterly
portfolio
return
Quarterly
portfolio
risk
Return
per one
unit of
risk
% of
Improvement Ranking
Annual
portfolio
return
Annual
portfolio
risk
Without residential property
(benchmark) 14.6760% 0.0000% 1.6498% 1.5871% 1.0395 0.0000% 113 6.7644% 3.1741%

39
Sel - Terraced - Gombak 13.8336% 2.8587% 1.6092% 1.5427% 1.0431 0.3423% 93 6.5938% 3.0854%
Perlis (Per) Semi-detached 14.1007% 2.0326% 1.6623% 1.5952% 1.0421 0.2447% 94 6.8169% 3.1904%
Johor (Joh) Terraced 13.9331% 2.6355% 1.5859% 1.5231% 1.0412 0.1588% 95 6.4959% 3.0462%
Johor (Joh) All Houses 14.2928% 1.4115% 1.6165% 1.5544% 1.0399 0.0371% 96 6.6244% 3.1088%
Johor (Joh) High-rise 14.6760% 0.0000% 1.6498% 1.5871% 1.0395 0.0000% 97 6.7644% 3.1741%
Johor (Joh) Detached 14.6760% 0.0000% 1.6498% 1.5871% 1.0395 0.0000% 97 6.7644% 3.1741%
Joh - Terraced - Johor Bahru /
Kota Tinggi / Pontian 14.6761% 0.0000% 1.6498% 1.5871% 1.0395 0.0000% 99 6.7644% 3.1741%
Sel - High-rise - Petaling 14.6761% 0.0000% 1.6498% 1.5871% 1.0395 0.0000% 100 6.7644% 3.1741%
Ked - Terraced - Kubang Pasu 14.6761% 0.0000% 1.6498% 1.5871% 1.0395 0.0000% 101 6.7644% 3.1741%
Mel - Terraced - Alor Gajah-
Jasin 14.6760% 0.0000% 1.6498% 1.5871% 1.0395 0.0000% 102 6.7644% 3.1741%
Selangor (Sel) Semi-detached 14.6760% 0.0000% 1.6498% 1.5871% 1.0395 0.0000% 103 6.7644% 3.1741%
Selangor (Sel) High-rise 14.6760% 0.0000% 1.6498% 1.5871% 1.0395 0.0000% 103 6.7644% 3.1741%
Selangor (Sel) Detached 14.6760% 0.0000% 1.6498% 1.5871% 1.0395 0.0000% 103 6.7644% 3.1741%
Melaka (Mel) High-rise 14.6760% 0.0000% 1.6498% 1.5871% 1.0395 0.0000% 106 6.7644% 3.1741%
Melaka (Mel) Detached 14.6760% 0.0000% 1.6498% 1.5871% 1.0395 0.0000% 106 6.7644% 3.1741%
KL - High-rise -Kuala Lumpur
North 14.6761% 0.0000% 1.6498% 1.5871% 1.0395 0.0000% 108 6.7644% 3.1741%
Sem - Terraced - Tampin &
Others
14.6760% 0.0000% 1.6498% 1.5871% 1.0395 0.0000% 109 6.7644% 3.1741%

40
4 Financial assets and terraced
houses in Tawau, Sabah state
with
% of terraced
houses in
Tawau, Sabah
state
% of
Residential
property
Quarterly
portfolio
return
Quarterly
portfolio
risk
Return
per one
unit of
risk
% of
Improvement Ranking
Annual
portfolio
return
Annual
portfolio
risk
Without residential property
(benchmark) 14.6760% 0.0000% 1.6498% 1.5871% 1.0395 0.0000% 113 6.7644% 3.1741%
Sem - Terraced - Port Dickson 14.6760% 0.0000% 1.6498% 1.5871% 1.0395 0.0000% 109 6.7644% 3.1741%
Sab - Terraced - Sandakan 14.6760% 0.0000% 1.6498% 1.5871% 1.0395 0.0000% 111 6.7644% 3.1741%
Sar - Terraced - Sibu 14.6762% 0.0000% 1.6499% 1.5871% 1.0395 0.0000% 112 6.7646% 3.1742%