the role of inositol phosphates in the signal transduction...
TRANSCRIPT

The role of inositolphosphates in the
signal transductionof AKH-I, -II and -III in the
locust fat body
Jeroen de MeijerJun-1995/Aug-1996


Illustrations on front page:Top Right: Inositol-(1,4,5)-trisphosphate.Bottom: Locusta migratoria Adipokinetic Hormone III (Lom-AKH-III).

The role of inositolphosphates in thesignal transductionof AKH-I, -II and -III
in the locust fatbody

The role of inositolphosphates in thesignal transductionof AKH-I, -II and -III
in the locust fatbody
A report of a 15 month research period at the Biochemical Physiology
Research Group, Department of Experimental Zoology, University of
Utrecht, under convoy of ir. S.F. Vroemen.
J. de Meijer 1996

5Abstract
AbstractInositol phosphates play an important role in the locust adipokinetic
hormone (AKH) signal transduction. They induce the release of calcium
from intracellular stores such as the endoplasmatic reticulum. This re-
lease results in a netto influx of extracellular calcium. Calcium plays an
important role in the regulation of the glycogen phosphorylase activity.
Inositol phosphates are formed by hydrolysis of phosphatidyl inositol
phosphate into inositol(1,4,5)-trisphosphate (Ins(1,4,5)P3) and
diacylglycerol by phospholipase C (PLC). Ins(1,4,5)P3 can then be trans-
formed into a range of other InsPs, with 1 to 6 phosphates.
Goals of this study were to elucidate the role of the different InsPs, and
also of PLC, in the signal transduction of the three locust AKHs.
This was done in various ways:
-Determination of total and individual InsP formation after addition of
AKH. This was done using radioactive labelled inositol and seperation
of InsPs on an ion exchange column.
-Determination of the Ins(1,4,5)P3 concentration after addition of AKH
using a radio-immuno assay.
-Involvement of PLC was investigated with the use of U73122, a PLC
inhibitor, and evaluating its effect on InsP formation and glycogen phos-
phorylase activition.
The results show that AKH is able to induce a rise in InsP levels al-
ready after 15 seconds, and maximally after 1 minute, although initial
rises induced by AKH-II are smaller than those generated by AKH-I and
-III. AKH-I is the only AKH for which the InsP levels return to basal
after 2.5 minutes. After approximately 5 minutes, a second, probably
non-phisiological, increase occurs.
Both AKH-I and -III show a high level of InsP3 at 1 minute that slowly
decreases in time. With AKH-III however, after 15 minutes mostly InsP1
and InsP2 were left, while AKH-I-induced fat bodies end up with mostly
increased InsP4 and InsP
5-6 levels, as do AKH-II-stimulated ones. At 15
minutes InsP3 levels are still high only for AKH-III.
Very suprisingly, AKH-II shows only rises in InsP5-6
after 1 minute, and
only a minor part is InsP3 at 2.5 minutes. This is supported by the radio-
immuno assay, which shows almost no rise of Ins(1,4,5)P3 concentra-
tions for 40 nM AKH-II at 1 minute. This could suggest a role in signal
A

6Abstract
transduction for the high InsPs. At 4 nM though, AKH-II was equally
potent as AKH-I and -III. The radio-immuno assay also showed that the
effect of AKH-I and -III on Ins(1,4,5)P3 levels is dose-dependent.
The U73122 assay shows that inhibition of PLC lowers the glycogen
phosphorylase activity as well as the InsP levels. This suggests that AKH
signal transduction towards glycogen phosphorylase involves PLC and
InsPs.

7Contents
CContents
Abstract ...................................... 5Introduction................................ 91.1 The fat body................................................................... 91.2 The adipokinetic hormones .......................................... 91.3 Glycogen phosphorylase ............................................. 101.4 The role of cyclic AMP ............................................... 101.5 The role of intra- and extracellular calcium ..............111.6 The role of inositol phosphates .................................. 13
Materials and Methods............ 152.1 Animals ....................................................................... 152.2 Chemicals .................................................................... 152.3 Preparation of fat body ............................................... 162.4 Total InsP measurement in the fat body .................... 16 2.5 Determination of salt concentrations needed for
inositol phosphates elution ........................................... 172.6 Measurement of individual InsP in the fat body ....... 172.7 Measurement of radioactivity ..................................... 182.8 Data interpretation InsP measurements .................... 182.9 Measurement of Ins(1,4,5)P3 levels in the fat body ... 182.10 Protein determination ............................................... 192.11 Involvement of phospholipase C in glycogen
phosphorylase activation .............................................. 202.12 Glycogen phosphorylase assay ................................. 202.13 Involvement of phospholipase C in InsP formation 20
Results ....................................... 223.1 The effect of AKH on the formation of total InsPs ... 223.2 Determination of elutionbuffer concentrations of
individual InsPs ............................................................ 243.3 The effect of AKH on the formation of the total InsPs .............................................................................. 263.4 Ins(1,4,5)P3 determination using a radio-immuno
assay .............................................................................. 283.5 Role of PLC in AKH-induced InsP formation and
glycogen phosphorylase activition................................ 29
Discussion and Conclusions .... 32

8Contents
References ................................. 35Supplement ............................... 38Acknowledgements .................. 39

9Introduction
Introduction
1.1 The fat body
The migratory locust (see Fig. 1) is an insect capable of flying very
long distances (about 400 kilometers) without resting. To accomplish
this they are equiped with a very efficient energy metabolism. This is one
of the reasons that it is such a good animal to do metabolic research on.
The locust uses both lipids and carbohydrates as fuels for flight. Both
lipid and carbohydrate are stored in the fat body, an organ that occupies
the major part of the abdomen and thorax. The carbohydrates are stored
as glycogen and the lipids as triacylglycerol and both are mobilised upon
flight activity. The fat body plays a major role in the energy metabolism
of the locust as it incorporates the functions of vertebrate adipose tissue
and liver.
1.2 The adipokinetic hormones
When the insect starts to fly, the cerebral ganglion in the brain stimu-
lates the corpus cardiacum glandular lobe, a neuroendocrine gland, via
the nervi corporis cardiaci-I and -II, to release adipokinetic hormones
(AKHs) into the hemolymph. These hormones induce the mobilisation of
trehalose and diacylglycerol from the fat body by activating triacylglycerol
lipase, which hydrolyses the stored triacylglycerol to diacylglycerol, and
glycogen phosphorylase, which catalyses the breakdown of stored gly-
cogen to trehalose, resulting in an increased level of available energy in
the hemolymph.
There are three adipokinetic hormones, -I, -II and -III, which are all
released into the hemolymph upon flight activity. AKH-I is a decapeptide
and AKH-II and -III are octapeptides. All AKHs are C- and N-blocked
(see Fig. 2). They are all able to mobilise trehalose and diacylglycerol.
1
Figure 1;The migratory locust, Locustamigratory migratorioides.
Up to now, no reason for the need for three AKHs has been found,
although the concomitant release of structurally related hormones is found
in more animals like the lamprey [Sower 1993] and the sea bream [Powell
Lom-AKH-I pGlu-Leu-Asn-Phe-Thr-Pro-Asn-Trp-Gly-Thr-NH2
Lom-AKH-II pGlu-Leu-Asn-Phe-Ser-Ala-Gly-Trp-NH2
Lom-AKH-III pGlu-Leu-Asn-Phe-Thr-Pro-Trp-Trp-NH2
Figure 2;The amino acid structure of thethree AKHs.
10Introduction
1994]. This study might shed a light on the reason for the presence of
three AKHs in locust.
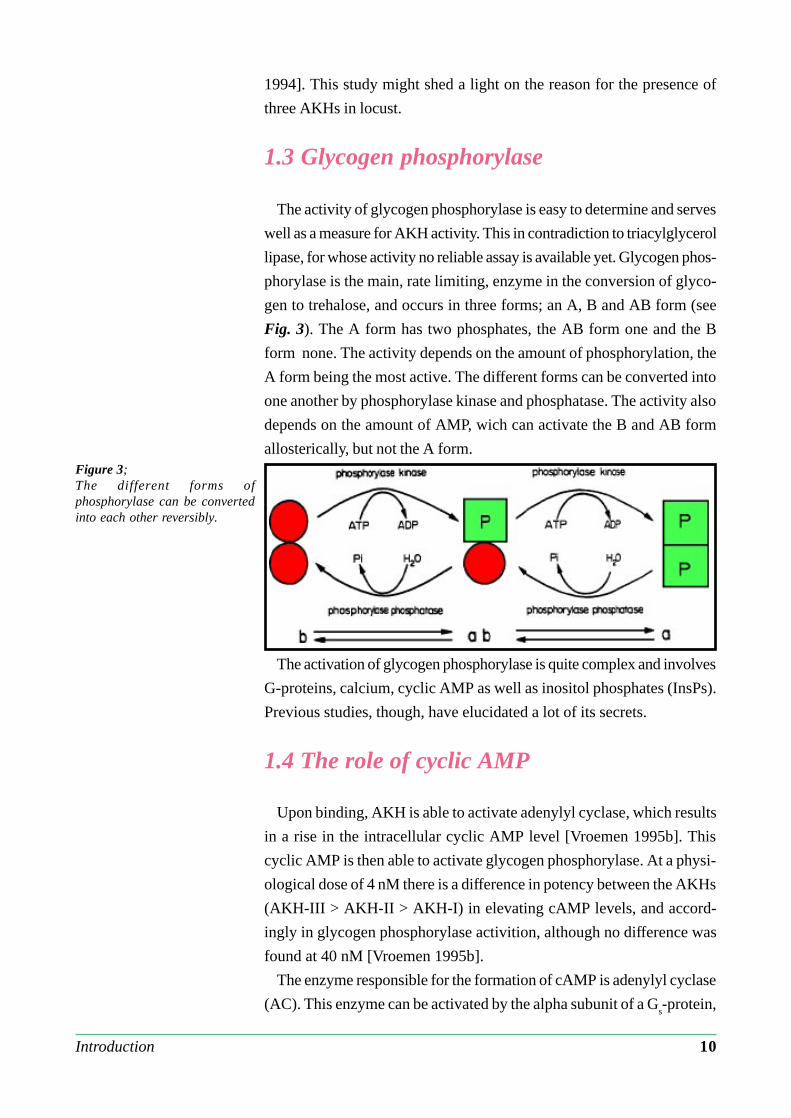
1.3 Glycogen phosphorylase
The activity of glycogen phosphorylase is easy to determine and serves
well as a measure for AKH activity. This in contradiction to triacylglycerol
lipase, for whose activity no reliable assay is available yet. Glycogen phos-
phorylase is the main, rate limiting, enzyme in the conversion of glyco-
gen to trehalose, and occurs in three forms; an A, B and AB form (see
Fig. 3). The A form has two phosphates, the AB form one and the B
form none. The activity depends on the amount of phosphorylation, the
A form being the most active. The different forms can be converted into
one another by phosphorylase kinase and phosphatase. The activity also
depends on the amount of AMP, wich can activate the B and AB form
allosterically, but not the A form.
The activation of glycogen phosphorylase is quite complex and involves
G-proteins, calcium, cyclic AMP as well as inositol phosphates (InsPs).
Previous studies, though, have elucidated a lot of its secrets.
1.4 The role of cyclic AMP
Upon binding, AKH is able to activate adenylyl cyclase, which results
in a rise in the intracellular cyclic AMP level [Vroemen 1995b]. This
cyclic AMP is then able to activate glycogen phosphorylase. At a physi-
ological dose of 4 nM there is a difference in potency between the AKHs
(AKH-III > AKH-II > AKH-I) in elevating cAMP levels, and accord-
ingly in glycogen phosphorylase activition, although no difference was
found at 40 nM [Vroemen 1995b].
The enzyme responsible for the formation of cAMP is adenylyl cyclase
(AC). This enzyme can be activated by the alpha subunit of a Gs-protein,
Figure 3;The different forms ofphosphorylase can be convertedinto each other reversibly.

11Introduction
and inhibited by the alpha subunit of a Gi-protein [Gilman 1995]. A G-
protein is a trimeric protein with an alpha, beta and gamma subunit. Upon
activation the alpha subunit dissociates from the beta-gamma subunit.
The alpha subunit is then able to activate other proteins. The beta-gamma
subunit is thought to play a role in the signal transduction as well, but not
much is known about it yet. Experiments with cholera toxin (CTX), which
irreversible activates Gs, and pertussis toxin (PTX), which irreversible
inactivates Gi (thus keeping adenylyl cyclase active), have shown that
CTX is able to cause a significant rise in intracellular cAMP levels whereas
PTX has no effect [Vroemen 1995b]. This suggests that the signal trans-
duction of AKH to AC is mediated through Gs and not through G
i. Moreo-
ver the effects of CTX and AKH on cAMP levels were not additive,
suggesting that AKH and Gs act via the same pathway.
1.5 The role of intra- and extracellularcalcium
Calcium plays an important role in the signal transduction towards gly-
cogen phosphorylase. Without extracellular calcium, AKH isn’t able to
activate glycogen phosphorylase and to raise cAMP levels [Vroemen
1995a]. Extracellular calcium itself though, in the absence of AKH, is
not able to alter the activity of glycogen phosphorylase.
Vroemen et al. [1995a] and van Marrewijk et al. [1993] have shown
that AKH is able to realise a rise in the influx as well as the efflux of
calcium in the fat body, although the influx is larger then the efflux. Van
Marrewijk [1993] also showed that AKH not only requires the influx of
extracellular calcium to activate glycogen phosphorylase, but the release
of calcium from intracellular stores as well. Several studies have pro-
posed that the depletion of the intracellular calcium pools in some way
leads to an influx of extracellular calcium. This mechanism, called capa-
citative calcium entry, has been shown to occur in vertebrate cells [Putney
1986, Putney 1990, Berridge 1995]. The depletion itself triggers the en-
try of exracellular calcium. The problem with this theory is: how do the
calcium pools ‘talk’ to the calcium channels in the membrane? Irvine
suggested a model in which there is a direct link between two receptors,
one being an inositol-trisphosphate (InsP3) receptor in the membrane of
the calcium pools which is modulated by both calcium and InsP3 (see
Fig. 4)[Irvine 1990, Irvine 1991, Irvine 1992]. This receptor is bound to
a protein in the plasma membrane that is controlling calcium entry. The

12Introduction
receptors dissociate if calcium levels in the pool are low or InsP3 is high,
resulting in calcium entry. It has been shown that inositol-tetrakisphosphate
(InsP4) is able to modulate calcium entry in lacrimal acinar cells [Changya
1989a, Changya 1989b]. InsP4 could modulate calcium entry by inter-
acting directly (or indirectly) with the membrane-bound protein.
The influx of extracellular calcium is probably needed for the activa-
tion of a calcium dependent AC, resulting in the production of cAMP.
cAMP itself, however, is able to activate glycogen phosphorylase in the
absence of extracellular calcium [Van Marrewijk 1993].
Figure 5;The role of DAG (green dots in themembrane) and Ins(1,4,5)P
3
(yellow) on PKC (red).PLC,phospholipase C; R, AKHreceptor; PKC, protein kinase C;ER, endoplasmatic reticulum.
Figure 4;The model of Irvine. Two boundproteins (A) are disconnected whenboth InsP
3 and InsP
4 bind (B),
upon which emtying of the poolsand influx of extracellular calciumoccurs. When InsP
3 dissociates
calcium influx only occurs whenluminal calcium levels are low (C).

13Introduction
1.6 The role of inositol phosphates
AKH also activates phospholipase C (PLC). The activation of PLC by
AKH is thought to be mediated by a G-protein, but this has not yet been
demonstrated in the locust. PLC is able to hydrolyse phosphatidylinositol-
4,5-bisphosphate (PtdIns) into Ins(1,4,5)P3 and diacylglycerol (DAG).
DAG plays an important role in the activation of protein kinase C (PKC),
which can activate a broad range of proteins. PKC also needs calcium for
its activation (see Fig. 5).
InsPs are continuously reused in an inositol-cycle, from inositol through
PtdIns and numerous forms of InsPs, back to inositol (see Fig. 6)[Batty
1989]. This reconversion of InsPs to inositol can by blocked by LiCl.
Ins(1,4,5)P3 is able to empty intracellular calcium stores, like the
endoplasmatic reticulum [Berridge 1989]. So, Ins(1,4,5)P3 could be the
trigger for the influx of extracellular calcium, as explained before. This
would mean that Ins(1,4,5)P3 (or other InsPs) plays a crucial role in the
regulation of glycogen phosphorylase.
We constructed a model for the signal transduction of AKH in the
locust fat body (see Fig. 7). Briefly, AKH binds to its receptor. The
receptor activates a stimulatory G-protein. This G-protein is able to
activate adenylyl cyclase which will result in a rise in cAMP levels in the
cytoplasm. The receptor also activates, probably also via a G-protein,
PLC. PLC will hydrolyse PtdIns into DAG and Ins(1,4,5)P3 and
Ins(1,4,5)P3 will empty the intracellular calcium stores, which will result
in a net influx of extracellular calcium. This calcium in combination with
the rise in cAMP levels is able to activate glycogen phosphorylase, which
indirectly results in the release of trehalose into the hemolymph. The aim
Figure 6;Inositol-cycle: reconversion ofInsPs to inositol via differentpathways. a=PLC; b=5-fosfatase;c=3-kinase. Red lines indicate thepoint of action of Li+.

14Introduction
Figure 7;Our proposed model for the AKHsignal transduction in the locustfat body. AC, adenylyl cyclase;GPh, glycogen phosphorylase;IP
3, Ins(1,4,5)P
3; G, G-protein;
R, AKH-receptor.
of this study is to look specificly at the role that InsPs play in the signal
transdcution of all three AKHs in the migratory locust.

15Material and Methods
Materials and Methods
2.1 Animals
The adult males of the migratory locust, Locusta migratoria
migratorioides were used, 15 to 16 days after imaginal ecdysis. The ani-
mals were raised at a temperature of 30 oC and a relative humidity of
40% in crowded conditions with 12 hours of light a day. The animals
were fed daily with reed grass and oatmeal [Van Marrewijk 1983].
2.2 Chemicals
AKH-I and -II (synthetic) were purchased from Peninsula Laborato-
ries (San Carlos, CA, U.S.A.). AKH-III was produced as described by
Oudejans [1991]. Adenosine phosphates came from Boehringer Mannheim
B.V. (Almere, The Netherlands) like most biochemicals and enzymes.
Triethylammonium hydrogen carbonate buffer (TEAB) came from Fluka
(Buchs, Switserland). The radioactive InsP standards, Ins(1)P1 (13 Ci/
mmol), Ins(1,4)P2 (9,9 Ci/mmol), Ins(1,4,5)P
3 (21 Ci/mmol) and
Ins(1,3,4,5)P4 (21 Ci/mmol), were from Du Pont de Nemours (‘s-
Hertogenbosch, The Netherlands); myo[2-3H] inositol (18 Ci/mmol) and
the Ins(1,4,5)P3-RIA-kit from Amersham (‘s Hertogenbosch, The Neth-
erlands) and the ion exchange columns (Waters Sep-Pak Accell Plus QMA)
from Millipore Corporation (Milford, MA, U.S.A.). Emulsifier-Safe scin-
tillation liquid came from Packard (Groningen, The Netherlands), peni-
cillin/streptomycin (Pen/Strep)from Gibco BRL (Breda, The Netherlands)
and U73122 was obtained from Calbiochem (Breda, The Neherlands).
All other chemicals came from Baker (Deventer, The Netherlands) and
Merck (Amsterdam, The Netherlands).
For experiments, stock solutions of the AKHs were used with a con-
centration of 20 pmol/µl. In these stocks AKH-I was dissolved in 10%
methanol, AKH-II in 20% methanol and AKH-III in 10% methanol, 1 M
NaAc. Adenosine phosphates were added from a stock solution with a
concentration of 40 mM. Double glass distilled water (bidest) was used
throughout all experiments.
2

16Material and Methods
2.3 Preparation of fat body
Legs, wings and the last two segments of the abdomen were removed
from the locust. Next, the head was removed by turning it 180 degrees
relative to the thorax, and pulling it out together with the intestines. The
animal was cut open lengthwise on the ventral side and spread open with
pins to paraffine under preparation medium (Medium II, see Supplement).
The fat body was dissected in this medium and all residues of the respira-
tory system, Malpighian tubes and other tissues which did not belong to
the fat body were removed. Next, the fat body was split into two equal
lateral parts of which one served as a control, and the contralateral half
was used for experimental treatment.
2.4 Total InsP measurement in the fat body
After preparation the half fat bodies were preincubated for 16 hours in
a solution containing 1 µl myo[2-3H] Inositol, 10 µl 100x Pen/Strep stock
and 969 µl preincubation medium (Medium XV, see Supplement) (total
volume 980 µl) in a 30 °C shaking waterbath.
After preincubation, a solution containing 2 µl AKH stock, 8 µl 2.5 M
LiCl and 10 µl Medium XV was added to one half. To the other half, the
same solution, however containing 2 µl of the solvent of the AKH (10 or
20 % methanol) was added and they were incubated for 15, 30, 60, 150,
300, 900 or 1800 seconds in a 30 °C shaking waterbath. The incubation
was stopped by putting the fat body in liquid nitrogen. The frozen fat
body was then sonificated during 40 seconds in a solution containing 940
µl chloroform:methanol (1:2), 250 µl bidest, 8 µl 10% TCA and 2 µl
fytate hydrolysate.
The pH was set to 7.0 with 1 M KOH and/or 10% TCA. After 10
minutes of extraction with repeated shaking, 310 µl bidest and 310 µl
chloroform were added to obtain a seperation between InsP in the
waterphase, and PtdIns in the chloroformphase. After centrifugation at
12,000 g for 5 minutes, half of the upper phase (600 µl) was added to 9.4
ml water to create a 10 ml sample. This sample was run over an ion
exchange column (Waters Sep-Pak Accell Plus QMA) which was eluted
with 5 ml water, 10 ml 10 mM TEAB and 10 ml 500 mM TEAB respec-
tively, at 0.8 ml/min. The 500 mM fraction, containing total InsP,was
collected and 400 µl was counted in a scintillation counter. The columns
were regenerated with 5 ml 2 M NaCl, 5 ml 50% methanol and 5 ml 500

17Material and Methods
mM TEAB respectively.
250 µl of the lower phase was washed in 1 ml of
chloroform:water:methanol (3:47:48). After washing, 125 µl was taken
off and the chloroform was evaporated by heating at 80 °C during 1 hour.
The radioactivity in the residue, containing the PtdIns, was counted in a
scintillation counter as described in paragraph 2.7, and was used to cor-
rect for the differences in size and/or preloading of the fat body halves.
2.5 Determination of salt concentrationsneeded for inositol phosphates elution
Fat bodies were treated as described in paragraph 2.4 until chromatog-
raphy. The chloroformphase was discarded. To the sample (600 µl of the
upper (water) phase with 9.4 ml water) 1 µl of each InsP standard was
added (Ins(1)P1, Ins(1,4)P
2, Ins(1,4,5)P
3, Ins(1,3,4,5)P
4). This sample was
run over the ion exchange column. Next, a linear gradient of TEAB,
stretching from 0 to 500 mM, in a volume of 60 ml, was run over the
column at 0.8 ml/min using a gradient mixer. 2 ml fractions were col-
lected and 400 µl of each fraction was counted in a scintillation counter.
As a control, several samples containing different combinations of InsP
standards were eluted stepwise with several combinations of TEAB con-
centrations.
2.6 Measurement of individual InsP in thefat body
Treatment of the fat bodies was the same as described in paragraph
2.4, with the following differences: the column was eluted with 5 ml
water, 10 ml sample, 5 ml water, 10 ml 10 mM TEAB, 10 ml 110 mM
TEAB, 10 ml 210 mM TEAB, 10 ml 310 mM TEAB, 10 ml 410 mM
TEAB and 10 ml 500 mM TEAB, respectively (the concentrations as
determinded in the experiment described in paragraph 2.5). The 110,
210, 310, 410 and 500 mM fractions (InsP1, InsP
2, InsP
3 and InsP
4, re-
spectively) were collected and 400 µl of each fraction was counted in a
scintillation counter.
18Material and Methods
2.7 Measurement of radioactivity
To 400 µl of sample, 4 ml of Emulsifier-Safe was added. Samples from
the total InsP measurement were counted 2 times for 2.5 minutes in a
Packard 4550 liquid scintillation counter. Samples from the individual
InsP measurement were counted 2 times for 5 minutes.
2.8 Data interpretation InsP measurements
The rises in InsP levels were calculated as followed: the amount of
radioactive PtdIns is considered as a measure for the size of the fat body.
In order to eliminate differences in the sizes of the fat body halves, the
dpm of the InsP fraction is divided through the dpm of the corresponding
PtdIns fraction. And because only about 1 % of the radioactive PtdIns is
converted into InsP, no correction for conversion was made.
Then, to calculate the relative raise in InsP in relation to the control,
InsP/PtdIns from the AKH-stimulated fraction was divided through InsP/
PtdIns from the control fraction (“relative raise”). In order to calculate
the absolute raise in InsP, instead of the relative, the (InsP/PtdIns)Control
is
substracted from (InsP/PtdIns)AKH
(“absolute raise”).
For statistical data analysis the ‘Dean and Dixon’ test for outliers was
used [Dean 1951] on the (InsP/PtdIns)AKH
and (InsP/PtdIns)Control
values
and on the AKH/Control values. Results are expressed as the mean ±
S.E.M.. Significance of differences was tested using the Students t-test
for paired or unpaired comparisons [Sokal 1969], depending on the ex-
perimental setup.
2.9 Measurement of Ins(1,4,5)P3 levels in the
fat body
Fat body was treated as described in paragraph 2.4 till after the
seperation by chloroform:methanol. The protein layer (infranatant) was
collected and washed in 1 ml chloroform, and then dried for 10 min at 50
°C. Next, 1 ml 0.5 M KOH was added. The solution was sonificated
briefly (4 seconds), heated (56 °C) for 1 hour, and put at room tempera-
ture overnight to enhance resuspension of the proteins. 50 µl of this so-
lution was mixed with 450 µl of water and used in the protein determina-
tion assay of Schacterle and Pollack [1973].

19Material and Methods
600 µl of supernatant was put under a constant flow of nitrogen gas at
40 °C, to evaporate the methanol and the chloroform remains, until about
150 µl was left. The precise volume was determined using an automatic
pipet. 7 µl extract was mixed with 43 µl water and used as sample for the
Amersham Ins(1,4,5)P3 radio-immuno assay. All Ins(1,4,5)P
3 measure-
ments were carried out in silanized tubes.
The radio-imuno assay was carried out as follows; As blanc, a B0 sam-
ple was made containing 50 µl water instead of 43 µl water and 7 µl
extract. Nonspecific binding (NSB) was measured by adding 50 µl unla-
belled Ins(1,4,5)P3 standard stock instead of 43 µl water and 7 µl of
fraction. To all samples 50 µl assay buffer, 50 µl radioactive Ins(1,4,5)P3
tracer and 50 µl binding protein were added. For the standard curve, 4
dilutions of the Ins(1,4,5)P3 standard stock were used; 25 pmol, 6.25
pmol, 1.56 pmol and 0.39 pmol per tube (see Table 1). All samples were
thoroughly shaken, put on ice for 15 minutes and centrifuged at 12,000 g
for 10 minutes. Next, the pellet was dried and dissolved in 400 µl 0.15 M
NaOH. Samples were counted in a scintillation counter.
2.10 Protein determination
For protein determination a modified assay of Schacterle and Pollack
[1973] was used. 500 µl diluted sample was mixed with 500 µl alkaline
copper reagent, and left at room temperature for 10 minutes. Then 2 ml
Folin reagens was added and incubated for 5 minutes at 55 °C. Next, the
sample was allowed to cool down to room temperature and its extinction
was measured at 750 nm. Water was used as blanc and standard calibra-
tion solutions (BSA) were used to make a standard curve.
volumesin µl
Ins(1,4,5)P3standard stock
water sample dilutedstandard
Assaybuffer
3H-Ins(1,4,5)Ptracer
Bindin gProtei n
NSB 50 50 50 50
Bo 50 50 50 50
standardcurve
50 50 50 50
sample 43 7 50 50 50
Table 1;Mixing table forIns(1,4,5)P
3 assay.

20Material and Methods
2.11 Involvement of phospholipase C inglycogen phosphorylase activation
Fat bodies were divided into eight pieces and pooled to get identical
half fat bodies (each consisting of 4 pieces). Fat bodies were incubated in
preincubation medium (Medium III, see Supplement) for 2 hours to ob-
tain resting levels of glycogen phosphorylase and then washed in wash-
ing medium (Medium XI, see Supplement). Subsequently, fat bodies were
incubated for 30 minutes in incubation medium (Medium IV, see Supple-
ment) in the presence of 10 µl 10 mM U73122, an inhibitor of phospholi-
pase C, or 10 µl of its solvent DMSO (dimetyl sulfoxide). Then incuba-
tion with or without AKH -I, -II or -III for 15 minutes followed. Incuba-
tion was terminated by homogenizing the tissue, using a chilled glass
Teflon homogenizer, in 1 ml homogenisation medium (Medium I, see
Supplement). The homogenates were centrifuged for 15 minutes at 12,000
g at 0 °C. The infranatant was used for spectrophotometric determina-
tion of the phosphorylase activity.
2.12 Glycogen phosphorylase assay
This assay was done as previously described by van Marrewijk [1980].
Briefly, the infranatant (10 to 130 µl) was put into a cuvet with 345 µl of
a mixture containing 200 µl Buffer I (see Supplement), 50 µl Buffer II
(see Supplement), 25 µl 100 mM MgAc, 35 µl 12 mM NADP, 25 µl 56
mg/ml glycogen, 5 µl 0.4 mM glucose-1,6-bisphosphate, 5 µl enzymes
(1 µl phosphoglucomutase (1.9 I.U.) and 1.2 µl glucose-6-P dehydroge-
nase (0.38 I.U.) centrifuged and dissolved in 5 µl Buffer II). Water was
added to get a final volume of 475 µl. Active forms (A and AB) of glyco-
gen phosphorylase were measured by measuring the reduction of NADP+
at 340 nm. Next, 25 µl 40 mM 5’-AMP was added to measure both
active and inactive forms of phosphorylase, representing the size of the
fat body piece. The glycogen phosphorylase activity ratio was calculated
by dividing the the activity without AMP through the activity with AMP.
2.13 Involvement of phospholipase C in InsPformation
To determine whether the effect of phospholipase C on glycogen phos-

21Material and Methods
phorylase (if any) is mediated through InsPs, the effect of U73122 on
InsP formation by AKH was measured.
This experiment was done as described in paragraph 2.4, except for the
fact that fat bodies were cut in 3 parts (control, AKH and AKH+U73122)
and 30 min before AKH addition, 10 µl 10 mM U73122 was added (or
10 µl DMSO for the control and AKH treatments).
Results 22
3
time (min)
0 1 2 3 4 5 15 30
% I
P in
crea
se
0
10
20
30
40
50
60
70
80
90
100
110 AKH-IAKH-IIAKH-III
Results
3.1 The effect of AKH on the formation oftotal InsPs
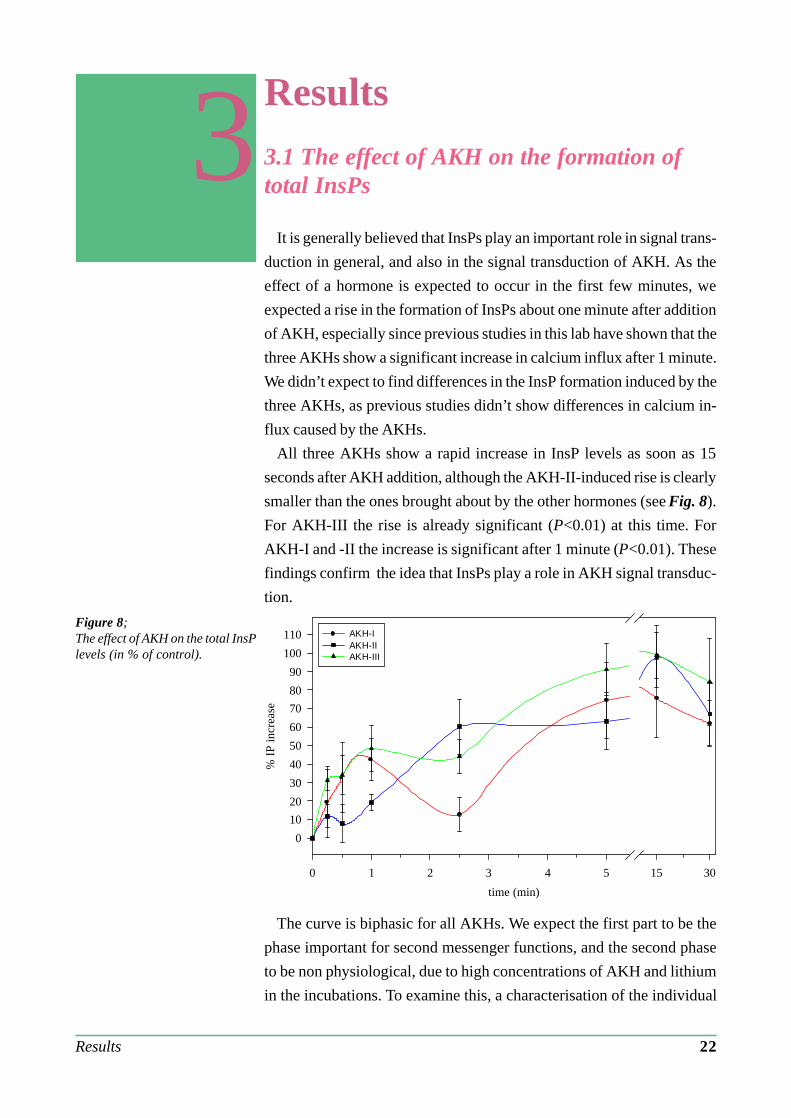
It is generally believed that InsPs play an important role in signal trans-
duction in general, and also in the signal transduction of AKH. As the
effect of a hormone is expected to occur in the first few minutes, we
expected a rise in the formation of InsPs about one minute after addition
of AKH, especially since previous studies in this lab have shown that the
three AKHs show a significant increase in calcium influx after 1 minute.
We didn’t expect to find differences in the InsP formation induced by the
three AKHs, as previous studies didn’t show differences in calcium in-
flux caused by the AKHs.
All three AKHs show a rapid increase in InsP levels as soon as 15
seconds after AKH addition, although the AKH-II-induced rise is clearly
smaller than the ones brought about by the other hormones (see Fig. 8).
For AKH-III the rise is already significant (P<0.01) at this time. For
AKH-I and -II the increase is significant after 1 minute (P<0.01). These
findings confirm the idea that InsPs play a role in AKH signal transduc-
tion.
The curve is biphasic for all AKHs. We expect the first part to be the
phase important for second messenger functions, and the second phase
to be non physiological, due to high concentrations of AKH and lithium
in the incubations. To examine this, a characterisation of the individual
Figure 8;The effect of AKH on the total InsPlevels (in % of control).

Results 23
time (min)
0 1 2 3 4 5 15 30
IPA
KH
-IP
Con
trol(d
pm*1
0-2)
0
2
4
6
8
10 AKH-IAKH-IIAKH-III
InsP content of the peaks was done, which will be discussed later. Biphasic
in this case implies that there are two seperate peaks with a plateau in
between. Only AKH-I shows a dip at 2.5 minutes that is also significant
compaired to the level at 1 minute (P<0.05), as is the rise after 2.5 min-
utes (P<0.05). There is no significant difference between the level at 2.5
minutes and the level at t=0, which suggests that InsP levels are back to
control level. Such a decrease can’t be found for AKH-II and -III, where
the InsP levels reach a plateau level at about 2.5 minutes.
The problem with depicting the % InsP increase relative to the control
(as done in Fig. 8) is that differences in control levels are eliminated. The
InsP levels of the control, however, will also increase due to the LiCl
present in the solution. If, for instance, the control level is 6 and the
AKH-induced level 9, the “relative” increase of 50% and the “absolute”
rise is 3. If however the control level is 3 and the AKH-induced level is 6,
one will get a 100% “relative” increase, but still an “absolute” rise of 3.
To meet this problem, also the “absolute” rises (InsPAKH
-InsPcontrol
) were
calculated (see Fig. 9). This graph shows no big differences with the
“relative” graph, which supports the quality of the results. In the figure it
is clearly shown that AKH-I-induced InsP levels are back to control level
at 2.5 minutes. The figures also show clearly that there is a quick rise in
InsP levels already after 15 seconds.
It should be stressed that for AKH-I at 2.5 minutes, the “absolute”
total amount of InsP does not decrease (this is impossible because of the
presence of LiCl!) but only the difference between AKH-stimulated and
control levels decreases.
Figure 9;The effect of AKH on the InsPlevels absolutely to the control.

Results 24
3.2 Determination of elutionbufferconcentrations of individual InsPs
Fig. 10 clearly shows seperate peaks for the four InsP standards added,
from left to right Ins(1)P1, Ins(1
,4)P
2, Ins(1,4,5)P
3 and Ins(1,3,4,5)P
4.
These data suggest 120, 220, 320 and 420mM TEAB to be the concen-
trations at which the individual InsPs elute from the SepPak columns. As
there could be differences in these concentrations between a gradient
elution and a stepwise elution, several tests were done to determine the
validity of the determined concentrations. A sample containing one InsP
standard was eluted with respectively the determined concentration (X)
minus 30mM, followed by X minus 20, then X minus 10, X and X plus 10
mM (i.e. 90, 100, 110, 120 and 130 mM for InsP1). When the determined
concentrations are correct the X plus 10 mM samples should give zero
counts. The results showed no significant counts for the X plus 10 frac-
tion, so this suggests that the determined concentrations are correct (data
not shown). To be sure that raising the concentration in small steps has
no influence on the complete elution of an InsP isomer, another test was
done. In this test we used one InsP standard per sample, and the column
was eluted with respectively 120 and 130 mM TEAB for InsP1, 220 and
230 mM for InsP2, 320 and 330 mM for InsP
3 and 420 and 430 mM for
InsP4. If the determined concentrations are correct there should be no
radioactivity in the 130, 230, 330 and 430 mM fractions. The same test
Figure 10;Determination of the elutionconcentrations of InsP
1 through
InsP4. Green line, [TEAB]; red
line, radioactivity in fraction.
mMTEAB
counts(dpm)
InsP1
20 29
30 629
120 779
130 0
InsP2
120 26
130 667
220 795
230 0
InsP3
220 33
230 384
320 616
330 2
InsP4
320 39
330 539
420 680
430 27
mMTEAB
counts(dpm)
InsP1110 696
120 0
InsP2210 787
220 0
InsP3310 562
320 21
InsP4410 812
420 6
Table 3;Column test with stepwise elution.
Table 2;Column test with stepwise elution.

Results 25
was also done by eluting at 20 and 30 mM (InsP1), 120 and 130 mM
(InsP2), 220 and 230 mM (InsP
3) and 320 and 330 mM (InsP
4) TEAB,
respectively. These fractions should all give no counts if the determined
concentrations are correct, as they are the concentrations at which the
InsPs lower than the applied standard elute (or 10 mM higher than these).
The results of these two test are shown in Table 2. These results show
that the InsP standards elute from the column at 120, 220, 320 and 420
mM respectively. This suggests that the determined elution concentra-
tions are correct. However, at a 10 mM higher concentration then each
determined concentration, the next InsP already starts to elute from the
column. In order to avoid a possible contamination of an InsP fraction
with the next InsP, also elution tests were done with slightly lower TEAB
concentrations of 110, 120, 210, 220, 310, 320, 410 and 420 mM TEAB,
respectively. The results (see Table 3) show that also with 110, 210, 310
and 410 mM the InsP are eluted completely seperately from the column.
So the final elution concentrations were set at 110 mM TEAB for InsP1,
210 mM for InsP2, 310 mM for InsP
3 and 410 mM for InsP
4. Although
we could not determine the elution concentration for InsP5-6
, we chose
500 mM TEAB since at this concentration all InsPs elute from the col-
Figure 11;Determination of the effect ofAKH-I on individual InsP (IP)levels in the fat body. A, b and cdepict the ‘absolute’ values, ddepicts the ‘relative’ values (seetext).

Results 26
umn. Morover, since biological samples all contain glycerophosphoino-
sitol, these compounds should first be eluted with a TEAB concentration
of 10 mM.
3.3 The effect of AKH on the formation ofindividual InsPs
Considering the proposed model in chapter 1, one would expect InsP3
levels to be raised significantly by AKH after 1 minute, since Ins(1,4,5)P3
is thought to be the second messenger inducing calcium fluxes and, as
shown by the total InsP determination in paragraph 3.1, at 1 minute the
first InsP peak occurs (see Fig. 8). One would expect InsP3 levels to
return to basal levels after about 2.5 minutes as the activation shouldn’t
be too long and according to the total InsP determination.
Therefore we measured the formation of individual InsPs induced by
the AKHs after 1 and 2.5 minutes. To investigate the nature of the accu-
mulation shown in paragraph 3.1 at later time points, the experiment was
also done at 15 minutes of AKH incubation. At this time point one would
Figure 12;Determination of the effect ofAKH-II on individual InsP (IP)levels in the fat body. A, b and cdepict the ‘absolute’ values, ddepicts the ‘relative’ values (seetext).

Results 27
expect, because of the presence of LiCl, an accumulation of InsP2 and/or
InsP1.
The same problem with depicting a relative InsP increase compaired to
the control, as described in paragraph 3.1, occurs here. So, also here, the
absolute rises above control levels were calculated. These values are de-
picted in circle diagrams (see Fig. 11, 12 and 13). Each slice represents
the contribution (in %) of an individual InsP to the total InsP rise (100%)
at the given time point.
Figure 11a, b and c show the results of the experiments with AKH-I.
They demonstrate that after 1 minute a considerable part of the total
raise in InsP levels is InsP3 (46 %). This part significantly (P<0.05) de-
creases at 2.5 minutes and even further after 15 minutes. One should
remember that, as the total rise in InsP levels at 2.5 minutes is very small
(as shown in Fig. 8), the absolute amount of InsP3 is almost zero at 2.5
minutes. So far these results support the discussed model. Strangely, al-
ready a great part of the total rise in InsP consists of InsP4 and InsP
5-6 at
1 minute, and this percentage even increases at 15 minutes. So, instead
of an accumulation of InsP2 and InsP
1, we see an accumulation of the
Figure 13;Determination of the effect ofAKH-III on individual InsP (IP)levels in the fat body. A, b and cdepict the ‘absolute’ values, ddepicts the ‘relative’ values (seetext).

Results 28
highly phosphorylated InsPs. This is also seen with AKH-II (see Fig.
12a, b, c), although this hormone induces a large accumulation of the
less phosphorylated InsPs at 2.5 minutes which disappear again after 15
minutes, in benefit of the highly phosphorylated InsPs. Suprisingly, at 1
minute, AKH-II only appears to rise the level of InsP5-6
, while InsP3 starts
to show only in a small amount at 2.5 minutes, and in a larger amount at
15 minutes. It should be noted that the absolute levels of radioactivity
were by far the highest in the InsP1 and InsP
2 fractions (both in controls
as in AKH-treated fat bodies), and that the foregoing remarks solely con-
cern the rises in the levels of individual InsPs. The questions that rise
from these results are: doesn’t AKH-II use InsP3 as a second messenger
for its signal transduction? Does it operate via InsP4 (which is also thought
to have second messenger capabilities) or even InsP5 or InsP
6?
AKH-III (see Fig. 13a, b, c) is the only AKH that meets our expecta-
tions completely. The InsP3 concentration diminishes nicely in time and
at 15 minutes the largest part of the InsP accumulation consists of InsP2
and InsP1. The highly phosphorylated InsPs have almost completely van-
ished at 15 minutes.
Also the relative rise compaired to the control was calculated, and
these are shown in Fig. 11d, 12d and 13d. In Fig. 11d you can clearly see
the accumulation of the highly phosphorylated InsPs at 15 minutes for
AKH-I, the role of InsP3 at 1 minute, and more importantly the decrease
at 2.5 minutes wich is also seen in Fig. 9. In Fig. 12d the accumulation of
InsP4 and InsP
5-6 at 15 minutes for AKH-II is clearly shown, as well as the
large amount of InsP5-6
at 1 minute and the considerable amount of InsP1
at 2.5 minutes and its (strange) disappearence at 15 minutes.
Briefly, AKH-III seems to support our model (of InsP3 being the sec-
ond messenger that acts within a short period, and the second rise in total
InsP being of less physiological importance), AKH-I partly and AKH-II
not. An important disadvantage of the above experiments is that (for
instance) the InsP3 fraction contains both possible forms of InsP
3, and not
only the second messenger, Ins(1,4,5)P3. To eliminate this inaccuracy a
radio-immuno assay specific for Ins(1,4,5)P3 was introduced.
Results 29
Ins(
1,4,
5)P 3
(pm
ol/m
g pr
otei
n)
0
25
50
75
100
125
150
175 ControlAKH-I 4 nMAKH-I 40 nM AKH-II 4 nMAKH-II 40 nMAKH-III 4 nMAKH-III 40 nM
15 minutes1 minute
*
*
**
**
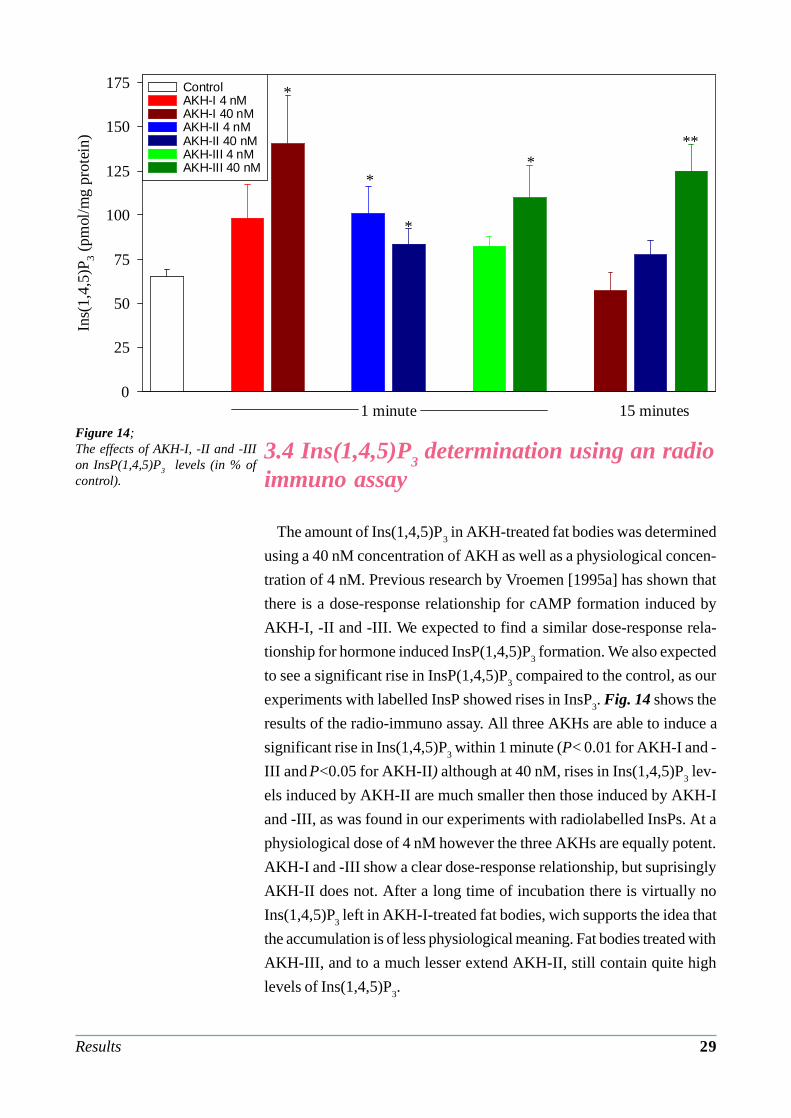
Figure 14;The effects of AKH-I, -II and -IIIon InsP(1,4,5)P3 levels (in % ofcontrol).
3.4 Ins(1,4,5)P3 determination using an radio
immuno assay
The amount of Ins(1,4,5)P3 in AKH-treated fat bodies was determined
using a 40 nM concentration of AKH as well as a physiological concen-
tration of 4 nM. Previous research by Vroemen [1995a] has shown that
there is a dose-response relationship for cAMP formation induced by
AKH-I, -II and -III. We expected to find a similar dose-response rela-
tionship for hormone induced InsP(1,4,5)P3 formation. We also expected
to see a significant rise in InsP(1,4,5)P3 compaired to the control, as our
experiments with labelled InsP showed rises in InsP3. Fig. 14 shows the
results of the radio-immuno assay. All three AKHs are able to induce a
significant rise in Ins(1,4,5)P3 within 1 minute (P< 0.01 for AKH-I and -
III and P<0.05 for AKH-II) although at 40 nM, rises in Ins(1,4,5)P3 lev-
els induced by AKH-II are much smaller then those induced by AKH-I
and -III, as was found in our experiments with radiolabelled InsPs. At a
physiological dose of 4 nM however the three AKHs are equally potent.
AKH-I and -III show a clear dose-response relationship, but suprisingly
AKH-II does not. After a long time of incubation there is virtually no
Ins(1,4,5)P3 left in AKH-I-treated fat bodies, wich supports the idea that
the accumulation is of less physiological meaning. Fat bodies treated with
AKH-III, and to a much lesser extend AKH-II, still contain quite high
levels of Ins(1,4,5)P3.

Results 30
GP
h A
ctiv
ity R
atio
0.1
0.2
0.3
**
% In
sP in
crea
se
0
25
50
75
100 ControlAKH-IAKH-I +U73122AKH-IIAKH-II +U73122AKH-IIIAKH-III +U73122
*
**
*
* *
Figure 15;The effect of U73122 on the InsPlevels and glycogen phosphorylaseactivity.
3.5 Role of PLC in AKH induced InsPformation and glycogen phosphorylaseactivition
The model in chapter 1 suggests that the signal transduction from AKH
to glycogen phosphorylase is mediated via PLC and InsP3. To provide
some further clues whether this pathway is really involved, the effect of
inhibition of PLC on InsP formation and glycogen phosphorylase activa-
tion was studied.
Fig. 15 shows that U73122, a specific inhibitor of PLC, is able to sig-
nificantly (P<0.05 for AKH-I and P<0.01 for AKH-II and -III) block the
effect of AKH on the increase in InsP levels, and to significantly attenu-
ate the effect of AKH on glycogen phosphorylase (P<0.001 for AKH-I
and -II and P<0.05 for AKH-III). However, the inhibitor is not able to
inhibit glycogen phosphorylase activation completely. This is, most prob-
ably, due to the fact that, as shown in the model, glycogen phosphorylase
is activated by two more or less seperate pathways. It is likely that in the
presence of U73122, glycogen phosphorylase is still activated via the
adenylyl cyclase/cAMP pathway. A second possibility would be that
U73122 isn’t able to inhibit PLC completely. This possibility, however, is
ruled out by our observation that U73122 is able to block the effect of
PLC on InsP levels completely.

Results 31
This experiment proves that PLC is somehow involved in the activa-
tion of glycogen phosphorylase. Whether this involvement includes InsP3
or not can not be said for sure, but it is likely because of the AKH-
induced calcium fluxes. It is possible that the pathway is mediated by
DAG, the other messenger that results from hydrolysis of PtdIns by
PLC, which is known to have a role in the activation and regulation of
PKC.

32Discussion and Conclusions
Discussion andConclusions
The research on InsPs is relatively young, though developing very
fast. Already a lot of research has been done and a lot of the mechanisms
it is involved in have been unravelled. Still, a lot of questions arise when
doing research on this fascinating second messenger system. In this study
we tried to answer some of these questions for the the signal transduc-
tion of AKH in the locust fat body, the most compelling being why there
are three AKHs and if there are differences between the AKHs. Because
AKH needs the release of calcium from intracellular stores [Van Marrewijk
1993] and InsPs are known to empty intracellular calcium pools [Berridge
1993], we took a look at the total InsP formation induced by the three
AKHs.
In our expectations, InsP levels would rise somewhere between 0
and 2.5 minutes as a result of AKH stimulation, and return to resting
levels after that. Because of the presence of LiCl and a massive dose of
AKH, an accumulation of InsPs could be expected and was indeed seen.
The total InsP determination showed that all three AKHs are able to
induce a significant rise in InsP levels 1 minute after AKH administration
which suggests an early role for InsPs in the signal transduction pathway.
The level of InsP formation induced by AKH-II though, is considerably
lower then those induced by AKH-I and -III. This is remarkable because
no differences between the AKHs have been found in the induction of
calcium infux, which is coupled to the emptying of the intracellular cal-
cium stores by InsP3 [Van Marrewijk 1993]. Further, only AKH-I shows
InsP levels that return to the control level at 2.5 minutes suggesting a
desensitisation process that is not induced by AKH-II or -III. A strange
phenomenon is the second phase in the total InsP time course. The accu-
mulation is also seen by others [Van Marrewijk 1996] and is generally
believed to be nonphysiological and a result of prolonged incubations
with a massive dose of AKH and LiCl (therefore containing mostly InsP1
and InsP2)[Berridge 1983]. To get a better insight in the results of the
total InsP determination we took a look at the distinct InsPs formed
upon AKH stimulation.
Both AKH-I and -III show high levels of InsP3 at 1 minute (46%
and 63% respectively) which is consistant with our model, being that
4

33Discussion and Conclusions
stimulation by AKH firstly leads to synthesis of Ins(1,4,5)P3 by PLC.
This synthesis is possibly followed by phosphorylation to InsP4 or higher,
and subsequently by dephosphorylation to InsP2 and InsP
1, as described
by Batty [1989] and in Fig. 5. Suprisingly, but consistent with the low
rise in InsP levels induced by AKH-II, no significant rise in InsP3 levels
was seen for AKH-II at 1 minute. This is even more suprising because
AKH-II is equally potent in activating calcium influx into the fat body as
AKH-I and -III [Vroemen 1995b]. Because the effect of AKH-II on cal-
cium influx is within 1 minute, the small rise in InsP3 levels at 2.5 minutes
(and even more at 15 minutes) can not account for the induction of cal-
cium influx. In accordance with the total InsP determination, AKH-I-
induced InsP3 levels return to basal levels at 2.5 minutes. Suprisingly,
AKH-I and -II show an accumulation of the highly phosphorylated InsPs
at longer incubations, instead of the lowly phosphorylated ones that AKH-
III induces (as expected because of the presence of lithium). At 15 min-
utes InsP3 levels are relatively low, which supports the idea of the second
phase being of less physiological importance. Because the assay using
radioactive inositol can not discriminate between the different forms of
InsP3, a specific Ins(1,4,5)P
3 assay was done.
This radio-immuno assay showed a significant increase in Ins(1,4,5)P3
levels induced by 40 nM of the three AKHs, although the level induced
by AKH-II was again lower then those induced by AKH-I and -III. It
could be possible that AKH-II uses another pathway (via other InsPs or
even DAG), but this seems unlikely because with a physiological dose of
4 nM hormone the three AKHs induce equal Ins(1,4,5)P3 levels, so this
dose is probably enough to induce calcium influx into the fat body. AKH-
I and -III display a dose-response relationship for hormone-induced
Ins(1,4,5)P3 formation, but AKH-II does not. It seems that AKH-II is
less efficacious than AKH-I and -III. For both AKH-I and -II, Ins(1,4,5)P3
levels return to the control level after 15 minutes (40 nM hormone) as
could be expected for a second messenger. AKH-III-induced Ins(1,4,5)P3
levels though remain high after 15 minutes, suggesting some kind of long
term effect for AKH-III. No such long term effect can be seen in the
induction of calcium influx though.
The fact that, for AKH-II at 1 minute, InsP3 could be found in the
radio-immuno assay but not in the individual InsP determination reveals
the biggest problems of the latter assay, being the lower sensitivity and
the fact that this assay can not discriminate between Ins(1,4,5)P3 and
Ins(1,3,4)P3. Another problem we encountered was that there was no

34Discussion and Conclusions
radioactive standard for InsP5 and/or InsP
6. This prevented us from de-
termining whether or not InsP5 is eluted from the column at 410 nM
(thereby possibly contaminating the InsP4 fraction). So the value of 410
nM for the elution-concentration of InsP4 is a little arbitrairy as we could
not determine the overlap with InsP5.
A problem encountered in all our tests done with locusts is the high
variability between the animals. An attempt to meet this problem was
done by Lee [1995] who found a way to create dispersed fat body cells
suitable to do assays on. Because our protocols were already running
when this technique became available, and because of the lack of time to
restart our assays, we did not use this method for this research. Seperate
fat body cells, however, do have a great potential for this research and
further exploration of this method should certainly be done.
The results of this research provide no direct reason to change our
proposed model. The role of InsPs though, could turn out to be more
complicated then our model suggests. Irvine suggests roles for other InsPs,
such as InsP4, in the regulation of calcium influx induced by emptying of
the intracellular calcium stores [Irvine 1990, Irvine 1991, Irvine 1992].
The influx of calcium into the locust fat body could well be regulated by
InsP4, especially because we found rises in InsP
4 for each AKH at each
time point. In our lab, Van Marrewijk [1996] has suggested that
Ins(1,3,4,5)P4 may serve as a pool from which Ins(1,4,5)P
3 could be rap-
idly synthesized when needed. Although we know already a lot about the
role of InsPs in signal transduction, still a lot of research has to be done.
Lets go for it !!!

35References
ReferencesBatty I.H., Letcher A.J., Nahorski S.R. (1989). Accumulation of inosi-
tol polyphosphate isomers in agonist stimulated cerebral-cortex slices.Comparison with metabolic profiles in cell-free preparations. Biochem.J., 258, 23-32
Berridge M.J. (1995). Capacitative calcium entry. Biochem. J., 312,1-11
Berridge M.J., Dawson R.M.C., Downes C.P., Heslop J.P., Irvine R.F.(1983). Changes in the levels of inositol phosphates after agonist-de-pendent hydrolysis of membrane phosphoinositides. Bioch. J., 212, 473-482
Berridge M.J., Irvine R.F. (1989). Inositol phosphates and cell signal-ling. Nature, 341, 197-205
Changya L., Gallacher D.V., Irvine R.F., Petersen O.H. (1989a). Inosi-tol 1,3,4,5-tetrakisphosphate nad inositol 1,4,5-trisphosphate act by dif-ferent mechanisms when controlling Ca2+ in mouse lacrimal acinar cells.FEBS Lett., 251, 43-48
Changya L., Gallacher D.V., Irvine R.F., Potter B.V.L., Petersen O.H.(1989b). inositol 1,3,4,5-tetrakisphosphate is essential for the sustainedactivation of the Ca2+-dependent K+ current in single internally perfusedmouse lacrimal acinar cells. J. Memb. Biol., 109, 85-93
Dean R.B., Dixon W.J. (1951). Simplified statistics for small numbersof observations. Anal. Chem., 23, 636-638
Gilman A.G. (1995). G proteins and the regulation of adenylyl cyclase.Bioscience Rep., 15, 65-97
Irvine R.F. (1990). ‘Quantal’ Ca2+ release and the control of Ca2+ entryby inositol phosphates - a possible mechanism. FEBS Lett., 263, 5-9
Irvine R.F. (1991). Inositol tetrakisphosphate as a second messenger:confusions, contradictions, and a potential resolution. Bioessays, 13, 419-428
Irvine R.F. (1992). Is inositol tetrakisphosphate the second messengerthat controls Ca2+ entry into cells? In Inositol Polyphosphates and Cal-cium Signalling (Putney J.W. Jr., ed) pp. 161-185, Raven, New York
Lee M.J., Goldsworthy J. (1995). The preparation of dispersed cellsfrom fat body of the Locusta migratoria in a filtration plate asaay foradipokinetic peptides. Anal. Biochem., 288, 155-161
R

36References
Oudejans R.C.H.M., Kooiman F.P., Heerma W., Versluis C., SlotboomA.J. en Beenakkers A.M.Th. (1991). Isolation and structure elucidationof a novel adipokenetic hormone (Lom-AKH-III) from the glandular lobesof the corpus cardiacum of the migratory locust, Locusta migratoria.Eur. J. Biochem., 195, 351-359
Powell J.F.F., Zohar Y., Elizur A., Park M., Fischer W.H., Craig A.G.,Rivier J.E., Lovejoy D.A., Sherwood N.M. (1994). Three forms of go-nadotropin-releasing hormone characterized from the brain of one spe-cies. Proc. Acad. Sci. USA, 91, 12081-12085
Putney J.W. Jr. (1986). A model for receptor-regulated calcium entry.Cell Calcium, 7, 1-12
Putney J.W. Jr.. (1990). Capacitative calcium entry revisited. Cell Cal-cium, 11, 611-624
Schacterle G.R., Pollack R.L. (1973). A simplified method for the quan-titative assay of small amounts of protein in biological material. Anal.Biochem., 654-655
Sokal R.R., Rohlf F.J. (1969). Two way analysis of variance. In:Biometry (Emerson R., Kennedy D., Park R.B., Beadle G.W., WithakerD.M., Eds.). pp. 299-366. Freeman, San Fransisco
Sower S.A., Chiang Y.-C., Lavas S., Conlon J.M. (1993). Primary struc-ture and biological activity of a third gonadotropin-releasing hormonefrom the lamprey brain. Endocrinology, 132, 1125-1131
Van Marrewijk W.J.A., Van den Broek A.Th.M., Beenakkers A.M.Th.(1980). Regulation of glycogenolysis in the locust fatbody during flight.Insect Biochem., 10, 675-679
Van Marrewijk W.J.A., Van den Broek A.Th.M., Beenakkers A.M.Th.(1983). Regulation of glycogen phosphrylase activity in fat body ofLocusta migratoria and Periplaneta americana. Gen. comp. Endocrinol.,50, 266-234
Van Marrewijk W.J.A., Van den Broek A.Th.M., Gielbert M.-L., Vander Horst D.J. (1996). Insect adipokinetic hormone stimulates inositolphosphate metabolism: roles for both Ins(1,4,5)P
3 and Ins(1,3,4,5)P
4 in
signal transduction? Mol. Cell. Endocrinol., in press
Van Marrewijk W.J.A., Van den Broek A.Th.M., Van der Horst D.J.(1993). Adipokinetic hormone-induced influx of extracellular calciuminto insect fat body cells is mediated through depletion of intracellularcalcium stores. Cell. Signalling, 5, 753-761

37References
Vroemen S.F., Van Marrewijk W.J.A., Van der Horst D.J. (1995a).Stimulation of glycogenolysis by three locust adipokinetic hormones in-volves G
s and cAMP. Mol. Cell. Endocrinol., 107, 165-171
Vroemen S.F., Van Marrewijk W.J.A., Schepers C.C.J., Van der HorstD.J. (1995b). Signal transduction of adipokinetic hormones involves Ca2+
fluxes and depends on extracellular Ca2+ to potentiate cAMP-inducedactivation of glycogen phosphorylase. Cell Calcium, 17, 459-467

38Supplement
SSupplement
The table shows the composition of the used media and buffers. DTE
and trehalose were added just before use of the medium. Buffer II also
contains 0.002 % BSA.
mMMedium Buffer
I II III IV XI XV I II
NaCl 149 140 110 110 100
KCl 15 15 15 15 15
MgCl2 4 4 4 4
CaCl2(2 aq) 2 2 2
NaH2PO4*2H2O 4
NaHCO3 4
HEPES 50 10 10 10 10 10
Trehalose 80 80
Glucose 20 20
DTE 2 2 3.5
NaF 20
EDTA 5 5
Imidazol 12.5 5
k-phosphatebuffer 100 20
MgAc 1
pH 7 7.2 7.2 7.2 7.2 7.2 7 7

39Acknowledgements
AAcknowledgements
I would like to thank Dick van der Horst for his great positive influ-
ence. He was, and is, always interested and positive about everything
you (try to) do, not just concerning work but also private.
Next, I would like to thank Wil van Marrewijk for his good advice and
our nice teabreaks. To both I would say; check your e-mail regularly!
And of course, Aloys van den Broek, who will always think of just that
little experiment you should do. A man with really great scientific knowl-
edge.
I also want to thank Hans Jonker and Wilbert Jansen for there partner-
ship through the years of my study biology.
Not last and certainly not least (how cheap), I would like to thank
Simon “topper” Vroemen, for his great guidence throughout the last 15
months he had to cope with me. Thanks for all the work you’ve done for
me, and for all those nice drinks and dinners we had and will have in the
future.
Thanks to everybody else who made the Biochemical Physiology Re-
search Group such a nice place to be. I’ll miss it, and whenever you guys
need an AIO..........
And Dick, I ment it when I said; “When you need somebody to help
during the differentation course, you’ll know where to find me!”. Thanks
for letting me assist in this course by the way.