the role of epidemiology in the pharmaceutial industry ... · the role of epidemiology in the...
TRANSCRIPT
The Role of Epidemiology in the
Pharmaceutial Industry – Safety
and Effectiveness
NANCY SANTANELLO, MD, MS, FISPE
INDEPENDENT CONSULTANT AND FORMER VP EPIDEMIOLOGY MERCK RESEARCH LABORATORIES
JOHNS HOPKINS UNIVERSITY SCHOOL OF PUBLIC HEALTH
DECEMBER 14, 2015

2Conflict of Interest Declaration
Independent consultant
Previously employed:
• Merck & Co, Inc.,
• National Heart, Lung and Blood
Institute, NIH
3
Agenda:
Disease epidemiology, natural history, biomarkers
Clinical and patient measurement
Safety and Effectiveness– understanding safety during
development and post-marketing and effectiveness post-
marketing
The Role of Epidemiology in the
Pharmaceutial Industry – Safety and Effectiveness

Merck Epidemiology Department Founded
in 1985 by Dr. Harry Guess
Photograph is from
the early 1990s
By 2014 there were
approximately 65
members in the
Department in 4
countries

5Epidemiology is Foundation for
Drug and Vaccine Development
“...to understand the Drug or Vaccine, it is necessary to understand the Disease*”
Harry Guess – Merck Vice President and Head Epidemiology (1985-2003)
*Reference: Guess, Jacobsen, Girman, et al. The Role of Community Studies in Interpreting Treatment Effects. Medical Care. 1995; 33(4): AS26-AS35.
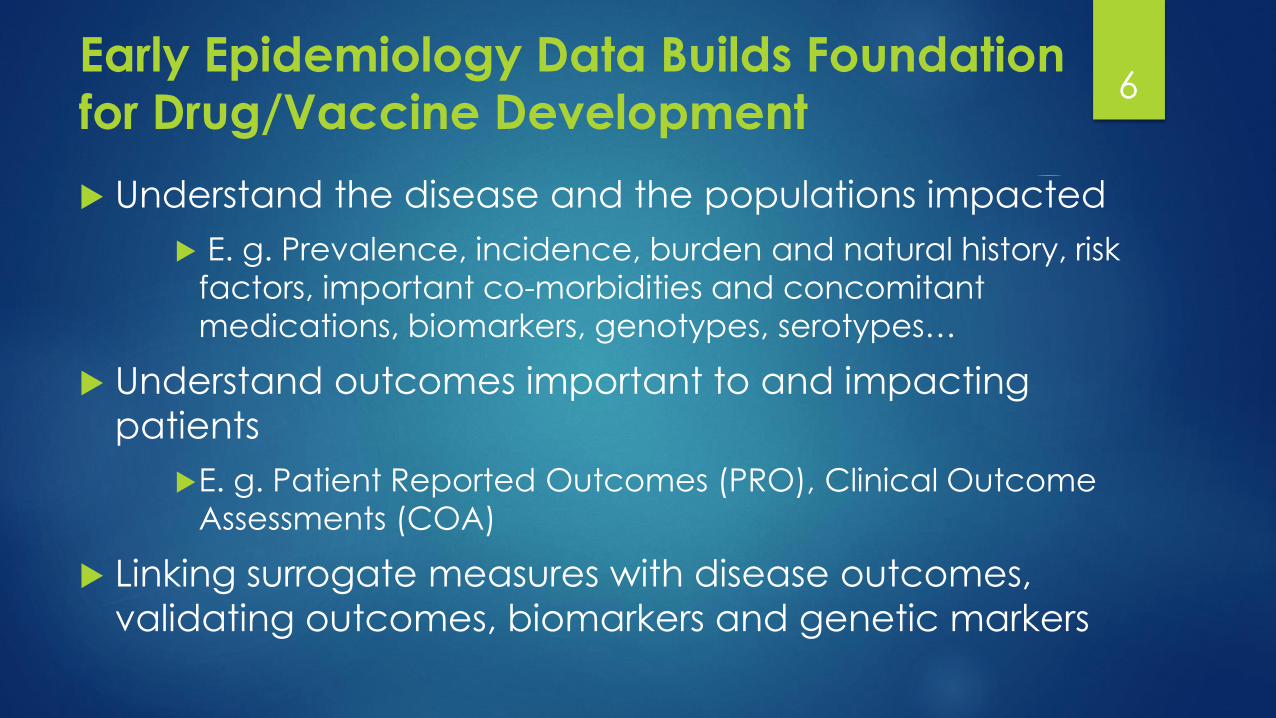
Early Epidemiology Data Builds Foundation
for Drug/Vaccine Development
Understand the disease and the populations impacted
E. g. Prevalence, incidence, burden and natural history, risk
factors, important co-morbidities and concomitant
medications, biomarkers, genotypes, serotypes…
Understand outcomes important to and impacting
patients
E. g. Patient Reported Outcomes (PRO), Clinical Outcome
Assessments (COA)
Linking surrogate measures with disease outcomes,
validating outcomes, biomarkers and genetic markers
6

7
Activities in the Phases of Drug and
Vaccine Development
Post-
marketing
clinical trials
–additional
patient
subgroups,
new
indications,
combination
therapies,
endpoint trials
Proof of
Concept and
Dose
Ranging
randomized
clinical trials -
dose(s),
efficacy and
safety
Ph I studies
healthy
volunteers to
understand
ADME, PK,
PD, drug
interactions,
special groups
Preclinical
DevelopmentI IIa&b III IV/V
Discovery -
chemical &
biological
characterization
Safety & toxicity
studies in
animals;
formulation
development
PhIII pivotal
randomized
clinical trials
–characterize
efficacy and
safety
Clinical Development

8
Epidemiology Activities In Phases of
Drug and Vaccine Development
Develop
functional and/or
patient reported
outcomes
(PROs) or
clinical
endpoints
(COAs)
Descriptive Epidemiology studies to understand disease and population
Linking biomarkers/genetic markers to disease outcomes
Validate
PROs/clinical
endpoints
Trial planning activities/recruitment issues: selecting RCT design,
population, treatment, duration
Preclinical
DevelopmentI IIa&b III IV/V
Risk management planning;
Pharmacoepidemiology
studies/analyses to address
product safety & understand
risks in population with disease

Early Development Use of Epidemiology
Studies/Activities
Clinical – help define study endpoints, population, duration of trial, serotypes, interpret clinical trial results based on natural history of disease and expected AEs, develop/validate/standardize clinical measures
Regulatory – understand background rates of Adverse Events in population, define importance of disease in specific sub-groups, compliance with PRO Guidance, help define what is clinically meaningful change or effect size to patients
Commercial – help define market potential through prevalence and incidence estimates, define burden of illness, provide data for health economic models for reimbursement dossiers
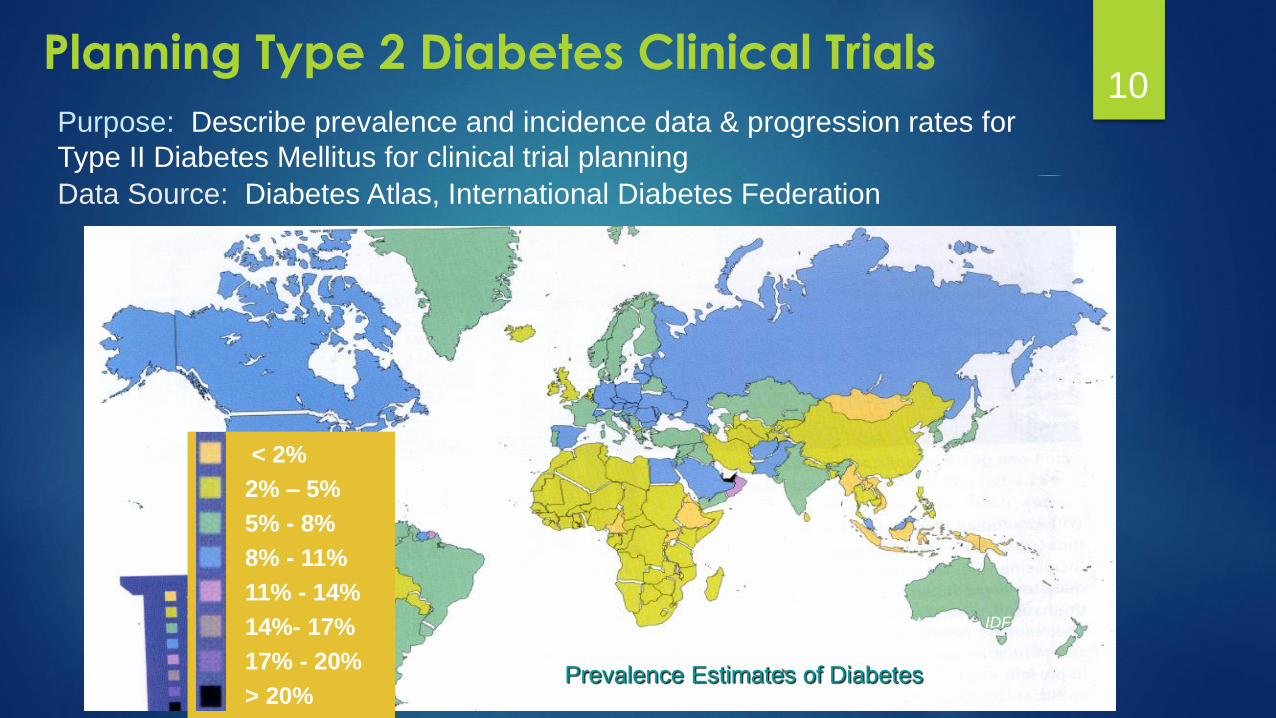
10Planning Type 2 Diabetes Clinical Trials
< 2%
2% – 5%
5% - 8%
8% - 11%
11% - 14%
14%- 17%
17% - 20%
> 20%
Source: Diabetes Atlas, IDF, 2003
Prevalence Estimates of Diabetes
Purpose: Describe prevalence and incidence data & progression rates for
Type II Diabetes Mellitus for clinical trial planning
Data Source: Diabetes Atlas, International Diabetes Federation

11
Time to A1c>8% with MF+SU 1
Trial duration of 2 years
duration likely sufficient to
show differences in
durability
1Cook, Girman, Stein, Alexander, Holman. Diabetes Care 2005; 28(5): 995-1000
Determine Ideal Duration of Treatment for T2DM Trial
Baseline A1c
>10%
9-9.9%
8-8.9%
4-7.9%
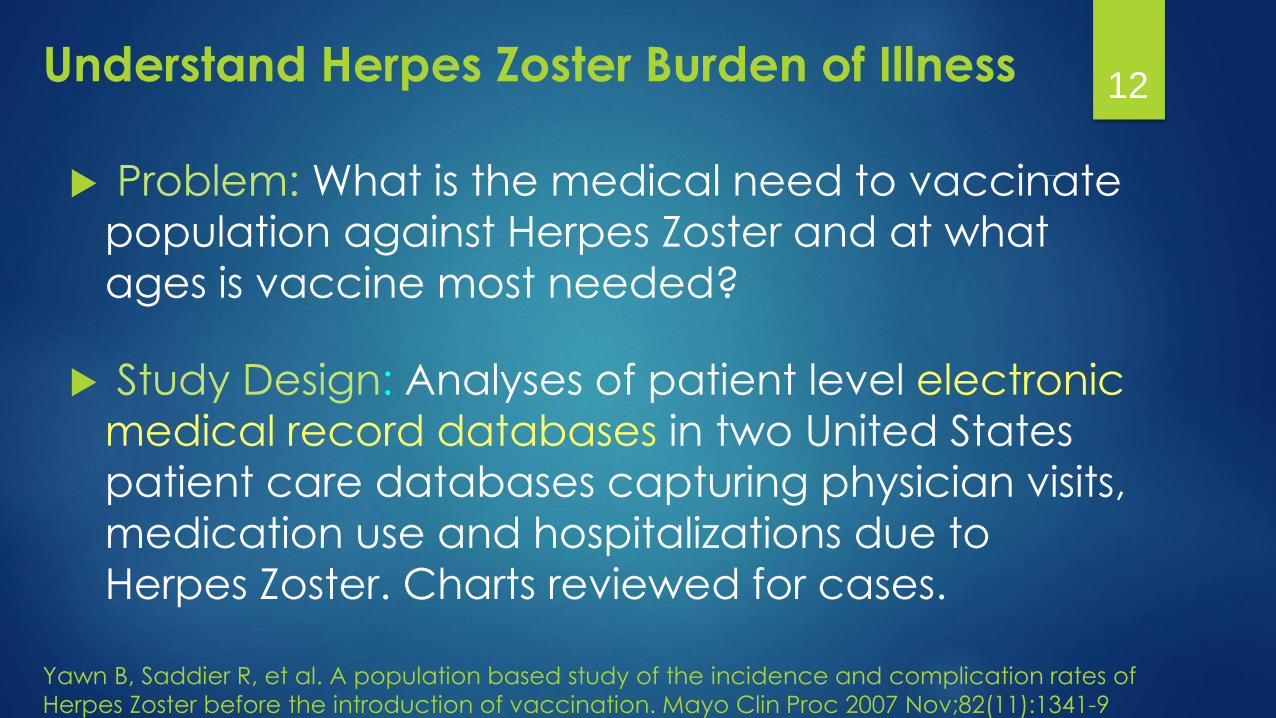
12Understand Herpes Zoster Burden of Illness
Problem: What is the medical need to vaccinate
population against Herpes Zoster and at what
ages is vaccine most needed?
Study Design: Analyses of patient level electronic
medical record databases in two United States
patient care databases capturing physician visits,
medication use and hospitalizations due to
Herpes Zoster. Charts reviewed for cases.
Yawn B, Saddier R, et al. A population based study of the incidence and complication rates of
Herpes Zoster before the introduction of vaccination. Mayo Clin Proc 2007 Nov;82(11):1341-9

13
age group
inci
denc
e ra
te p
er 1
000
pers
on-y
ears
05
1015
22-29 30-39 40-49 50-59 60-69 70-79 80+
menwomenall
Herpes Zoster (HZ) Incidence by Age and Sex
• Average of 3 ambulatory visits per Herpes Zoster patient• > 70% of HZ cases receive antiviral drugs and 4% of HZ cases hospitalized
MaleFemale
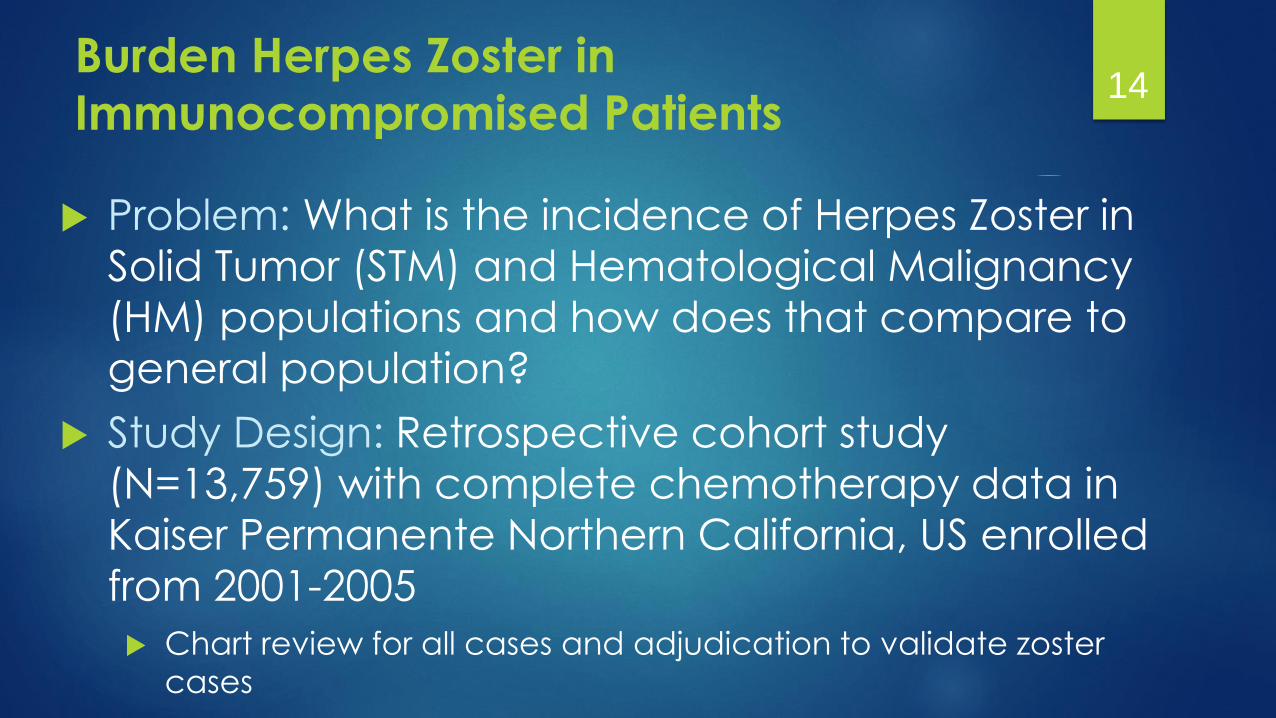
14Burden Herpes Zoster in
Immunocompromised Patients
Problem: What is the incidence of Herpes Zoster in
Solid Tumor (STM) and Hematological Malignancy
(HM) populations and how does that compare to
general population?
Study Design: Retrospective cohort study
(N=13,759) with complete chemotherapy data in
Kaiser Permanente Northern California, US enrolled
from 2001-2005
Chart review for all cases and adjudication to validate zoster
cases

15
HZ Cumulative Incidence by Type of Cancer
Compared to individuals of similar age and sex in the general
population, rates of HZ were approximately 5-fold higher in
patients with HM and 1.8-fold higher in patients with STM

16
Agenda:
Disease epidemiology, natural history
Clinical and patient measurement
Safety and Effectiveness– understanding safety during
development and post-marketing and effectiveness post-
marketing
The Role of Epidemiology in the
Pharmaceutial Industry – Safety and Effectiveness
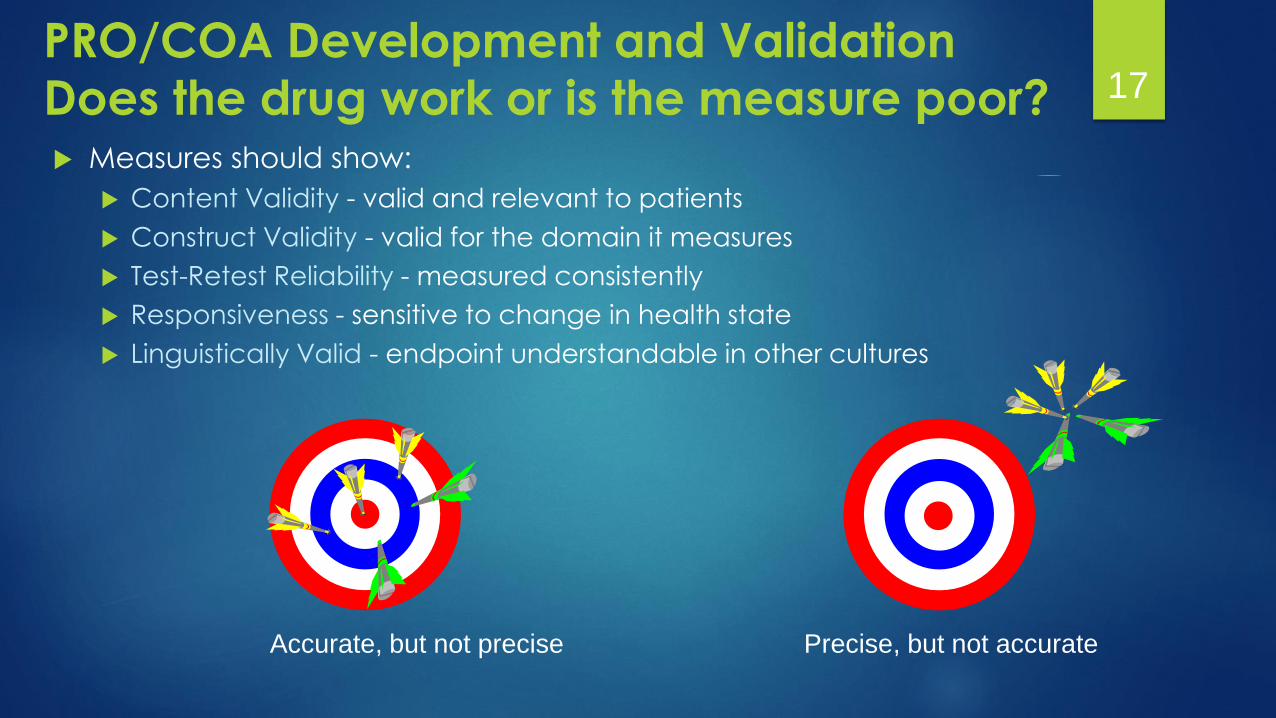
17PRO/COA Development and Validation
Does the drug work or is the measure poor? Measures should show:
Content Validity - valid and relevant to patients
Construct Validity - valid for the domain it measures
Test-Retest Reliability - measured consistently
Responsiveness - sensitive to change in health state
Linguistically Valid - endpoint understandable in other cultures
Accurate, but not precise Precise, but not accurate
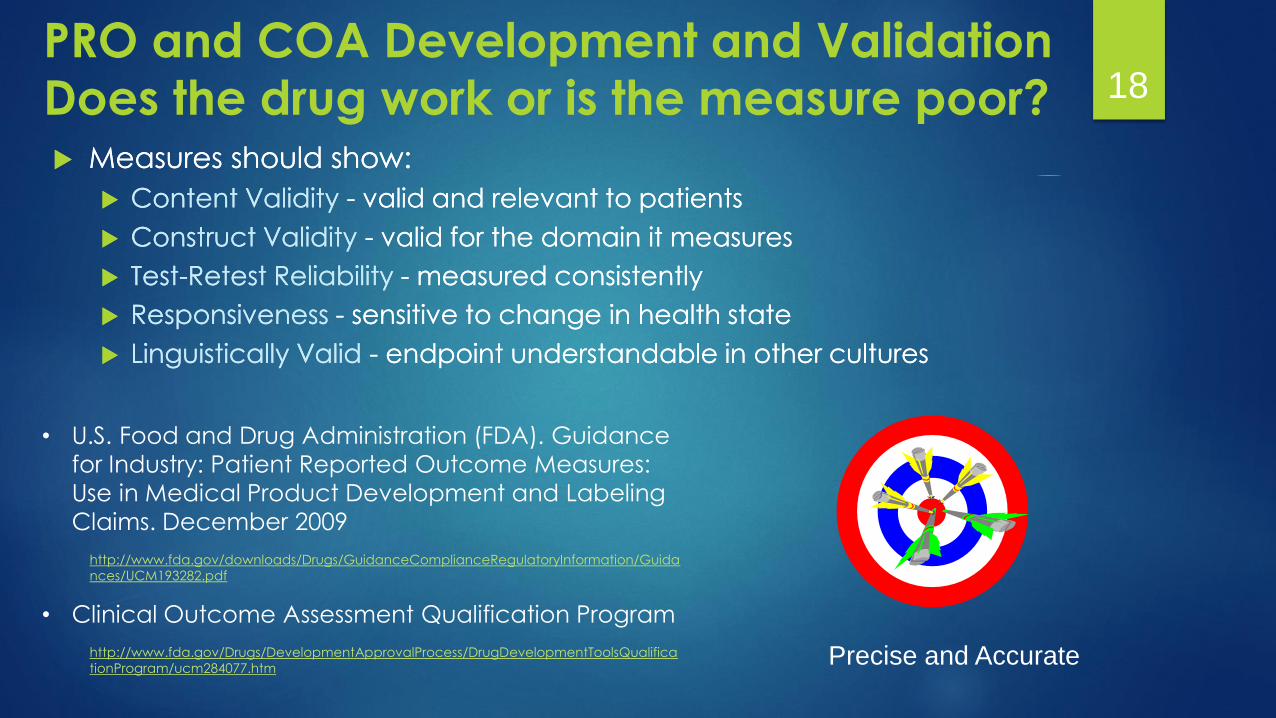
18PRO and COA Development and Validation
Does the drug work or is the measure poor? Measures should show:
Content Validity - valid and relevant to patients
Construct Validity - valid for the domain it measures
Test-Retest Reliability - measured consistently
Responsiveness - sensitive to change in health state
Linguistically Valid - endpoint understandable in other cultures
Precise and Accurate
Measures should show:
Content Validity - valid and relevant to patients
Construct Validity - valid for the domain it measures
Test-Retest Reliability - measured consistently
Responsiveness - sensitive to change in health state
Linguistically Valid - endpoint understandable in other cultures
• U.S. Food and Drug Administration (FDA). Guidance
for Industry: Patient Reported Outcome Measures:
Use in Medical Product Development and Labeling
Claims. December 2009
http://www.fda.gov/downloads/Drugs/GuidanceComplianceRegulatoryInformation/Guida
nces/UCM193282.pdf
• Clinical Outcome Assessment Qualification Program
http://www.fda.gov/Drugs/DevelopmentApprovalProcess/DrugDevelopmentToolsQualifica
tionProgram/ucm284077.htm
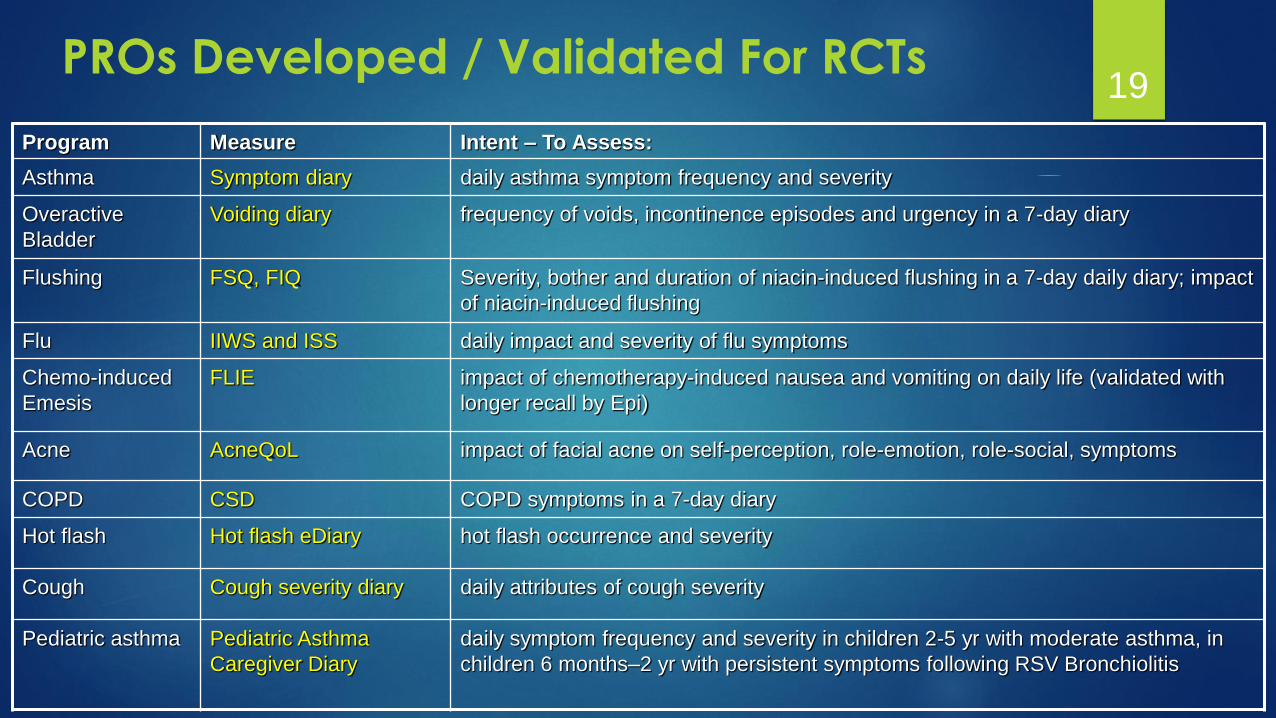
19PROs Developed / Validated For RCTs
Program Measure Intent – To Assess:
Asthma Symptom diary daily asthma symptom frequency and severity
Overactive
Bladder
Voiding diary frequency of voids, incontinence episodes and urgency in a 7-day diary
Flushing FSQ, FIQ Severity, bother and duration of niacin-induced flushing in a 7-day daily diary; impact
of niacin-induced flushing
Flu IIWS and ISS daily impact and severity of flu symptoms
Chemo-induced
Emesis
FLIE impact of chemotherapy-induced nausea and vomiting on daily life (validated with
longer recall by Epi)
Acne AcneQoL impact of facial acne on self-perception, role-emotion, role-social, symptoms
COPD CSD COPD symptoms in a 7-day diary
Hot flash Hot flash eDiary hot flash occurrence and severity
Cough Cough severity diary daily attributes of cough severity
Pediatric asthma Pediatric Asthma
Caregiver Diary
daily symptom frequency and severity in children 2-5 yr with moderate asthma, in
children 6 months–2 yr with persistent symptoms following RSV Bronchiolitis

20Endpoint Selection/Evaluation for RCTs
Evaluate cognition test battery as a valid biomarker in early studies of
Alzheimer’s Disease and cognitive disorders
Studies: Cognition tests in healthy elderly, mild cognitive impairment,
and Alzheimer’s Disease, and Study of Cognition in Schizophrenia
attention
processing
speedmemory
Epidemiology studies
link cognitive
measures to
outcomes
executive
function
•Clinical Outcomes
•Disease ProgressionValidate
Cognition
Test
Battery
Outcomes

21
Agenda:
Disease epidemiology, natural history
Clinical and patient measurement
Safety and Effectiveness– understanding safety during
development and post-marketing and effectiveness post-
marketing
The Role of Epidemiology in the
Pharmaceutial Industry – Safety and Effectiveness

22Development of Pharmacoepidemiology
Safety is the driving force for development of
pharmacoepidemiology as a unique discipline
“Pharmacoepidemiology is the study of the use of
and the effects of drugs and vaccines in large
numbers of people.”*
The realization that rare adverse effects of drugs or
vaccines could be better understood through the
application of epidemiological research methods gave
rise to pharmacoepidemiology
* Brian Strom, Pharmacoepidemiology, 4th edition (Wiley 2005)
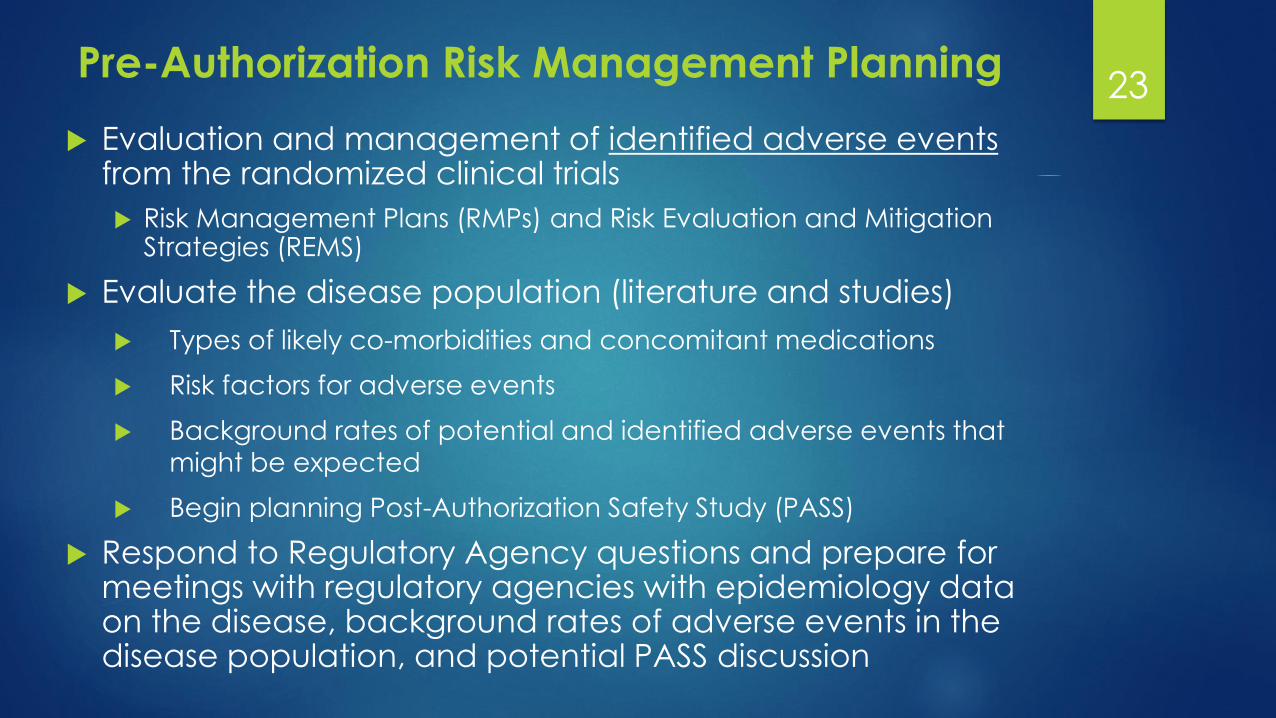
23Pre-Authorization Risk Management Planning
Evaluation and management of identified adverse eventsfrom the randomized clinical trials
Risk Management Plans (RMPs) and Risk Evaluation and Mitigation Strategies (REMS)
Evaluate the disease population (literature and studies)
Types of likely co-morbidities and concomitant medications
Risk factors for adverse events
Background rates of potential and identified adverse events that
might be expected
Begin planning Post-Authorization Safety Study (PASS)
Respond to Regulatory Agency questions and prepare for meetings with regulatory agencies with epidemiology data on the disease, background rates of adverse events in the disease population, and potential PASS discussion
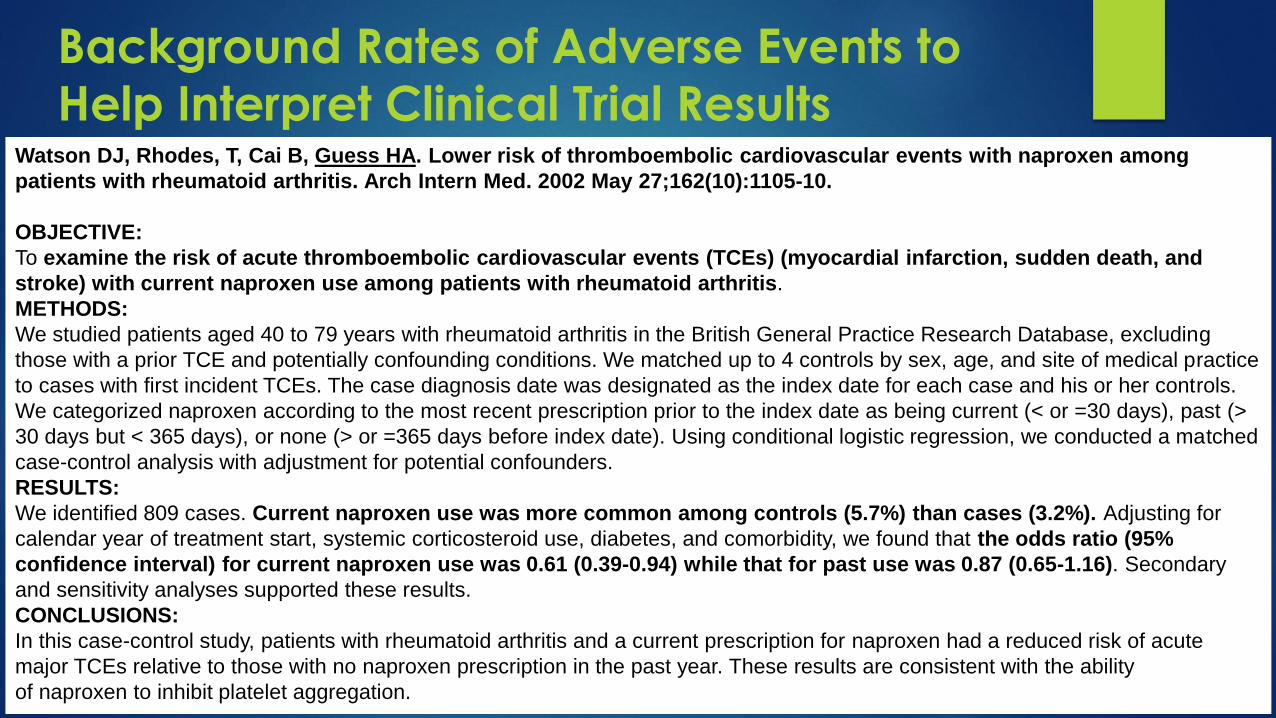
Background Rates of Adverse Events to
Help Interpret Clinical Trial ResultsWatson DJ, Rhodes, T, Cai B, Guess HA. Lower risk of thromboembolic cardiovascular events with naproxen among
patients with rheumatoid arthritis. Arch Intern Med. 2002 May 27;162(10):1105-10.
OBJECTIVE:
To examine the risk of acute thromboembolic cardiovascular events (TCEs) (myocardial infarction, sudden death, and
stroke) with current naproxen use among patients with rheumatoid arthritis.
METHODS:
We studied patients aged 40 to 79 years with rheumatoid arthritis in the British General Practice Research Database, excluding
those with a prior TCE and potentially confounding conditions. We matched up to 4 controls by sex, age, and site of medical practice
to cases with first incident TCEs. The case diagnosis date was designated as the index date for each case and his or her controls.
We categorized naproxen according to the most recent prescription prior to the index date as being current (< or =30 days), past (>
30 days but < 365 days), or none (> or =365 days before index date). Using conditional logistic regression, we conducted a matched
case-control analysis with adjustment for potential confounders.
RESULTS:
We identified 809 cases. Current naproxen use was more common among controls (5.7%) than cases (3.2%). Adjusting for
calendar year of treatment start, systemic corticosteroid use, diabetes, and comorbidity, we found that the odds ratio (95%
confidence interval) for current naproxen use was 0.61 (0.39-0.94) while that for past use was 0.87 (0.65-1.16). Secondary
and sensitivity analyses supported these results.
CONCLUSIONS:
In this case-control study, patients with rheumatoid arthritis and a current prescription for naproxen had a reduced risk of acute
major TCEs relative to those with no naproxen prescription in the past year. These results are consistent with the ability
of naproxen to inhibit platelet aggregation.

Rapidly changing environment over past 10 years
Increased use of patient health care databases (claims and
electronic medical records) in addition to traditional methods
focused on spontaneous adverse events evaluation
Regulations from US FDA and EMA requiring conduct of Post-
Authorization Safety Studies (PASS)
FDA and EMA Initiatives to evaluate safety using observational (non-
interventional studies):
FDA Sentinel Initiative
EMA Pharmacovigilance Risk Assessment Committee (PRAC) and ENCePP
Initiatives
Post-Authorization Safety 25
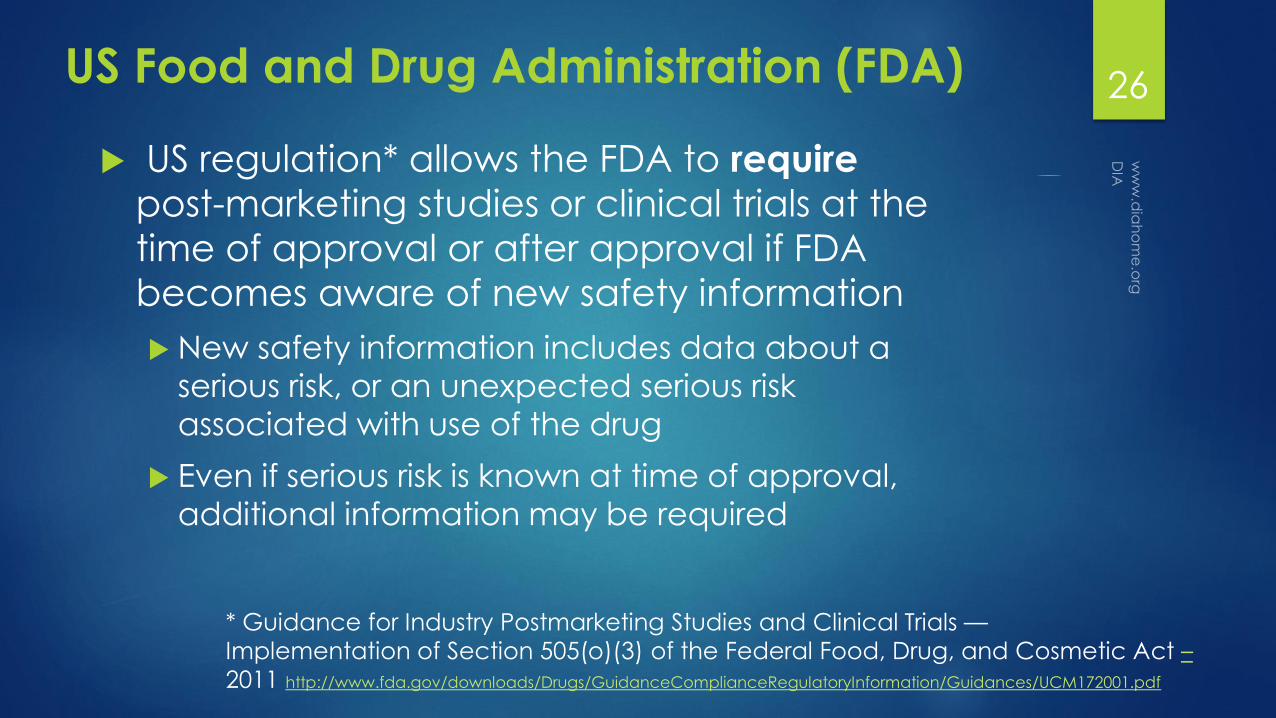
US regulation* allows the FDA to require
post-marketing studies or clinical trials at the
time of approval or after approval if FDA
becomes aware of new safety information
New safety information includes data about a
serious risk, or an unexpected serious risk
associated with use of the drug
Even if serious risk is known at time of approval,
additional information may be required
US Food and Drug Administration (FDA) 26
* Guidance for Industry Postmarketing Studies and Clinical Trials —
Implementation of Section 505(o)(3) of the Federal Food, Drug, and Cosmetic Act –
2011 http://www.fda.gov/downloads/Drugs/GuidanceComplianceRegulatoryInformation/Guidances/UCM172001.pdf
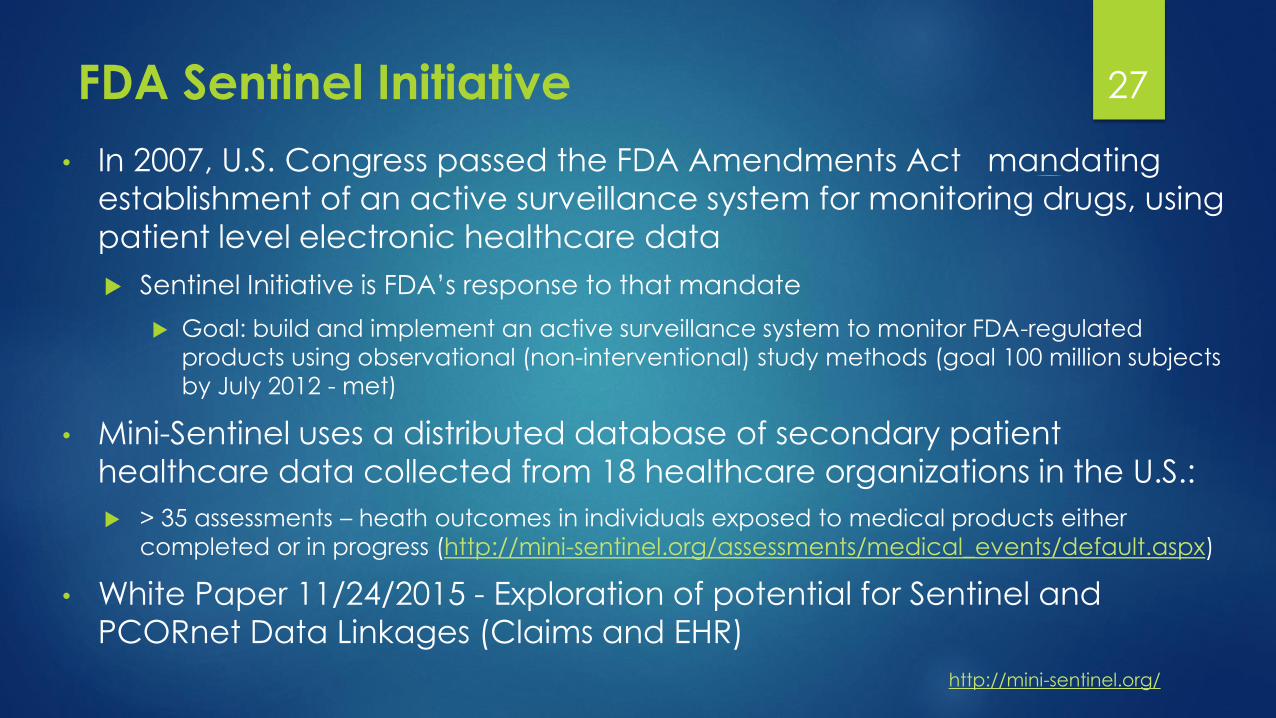
• In 2007, U.S. Congress passed the FDA Amendments Act mandating
establishment of an active surveillance system for monitoring drugs, using
patient level electronic healthcare data
Sentinel Initiative is FDA’s response to that mandate
Goal: build and implement an active surveillance system to monitor FDA-regulated
products using observational (non-interventional) study methods (goal 100 million subjects
by July 2012 - met)
• Mini-Sentinel uses a distributed database of secondary patient
healthcare data collected from 18 healthcare organizations in the U.S.:
> 35 assessments – heath outcomes in individuals exposed to medical products either
completed or in progress (http://mini-sentinel.org/assessments/medical_events/default.aspx)
• White Paper 11/24/2015 - Exploration of potential for Sentinel and
PCORnet Data Linkages (Claims and EHR)
FDA Sentinel Initiative 27
http://mini-sentinel.org/

Post-Authorization Safety Study (PASS) is carried out after a
medicine has been authorized to obtain further
information on a medicine's safety, or to measure the
effectiveness of risk-management measures
Evaluate the safety and benefit-risk profile of a medicine
and support regulatory decision-making: identify, characterize or quantify a safety hazard;
confirm the safety profile of a medicine, or;
measure the effectiveness of risk-management measures
EMA Pharmacovigilance Risk Assessment Committee
(PRAC) is responsible for assessing the protocols of
imposed PASSs and for assessing their results
European Medicines Agency (EMA)28
http://www.ema.europa.eu/ema/index.jsp?curl=pages/regulation/document_listing/document_listing_000377.jsp&mid=WC0b01ac058066e979

Marketing-authorization holders (MAHs) are obliged
to carry out imposed PASS
Include studies that are a specific obligation for
a marketing authorization granted under exceptional
circumstances
Other studies that the PRAC requests the MAH to carry out
Voluntary PASS are sponsored or conducted by
MAHs on their own initiative
PASS can be interventional or non-interventional
EMA PASS website provides both PASS protocol and
report templates
Imposed and Voluntary PASS 29

30Pharmacoepidemiology in Safety
Assessment and Evaluation Post-Approval
Further understand product safety in larger populations - conduct post-approval safety and drug utilization analyses and studies
Patterns of drug utilization - who is using product and how product is used in real world use
Understand safety in subgroups and special populations
Understand risk factors for adverse events
Safety relative to other drugs for the same indication
Determine new or very rare adverse events
Understand risk as compared to benefit
Develop reliable methods and study designs to increase reliability of observational studies
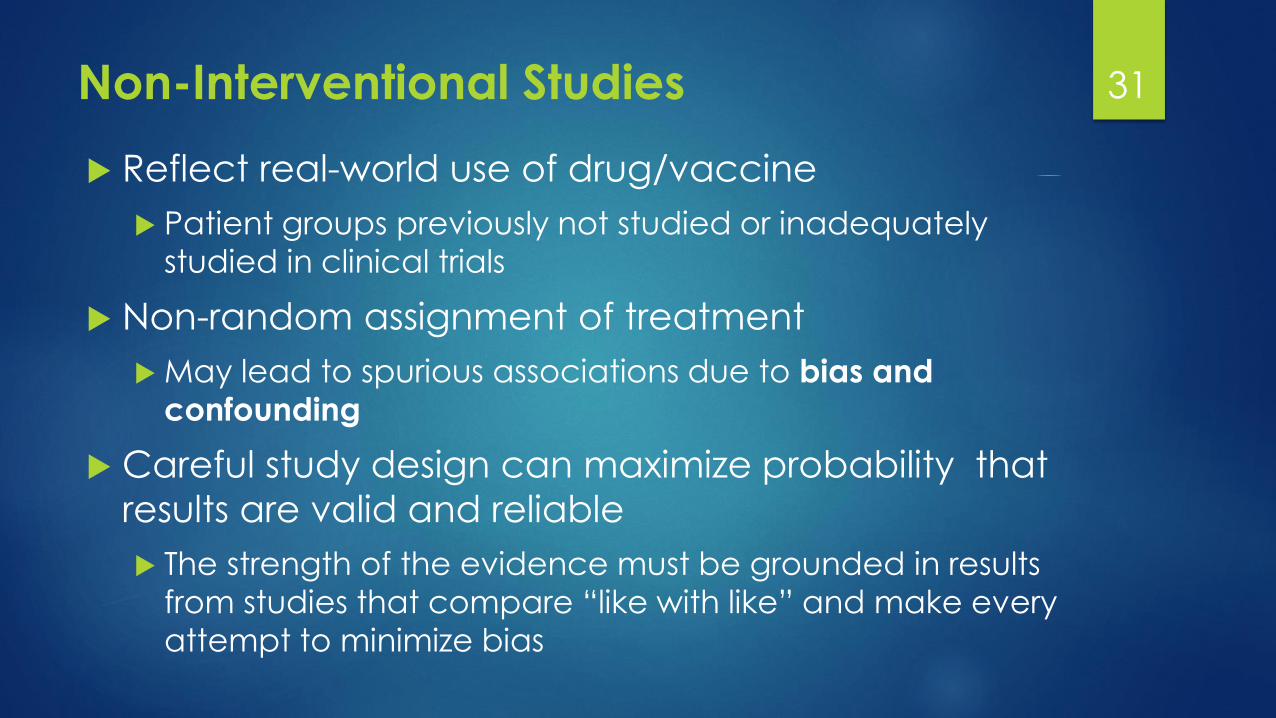
Reflect real-world use of drug/vaccine
Patient groups previously not studied or inadequately
studied in clinical trials
Non-random assignment of treatment
May lead to spurious associations due to bias and
confounding
Careful study design can maximize probability that
results are valid and reliable
The strength of the evidence must be grounded in results
from studies that compare “like with like” and make every
attempt to minimize bias
Non-Interventional Studies 31

Primary data collection and analyses:
Enroll patients and measure characteristics and outcomes prospectively
Review and collect data from patient medical charts
Can be tailored to the research question
More expensive and labor intensive
Secondary data analyses (increasing use):
Existing patient level data
Existing patient cohorts, registers, registries, health insurance claims, electronic medical record databases and distributed linked databases (e.g. FDA Sentinel)
Depends on available data (size, outpatient, inpatient, duration, labs, procedures, behavioral data)
Less expensive and less labor intensive
Types of Non-Interventional PASS 32
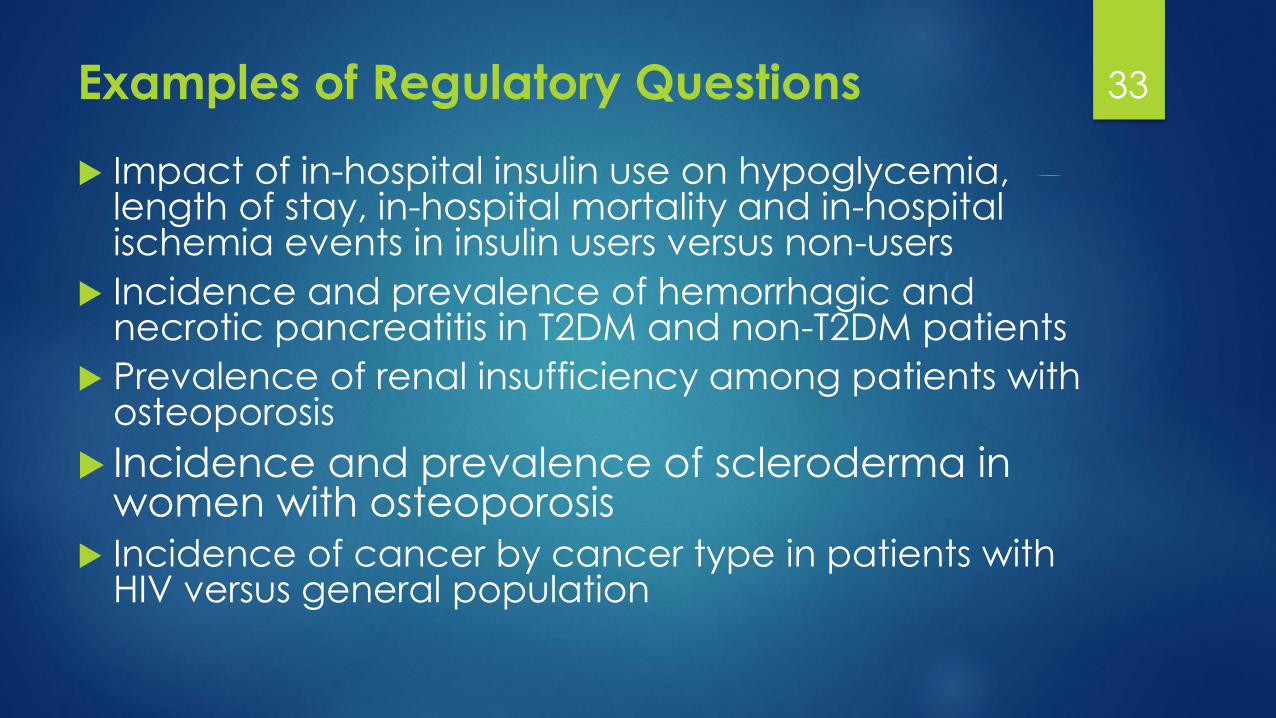
33Examples of Regulatory Questions
Impact of in-hospital insulin use on hypoglycemia, length of stay, in-hospital mortality and in-hospital ischemia events in insulin users versus non-users
Incidence and prevalence of hemorrhagic and necrotic pancreatitis in T2DM and non-T2DM patients
Prevalence of renal insufficiency among patients with osteoporosis
Incidence and prevalence of scleroderma in women with osteoporosis
Incidence of cancer by cancer type in patients with HIV versus general population

50.6
30
52.3
17.8
12.4 12
6.4
24.7
68.9
51.3
28.7
47.5
23.9
19.8
12.4
41.3
28.929.8
0
10
20
30
40
50
60
70
80
Women 66-69 70-79 ≥ 80 Race, Black NewlyDiagnosed
T2DM
1 2 ≥ 3
Adjusted
OR
(95% CI)
1.02
(0.97,
1.07)
Reference 1.14
(1.08, 1.21)
0.98
(0.91, 1.05)
0.68
(0.64, 0.73)
0.94
(0.87, 1.02)
Reference 5.15
(4.68, 5.66)
13.21
(12.07, 14.44)
Baseline Characteristics of Elderly Patients
(≥65 years) by Treatment Initiation
Sitagliptin Other OAHA
# of OHAsAge Ranges
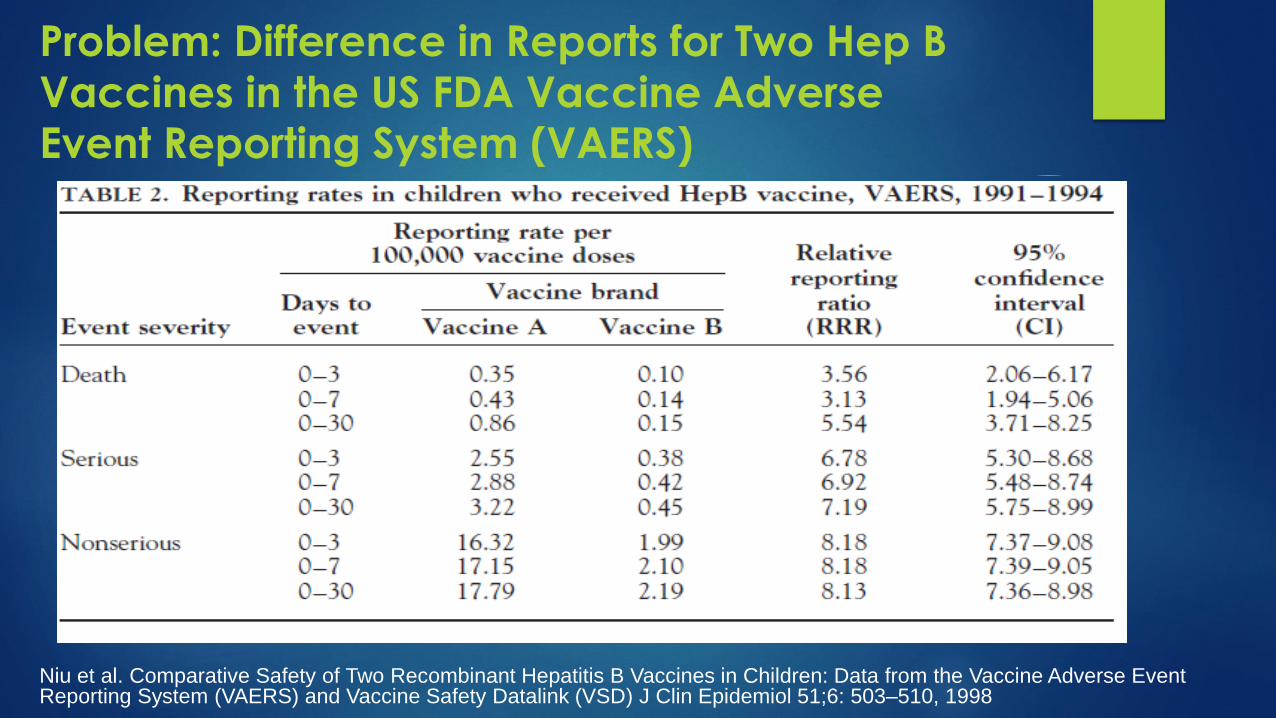
Problem: Difference in Reports for Two Hep B
Vaccines in the US FDA Vaccine Adverse Event Reporting System (VAERS)
Niu et al. Comparative Safety of Two Recombinant Hepatitis B Vaccines in Children: Data from the Vaccine Adverse Event Reporting System (VAERS) and Vaccine Safety Datalink (VSD) J Clin Epidemiol 51;6: 503–510, 1998

Vaccine Safety Datalink (VSD) Study
36
VSD - population based electronic data - no difference in events
37
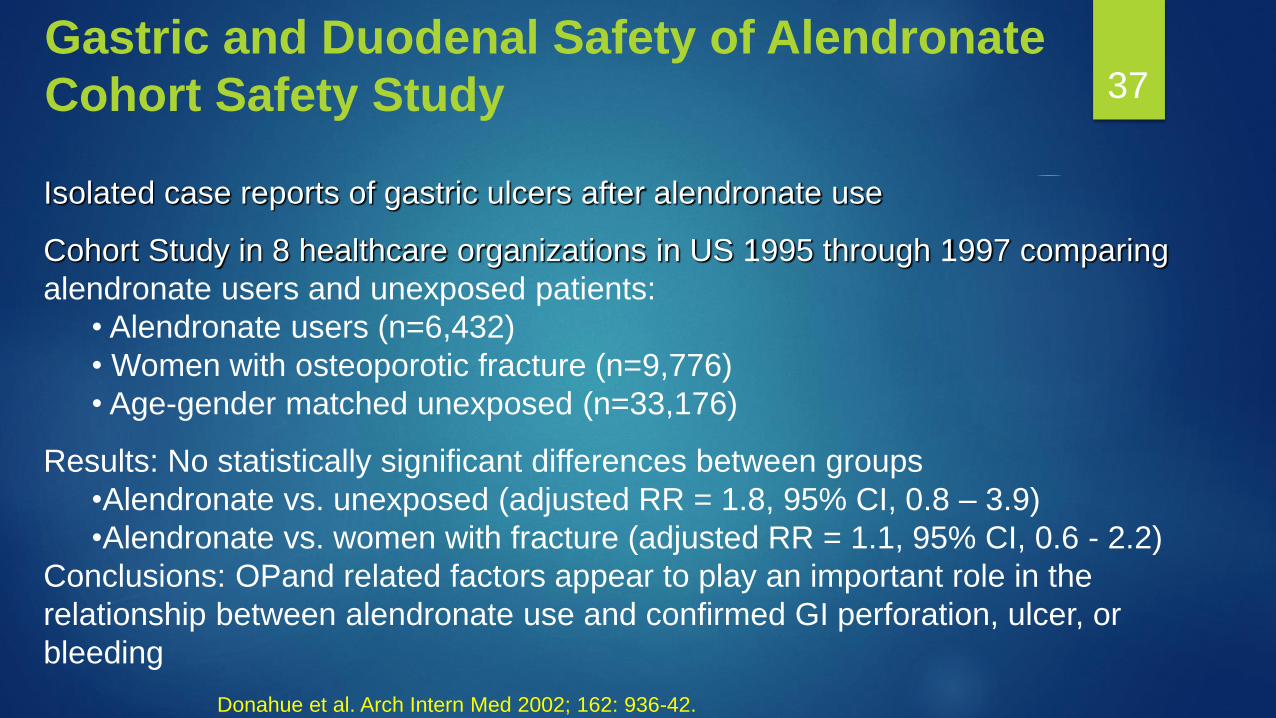
Isolated case reports of gastric ulcers after alendronate use
Cohort Study in 8 healthcare organizations in US 1995 through 1997 comparing
alendronate users and unexposed patients:
• Alendronate users (n=6,432)
• Women with osteoporotic fracture (n=9,776)
• Age-gender matched unexposed (n=33,176)
Results: No statistically significant differences between groups
•Alendronate vs. unexposed (adjusted RR = 1.8, 95% CI, 0.8 – 3.9)
•Alendronate vs. women with fracture (adjusted RR = 1.1, 95% CI, 0.6 - 2.2)
Conclusions: OPand related factors appear to play an important role in the
relationship between alendronate use and confirmed GI perforation, ulcer, or
bleeding
Gastric and Duodenal Safety of Alendronate
Cohort Safety Study
Donahue et al. Arch Intern Med 2002; 162: 936-42.

“New Users” design
Avoid comparing new and prevalent users
Depletion of susceptible populations in the prevalent group may
make comparison biased
Understand who is being treated with your
drug/vaccine as compared to comparator(s)
Describe baseline characteristics for all groups prior to
conducting any comparison to determine if channeling bias is occurring where higher risk patients preferentially receive one
treatment over another treatment
Differences may be too great to adjust statistically (e.g. propensity score)
with little to no overlap in treatment patterns
Early Adopters of Observational Methods38

Older Product
New Product introduction
Time
Number
of
Events
1-1-2001
Example for VTE Risk and Contraception: Consequences of Comparing All Users
(Long Term and New)
Study window
Individual user VTE risk curve over time,
valid for starters and recurrent users,
switchers remain at lower risk
The ‘all-users’ analysis reduces the VTE incidence rate for the older product by including long term users
(‘prevalent’ users who started pre-2001) whose VTE risk is lower at the start of the study period
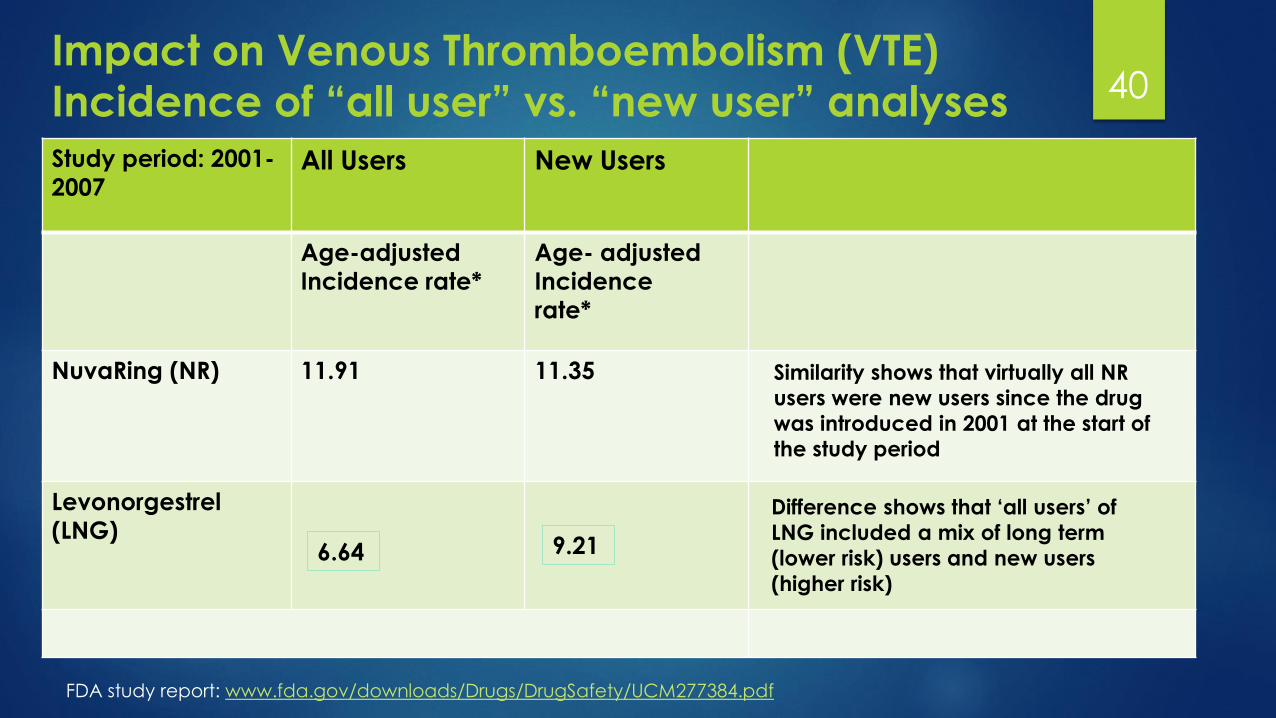
Impact on Venous Thromboembolism (VTE)
Incidence of “all user” vs. “new user” analyses 40
Study period: 2001-
2007All Users New Users
Age-adjusted
Incidence rate*
Age- adjusted
Incidence
rate*
NuvaRing (NR) 11.91 11.35
Levonorgestrel
(LNG)
Similarity shows that virtually all NR
users were new users since the drug
was introduced in 2001 at the start of
the study period
Difference shows that ‘all users’ of
LNG included a mix of long term
(lower risk) users and new users
(higher risk)
6.64 9.21
FDA study report: www.fda.gov/downloads/Drugs/DrugSafety/UCM277384.pdf
Need to assure that cases are truly cases
Blinded, independent case adjudication of
primary and key secondary endpoints
Assures that cases identified are true positive cases
for analyses
Decreases diagnostic bias
Cannot decrease detection bias which can occur
if healthcare provider is looking harder for the
event in one group versus another group
Design: Reliability of Endpoints 41
Example of Chart Review and
Adjudication in Database Study
MMRV compared to MMR+V vaccination and Febrile Seizures evaluation
Coding practice changes at healthcare system (Kaiser Permanente Southern California- KPSC) from 2004-2007 resulted in documented increase in seizure code use over study period
Adjudication likely removed most of this bias, improving validity of results
Adjudication Committee (3 KPSC Physicians)
Reviewed medical records data using Brighton Collaborationdefinition for Febrile Seizure
The adjudication process identified “confirmed Febrile Seizures”
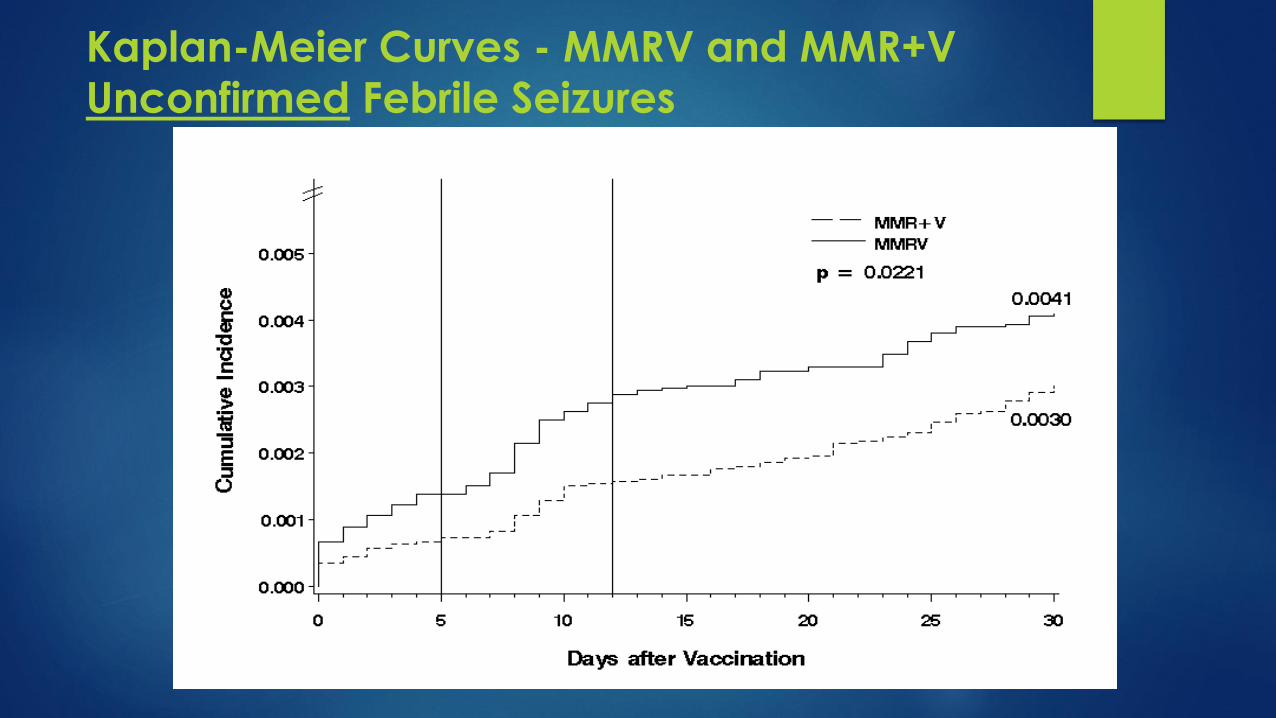
Kaplan-Meier Curves - MMRV and MMR+V
Unconfirmed Febrile Seizures
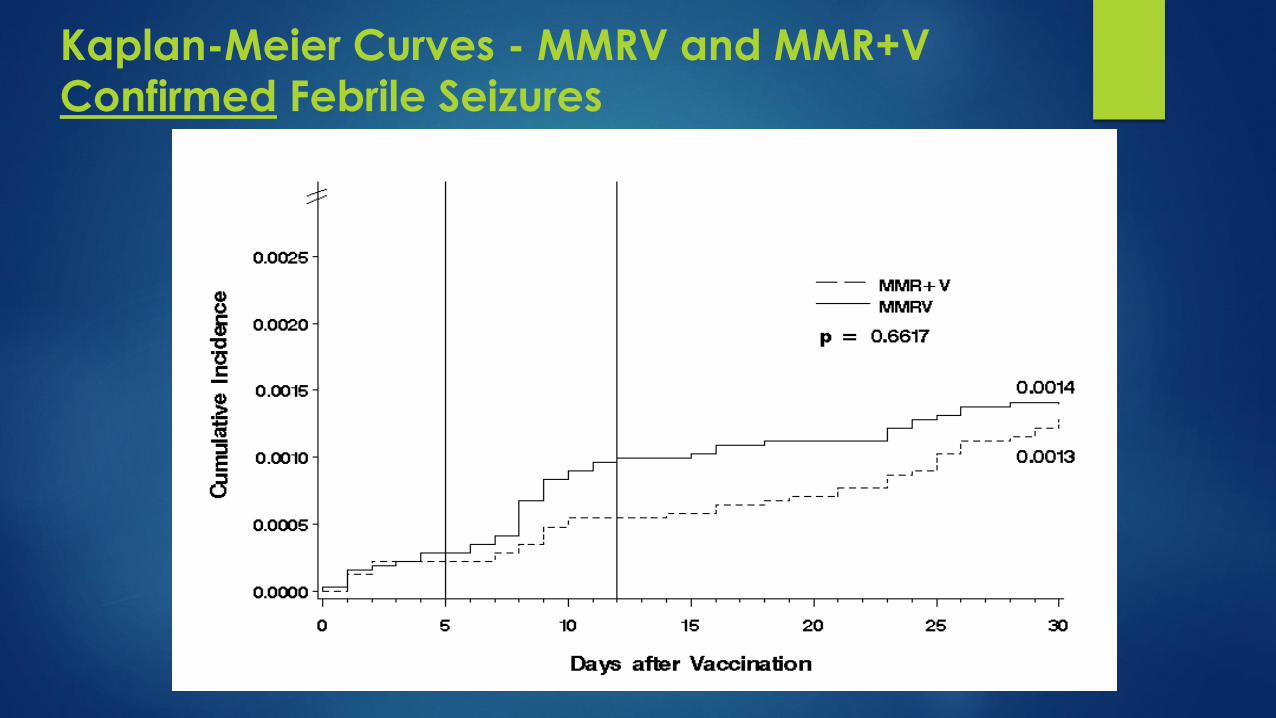
Kaplan-Meier Curves - MMRV and MMR+V
Confirmed Febrile Seizures

45What Do We Do When Observational Database
Analyses Lead to Two Different Conclusions
BMJ 2010; 341:c4444 JAMA 2010; 304(6): 657-663
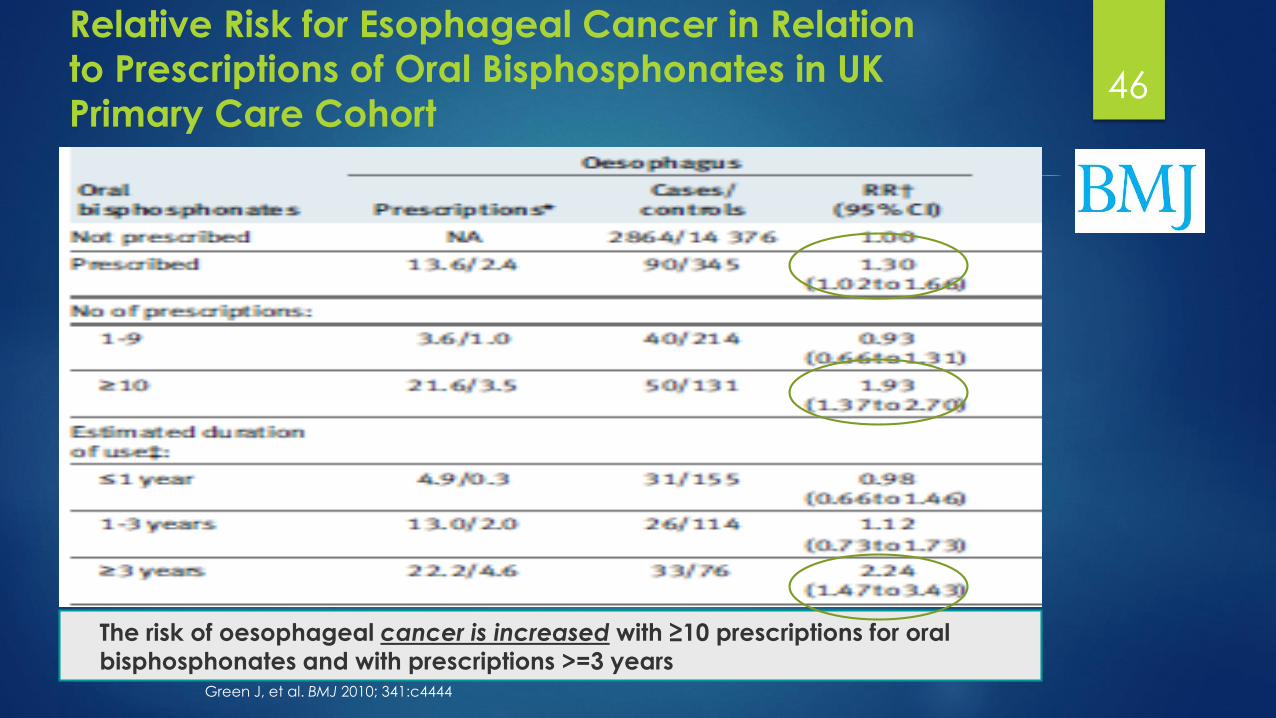
46
Relative Risk for Esophageal Cancer in Relation
to Prescriptions of Oral Bisphosphonates in UK
Primary Care Cohort
Green J, et al. BMJ 2010; 341:c4444
The risk of oesophageal cancer is increased with ≥10 prescriptions for oral
bisphosphonates and with prescriptions >=3 years

47Esophageal Cancer Incidence in
Bisphosphonate in Matched Control Cohorts
in UK Primary Care Database
Cardwell CR, et al. JAMA 2010; 304(6): 657-663
Conclusion:
Among patients in the UK General Practice Research Database,
the use of oral bisphosphonates was not significantly associated
with esophageal or gastric cancer.
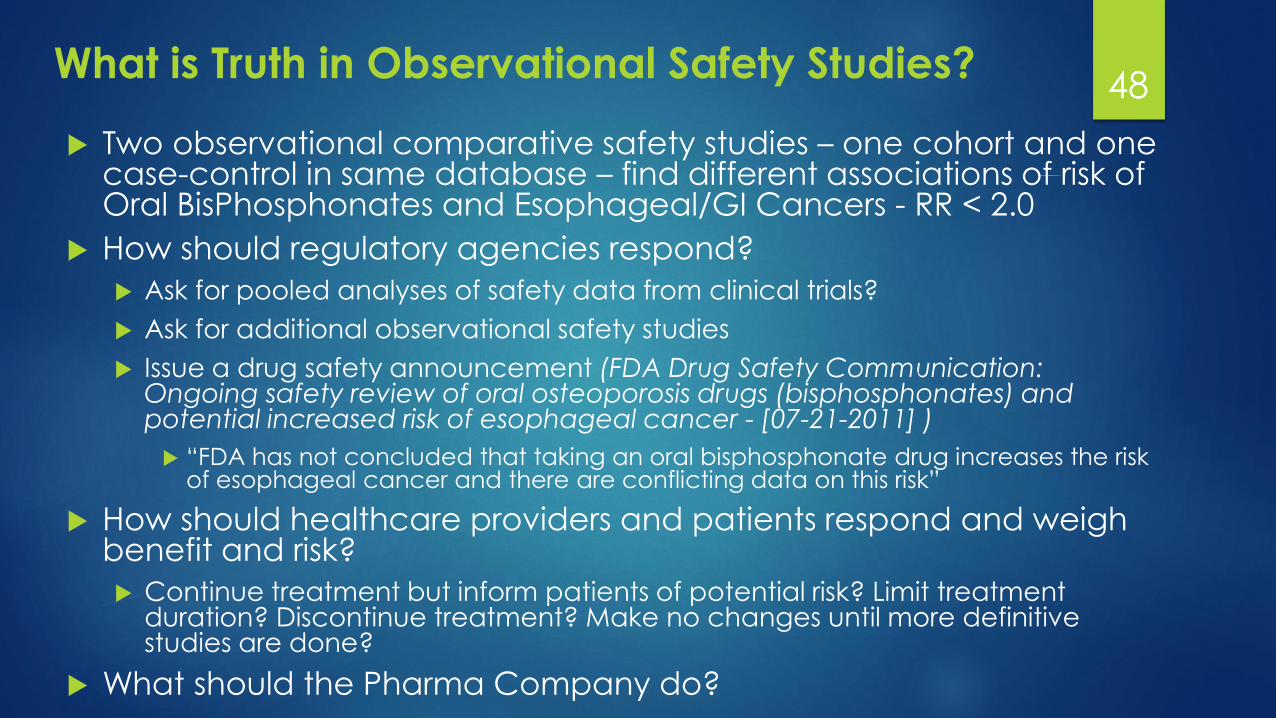
48What is Truth in Observational Safety Studies?
Two observational comparative safety studies – one cohort and one case-control in same database – find different associations of risk of Oral BisPhosphonates and Esophageal/GI Cancers - RR < 2.0
How should regulatory agencies respond?
Ask for pooled analyses of safety data from clinical trials?
Ask for additional observational safety studies
Issue a drug safety announcement (FDA Drug Safety Communication: Ongoing safety review of oral osteoporosis drugs (bisphosphonates) and potential increased risk of esophageal cancer - [07-21-2011] )
“FDA has not concluded that taking an oral bisphosphonate drug increases the risk of esophageal cancer and there are conflicting data on this risk”
How should healthcare providers and patients respond and weigh benefit and risk?
Continue treatment but inform patients of potential risk? Limit treatment duration? Discontinue treatment? Make no changes until more definitive studies are done?
What should the Pharma Company do?
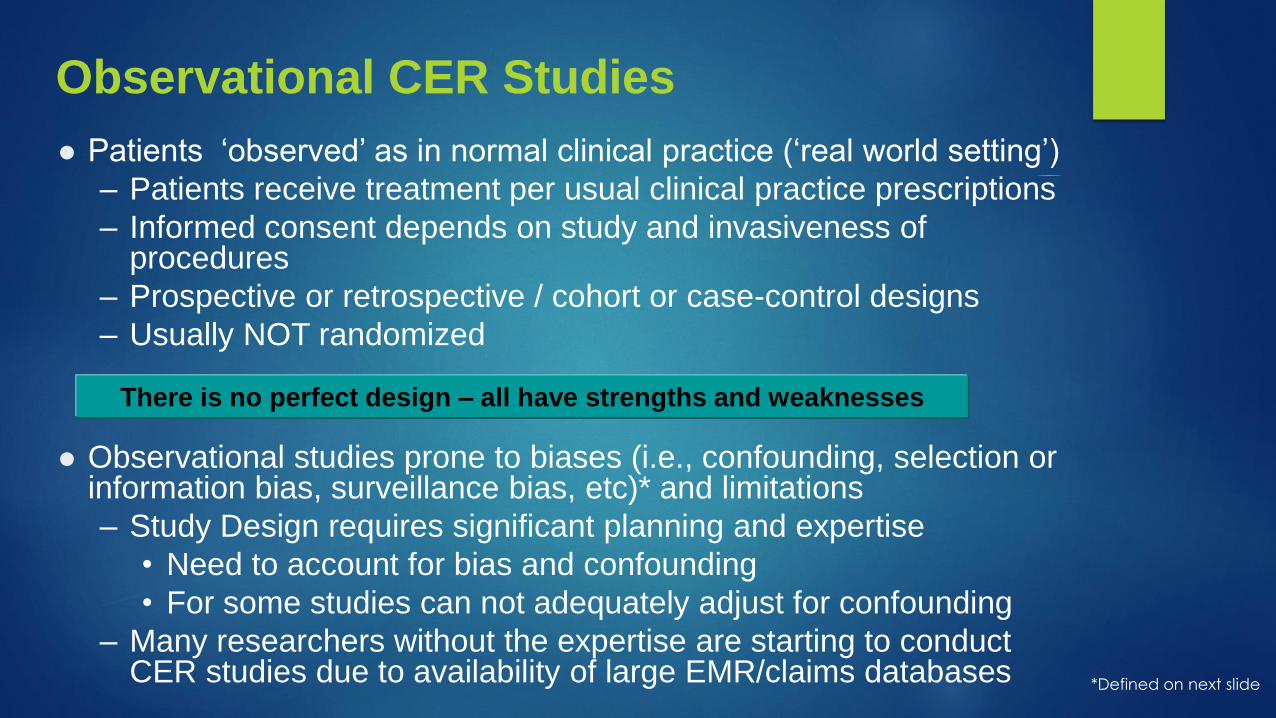
Observational CER Studies
Patients ‘observed’ as in normal clinical practice (‘real world setting’)
– Patients receive treatment per usual clinical practice prescriptions
– Informed consent depends on study and invasiveness of procedures
– Prospective or retrospective / cohort or case-control designs
– Usually NOT randomized
Observational studies prone to biases (i.e., confounding, selection or information bias, surveillance bias, etc)* and limitations
– Study Design requires significant planning and expertise
• Need to account for bias and confounding
• For some studies can not adequately adjust for confounding
– Many researchers without the expertise are starting to conduct CER studies due to availability of large EMR/claims databases
There is no perfect design – all have strengths and weaknesses
*Defined on next slide

Limitations of Observational Comparative
Effectiveness Methods Unique methodological challenges in conducting
Observational Studies of Effectiveness
Studies may be susceptible to systematic error:
Selection bias
Information bias: Exposure and/or Outcome misclassification
Surveillance bias: Monitoring of exposed patients may be different between groups – can result in detection or diagnostic bias
Channeling bias:
Confounding by indication: people who receive a drug are different from people who do not, in that they have an indication for therapy
Brian Strom, Medical Care. 45(10): Supplement October 2007
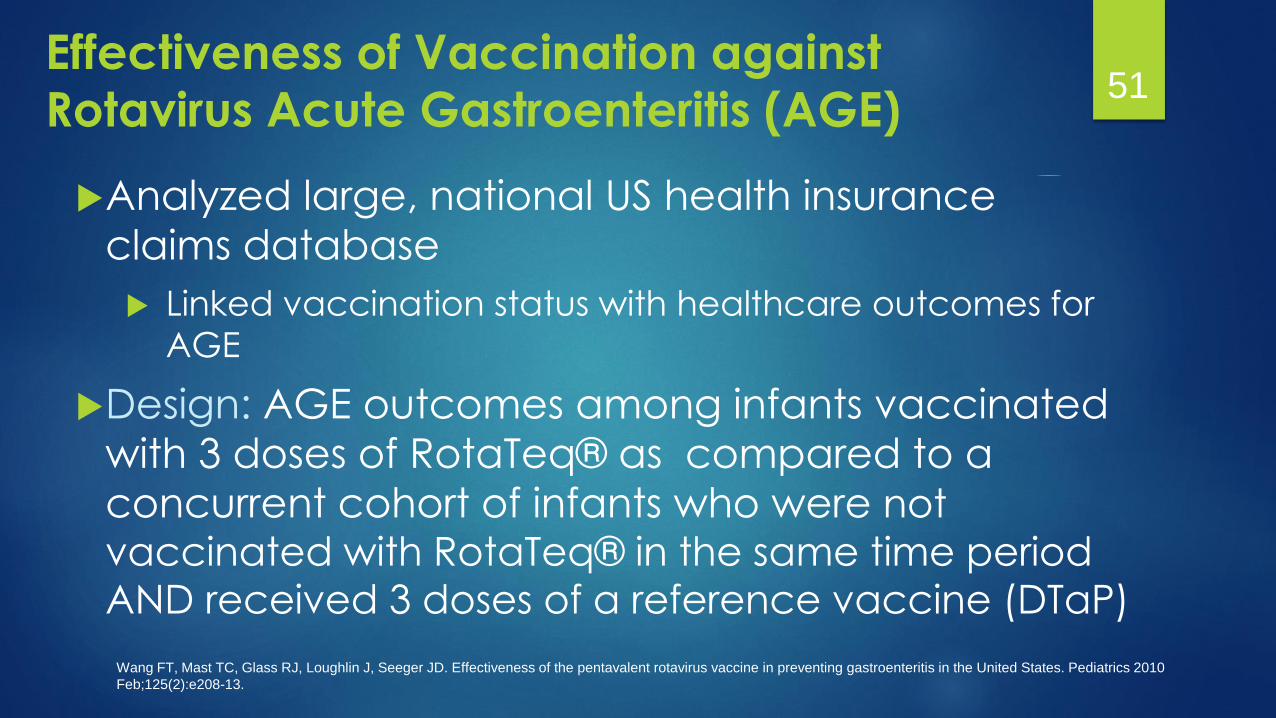
51Effectiveness of Vaccination against
Rotavirus Acute Gastroenteritis (AGE)
Analyzed large, national US health insurance
claims database
Linked vaccination status with healthcare outcomes for
AGE
Design: AGE outcomes among infants vaccinated
with 3 doses of RotaTeq® as compared to a
concurrent cohort of infants who were not
vaccinated with RotaTeq® in the same time period
AND received 3 doses of a reference vaccine (DTaP)
Wang FT, Mast TC, Glass RJ, Loughlin J, Seeger JD. Effectiveness of the pentavalent rotavirus vaccine in preventing gastroenteritis in the United States. Pediatrics 2010
Feb;125(2):e208-13.
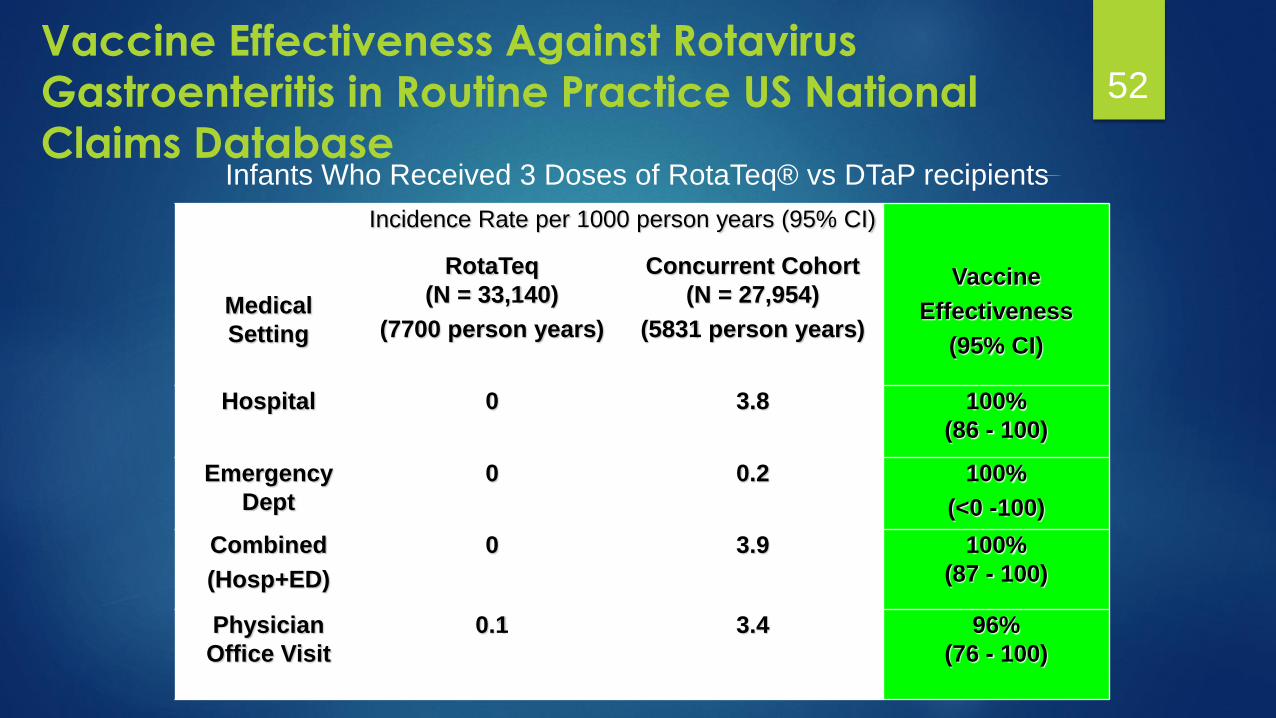
52Vaccine Effectiveness Against Rotavirus
Gastroenteritis in Routine Practice US National
Claims Database
Medical
Setting
Incidence Rate per 1000 person years (95% CI)
Vaccine
Effectiveness
(95% CI)
RotaTeq
(N = 33,140)
(7700 person years)
Concurrent Cohort
(N = 27,954)
(5831 person years)
Hospital 0 3.8 100%
(86 - 100)
Emergency
Dept
0 0.2 100%
(<0 -100)
Combined
(Hosp+ED)
0 3.9 100%
(87 - 100)
Physician
Office Visit
0.1 3.4 96%
(76 - 100)
Infants Who Received 3 Doses of RotaTeq® vs DTaP recipients
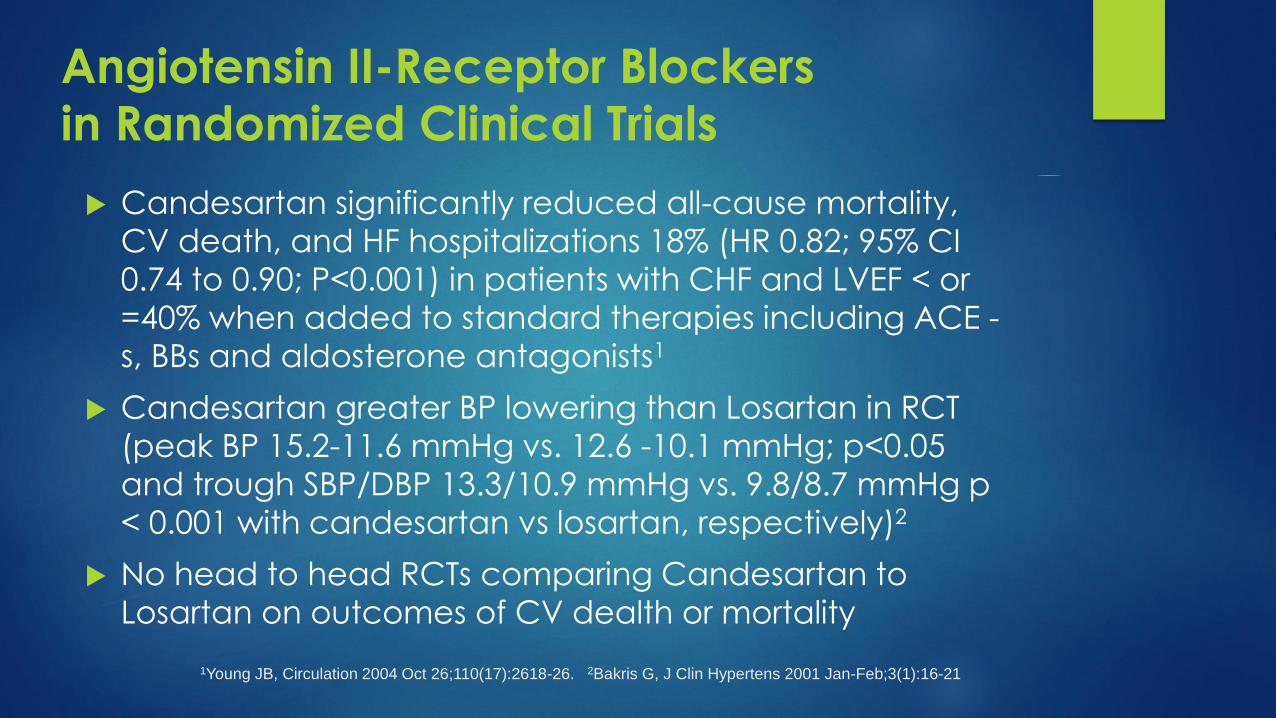
Angiotensin II-Receptor Blockers
in Randomized Clinical Trials
Candesartan significantly reduced all-cause mortality,
CV death, and HF hospitalizations 18% (HR 0.82; 95% CI
0.74 to 0.90; P<0.001) in patients with CHF and LVEF < or
=40% when added to standard therapies including ACE -
s, BBs and aldosterone antagonists1
Candesartan greater BP lowering than Losartan in RCT
(peak BP 15.2-11.6 mmHg vs. 12.6 -10.1 mmHg; p<0.05
and trough SBP/DBP 13.3/10.9 mmHg vs. 9.8/8.7 mmHg p
< 0.001 with candesartan vs losartan, respectively)2
No head to head RCTs comparing Candesartan to
Losartan on outcomes of CV dealth or mortality
1Young JB, Circulation 2004 Oct 26;110(17):2618-26. 2Bakris G, J Clin Hypertens 2001 Jan-Feb;3(1):16-21

Association of Candesartan vs Losartan with All-
Cause Mortality in Patients with Heart Failure (2011)
1-yr survival 90% (95% CI, 89%-91%) for candesartan vs. 83% (81%-84%) for losartan & 5-yr survival
was 61% (54%-68%) vs. 44% (41%-48%), respectively (log-rank P.001); multivariate PS adjustment,
HR for mortality for losartan compared with candesartan was 1.43 (95% CI, 1.23-1.65; P.001)
Eklind-Cervenka M at al. JAMA 2011;305:175-82
Retrospective observational study in the Swedish HF
registry of 30,254 patients observed from 2000-2009
Question:
Would a ~ 3
mmHg
difference in BP
in RCTs
account for
40% increase in
mortality?
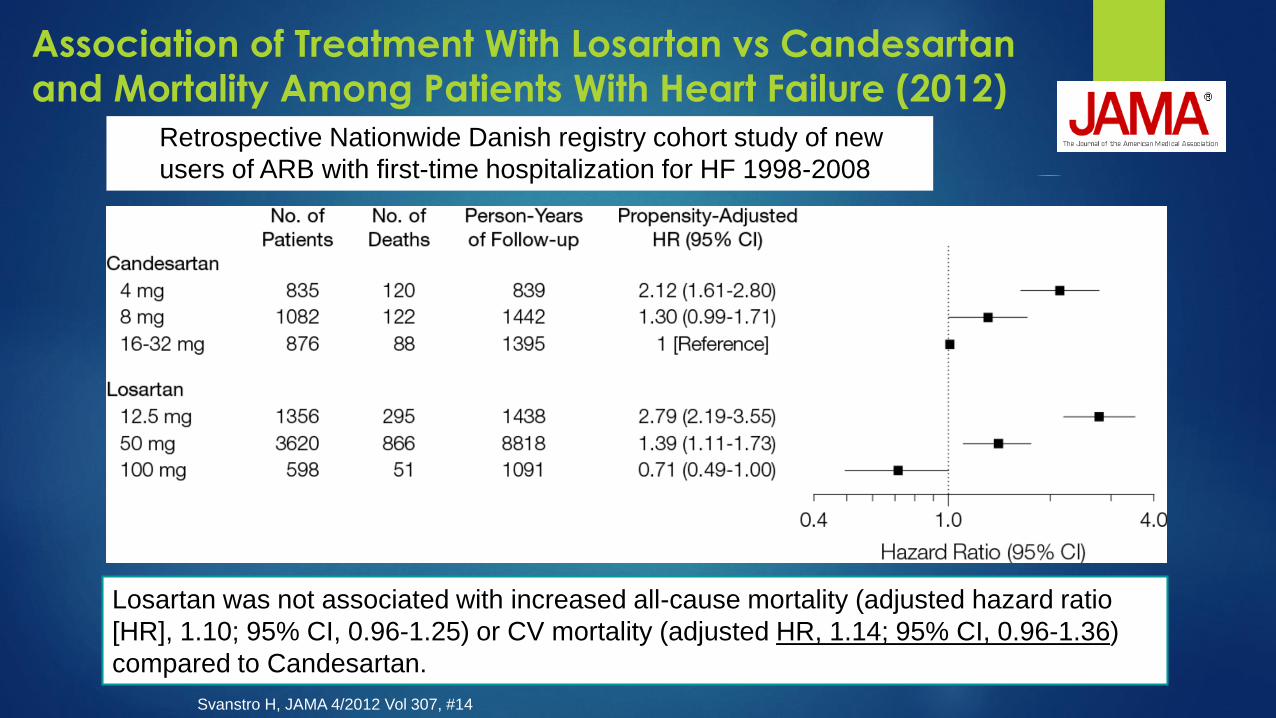
Losartan was not associated with increased all-cause mortality (adjusted hazard ratio
[HR], 1.10; 95% CI, 0.96-1.25) or CV mortality (adjusted HR, 1.14; 95% CI, 0.96-1.36)
compared to Candesartan.
Association of Treatment With Losartan vs Candesartan
and Mortality Among Patients With Heart Failure (2012)
Svanstro H, JAMA 4/2012 Vol 307, #14
Retrospective Nationwide Danish registry cohort study of new
users of ARB with first-time hospitalization for HF 1998-2008

Two Comparative Effectiveness Studies in
Nordic Registries: Different Results – WHY?
Confounding and bias
Different baseline characteristics
Co-morbidities
Concomitant medications
Duration of HF and duration of treatment
Age
Not a new users analyses; mixed prevalent and incident users
Missing data on important variables
Modeled dose comparisons:
Large differences in % users achieving target dose; users of Candesartan more likely to achieve high-dose treatment as compared to Losartan users
higher average relative dose among Candesartan users may have led to overestimation of overall comparative effectiveness
Evaluate results clinically, methods and operationally:
Check the Data
Check the Analytic Programs
Conduct Descriptive Statistics (by age, gender, seasonal trends, study site)
Evaluate Time from Exposure to Adverse Event
Adjust for Additional Confounders
Use Other Comparison Groups
Chart Review to Validate Cases
Compare with Other Existing Data
Conduct Studies with New Data
Compare Similar Outcomes
Include Sensitivity Analyses
Review the Methods and Check Results 57
Modified from Kulldorff, Yih, presentations for US CDC Vaccine Safety Datalink

The Role of Epidemiology in the PharmaceutialIndustry – Safety and Effectiveness
Growing role of Epidemiology in Pharmaceutical Industry
Understanding the disease
Validating measures
Safety and Effectiveness – Benefit-Risk
Challenges:
Data
Methods
Conflicting studies
Perception of Industry vs Academia – different conflicts of interest
Outcomes Research vs Epidemiology

Questions?
“...to understand the Drug, it is necessary to understand the Disease” Harry Guess
"It is more important to know what sort of person has a disease than to know what sort of disease a person has" Hippocrates