the role of data in understanding & impacting student persistence · ubc at a glance 1908 the...
TRANSCRIPT

The Role of Data in Understanding & Impacting Student Persistence
Sham Pendleton, Associate Director,Planning & Institutional Research
Deborah Robinson, Executive Coordinator, Enrolment Management StrategyThe University of British Columbia
SEM Summit 2011

Overview
• UBC at a Glance
• SEM and Retention at UBC: the context
• Understanding the Data
• Discussion

UBC at a Glance
1908 the year UBC was established
4-year, public research-intensive, medical/doctoral
2 campuses, Vancouver and Kelowna
1 Board of Governors and
1 President but 2 Senates
54,675 students on two campuses, Vancouver and Okanagan
7,653 international students
11,054 degrees granted in 2009/10
30th in world university rankings, one of three Canadian universities in the top 40

The Vancouver Campus
• Student population of 47,582 HC (40,349 FTE)
37,944 undergraduates, 9,638 graduates
4,488 international undergraduate students
30% live on campus

SEM and Retention
• In 2008, an SEM Working Group on Retention concluded:
“UBC’s retention rates are enviable and, while there are important questions to ask about determinants of retention, setting a simple goal of raising retention by x% would be misguided.”

Why focus on retention?
Significant pressure on institutions to retain students who have already been recruited
• Support student success: high achieving students who we want to succeed
• Institutional Reputation• Cost effective – recruitment of students has been highly
competitive (especially international students who are a source of much needed funding for institutions); easier to try and keep students you already have than to recruit new students
Effective and sustainable enrolment management practices are based on student success and are measures of institutional effectiveness

A second SEM Working Group on retention was convened in 2009.
They were asked to
“look again at the issue of retention, this time with specific reference to the idea of ‘building a class’ (increasing both out-of-province and international enrolment to a combined 35% to 40% of the total undergraduate population) and whether UBC’s retention rates might change as a result.”

That group discovered that:
• UBC exhibits high retention rates expected for “highly selective institutions” but the retention rates are different for different populations
• 90% retention rate for domestic students• 80% retention rate for international students • 77% of students graduate within 6 years
The group also noted that NSSE and other data suggest that UBC might have a different kind of student problem. . . “academic indifference” or “academic stagnation”

Students who are academically indifferent or academically stagnant. . .
• complete their studies largely because of personal goal directness, but with little sense of satisfaction and at great personal cost
• do not exhibit the levels of engagement characteristic of students at peer institutions
• exhibit high levels of stress leading to academic difficulty or less than optimal performance
• result in low net promoter scores from alumni
This led us to look at retention in some different ways

Framework for attrition:two extremes
Failure to continue
Institution has failed
•Motivate
•Remediate
•Finance
•Care
•Intervene
•Engage
Not a problem
Student has failed
•Lacks ability
•Wrong choice
•Lacks motivation
•Lacks effort
•No money
Student fails to continue
•Student got what they sought•Completed some internal goal

Attrition is a shared problem
Institution should have
helped
Student should have
changed behaviour
Acceptance of attrition
Example: Intervention after term one and student changes study habits
Wrong choice for student; Institution could have provided better selection and counselling
Maturing process for student; student wants a different experience
Student made poor choices
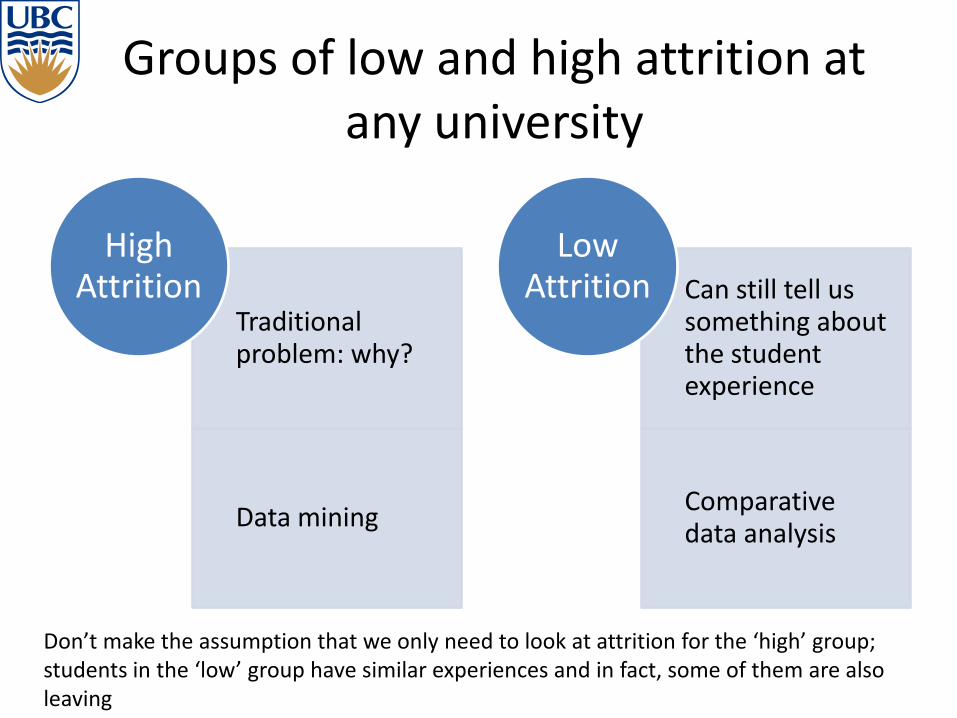
Groups of low and high attrition at any university
Traditional problem: why?
Data mining
High Attrition Can still tell us
something about the student experience
Comparative data analysis
Low Attrition
Don’t make the assumption that we only need to look at attrition for the ‘high’ group; students in the ‘low’ group have similar experiences and in fact, some of them are also leaving

Results
• Retention rates are high at UBC-Vancouver
2009 to 2010: 90% retention for domestic students (4334 students); 80% for International (772 students)
UBC-V: Retention rates (first year, first time, full-time)
Domestic International Overall
Arts 89% 84% 88%
Business 92% 77% 88%
Engineering 86% 76% 85%
Science 93% 82% 92%
All (includes Forestry and Land
and Food systems) 90% 80% 88%
This is purely data mining …

• Results are simply descriptive
• They don’t tell us what to do or what works…
More data mining with the high attrition group
Both the international and domestic groups have students who were retained and not retained. We don’t want to focus only on the not-retained group and discover what we already knew (i.e., that it contains more international students); instead look at the two groups separately

Retention Model
Evidence based approach
Inputs include multiple characteristics and the interdependence of these:
Administrative Data• Faculty, degree program, year level• Admissions information: admission average, basis of admission, type of
sending institution, region, province, country, program choice, type of curriculum (IB, etc)
• Additional student information: gender, citizenship, aboriginal, first language
• Performance: GPA, credits earned, academic standing• ScholarshipsStudent surveysParticipation in orientation type programs (Jumpstart for international
students which provides a two-week intensive academic preparation for university life)

0.00
0.10
0.20
0.30
0.40
0.50
0.60
0.70
0.80
0.90
1.00
FRST LFS APSC ARTS COMM SCIE
2007 Dom
2008 Dom
2009 Dom
2007 ISI
2008 ISI
2009 ISI
UBCV: First year Retention rates: over time, by program, ISI/Dom

International studentsTrees: runs through all available variables, and finds the ‘best’-successively more local solutions

Academic Performance
Pass
Fail, Review, Withdrawn Discipline/probation
1,613 Retained (91%)152 Not Retained (9%)
42 Retained (17%)200 Not Retained (83%)
111 Retained (74%)40 Not retained (27%)
International students:2,158 Students• 1,766 retained (82%)• 392 not retained (18%)
These nodes don’t have interestingbranches (we’ll explain failure using a different tree
Even though retention is very high, we might learn more from these branches


Now, LPI (Language Proficiency Index) is relevant:
Pass the LPI → 94% retentionFail the LPI → 81% retentionNo LPI → 91% retention
But, of those who PASS the session, but FAIL the LPI, only 28 are not retained
- Clear effect of LPI on retention, but small impact in actual numbers

Further down the tree:What effects retention for those who: a) pass the year; b) do not require the LPI
We have a high percentage attrition from U.S.A and Western EuropeBut, numbers are small: 74 students→controlling for PASS rate, attrition of Americans is not that serious

Academic Performance
Pass Fail, Review, Withdrawn Discipline/probation
What explains the other nodes?
2,158 Students• 1,766 retained (82%)• 392 not retained (18%)

A new tree with root: Academic Standing
Now we’re explaining “academic standing”

Best Predictor of ACADEMIC STANDING is ADMISSION AVERAGE
Admission range <=83 83 - 87 87 - 94 94 - 96 >96 Total
Pass rate 67% 80% 85% 93% 91%
Number in range 434 456 831 213 224 2158
likely to drop out 143 91 125 15 20 394
Admission ranges which give the most variance in Pass rate
Roughly, we would like our attrition rate for international studentsreduced by 50%...implies a gpa cut-off of somewhere between 83 and 85

50.0%
55.0%
60.0%
65.0%
70.0%
75.0%
80.0%
85.0%
90.0%
95.0%
<=84 84-92 >92
Effect of Jumpstart program on retentionProportion retained versus admission GPA
no jump jump start
Admission GPA

Domestic students
• Recall: high retention rates (90%)
We can do a similar tree analysis and would find that 5% of the students who passed did not continue
Another alternative is to look at the student experience (if 90% retention is good, what about the student experience would help explain why students are not continuing)

Compare survey results with other institutions (reasons for not returning to institution)
Don’t have good comparable datasets with representative sample…working on new collaborations in the upcoming cycle
One Approach:

UES (Undergraduate Experience Survey)
• Do you plan to continue your studies at UBC next year?
*Results are statistically significant
.00
1.00
2.00
3.00
4.00
5.00
6.00
UES Survey: Domestic First Year
Plan to continue at UBC Does not plan to continue

More data mining…
Up to now, all we’ve done is look at what’s happened in the past and present
Developed interventions based on various inputs
Predictive modeling:
• Use data from the past / present to identify students who may need interventions
• New to UBC Survey – administered in August

Predictive Modeling & Analytics
Administrative data (admissions, etc)
New Student Survey (prior to start of classes)
Orientation / Academic Prep
programs
Term One Performance
Survey (NSSE /UES after term one)
End of Year performance
Retention

Discussion
Where do they fit and how can data impact persistence?
Institution should have
helped
Student should have
changed behaviour
Acceptance of attrition

Reflection
As institutions become intentional about recruiting students from other parts of the country/world, understanding retention and attrition becomes even more important.
Consider your own institutional enrolment management goals. How are those goals affected by the retention rates of different student populations? How might your institution respond?

Reflection
How committed are your institutions to helping students succeed? That is, if we knowingly admit students who have a lower possibility of being successful, how far are we willing to go (i.e. what kinds and how much student support will you provide?) to ensure student success?