the role of complement in cnidarian-dinoflagellate...
TRANSCRIPT

ORIGINAL RESEARCHpublished: 22 April 2016
doi: 10.3389/fmicb.2016.00519
Frontiers in Microbiology | www.frontiersin.org 1 April 2016 | Volume 7 | Article 519
Edited by:
Joerg Graf,
University of Connecticut, USA
Reviewed by:
Juris A. Grasis,
San Diego State University, USA
Maria G. Castillo,
New Mexico State University, USA
*Correspondence:
Virginia M. Weis
Specialty section:
This article was submitted to
Microbial Symbioses,
a section of the journal
Frontiers in Microbiology
Received: 30 December 2015
Accepted: 29 March 2016
Published: 22 April 2016
Citation:
Poole AZ, Kitchen SA and Weis VM
(2016) The Role of Complement in
Cnidarian-Dinoflagellate Symbiosis
and Immune Challenge in the Sea
Anemone Aiptasia pallida.
Front. Microbiol. 7:519.
doi: 10.3389/fmicb.2016.00519
The Role of Complement inCnidarian-Dinoflagellate Symbiosisand Immune Challenge in the SeaAnemone Aiptasia pallida
Angela Z. Poole 1, 2, Sheila A. Kitchen 1 and Virginia M. Weis 1*
1Department of Integrative Biology, Oregon State University, Corvallis, OR, USA, 2Department of Biology, Western Oregon
Universtiy, Monmouth, OR, USA
The complement system is an innate immune pathway that in vertebrates, is responsible
for initial recognition and ultimately phagocytosis and destruction of microbes. Several
complement molecules including C3, Factor B, and mannose binding lectin associated
serine proteases (MASP) have been characterized in invertebrates and while most studies
have focused on their conserved role in defense against pathogens, little is known
about their role in managing beneficial microbes. The purpose of this study was to (1)
characterize complement pathway genes in the symbiotic sea anemone Aiptasia pallida,
(2) investigate the evolution of complement genes in invertebrates, and (3) examine
the potential dual role of complement genes Factor B and MASP in the onset and
maintenance of cnidarian-dinoflagellate symbiosis and immune challenge using qPCR
based studies. The results demonstrate that A. pallida has multiple Factor B genes
(Ap_Bf-1, Ap_Bf-2a, and Ap_Bf-2b) and one MASP gene (Ap_MASP). Phylogenetic
analysis indicates that the evolutionary history of complement genes is complex, and
there have beenmany gene duplications or gene loss events, even within members of the
same phylum. Gene expression analyses revealed a potential role for complement in both
onset and maintenance of cnidarian-dinoflagellate symbiosis and immune challenge.
Specifically, Ap_Bf-1 and Ap_MASP are significantly upregulated in the light at the onset
of symbiosis and in response to challenge with the pathogen Serratia marcescens
suggesting that they play a role in the initial recognition of both beneficial and harmful
microbes. Ap_Bf-2b in contrast, was generally downregulated during the onset and
maintenance of symbiosis and in response to challenge with S. marcescens. Therefore,
the exact role of Ap_Bf-2b in response to microbes remains unclear, but the results
suggest that the presence of microbes leads to repressed expression. Together, these
results indicate functional divergence between Ap_Bf-1 and Ap_Bf-2b, and that Ap_Bf-1
and Ap_MASP may be functioning together in an ancestral hybrid of the lectin and
alternative complement pathways. Overall, this study provides information on the role
of the complement system in a basal metazoan and its role in host-microbe interactions.
Keywords: Aiptasia, symbiosis, complement, innate immunity, cnidarians, Symbiodinium, Serratia marcescens
Poole et al. Role of Complement in Aiptasia pallida
INTRODUCTION
The immune system is classically thought of as the mechanismsthat defend an organism against harmful intruders, such asdisease-causing microbes or parasitic worms. Although the wordmicrobe is traditionally associated with pathogenic organisms, amore modern interpretation is that one microbe can be harmfulor beneficial depending on the host or changing environmentalconditions (Eberl, 2010). In addition, it has been recognizedthat beneficial and harmful microbes both interact with immunepathways to persist within the host (Hentschel et al., 2000;Kubinak and Round, 2012). Therefore, it has been proposedthat the immune system functions more generally to maintainhomeostasis by defining the microbial community throughinteractions with both mutualistic and pathogenic microbes(Eberl, 2010).
Many invertebrates engage in mutualistic symbioticrelationships with bacteria and other microbes and thereforerequire mechanisms to allow for tolerance of mutualists andelimination of pathogens. Invertebrates, unlike vertebrates,lack the highly specific adaptive immune response and dependon innate immune pathways to mediate these interactions(McFall-Ngai, 2007). The innate immune system represents thefast-acting, relatively non-specific mechanisms that recognizeand respond to non-self-molecules (Akira et al., 2006; Iwasakiand Medzhitov, 2010). Many innate immune pathwaysare initiated by interactions between host pattern recognitionreceptors (PRRs) and general microbial signatures calledmicrobeassociated molecular patterns (MAMPs) (Medzhitov andJaneway, 1997; Eberl, 2010). PRRs include extracellular receptorssuch as Toll-like receptors (TLRs), scavenger receptors (SRs),lectins, and complement receptors, and also the intracellularnod-like receptors (NLRs) (Janeway and Medzhitov, 2002).Ultimately, these interactions activate signaling cascades toinitiate the appropriate response to a microbe.
The complement system is one innate immune pathway thatcan be activated by the interaction of PRRs and MAMPs. It
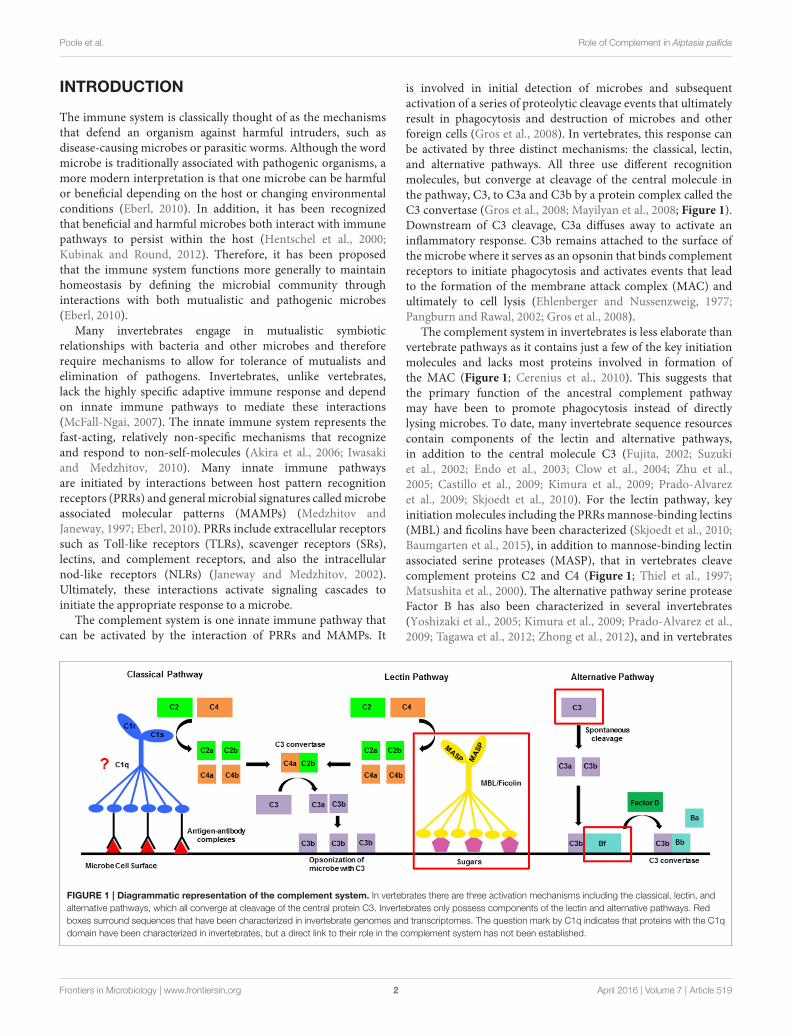
FIGURE 1 | Diagrammatic representation of the complement system. In vertebrates there are three activation mechanisms including the classical, lectin, and
alternative pathways, which all converge at cleavage of the central protein C3. Invertebrates only possess components of the lectin and alternative pathways. Red
boxes surround sequences that have been characterized in invertebrate genomes and transcriptomes. The question mark by C1q indicates that proteins with the C1q
domain have been characterized in invertebrates, but a direct link to their role in the complement system has not been established.
is involved in initial detection of microbes and subsequentactivation of a series of proteolytic cleavage events that ultimatelyresult in phagocytosis and destruction of microbes and otherforeign cells (Gros et al., 2008). In vertebrates, this response canbe activated by three distinct mechanisms: the classical, lectin,and alternative pathways. All three use different recognitionmolecules, but converge at cleavage of the central molecule inthe pathway, C3, to C3a and C3b by a protein complex called theC3 convertase (Gros et al., 2008; Mayilyan et al., 2008; Figure 1).Downstream of C3 cleavage, C3a diffuses away to activate aninflammatory response. C3b remains attached to the surface ofthe microbe where it serves as an opsonin that binds complementreceptors to initiate phagocytosis and activates events that leadto the formation of the membrane attack complex (MAC) andultimately to cell lysis (Ehlenberger and Nussenzweig, 1977;Pangburn and Rawal, 2002; Gros et al., 2008).
The complement system in invertebrates is less elaborate thanvertebrate pathways as it contains just a few of the key initiationmolecules and lacks most proteins involved in formation ofthe MAC (Figure 1; Cerenius et al., 2010). This suggests thatthe primary function of the ancestral complement pathwaymay have been to promote phagocytosis instead of directlylysing microbes. To date, many invertebrate sequence resourcescontain components of the lectin and alternative pathways,in addition to the central molecule C3 (Fujita, 2002; Suzukiet al., 2002; Endo et al., 2003; Clow et al., 2004; Zhu et al.,2005; Castillo et al., 2009; Kimura et al., 2009; Prado-Alvarezet al., 2009; Skjoedt et al., 2010). For the lectin pathway, keyinitiation molecules including the PRRs mannose-binding lectins(MBL) and ficolins have been characterized (Skjoedt et al., 2010;Baumgarten et al., 2015), in addition to mannose-binding lectinassociated serine proteases (MASP), that in vertebrates cleavecomplement proteins C2 and C4 (Figure 1; Thiel et al., 1997;Matsushita et al., 2000). The alternative pathway serine proteaseFactor B has also been characterized in several invertebrates(Yoshizaki et al., 2005; Kimura et al., 2009; Prado-Alvarez et al.,2009; Tagawa et al., 2012; Zhong et al., 2012), and in vertebrates
Frontiers in Microbiology | www.frontiersin.org 2 April 2016 | Volume 7 | Article 519

Poole et al. Role of Complement in Aiptasia pallida
plays a role in the formation of the alternative pathway C3convertase (Sim and Tsiftsoglou, 2004). Functional evidencesuggests that complement proteins play a role in interactions withboth beneficial and harmful microbes in a variety of invertebratespecies (Zhu et al., 2005; Prado-Alvarez et al., 2009; Kvenneforset al., 2010; Collins et al., 2012). However, the dual role ofcomplement in the interaction between symbiosis and diseaseremains unexplored.
The cnidarian complement system is of interest in the contextof both ancestral immunity and symbiosis.Many cnidarians serveas hosts to symbiotic dinoflagellates of the genus Symbiodinium(Davy et al., 2012). The role of innate immunity in the onset,maintenance, and breakdown of this relationship is a key area ofresearch as this symbiosis contributes to the overall health of thecoral reef ecosystem (Hughes et al., 2003; Weis and Allemand,2009; Davy et al., 2012). One growing threat to reefs is coraldisease, which has increased in both prevalence and frequencydue in large part to climate change and anthropogenic stressors(Harvell et al., 2002; Bruno et al., 2003; Sutherland et al., 2004).Despite the role of microbes in both the stability of cnidarian-dinoflagellate symbiosis and in the increasing threat of coraldisease, little is known about the cellular mechanisms cnidariansemploy to interact with either beneficial or pathogenic microbes.Furthermore, many coral diseases disrupt the stability ofcnidarian-dinoflagellate symbiosis, or in some cases specificallytarget the dinoflagellates (Ben-Haim et al., 2003; Cervino et al.,2004), but the interaction between coral disease and symbiosisremains unknown.
With increased availability of cnidarian sequence resources,complement genes, including C3, Factor B, MASP, MBLs, andficolins have been characterized in several species (Dishaw et al.,2005; Kimura et al., 2009; Fujito et al., 2010; Kvennefors et al.,2010; Ganot et al., 2011; Shinzato et al., 2011; Hambleton, 2013;Baumgarten et al., 2015; Ocampo et al., 2015). An interestingobservation that has emerged from some of these studies isthat cnidarians have multiple copies of both C3 and Factor B(Kimura et al., 2009; Ganot et al., 2011; Ocampo et al., 2015).In addition, the sequencing of the Aiptasia pallida (also knownas Exaiptasia pallida, Grajales and Rodriguez, 2014) genomerevealed an expansion in fibrinogen domain-containing proteins,many of which are similar to ficolins (CniFLs) (Baumgartenet al., 2015). The multiple copies of complement proteins mayallow cnidarians to detect and respond to a greater diversity ofMAMPs and differentiate between mutualistic and pathogenicmicrobes.
Several of these studies have also provided information aboutthe functional role of complement, specifically C3, in cnidarians.C3 gene expression is upregulated in response to challengewith certain bacterial species in the coral Acropora millepora(Kvennefors et al., 2010; Brown et al., 2013), which providessome evidence for the traditional role of complement in defenseagainst harmful microbes. Studies have also determined thatcomplement gene expression and proteins are localized to thegastrodermal tissue, the layer where the symbiotic dinoflagellatesreside (Kimura et al., 2009; Fujito et al., 2010; Kvennefors et al.,2010; Ganot et al., 2011), suggesting they may play a role in thephagocytosis and entry of symbionts into host cells.
Overall, while there is some evidence to suggest complementproteins participate in cnidarian-dinoflagellate symbiosis andchallenge with pathogens, their precise role in these processesremains unknown. In addition, while most studies on cnidariancomplement have focused on C3, the functional role of othercomplement components, such as the serine proteases Factor Band MASP, is largely unexplored. A. pallida represents a modelsystem for cnidarian-dinoflagellate symbiosis that can be usedto explore the functional role of complement in cnidarians. A.pallida is easily maintained in the laboratory in both symbioticand aposymbiotic states, which makes it a good model forstudying the onset of symbiosis and the interaction betweensymbiosis and disease (Weis et al., 2008). There has beenpreliminary work to show A. pallida C3 protein is localized tothe epidermis surrounding the mouth and at the basal surfaceof the gastrodermal cells, but other complement molecules havenot been investigated (Hambleton, 2013). The purpose of thisstudy was to investigate the role of A. pallida Factor B andMASP genes in the onset and maintenance of symbiosis and inresponse to pathogenic bacteria using a qPCR-based approach.In addition, we investigated the existence of multiple Factor Bgenes in different invertebrates to determine whether these werethe result of invertebrate-wide or lineage-specific expansions.Overall, this study contributes to an understanding of the roleand evolution of the complement system in basal metazoans.
MATERIALS AND METHODS
Complement Sequence BioinformaticSearches and Phylogenetic AnalysisPrevious studies revealed that cnidarians and other invertebrateshave multiple copies of complement genes (Yoshizaki et al.,2005; Kimura et al., 2009; Shinzato et al., 2011; Ocampo et al.,2015), and therefore we were interested in examining whetherthese were the result of lineage-specific or invertebrate-wideexpansions, with a particular focus on cnidarian sequences. Avariety of invertebrate genomic and transcriptomic resourceswere searched for C3, Factor B and MASP sequences. Publishedinvertebrate proteins were obtained from NCBI (http://www.ncbi.nlm.nih.gov) and these sequences were used as queriesfor the databases listed in Supplementary Table 4. For thesesearches, invertebrate databases were queried for complementproteins using either BLASTp or tBLASTn searches, with themost closely related annotated protein sequence available. Toconfirm that these sequences were complement related, they weretranslated using the ExPASy translate tool (http://web.expasy.org/translate/) and the protein sequence was used as a query in aBLASTp search of the non-redundant (NR) protein database inNCBI (http://blast.ncbi.nlm.nih.gov/Blast.cgi). A sequence wasonly used for further analysis if the reciprocal top blast hits wereto the complement protein of interest. Factor B phylogeneticanalysis and a multiple sequence alignment were performedon the protein sequences using the MAFFT v 7.017 plug-inthrough Geneious using the default settings (Katoh et al., 2002;Drummond et al., 2011). The Factor B sequences were trimmedprior to alignment to contain only the VWA (Von Willabrand
Frontiers in Microbiology | www.frontiersin.org 3 April 2016 | Volume 7 | Article 519

Poole et al. Role of Complement in Aiptasia pallida
Factor type A) and trypsin domains using Pfam annotationsdue to the variable number of CCP repeats present (http://pfam.sanger.ac.uk; Punta et al., 2012). Sequences that did not spanthe majority of the alignment or that did not visually align wellwere removed and regions with gaps were trimmed manually.To determine the best model of protein evolution, ProtTest v 2.4(Abascal et al., 2005) was run and results were compared usingstatistical frameworks for all possible substitution matrices andimprovements. The best model was determined to be LG+I+G.Maximum likelihood phylogenetic analysis was performed usingthe PhyML 3.0 web server (http://www.atgc-montpellier.fr/phyml; Guindon and Gascuel, 2003) using the appropriate modelof protein evolution and 500 bootstrap replicates. FigTree v1.4(http://tree.bio.ed.ac.uk/software/figtree/) was used to visualizeand midroot the resulting tree with the highest likelihood and tocolor-code the tree by phylum.
Animal and Algal MaintenanceSymbiotic A. pallida (VWA population) were maintained at rtunder a 12 h light:dark cycle with light intensity of approximately40 µmol quanta m−2 s−1. The VWA population is a Weislab specific strain that has been in existence since 2002 and iscomposed of clade B containing animals from multiple sourcesincluding a local shark tank. To prepare aposymbiotic A. pallida,symbiotic animals were chilled at 4◦C for 6 h, two times aweek for 6 weeks (Muscatine et al., 1991). After the first cold-shock, animals were kept in the dark to avoid re-populationwith symbionts and cleaned regularly to remove expelleddinoflagellates. All animals were fed brine shrimp (Artemia)two times per week. Symbiodinium minutum CCMP830 (cladeB1) cultures were maintained in F/2 media at 25◦C on a 12 hlight:dark cycle with a light intensity of 40µmol quanta m−2 s−1.New cultures were started each month, in which 50mL of F/2media was inoculated with 1mL of concentrated dinoflagellates.Cultures were grown to a concentration of approximately 106
cells/mL before use in experiments.
Culturing of S. marcescensS. marcescens was cultured either in marine broth (Difco 2216)liquid media or plates at 30◦C. As S. marcescens is resistant totetracycline (Cory Krediet, personal communication) the plateswere supplemented with 10 µg/ml of tetracycline hydrochloride(Sigma, St. Louis, MO) in order to ensure purity of the cultureas previously described (Krediet et al., 2013). Liquid cultureswere grown in a shaking incubator at 200 rpm overnight for 18 hbefore use in experiments.
Obtaining Sequences for A. pallida FactorB and MASP TranscriptsInitially, sequences for Factor B and MASP genes were obtainedby a combination of sequence searches in early assembliesof the aposymbiotic CC7 A. pallida transcriptome and rapidamplification of cDNA ends (RACE) (Lehnert et al., 2012). AllBLAST searches of the transcriptome were performed throughGeneious v 5.4.3 (Drummond et al., 2011). Updated versionsof the transcriptome were searched for Factor B and MASPsequences as they became available. The sequences presented
in this study are from a reassembled version of the rawIllumina sequence reads for accession SRR696721 that weredownloaded from the sequence read archive (SRA) entry for theaposymbiotic CC7 transcriptome (http://www.ncbi.nlm.nih.gov/sra/SRX231866) using Trinity (Grabherr et al., 2011). Nucleotidesequences were translated using the ExPASy translate tool (http://web.expasy.org/translate/) and domain structure graphics for thethree Factor B and MASP proteins based on Pfam annotations(http://pfam.xfam.org) were created in Domain Graph version2.0.1 (DOG) (Ren et al., 2009).
Development of qPCR PrimersTo confirm that the areas in which qPCR primers were designeddid not contain polymorphic sites, each complement transcriptwas amplified in portions of∼500–1000bp using Geneious v 5.4.3with the Primer3 module (Supplementary Table 1; Koressaarand Remm, 2007; Drummond et al., 2011; Untergasser et al.,2012) based on sequences in the early assembly of the CC7aposymbiotic transcriptome (Lehnert et al., 2012). PCRs wereperformed using the Go Taq Flexi kit (Promega, Madison, WI)with the following protocol: 94◦C for 3 min, 35 cycles of 94◦Cfor 45 s, 60◦C for 45 s, and 72◦C for 1min, followed by a finalextension at 72◦C for 10min. The primer sets for each gene wereused on two animals in an effort to capture individual variationthat occurs within the lab population. Products were cloned usingthe pGEM T-easy kit (Promega, Madison, WI) and plasmidsisolated using the QiaPrep Spin Miniprep Kit (Qiagen, Valencia,CA). Plasmids were checked for inserts of the correct size usingFastDigest EcoRI (Fermentas,Waltham,MA) and sent for Sangersequencing on the ABI 3730 capillary sequence machine inthe Center for Genome Research and Biocomputing (CGRB)at Oregon State University. Based on the sequencing results,conserved regions were targeted for designing qPCR primers inGeneious v.5.4.3 using the Primer3 module that were between100 and 200 base pairs and that amplified product at an annealingtemperature of 60◦C (Table 1). PCR products were cloned andsequenced as described above to confirm amplification of thedesired product.
Symbiotic State qPCRqPCR was performed to determine whether there weredifferences in expression of A. pallida Factor B and MASPgenes between symbiotic and aposymbiotic anemones. Threeaposymbiotic and three symbiotic A. pallida were placed in24-well plates 3 days prior to the start of the experiment andanimals were kept in their respective culturing environments.Anemones were starved for 1 week prior to the experiment toavoid brine shrimp contamination. Animals were snap frozen inliquid nitrogen and were kept at−80◦C until further use.
Recolonization ExperimentsTo determine the role of Factor B and MASP in the onsetof symbiosis, aposymbiotic A. pallida were inoculated withdinoflagellates and gene expression was measured over a 72 hperiod. Animals were placed in 6-well plates with a total volumeof 10mL of 0.45 µm filtered artificial sea water (FASW) andstarved for 4 days prior to the experiment. The morning of the
Frontiers in Microbiology | www.frontiersin.org 4 April 2016 | Volume 7 | Article 519
Poole et al. Role of Complement in Aiptasia pallida
TABLE 1 | Primers for qPCR experiments.
Gene qPCR Primers
L10 Forward: 5′- ACG TTT CTG CCG TGG TGT CCC-3′
Reverse: 5′- CGG GCA GCT TCA AGG GCT TCA-3′
L12 Forward: 5′- ACA TCG CCA AGA CAA TGC GTC C-3′
Reverse: 5′- GAC GTC ATG GGG CGG CTG TC-3′
PABP Forward: 5′- GTG CAA GGA GGC GGA CAG CG-3′
Reverse: 5′- TGG GCT GAT TGC GGG TTG CC-3′
GAPDH Forward: 5′-TGG TGG CTG CAC CGT CTG GAT-3′
Reverse: 5′- TGC CAA GGG CGC AAG ACA GT-3′
EF-1 alpha Forward: 5′-GGC CAA ACC CAG AGA GCA CGC-3′
Reverse: 5′- GCT CGC TGT ATG GTG GCT CGG-3′
Ap_Bf-1 Forward: 5′-CGG CAA AGG TGT TGC GTG GC-3′
Reverse: 5′- TGC GGA AAG GCT CCG ATG CG-3′
Ap_Bf-2b Forward: 5′- AGA GCC GTT TGA GCT TGG CCC-3′
Reverse: 5′- CCC CAG CCA GCG ACA TAG CC-3′
Ap_MASP Forward: 5′-GGC GTT CTT GTG GTC ATC CGG G-3′
Reverse: 5’- CCG CGT CGG GTC ACC ATG C-3′
experiment, water changes were performed and the animals wereplaced in 9 mL of FASW. The treatments used for the experimentwere as follows: symbiont+light (SL), no-symbiont+light (NSL),and symbiont+dark (SD). The NSL and SD treatments wereincluded because pilot data indicated that light alone has animpact on complement gene expression (data not shown). TheNSL treatment allowed separation of the effects of light andsymbionts on complement gene expression and the SD treatmentwas used to determine the difference between recolonization inthe light and dark. For each treatment, animals were sampledat 0, 12, 24, 48, and 72 h post-inoculation (n = 3).The SL andSD treatments received 9 mL of FASW, 1 mL of concentrateddinoflagellates, and 40 µl of brine shrimp extract (BSE), whichhas previously been used in onset of symbiosis studies to promotea feeding response, and therefore symbiont uptake (Schwarzet al., 1999; Weis et al., 2002; Harii et al., 2009). The finaldinoflagellate concentration in each well was 2.19× 10⁵ cells/mL.The NSL treatment received an additional 1mL of FASW tocompensate for the volume of dinoflagellates and 40µl of BSE. At24 h post-inoculation, anemones were washed to remove residualsymbionts and placed in 10mL of FASW for the duration ofthe experiment. At each time point, animals were washed, snapfrozen in liquid nitrogen, and kept at−80◦C until further use. Inthis experiment, additional replicates were snap frozen at 24 and72 h post-inoculation for both SL and SD treatments to quantifyrelative levels of symbionts within the host.
Determination of Relative Symbiont Levelsfor Recolonization ExperimentRelative symbiont levels were measured during therecolonization experiment to determine whether establishmentof symbiosis was successful and to allow correlations to bemade between changes in gene expression and symbiont levelswithin the host. Although, there are several methods usedfor quantifying Symbiodinium density, each technique was
developed for particular life-stages (adult vs. larvae), monitoringtime frames, or desired quantification outcomes (absolutevs. relative) (summarized in Supplementary Table 2). Manyof these techniques lack the sensitivity needed to detect lowsymbiont abundance at early time points during onset ofsymbiosis, and those that can detect low symbiont abundanceare only applicable to studies in larvae (Supplementary Table 2).Therefore, after unsuccessfully attempting traditional methods,such as hemocytometer counts and Chl-a concentrations, thegoal was to develop a simple relative qPCR method for symbiontdetection in the adult sea anemone A. pallida.
DNA was extracted from frozen anemones for aposymbiotic,symbiotic, and recolonizedA. pallida (n= 3, except aposymbioticgroup where n = 4) using a modified CTAB protocol (Coffrothet al., 1992). Briefly, anemones (average oral disc = 3.84mm± 0.14) were homogenized in 2% CTAB using a plastic dounceto break up host tissue. Then, a small amount of 0.6mm glassbeads was added to the homogenate and vortexed for 5min tobreak open the cell walls of the CCMP830. To the homogenate,120 µg/ml of Proteinase K (Thermo Scientific, Waltham, MA)was added and the mixture was incubated for 3 h at 65◦C with abrief vortex every 30min. After incubation, chloroform:isoamylalcohol (24:1) was added for phase separation. For DNAprecipitation, 1 mL of cold 95% ethanol and 200mM sodiumacetate were added to the aqueous phase (top layer) and thesolution was incubated overnight at−20◦C. The final DNA pelletwas washed twice with 70% ethanol, dried, and resuspended in10mM Tris Base, pH 8.0.
To estimate relative symbiont density in each anemone, aqPCR assay was designed to compare gene copies of a regionwithin domain 2 of 28S from symbiont nuclear rDNA usingclade B1-specific primers that were previously developed byCorrea et al. (2009). rDNA genes are useful for detectingSymbiodinium clades from complex assemblages in hospite(Correa et al., 2009; Arif et al., 2014), however these multicopygenes present challenges for absolute quantification. The genecopy number of 28S in CCMP830 is currently unknown andtherefore the underlying assumption of this assay is that 28Sgene copy number is the same for each clonal Symbiodiniumcell. In studies that quantify mixed Symbiodinium assemblageswithin a host, accounting for variation in copy number betweensymbionts strains is important to obtain accurate results, but itis unnecessary in this study since the levels of just one symbionttype are quantified. Thus, as symbiont numbers increase duringearly stages of symbiosis establishment, the 28S gene copies willincrease proportionally resulting in greater PCR amplification.To account for differences in the A. pallida size, qPCR wasalso performed on the nuclear ribosomal protein L10 (primersin Table 1). The L10 primer set was validated for high PCRefficiency and amplification specificity of A. pallida DNA. Eachsample was run in triplicate on the MasterCycler RealPlex4 real-time PCR machine (Eppendorf, Hamburg, Germany). For eachprimer set, 15 µl volume qPCR reactions were prepared asfollows: 20 ng µl−1 genomic DNA, 0.4 µM of the forward andreverse primers, 7.5 µl of 2 × SensiFAST SYBR Hi-ROX mastermix (Bioline USA, Boston, MA), and enough molecular gradeH2O to reach final volume. No-template negative controls were
Frontiers in Microbiology | www.frontiersin.org 5 April 2016 | Volume 7 | Article 519

Poole et al. Role of Complement in Aiptasia pallida
run for each primer pair to check for reagent contamination. Theprofile for the qPCR run was as follows: 95◦C for 2min for initialdenaturing, followed by 40 cycles of 95◦C for 5 s, 60◦C for 10 s,and 72◦C for 20 s. A dissociation curve [95◦C for 15 s, 60◦C for15 s, ramping temperature gradient (60–95◦C) for 20min, and95◦C for 15 s] on the final PCR product was performed to confirmsingle amplicon detection.
The fluorescence baseline and threshold set by the RealPlex4
machine was used to calculate Ct values, or the first reaction cyclein which fluorescent detection exceeds baseline. Following theLivak 211Ct method (Livak and Schmittgen, 2001), the symbiont28S Ct from each anemone was normalized to the correspondinganemone reference L10 Ct. The normalized values (1Ct) weresubtracted from the maximum 1Ct (lowest amplification) toobtain the ratio of relative quantities of 28S rDNA per anemone(11Ct). All values are expressed as mean relative quantityon the log2 scale ± standard error. Relative quantities of 28SrDNA in symbiotic, aposymbiotic and recolonized anemoneswere compared using a 1-tailed Wilcoxon rank- sum test at asignificance threshold of p ≤ 0.05.
Challenge with S. marcescensPrior to the challenge with S. marcescens, experiments wereperformed in which aposymbiotic A. pallida were challengedwith the individual immune stimulants lipopolysaccharide (LPS)and peptidoglycan (data not shown). However, due to thelack of significant differences in gene expression observed inthese studies, we performed the challenge with live bacteria.Aposymbiotic and symbiotic A. pallida were placed in 6-wellplates approximately 2 weeks prior to the experiment and waterchanges were performed every other day. Anemones were kept intheir respective culturing environments and were fed twice eachweek as previously described. One week prior to the experiment,water changes were performed with FASW in order to createa more sterile environment for the experiment. Twenty fourhours prior to the start of the experiment, the well plates wereplaced on a shaker table at 65 rpm to acclimate the anemonesto the experimental conditions as previously described (Kredietet al., 2013) The symbiotic anemones were kept at rt underambient lighting on a 12 h light:dark cycle to mimic the naturallight conditions. The plates with aposymbiotic anemones werecovered to maintain their normal culturing conditions in thedark.
An overnight culture of S. marcescenswas grown from a singlecolony and 25mL was removed and centrifuged for 8min at10,000 rpm to pellet the bacteria. The pellet was washed 3 timesin autoclaved FASW and the final suspension was diluted toapproximately 104 and 107 cells/mL based on OD600 readings.Anemones of each symbiotic state were divided into threetreatment groups. To the control treatment, 9mL of FASW wasadded to the well. The second treatment was a low concentrationof S. marcescens in which 9mL of the 104 cells/mL dilution wasadded to the well. The third treatment was a high concentrationof S. marcescens in which 9mL of the 107 cells/mL dilution wasadded to the well (n = 3 for all treatment types). The anemoneswere placed on the shaker table at 65 rpm for the duration of theexperiment and animals were snap frozen in liquid nitrogen at
0, 24, and 48 h post-challenge with S. marcescens. Samples werekept at−80◦C until further use.
RNA Extraction and cDNA SynthesisFor all animals that were sampled for symbiotic state,recolonization, and S. marcescens challenge experiments, totalRNA was extracted using a hybrid of the TRIzol Reagent(Life Technologies, Eugene, OR) and RNeasy mini kit (Qiagen,Valencia, CA). Each anemone was homogenized in 500 µL ofTRIzol, followed by a centrifugation step to remove debris. Achloroform extraction was performed and the resulting aqueouslayer was transferred to a new RNAse-free tube and an equalvolume of cold 100% ETOH was added. The samples were thenapplied to the spin columns from the RNeasy kit and washes wereperformed per the manufacturer’s protocol. RNA was eluted ina final volume of 30 µl of nuclease-free water. The DNA-freekit (Ambion, Waltham, MA) was used to remove contaminatinggenomic DNA and DNased samples were analyzed using theNanodrop ND-1000 (Nanodrop Technologies, Wilmington, DE)and resolved on a 1% TBE gel to assess quality and quantityof the RNA obtained. Samples that had a nanodrop 260/230ratio of less than 1.5 underwent an additional cleanup protocolthat involved the addition of 10% 3 M sodium acetate (pH5.2), RNA-grade glycogen (Fermentas, Waltham, MA) to afinal concentration of 0.05–1.0 µg/mL, and 2.5 volumes of100% ETOH to the sample. Following precipitation overnightat −80◦C, samples were centrifuged for 20min at 9500 rpm(4◦C) to pellet the RNA. The pellet was washed with 250 µlof 70% ETOH, centrifuged for 5min at the same conditionslisted above, and dried before resuspending in 20 µl of nuclease-free water. cDNA synthesis was performed with the SuperscriptIII first strand synthesis system (Life Technologies, Eugene,OR) using 750 ng of RNA and the Oligo dT primer. Beforeuse in qPCR, cDNA samples were diluted to a final volumeof 50µl.
qPCRFor qPCR, samples were run in triplicate, and plates includedno-template, no-reverse transcriptase, and no-primer controls,and at least one interplate calibrator (IPC) (except for symbioticstate experiment). The total reaction volume used was 20 µl,which included 7.5 µl of water, 1 µl of each forward and reverseprimer (5 µmol), 0.5 µl of the appropriate cDNA template,and 10 µl of Power SYBR Green PCR Master Mix (AppliedBiosystems, Waltham, MA). qPCR plates were run using theABI PRISM 7500 FAST (Applied Biosystems, Waltham, MA)under the standard settings, using the default run protocol withthe addition of a melt curve. The Ct values were exportedfrom the machine and imported into GenEx Standard version5.3.7 (http://www.multid.se). The Ct values were corrected usingthe interplate calibrator when applicable, qPCR replicates wereaveraged, and target gene expression was normalized to thereference genes. These values were exported from GenEx andto calculate the 11Ct, the normalized value for each samplewas subtracted from the average normalized value of a referencesample. The resulting relative quantities on the log2 scale wereused for statistical analysis. For the symbiotic state comparison,
Frontiers in Microbiology | www.frontiersin.org 6 April 2016 | Volume 7 | Article 519

Poole et al. Role of Complement in Aiptasia pallida
the aposymbiotic samples served as a reference and a 2-tailedWilcoxon rank-sum test was performed for each gene. Forthe recolonization experiments, the light and dark data wereanalyzed separately. For the light data, the NSL sample at eachtime point was used as a reference, while for the SD samples,time zero was used as the reference sample. Lastly, for the S.marcescens challenge, the control sample at each time point wasused as a reference. For all of these experiments, a linear modelwas created, model testing was performed when applicable,and an ANOVA was run followed by Tukey’s post-hoc test forpairwise comparisons. All statistical analysis was performed in Rversion 3.2.1 (RCoreTeam, 2015)
Determination of qPCR Reference GenesPrior to performing qPCR on the genes of interest, referencegenes that had stable expression across treatments weredetermined. The candidate reference genes and samples testedfor each experiment are summarized in Supplementary Table3. qPCR was run on these samples in triplicates for eachcandidate reference gene, including no-template and no-primercontrols, and the resulting Ct values were entered into GeNorm(Vandesompele et al., 2002), Normfinder (Andersen et al.,2004), and Best Keeper (Pfaffl et al., 2004). The resultsof these programs were compared to determine the threebest reference genes for each experiment (SupplementaryTable 3). The reference genes from the symbiotic state andrecolonization experiments were used for the S. marcescenschallenge experiment because they were shown in this studyto have stable expression between symbiotic states and duringchallenge with microbes and therefore were deemed the mostappropriate.
RESULTS
Complement Sequence Distribution acrossthe Invertebrate PhylaSequences for complement proteins were obtained from a varietyof invertebrate phyla (Supplementary File 1) and differentdistribution patterns emerged for each protein. C3 and FactorB were found in the most phyla, but the distribution of MASPswas much more limited (Figure 2). MASPs were only found infour phyla, the Porifera, Cnidaria, Hemichordata, and Chordata(Subphylum Cephalochordata and Urochordata). No evidence ofcomplement genes was identified in the Ctenophora, Placozoa,and Annelida.
Another trend emerging from these data is that complementgene content varied across taxonomic divisions within a phylum.For example in Phylum Cnidaria, members of Class Anthozoapossess C3, Factor B, and MASP, but for the member of ClassHydrozoa examined in this study, only a MASP sequence wasfound. Class-level differences also occurred within membersof Porifera and Mollusca, and at the subphylum level forArthropoda. However, this is based on currently available dataand more invertebrate sequence data will be needed to confirmthese trends.
FIGURE 2 | Summary of Distribution of complement in the invertebrate
phyla. Presence or absence of complement proteins genes C3, Factor B, and
MASP is shown for each invertebrate phylum for which sequence databases
were searched. A checkmark indicates presence while an empty box indicates
absence based on available data.
Phylogenetic Analysis of Factor B inInvertebratesTo determine whether having multiple genes for eachcomplement protein was the result of lineage-specific orinvertebrate-wide expansions, maximum likelihood phylogeneticanalysis was performed on Factor B sequences obtained fromthe invertebrate phyla (Figure 3). Many of the shorter sequencefragments obtained from transcriptomic resources were notincorporated into the phylogenetic analysis. The resulting treerevealed that while most sequences grouped in a phylum-specificmanner, Cnidaria and Hemichordata sequences split intodifferent groups on the tree. For Cnidaria, there was one groupcomposed of Bf-2 and Bf-3 sequences, while the Bf-1 sequencesgrouped with high support with the Cephalochordata andone Hemichordata sequence. The two Saccoglossus kowalevskii(Hemichordata) sequences appeared in very different placeson the tree (Figure 3). Sk_Bf-1 grouped with high supportwith the Cephalochordata and Cnidaria Bf-1 sequences, whileSk_Bf-2 grouped weakly with the Arthropoda and Urochordata(Figure 3).
A. pallida Sequence Resources RevealedThree Factor B, and one MASP TranscriptThree Factor B and one MASP transcript were obtained throughRACE and searches of theA. pallida transcriptome (Lehnert et al.,2012; Supplementary File 1). The three Factor B proteins havedifferent domain structures at the N-terminal end (Figure 4).Ap_Bf-1 has an epidermal growth factor (EGF) domain and twocomplement control protein motifs (CCP), while Ap_Bf-2a andAp_Bf-2b lack the EGF domain and have 4 and 5 CCP domainsrespectively. All Factor B protein sequences have a VWA andtrypsin domain at the C-terminal end. The Ap_Bf-2a was only
Frontiers in Microbiology | www.frontiersin.org 7 April 2016 | Volume 7 | Article 519

Poole et al. Role of Complement in Aiptasia pallida
FIGURE 3 | Maximum likelihood phylogenetic analysis of Factor B proteins in invertebrates. Sequences are color coded by phylum (subphylum for
chordates) and circles at each node represent bootstrap support. Blue, Porifera; Red, Cnidaria; Yellow, Mollusca; Purple, Arthropoda; Orange, Echinodermata; Green,
Hemichordata; Magenta, Cephalochordata (subphylum); Aqua, Urochordata (subphylum). Filled circles = 85–100% bootstrap support, half-filled = 70–84% bootstrap
support, and open circles = 50–69% bootstrap support.
FIGURE 4 | Domain structures of A. pallida Factor B and MASP sequences. A. pallida has three Factor B and one MASP gene. EGF, epidermal growth factor;
CCP, complement control protein motif; VWA, Von Willabrand Factor type A domain; Trypsin, serine protease domain; CUB, complement C1r/C1s, Uegf, Bmp1.
Frontiers in Microbiology | www.frontiersin.org 8 April 2016 | Volume 7 | Article 519

Poole et al. Role of Complement in Aiptasia pallida
recovered in later versions of the A. pallida transcriptomeand therefore was not available when most of the functionalwork was conducted. However, it was used in phylogeneticanalysis. The domain structure of Ap_MASP is identical to otherannotated invertebrate and vertebrate sequences (Figure 4).The three sequences used in the qPCR studies have beensubmitted to NCBI with the following accession numbers;KU747967 (Ap_Bf-1), KU747968 (Ap_Bf-2b), and KU747969(Ap_MASP).
Ap_Bf-2b and Ap_MASP Show a Trend ofRepressed Expression in SymbioticA. pallidaComparison of gene expression between aposymbiotic andsymbiotic A. pallida revealed no significant differences inexpression for all three genes, potentially due to the largeindividual variation that was observed and small samples sizes(Figure 5). However, there is a clear trend of lower expressionof both Ap_Bf-2b and Ap_MASP in symbiotic compared toaposymbiotic anemones.
Recolonization Expression Patterns Varyby Gene and light RegimeThe two Factor B andMASP genes each had a distinct expressionprofile during the course of the 72 h recolonization experiment inresponse to light and dark conditions. For the light data, Ap_Bf-1was significantly downregulated for the SL treatment at 12 h post-inoculation with CCMP830 compared to the NSL treatment (p<
0.001, ANOVA, Tukey’s post-hoc test), but at 24 and 72 h post-inoculation was significantly upregulated (p < 0.001, ANOVA,Tukey’s post-hoc test) (Figure 6A). For Ap_Bf-2b, expressionwas significantly downregulated compared to the NSL treatmentat 48 h post-inoculation (p < 0.001, ANOVA, Tukey’s post-hoctest), but returned to levels not significantly different from theNSL control by 72 h post-inoculation (Figure 6B) Ap_MASPshows a similar trend to Ap_Bf-1 in that it was significantlydownregulated compared to the NSL at 24 h post-inoculation (p< 0.001, ANOVA, Tukey’s post-hoc test), but was significantly
FIGURE 5 | Expression of Ap_Bf-1, Ap_Bf-2b, and Ap_MASP as a
function of symbiotic state. The relative quantities from qPCR on the log2scale are shown for aposymbiotic organisms (solid bars) and symbiotic
organisms (bars with lines). Bars represent means ±SE (n = 3).
upregulated compared to the control at 72 h post-inoculation(p < 0.001, ANOVA, Tukey’s HSD) (Figure 6C).
For the SD treatment, all three genes showed consistentdownregulation in comparison to the 0 h time point (Figure 7).
FIGURE 6 | Expression of Ap_Bf-1, Ap_Bf-2b, and Ap_MASP during the
recolonization experiment for symbiont+light (SL) and no
symbiont+light (NSL) treatments. (A) Ap_Bf-1, (B) Ap_Bf-2b, and (C)
Ap_MASP). Bars represent means ± SE (n = 3) and stars (*) represent
expression differences that are significantly different between the SL and NSL
treatments at a particular time point (ANOVA, Tukey’s post-hoc test). *p <
0.05, **p < 0.01, ***p < 0.001.
FIGURE 7 | Expression of Ap_Bf-1, Ap_Bf-2b, and Ap_MASP during the
recolonization experiment for symbiont+dark treamtment (SD). Bars
represent means ± SE (n = 3) and letters represent expression differences that
are significantly different between time points within each gene (ANOVA,
Tukey’s post-hoc test).
Frontiers in Microbiology | www.frontiersin.org 9 April 2016 | Volume 7 | Article 519
Poole et al. Role of Complement in Aiptasia pallida
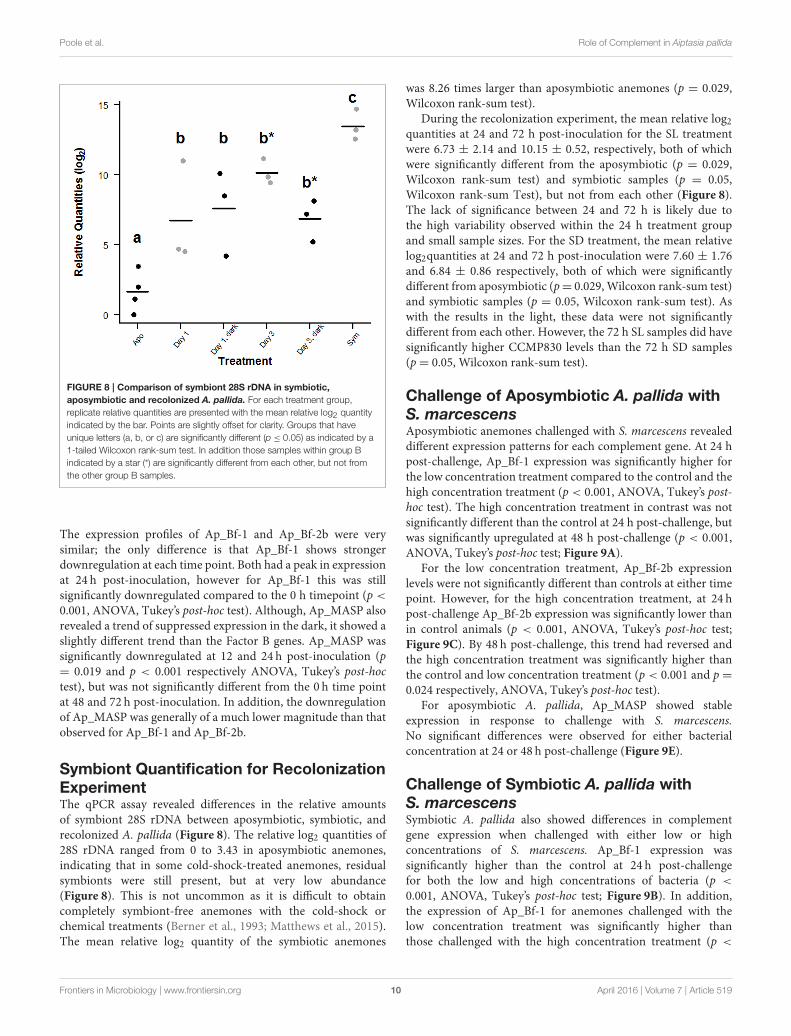
FIGURE 8 | Comparison of symbiont 28S rDNA in symbiotic,
aposymbiotic and recolonized A. pallida. For each treatment group,
replicate relative quantities are presented with the mean relative log2 quantity
indicated by the bar. Points are slightly offset for clarity. Groups that have
unique letters (a, b, or c) are significantly different (p ≤ 0.05) as indicated by a
1-tailed Wilcoxon rank-sum test. In addition those samples within group B
indicated by a star (*) are significantly different from each other, but not from
the other group B samples.
The expression profiles of Ap_Bf-1 and Ap_Bf-2b were verysimilar; the only difference is that Ap_Bf-1 shows strongerdownregulation at each time point. Both had a peak in expressionat 24 h post-inoculation, however for Ap_Bf-1 this was stillsignificantly downregulated compared to the 0 h timepoint (p <
0.001, ANOVA, Tukey’s post-hoc test). Although, Ap_MASP alsorevealed a trend of suppressed expression in the dark, it showed aslightly different trend than the Factor B genes. Ap_MASP wassignificantly downregulated at 12 and 24 h post-inoculation (p= 0.019 and p < 0.001 respectively ANOVA, Tukey’s post-hoctest), but was not significantly different from the 0 h time pointat 48 and 72 h post-inoculation. In addition, the downregulationof Ap_MASP was generally of a much lower magnitude than thatobserved for Ap_Bf-1 and Ap_Bf-2b.
Symbiont Quantification for RecolonizationExperimentThe qPCR assay revealed differences in the relative amountsof symbiont 28S rDNA between aposymbiotic, symbiotic, andrecolonized A. pallida (Figure 8). The relative log2 quantities of28S rDNA ranged from 0 to 3.43 in aposymbiotic anemones,indicating that in some cold-shock-treated anemones, residualsymbionts were still present, but at very low abundance(Figure 8). This is not uncommon as it is difficult to obtaincompletely symbiont-free anemones with the cold-shock orchemical treatments (Berner et al., 1993; Matthews et al., 2015).The mean relative log2 quantity of the symbiotic anemones
was 8.26 times larger than aposymbiotic anemones (p = 0.029,Wilcoxon rank-sum test).
During the recolonization experiment, the mean relative log2quantities at 24 and 72 h post-inoculation for the SL treatmentwere 6.73 ± 2.14 and 10.15 ± 0.52, respectively, both of whichwere significantly different from the aposymbiotic (p = 0.029,Wilcoxon rank-sum test) and symbiotic samples (p = 0.05,Wilcoxon rank-sum Test), but not from each other (Figure 8).The lack of significance between 24 and 72 h is likely due tothe high variability observed within the 24 h treatment groupand small sample sizes. For the SD treatment, the mean relativelog2quantities at 24 and 72 h post-inoculation were 7.60 ± 1.76and 6.84 ± 0.86 respectively, both of which were significantlydifferent from aposymbiotic (p= 0.029,Wilcoxon rank-sum test)and symbiotic samples (p = 0.05, Wilcoxon rank-sum test). Aswith the results in the light, these data were not significantlydifferent from each other. However, the 72 h SL samples did havesignificantly higher CCMP830 levels than the 72 h SD samples(p= 0.05, Wilcoxon rank-sum test).
Challenge of Aposymbiotic A. pallida withS. marcescensAposymbiotic anemones challenged with S. marcescens revealeddifferent expression patterns for each complement gene. At 24 hpost-challenge, Ap_Bf-1 expression was significantly higher forthe low concentration treatment compared to the control and thehigh concentration treatment (p < 0.001, ANOVA, Tukey’s post-hoc test). The high concentration treatment in contrast was notsignificantly different than the control at 24 h post-challenge, butwas significantly upregulated at 48 h post-challenge (p < 0.001,ANOVA, Tukey’s post-hoc test; Figure 9A).
For the low concentration treatment, Ap_Bf-2b expressionlevels were not significantly different than controls at either timepoint. However, for the high concentration treatment, at 24 hpost-challenge Ap_Bf-2b expression was significantly lower thanin control animals (p < 0.001, ANOVA, Tukey’s post-hoc test;Figure 9C). By 48 h post-challenge, this trend had reversed andthe high concentration treatment was significantly higher thanthe control and low concentration treatment (p < 0.001 and p =0.024 respectively, ANOVA, Tukey’s post-hoc test).
For aposymbiotic A. pallida, Ap_MASP showed stableexpression in response to challenge with S. marcescens.No significant differences were observed for either bacterialconcentration at 24 or 48 h post-challenge (Figure 9E).
Challenge of Symbiotic A. pallida withS. marcescensSymbiotic A. pallida also showed differences in complementgene expression when challenged with either low or highconcentrations of S. marcescens. Ap_Bf-1 expression wassignificantly higher than the control at 24 h post-challengefor both the low and high concentrations of bacteria (p <
0.001, ANOVA, Tukey’s post-hoc test; Figure 9B). In addition,the expression of Ap_Bf-1 for anemones challenged with thelow concentration treatment was significantly higher thanthose challenged with the high concentration treatment (p <
Frontiers in Microbiology | www.frontiersin.org 10 April 2016 | Volume 7 | Article 519

Poole et al. Role of Complement in Aiptasia pallida
FIGURE 9 | Expression Ap_Bf-1, Ap_Bf-2b, and Ap_MASP in and aposymbiotic (A,C,E) and symbiotic A. pallida (B,D,F) in response to challenge with
S. marcescens for low bacterial concentrations (104 cells/mL) or high bacterial concentrations (107 cells/mL). The relative quantities on the log2 scale are
shown and bars represent ±SE (n = 3). Letters indicate significant differences in expression within a time point (ANOVA, Tukey’s post-hoc test).
0.001, ANOVA, Tukey’s post-hoc test). At 48 h post-challenge,expression of Ap_Bf-1 was not significantly different between thethree treatment groups.
Ap_Bf-2b expression for symbiotic animals showed a verydifferent pattern than Ap_Bf-1. At 24 h post-challenge, anemonesinoculated with the low concentration treatment had significantlylower expression than control animals (p < 0.001, ANOVA,Tukey’s post-hoc test), but those inoculated with the highconcentration treatment were not significantly different from thecontrol animals (Figure 9D). By 48 h post-challenge, expressionof Ap_Bf-2b for animals challenged with the high concentrationtreatment was significantly higher than the low concentrationtreatment and the control (p < 0.001, ANOVA, Tukey’s post-hoctest), while the low concentration treatment was not significantlydifferent than the control treatment.
Ap_MASP showed a similar trend to Ap_Bf-1 in that at24 h post-challenge the low concentration treatment showedsignificantly higher expression than the high concentrationtreatment and control anemones (p < 0.001, ANOVA Tukey’spost-hoc test), but returned to levels that were not significantlydifferent than the control by 48 h post-challenge (Figure 9F).Ap_MASP expression for the high concentration treatment wasnot significantly different than the control animals at either 24 or48 h post-challenge.
Complement Gene Expression inResponse to Challenge withS. marcescens is Different for Symbioticand Aposymbiotic A. pallidaAnother interesting trend to emerge from the S. marcescens
challenge data was the difference between the responses of
symbiotic and aposymbiotic A. pallida. First, the symbiotic
states differed in their levels of complement expression at time
zero. Ap_Bf-1 was significantly higher in symbiotic compared
to aposymbiotic anemones (p = 0.05, Wilcoxon rank-sum test),
while Ap_Bf-2b and Ap_MASP expression was significantly
lower in symbiotic anemones (p = 0.05, Wilcoxon rank-sum
test; Figure S1). There were also expression differences during
the duration of the experiment. For Ap_Bf-1, although both
symbiotic states overall showed similar trends, in symbioticanimals both the high and low concentration treatments resultedin significantly increased expression at 24 h post-challenge, whilefor aposymbiotic animals only the low concentration treatmentwas significantly different than the control (Figures 9A,B). ForAp_Bf-2, aposymbiotic animals only showed significant changesin expression in response to the high concentration treatment,while symbiotic animals showed downregulation in response tothe low concentration treatment and upregulation in response
Frontiers in Microbiology | www.frontiersin.org 11 April 2016 | Volume 7 | Article 519
Poole et al. Role of Complement in Aiptasia pallida
to the high concentration treatment (Figures 9C,D). Lastly themost striking difference can be observed for Ap_MASP, inwhich symbiotic animals showed upregulation in response tothe low concentration treatment, while there were no significantdifferences in expression observed in aposymbiotic animals(Figures 9E,F).
DISCUSSION
Bioinformatic Searches Reveal UniqueEvolutionary Patterns of ComplementGenes within Each Invertebrate PhylumThe search for complement genes in the invertebrate phylarevealed several new pieces of information. First, this studyrepresents the first report of Factor B and C3 molecules inPhylum Porifera, from the species Oscarella carmela. MASPsand TEPs have previously been reported in members of ClassHomoscleromorpha (Riesgo et al., 2014), but this representsthe first in-depth look at the complement sequences in thisclass. This is a surprising discovery given that the genome ofAmphimedon queenslandica, a member of Class Demospongiae,does not contain C3, Factor B, or MASP (Riesgo et al., 2014).Differences in the presence of complement genes by taxonomicgroups within a phylum also occur within Arthropoda andMollusca (Figure 2). The members of Subphylum Crustaceaand Subphylum Hexapoda examined, such as Daphnia pulexand Apis mellifera, do not have complement genes which isconsistent with previous reports from Drosophila melanogaster(Adams et al., 2000). In contrast, members of SubphylumChelicerata have C3 and in some cases, Factor B sequences.Chelicerata is considered basal within Arthropoda, and it haspreviously been suggested that complement genes were lost inHexapoda and possibly Crustacea, a hypothesis which is furthersupported by the data in this study (Sekiguchi et al., 2012;Sekiguchi and Nonaka, 2015). Deeper sampling within thesephyla will allow for a better understanding of the evolutionof complement genes. These results also indicate that cautionshould be used when making generalizations about the genecontent of a phylum based on sampling of only a few species.Lastly, these differences within a phylum present interestingevolutionary questions about the patterns of complementgene loss and what adaptive pressures have resulted in theseevents.
Differences in complement gene content between classeswithin a phylum also occur in Phylum Cnidaria. Membersof Class Anthozoa possess at least two C3 genes, 2-3 FactorB genes, and one MASP gene. However, for the hydrozoan,Hydra vulgaris AEP, only one MASP gene is present in thetranscriptome (Hemmrich et al., 2012). The genome of Hydramagnipapillata was also searched and revealed fragments ofthe MASP gene, but no C3 or Factor B. Hydra representsa unique case for complement evolution because it is theonly organism in this study that has MASP, but not C3 orFactor B. At this time, there have been no studies performedon the Hydra MASP, but how this protein functions in theabsence of other complement components warrants furtherinvestigation.
Overall, sequences of complement genes identified ininvertebrates indicates that the evolutionary history of C3,Factor B, and MASP is complex and that there have beenmultiple occurrences of either gene loss or gene duplicationthat warrant further investigation. The evolutionary pressuresthat have led to these events are currently unknown, buta testable hypothesis is that they are linked to lifestyle andthe diversity of the microbial community interacting with theanimal host.
Phylogenetic Analysis of Factor B Revealsthat Multiple Complement Genes Appearto be the Result of Lineage-specific Ratherthan Invertebrate-wide Evolutionary EventsMaximum likelihood phylogenetic analysis of Factor B proteinsin invertebrates revealed that most sequences grouped in aphylum-specific manner (Figure 3). This suggests that themultiple copies of complement genes are likely the result oflineage-specific rather than invertebrate-wide expansions, butthese may occur at either the phylum level or at higher taxonomicdivisions. The exception was that the Cnidaria andHemichordatasequences each fall within two different clades on the tree. Thecnidarian Bf-2 and Bf-3 sequences form a group on the tree withhigh support, but the Bf-1 sequences form a highly supportedgroup with the cephalochordate and one of the hemichordatesequences. The other Hemichordata sequence grouped with theArthorpoda and Urochordata. As most of these groupings arehighly supported, this suggests that Factor B may have a complexevolutionary history. Future, work describing the functionaldivergence of Factor B genes in cnidarians may provide moreinsight into these potential gene duplication events.
Another interesting observation about Factor B is thedifference between corals and anemones. Coral sequences formthree distinct Bf-1, Bf-2, and Bf-3 groups on the tree, whileanemones lack sequences that group with the coral Bf-3 group.However, support for placement of the anemone sequenceswas weak, therefore further work needs to be performed todetermine the phylogenetic relationship of anthozoan Factor Bsequences. In addition, A. pallida and Anthopleura elegantissimahave three Factor B sequences, while Nematostella vectensis hasonly two. From the limited taxa surveyed, it is difficult to fullyunderstand the evolutionary history of Factor B in cnidarians,but as more sequence data become available, future studies canfurther investigate these patterns. Based on the current data, atestable hypothesis is that the number of Factor B genes maybe related to symbiotic state as all the symbiotic cnidarians inthis study had three Factor B genes, while the non-symbioticanemone N. vectensis has only two.
Overall, from the phylogenetic analysis of Factor B it canbe concluded that the presence of multiple copies of FactorB in some phyla is generally the result of lineage-specificand not invertebrate-wide expansions. Therefore, potential geneduplication and subsequent functional divergence or gene lossevents may have occurred in response to the lifestyle orenvironmental conditions that a particular taxonomic groupexperienced through evolutionary time.
Frontiers in Microbiology | www.frontiersin.org 12 April 2016 | Volume 7 | Article 519

Poole et al. Role of Complement in Aiptasia pallida
Reduced Ap_Bf-2b and Ap_MASPExpression in the Symbiotic StateSuggests Immunomodulation of the HostImmune System in Order to MaintainSymbiosisIn the original comparison between symbiotic and aposymbioticanemones, there were no significant differences in expression,but there was a trend of repressed Ap_Bf-2b and Ap_MASPexpression in symbiotic animals compared to aposymbioticanimals (Figure 5). Furthermore, a comparison of the 0 h timepoint between symbiotic and aposymbiotic animals for theS. marcescens challenge showed the same trends obtained duringthe original symbiotic state comparison with the exceptionthat in this experiment, all three genes were significantlydifferentially expressed between symbiotic states (Figure S1).Together these results suggest that Ap_Bf-1 is upregulatedin symbiotic anemones, while Ap_Bf-2b and Ap_MASP aredownregulated in symbiotic animals. However, as the magnitudeof these differences varied across experiments, higher samplesizes could help to confirm these results. Overall, these datasuggest that the presence of symbionts modulates expression ofhost complement system genes.
The idea that microbes can alter the functioning of the hostimmune system has been shown in many systems, includingcnidarian-dinoflagellate symbiosis. For example, previous workrevealed that stimulation with LPS resulted in the productionof higher levels of nitric oxide (used as a proxy for an immuneresponse) in aposymbiotic compared to symbiotic A. pallida(Detournay et al., 2012). In addition, the CniFL genes, whichencode ficolin-like proteins that may serve as PRRs overall hadgreater expression in aposymbiotic than symbiotic A. pallida(Baumgarten et al., 2015). Together, these data suggest thatthe presence of symbionts suppresses some aspects of the hostimmune response, which is similar to the results obtained forAp_Bf-2b and Ap_MASP. Furthermore, the results obtainedfor Factor B in this study are similar to those for C3 in theanemone Anemonia viridis, where one C3 isoform had repressedexpression in symbiotic animals, while the other showed nodifference between symbiotic states (Ganot et al., 2011). Whilethe suppression of certain immune pathways may be importantfor tolerance of mutualistic microbes within host cells, it is likelythat this may also influence the interactions between cnidariansand pathogenic microbes they encounter, perhaps making themsusceptible to secondary infections.
Immune modulation of the host also occurs in the symbiosisbetween the squid Euprymna scolopes and the luminescentbacterium Vibrio fischeri and has specifically been documentedfor the complement system. C3 expression was detected in naïveor cured host hemocytes, but not in those from individuals withfully colonized light organs, suggesting that the complementresponse in symbiotic organisms is suppressed (Collins et al.,2012). In the context of these studies, it can be hypothesizedthat the repressed expression of Ap_Bf-2b and Ap_MASP inthe symbiotic state allows for maintenance of the symbiosisand aids in preventing the host from mounting an immuneresponse against the symbionts. This is also supported by the
downregulation of A. pallida CnidFLs genes in the symbioticstate, which potentially serve as upstream PRRs that activatethe complement system (Baumgarten et al., 2015). Ap_Bf-1 incontrast, may directly interact with symbionts and promote astable partnership. Overall, the results from the symbiotic statecomparison support immunomodulation of the host by thesymbiont and provide the first line of evidence for the functionaldivergence of Ap_Bf-1 and Ap_Bf-2b.
Recolonization Experiments RevealUpregulation of Ap_Bf-1 and Ap_MASP, butDownregulation of Ap_Bf-2b in the Light atthe Onset of SymbiosisThe recolonization experiment revealed significant upregulationof Ap_Bf-1 and Ap_MASP by 72 h post-inoculation in thelight compared to the control NSL treatment (Figures 6A,C).Symbiont quantification revealed a trend of increasing symbiontlevels in the host between 24 and 72 h post-inoculation(Figure 8). Since anemones were washed at 24 h post-inoculation, increased symbiont densities at 72 h could be a resultof symbiont proliferation within the host tissue, which suggestssuccessful uptake and establishment of symbiosis. Therefore thecorresponding increase in Ap_Bf-1 and Ap_MASP expression atthe same time points may indicate a role for these proteins in theestablishment of a successful symbiosis. Specifically, as they areupregulated when symbionts are proliferating in host tissue theymay be involved in entry of symbionts into host cells. Ap_Bf-1was also significantly upregulated by 24 h post-inoculation whichalso suggests it may play a role in the initial recognition andphagocytosis of symbionts.
Ap_Bf-2b was downregulated at 48 h post-inoculationcompared to the NSL control treatment, but returned to levelsthat were not significantly different from the control by 72 hpost-inoculation (Figure 6B). Later time points could establisha more conclusive trend in expression, but the downregulationof Ap_Bf-2b is consistent with the data from the symbiotic statecomparison that revealed that the presence of symbionts leads torepressed Ap_Bf-2b expression. Future experiments that studythe transition from the onset to a fully established partnershipwould be useful to further explore this trend.
Complement Gene Expression isSuppressed during Inoculation withSymbionts in the DarkThe DS treatment resulted in downregulation of all threecomplement genes for the majority of the 72 h recolonizationexperiment (Figure 7). The overall trend of Ap_Bf-1 and Ap_Bf-2b expression was identical. Ap_MASP showed a similar trend tothe Factor B genes, but the lowest expression was offset by 24 h,and reached a low point at 48 h post-inoculation. Ap_MASP alsoshowed much less dramatic downregulation than either of theFactor B genes compared to the 0 h time point.
The observed repression of complement gene expression inthe dark suggests that light is an important signal for expressionof complement genes. This is not a surprising result because lightand symbiosis with photosynthetic Symbiodinium are tightly
Frontiers in Microbiology | www.frontiersin.org 13 April 2016 | Volume 7 | Article 519

Poole et al. Role of Complement in Aiptasia pallida
coupled and light-induced expression has also been observedfor sym32, a cell adhesion protein previously shown to beinvolved in symbiosis in the anemones A. elegantissima andA. viridis (Schwarz, 2002; Ganot et al., 2011). The observedrepression of complement gene expression in the dark mayalso be related to the fact that symbiont levels in hostdecreased slightly (not significantly) between 24 and 72 h post-inoculation indicating that CCMP830 in the dark were notproliferating within the host as was suggested by the lightdata (Figure 8). Therefore complement gene expression may berepressed when conditions are not favorable for a successfulpartnership.
Challenge with a Low Concentration ofS. marcescens Results in OpposingResponses for Ap_Bf-1 and Ap_MASPCompared to Ap_Bf-2bAt 24 h post-challenge with S. marcescens, Ap_Bf-1was significantly upregulated in both aposymbiotic andsymbiotic animals exposed to low concentrations of bacteria(Figures 9A,B). The same trend was observed for Ap_MASP insymbiotic animals only (Figures 9E,F). By 48 h post-challenge,this difference is no longer significantly different than the controlfor either symbiotic state, which suggests that Ap_Bf-1 andAp_MASP are more responsive to low concentrations of S.marcescens at early time points. Since both Factor B and MASPact upstream of C3 cleavage in vertebrates, it is possible thatby 48 h post-challenge, events downstream of C3 cleavage areoccurring which may include activation of other innate immunepathways. The similarities in the trends observed for Ap_Bf-1and Ap_MASP suggest that these proteins are functioningtogether. In mice, MASP-1 was shown to cleave Factor D and wastherefore essential for alternative pathway activation (Takahashiet al., 2010). Therefore, although no Factor D homologs havebeen characterized in cnidarians or other invertebrates, atestable hypothesis is that Ap_MASP contributes to activation ofAp_Bf-1, perhaps by direct cleavage or indirectly by activation ofanother serine protease.
In contrast to Ap_Bf-1 and Ap_MASP, Ap_Bf-2b isdownregulated in response to the low concentration treatmentat 24 h post-challenge in symbiotic animals, but returnsto control levels by 48 h post-challenge (Figure 9D). Foraposymbiotic animals there are no significant differencesbetween the control and low concentration treatment. Theseresults indicate that Ap_Bf-2b is not involved in the responseagainst low concentrations of S. marcescens and expression isinstead repressed. The opposing expression patterns observedfor Ap_Bf-1 and Ap_Bf-2b for the low concentration treatmentsuggests functional divergence for these two proteins. Thisoverall trend of upregulation of Ap_Bf-1 and downregulation ofAp_Bf-2b observed in the S. marcescens challenge is also similarto the trend obtained for the recolonization experiment at theonset of symbiosis. Together these data provide further evidencefor functional diversification in A. pallida Factor B genes andthat Ap_Bf-1 and Ap_MASP, but not Ap_Bf-2b is involved inresponse to either harmful or beneficial microbes.
Challenge with a High Concentration ofS. marcescens Induces Less DramaticChanges in Gene Expression for Ap_Bf-1and Ap_MASP than the Low ConcentrationTreatmentAn unexpected result was that for Ap_Bf-1 in aposymbioticanimals and Ap_MASP in both symbiotic and aposymbioticanemones, there were fewer significant differences in expressioninitiated by the high compared to the low concentrationtreatments. This indicates that these genes are less responsive tohigh concentrations of S. marcescens at the time points examinedin this study (Figure 9). It may be that the high concentrationresulted in a peak in expression of Ap_Bf-1 and Ap_MASP inearlier time points that were not measured in this study.
In contrast, Ap_Bf-2b levels showed a more complex trendin expression for the high concentration treatment and alsoshowed differences between symbiotic state (Figures 9C,D). Forsymbiotic anemones, Ap_Bf-2b expression at 24 h post-challengewas not significantly different from the control, but at 48 hpost-challenge was significantly higher than the control. Foraposymbiotic organisms, Ap_Bf-2b was significantly lower thanthe control at 24 h post-challenge, but significantly higher by48 h post-challenge. Therefore, these data suggest that Ap_Bf-2bexpression is not activated until 48 h post-challenge, and is evenrepressed at early time points in aposymbiotic animals. Togetherthe results provide further evidence for functional divergencebetween the twoA. pallida Factor B genes and that Ap_Bf-2bmaybe important in later stages of defense against pathogens.
Differences in Complement GeneExpression between Symbiotic andAposymbiotic Anemones Suggests thatSymbionts Modulate the Host ImmuneResponseAlthough symbiotic and aposymbiotic animals showed manysimilarities in their response to S. marcescens challenge, therewere also marked differences. First, at time zero, Ap_Bf-1 expression was significantly higher in symbiotic thanaposymbiotic animals, but for Ap_Bf-2b and Ap_MASP thepattern was the reverse (Figure S1). These data match the trendsobtained from the symbiotic state comparison (Figure 5). Duringthe duration of the experiment, Ap_Bf-1 showed a significantincrease in expression at 24 h post-challenge for both the lowand high concentrations of S. marcescens, while for aposymbioticanimals there were no significant changes for the high bacterialconcentration. Similarly, for Ap_MASP, the symbiotic animalshad increased expression for the low bacterial concentration at24 h post-challenge, but for aposymbiotic organisms there wasno significant change for either concentration. Together, thesedata suggest for certain treatments, Ap_Bf-1 and Ap_MASPexpression is less responsive, or in some cases not responsive atall in aposymbiotic anemones during immune challenge. Thisis in contrast to other innate immunity studies in A. pallidathat indicate the immune response of symbiotic organisms isrepressed (Detournay et al., 2012). A testable hypothesis that
Frontiers in Microbiology | www.frontiersin.org 14 April 2016 | Volume 7 | Article 519

Poole et al. Role of Complement in Aiptasia pallida
would explain the results observed in this study is that thecomplement response for symbiotic organisms is influenced bythe presence of both pathogenic bacteria and the interactionbetween S. minutum and S. marcescens. Recent histological workrevealed that S. marcescens leads to loss of symbionts inA. pallida(Krediet et al., 2014), so although the symbiotic animals in thisexperiment showed no visible signs of bleaching, this processmay have begun at the cellular level. Future work that examinesthe influence of bleaching on complement gene expression andthe interaction between Symbiodinium and S. marcescens couldprovide further information about the results presented in thisstudy for symbiotic organisms.
Another testable hypothesis is that the presence of symbiontsalters the microbiome associated with A. pallida and thereforeinfluences the infection dynamics of S. marcescens. S. marcescensis traditionally considered a human pathogen, which enters themarine environment through sewage waste (Sutherland et al.,2010), and in Acropora palmata colonization and utilization ofthe coral mucus is an essential step of the infection process(Krediet et al., 2013). Specifically, some commensal bacteriaof A. palmata have been shown to inhibit the production ofenzymes involved in breakdown of the coral mucus and biofilmformation by S. marcescens, thereby inhibiting its growth (Alagelyet al., 2011; Krediet et al., 2012). Therefore, the presence ofdinoflagellates may influence the bacterial community associatedwithA. pallida, which in turnmodulates interactions between thenatural microbiota and S. marcescens.
Overall ConclusionsThe results from this study give a holistic view of the roleof the complement system in cnidarian-dinoflagellate symbiosisand immune challenge in the anemone A. pallida. The resultsfrom both the recolonization experiment and challenge withS. marcescens reveal that Ap_Bf-1 and Ap_MASP are upregulatedin response to inoculation with either harmful or beneficialmicrobes, suggesting that they play a role in both onset ofsymbiosis and the immune response. However, this upregulationwas only seen in the light for the recolonization experimentand was a more dramatic response in symbiotic animals witha low concentration of bacteria for the S. marcescens challenge.Together these results suggest that a variety of factors includinglight, concentration of microbe, and symbiotic state influencecomplement gene expression.
Ap_Bf-2b in contrast to Ap_Bf-1 and Ap_MASP shows amore complex expression profile to different types of microbes.In the recolonization experiment, Ap_Bf-2b expression wasdownregulated in the SL treatment compared to the NSLtreatment at 48 h post-inoculation, but returned to levels notsignificantly different from the control by the end of theexperiment. In response to the S. marcescens challenge, Ap_Bf-2b showed the opposite expression profile to that of Ap_Bf-1 andAp_MASP. The low concentration resulted in either significantdownregulation or no change in expression at 24 h post-challengeand the high concentration resulted in upregulation at 48 hpost-inoculation. These opposing expression profiles suggestfunctional divergence between Ap_Bf-1 and Ap_Bf-2b. Theymaybe the result of an ancient duplication and have since evolveddistinct functions in the regulation of the A. pallida microbial
community. The downregulation of Ap_Bf-2b observed inthese experiments and the downregulation in symbiotic animalscompared to aposymbiotic animals overall suggests that thepresence of beneficial or harmful microbes suppresses Ap_Bf-2b expression. Therefore the role that Ap_Bf-2b plays in the A.pallida immune response remains unclear.
Results from the sequence searches and phylogenetic analysisdemonstrated that there were often differences betweenmembersof the same phylum in complement gene content, suggestingthat these genes have been gained or lost many times during thecourse of evolution. Specifically, the pattern of Factor B evolutionin cnidarians revealed interesting trends that indicate potentialdifferences between corals and anemones, which warrants furtherinvestigation. The results from the phylogenetic analysis alsoalign with the expression profiles obtained in this study forAp_Bf-1 and Ap_Bf-2b. Ap_Bf-1 groups with other invertebratesequences and appears to play a conserved role in responseto microbes, whereas Ap_Bf-2b is within a cnidarian specificgroup and is downregulated in the presence of microbes.Future work that investigates functional divergence of cnidarianFactor B proteins may offer insight into their evolutionarypatterns.
AUTHOR CONTRIBUTIONS
AP, SK and VW conceived the experiments presented in thismanuscript. AP and SK developed the qPCR analysis pipeline andperformed the qPCR experiments for symbiotic state comparisonand recolonization experiment. Analysis of complement geneexpression data for these experiments was performed by AP. SKperformed qPCR experiments for the symbiont quantificationfor the recolonization experiment and performed data analysis.AP performed the S. marcescens challenge and associated dataanalysis. AP completed all sequence searches and phylogeneticanalysis for complement sequences in invertebrates. AP and SKmade significant contributions to the manuscript. All authorsapproved the final manuscript.
FUNDING
Funding for this work was provided by NSF grant numberIOS091973 and by the Oregon State University Department ofIntegrative Biology.
ACKNOWLEDGMENTS
A special thanks to Kim Ritchie for providing the S. marcescensculture. We also thank Eli Meyer for the reassembly of theA. pallida transcriptome and the Matz lab for providingthe A. millepora transcriptome with reduced redundancy andupdated annotations (http://www.bio.utexas.edu/research/matz_lab/matzlab/Data.html).
SUPPLEMENTARY MATERIAL
The Supplementary Material for this article can be foundonline at: http://journal.frontiersin.org/article/10.3389/fmicb.2016.00519
Frontiers in Microbiology | www.frontiersin.org 15 April 2016 | Volume 7 | Article 519

Poole et al. Role of Complement in Aiptasia pallida
REFERENCES
Abascal, F., Zardoya, R., and Posada, D. (2005). ProtTest: selection of
best-fit models of protein evolution. Bioinformatics 21, 2104–2105. doi:
10.1093/bioinformatics/bti263
Adams, M. D., Celniker, S. E., Holt, R. A., Evans, C. A., Gocayne, J. D., Amanatides,
P. G., et al. (2000). The genome sequence of Drosophila melanogaster. Science
287, 2185–2195. doi: 10.1126/science.287.5461.2185
Akira, S., Uematsu, S., and Takeuchi, O. (2006). Pathogen recognition
and innate immunity. Cell 124, 783–801. doi: 10.1016/j.cell.2006.
02.015
Alagely, A., Krediet, C. J., Ritchie, K. B., and Teplitski, M. (2011). Signaling-
mediated cross-talk modulates swarming and biofilm formation in a coral
pathogen Serratia marcescens. ISME J. 5, 1609–1620. doi: 10.1038/ismej.2011.45
Andersen, C. L., Jensen, J. L., and Ørntoft, T. F. (2004). Normalization of real-
time quantitative reverse transcription-PCR data: a model-based variance
estimation approach to identify genes suited for normalization, applied
to bladder and colon cancer data sets. Cancer Res. 64, 5245–5250. doi:
10.1158/0008-5472.CAN-04-0496
Arif, C., Daniels, C., Bayer, T., Banguera-Hinestroza, E., Barbrook, A., Howe, C. J.,
et al. (2014). Assessing Symbiodinium diversity in scleractinian corals via next-
generation sequencing-based genotyping of the ITS2 rDNA region. Mol. Ecol.
23, 4418–4433. doi: 10.1111/mec.12869
Baumgarten, S., Simakov, O., Esherick, L. Y., Liew, Y. J., Lehnert, E. M.,
Michell, C. T., et al. (2015). The genome of Aiptasia, a sea anemone model
for coral symbiosis. Proc. Natl. Acad. Sci. U.S.A. 112, 11893–11898. doi:
10.1073/pnas.1513318112
Ben-Haim, Y., Zicherman-Keren, M., and Rosenberg, E. (2003). Temperature-
regulated bleaching and lysis of the coral Pocillopora damicornis by the novel
pathogen Vibrio coralliilyticus. Appl. Environ. Microb. 69, 4236–4242. doi:
10.1128/AEM.69.7.4236-4242.2003
Berner, T., Baghdasarian, G., and Muscatine, L. (1993). Repopulation of a sea
anemone with symbiotic dinoflagellates: analysis by in vivo fluorescence.
J. Exp. Mar. Biol. Ecol. 170, 145–158. doi: 10.1016/0022-0981(93)
90149-I
Brown, T., Bourne, D., and Rodriguez-Lanetty, M. (2013). Transcriptional
activation of c3 and hsp70 as part of the immune response of
Acropora millepora to Bacterial Challenges. PLoS ONE 8:e67246. doi:
10.1371/journal.pone.0067246
Bruno, J. F., Petes, L. E., Drew Harvell, C., and Hettinger, A. (2003). Nutrient
enrichment can increase the severity of coral diseases. Ecol. Lett. 6, 1056–1061.
doi: 10.1046/j.1461-0248.2003.00544.x
Castillo, M. G., Goodson, M. S., and McFall-Ngai, M. (2009). Identification
and molecular characterization of a complement C3 molecule in a
lophotrochozoan, the Hawaiian bobtail squid Euprymna scolopes. Dev. Comp.
Immunol. 33, 69–76. doi: 10.1016/j.dci.2008.07.013
Cerenius, L., Kawabata, S., Lee, B. L., Nonaka, M., and Söderhäll, K. (2010).
Proteolytic cascades and their involvement in invertebrate immunity. Trends
Biochem. Sci. 35, 575–583. doi: 10.1016/j.tibs.2010.04.006
Cervino, J. M., Hayes, R., Goreau, T. J., and Smith, G. W. (2004). Zooxanthellae
regulation in yellow blotch/band and other coral diseases contrasted with
temperature related bleaching: in situ destruction vs expulsion. Symbios.
Rehovot. 37, 63–86.
Clow, L. A., Raftos, D. A., Gross, P. S., and Smith, L. C. (2004). The sea urchin
complement homologue, SpC3, functions as an opsonin. J. Exp. Biol. 207,
2147–2155. doi: 10.1242/jeb.01001
Coffroth, M. A., Lasker, H. R., Diamond, M. E., Bruenn, J. A., and Bermingham,
E. (1992). DNA fingerprints of a gorgonian coral: a method for detecting
clonal structure in a vegetative species. Marine Biol. 114, 317–325. doi:
10.1007/BF00349534
Collins, A. J., Schleicher, T. R., Rader, B. A., and Nyholm, S. V. (2012).
Understanding the role of host hemocytes in a squid/vibrio symbiosis
using transcriptomics and proteomics. Front Immunol 3:91. doi:
10.3389/fimmu.2012.00091
Correa, A. M., McDonald, M. D., and Baker, A. C. (2009). Development of
clade-specific Symbiodinium primers for quantitative PCR (qPCR) and their
application to detecting clade D symbionts in Caribbean corals.Mar. Biol. 156,
2403–2411. doi: 10.1007/s00227-009-1263-5
Davy, S. K., Allemand, D., and Weis, V. M. (2012). Cell biology of
cnidarian-dinoflagellate symbiosis. Microbiol. Mol. Biol. R 76, 229–261. doi:
10.1128/MMBR.05014-11
Detournay, O., Schnitzler, C. E., Poole, A., and Weis, V. M. (2012). Regulation of
cnidarian–dinoflagellate mutualisms: evidence that activation of a host TGFβ
innate immune pathway promotes tolerance of the symbiont. Dev. Comp.
Immunol. 38, 525–537. doi: 10.1016/j.dci.2012.08.008
Dishaw, L. J., Smith, S. L., and Bigger, C. H. (2005). Characterization of a C3-like
cDNA in a coral: phylogenetic implications. Immunogenetics 57, 535–548. doi:
10.1007/s00251-005-0005-1
Drummond, A., Ashton, B., Buxton, S., Cheung, M., Cooper, A., Duran, C., et al.
(2011). “Geneious v5. 4”. Available online at: http://www.geneious.com
Eberl, G. (2010). A new vision of immunity: homeostasis of the superorganism.
Mucosal Immunol. 3, 450–460. doi: 10.1038/mi.2010.20
Ehlenberger, A. G., and Nussenzweig, V. (1977). The role of membrane
receptors for C3b and C3d in phagocytosis. J. Exp. Med. 145, 357–371. doi:
10.1084/jem.145.2.357
Endo, Y., Nonaka, M., Saiga, H., Kakinuma, Y., Matsushita, A., Takahashi, M.,
et al. (2003). Origin of mannose-binding lectin-associated serine protease
MASP-1 and MASP-3 involved in the lectin complement pathway traced
back to the invertebrate, amphioxus. J. Immunol. 170, 4701–4707. doi:
10.4049/jimmunol.170.9.4701
Fujita, T. (2002). Evolution of the lectin-complement pathway and its
role in innate immunity. Nat. Rev. Immunol. 2, 346–353. doi: 10.1038/
nri800
Fujito, N. T., Sugimoto, S., and Nonaka, M. (2010). Evolution of thioester-
containing proteins revealed by cloning and characterization of their genes
from a cnidarian sea anemone, Haliplanella lineate. Dev. Comp. Immunol. 34,
775–784. doi: 10.1016/j.dci.2010.02.011
Ganot, P., Moya, A., Magnone, V., Allemand, D., Furla, P., and Sabourault, C.
(2011). Adaptations to endosymbiosis in a cnidarian-dinoflagellate association:
differential gene expression and specific gene duplications. PLoS Genet.
7:e1002187. doi: 10.1371/journal.pgen.1002187
Grabherr, M. G., Haas, B. J., Yassour, M., Levin, J. Z., Thompson, D. A., Amit, I.,
et al. (2011). Full-length transcriptome assembly from RNA-Seq data without a
reference genome. Nat. Biotechnol. 29, 644–652. doi: 10.1038/nbt.1883
Grajales, A., and Rodriguez, E. (2014). Morphological revision of the genus
Aiptasia and the family Aiptasiidae (Cnidaria, Actiniaria, Metridioidea).
Zootaxa 3826, 55–100. doi: 10.11646/zootaxa.3826.1.2
Gros, P., Milder, F. J., and Janssen, B. J. C. (2008). Complement driven by
conformational changes. Nat. Rev. Immunol. 8, 48–58. doi: 10.1038/nri2231
Guindon, S., and Gascuel, O. (2003). A simple, fast, and accurate algorithm to
estimate large phylogenies by maximum likelihood. Syst. Biol. 52, 696–704. doi:
10.1080/10635150390235520
Hambleton, E. A. (2013). Symbiosis Specificity and Innate Immunity in Aiptasia, a
Model System for Cnidarian-Dinoflagellate Symbiosis. PhD, StanfordUniversity.
Harii, S., Yasuda, N., Rodriguez-Lanetty, M., Irie, T., and Hidaka, M. (2009). Onset
of symbiosis and distribution patterns of symbiotic dinoflagellates in the larvae
of scleractinian corals. Mar. Biol. 156, 1203–1212. doi: 10.1007/s00227-009-
1162-9
Harvell, C. D., Mitchell, C. E., Ward, J. R., Altizer, S., Dobson, A. P., Ostfeld, R. S.,
et al. (2002). Climate warming and disease risks for terrestrial andmarine biota.
Science 296, 2158–2162. doi: 10.1126/science.1063699
Hemmrich, G., Khalturin, K., Boehm, A.-M., Puchert, M., Anton-Erxleben, F.,
Wittlieb, J., et al. (2012). Molecular signatures of the three stem cell lineages
inHydra and the emergence of stem cell function at the base of multicellularity.
Mol. Biol. Evol. 29, 3267–3280. doi: 10.1093/molbev/mss134
Hentschel, U., Steinert, M., and Hacker, J. (2000). Common molecular
mechanisms of symbiosis and pathogenesis. Trends Microbiol. 8, 226–231. doi:
10.1016/S0966-842X(00)01758-3
Hughes, T. P., Baird, A. H., Bellwood, D. R., Card, M., Connolly, S. R., Folke, C.,
et al. (2003). Climate change, human impacts, and the resilience of coral reefs.
Science 301, 929–933. doi: 10.1126/science.1085046
Iwasaki, A., and Medzhitov, R. (2010). Regulation of adaptive immunity by
the innate immune system. Science 327, 291–295. doi: 10.1126/science.
1183021
Janeway, C. A. Jr., and Medzhitov, R. (2002). Innate immune recognition. Annu.
Rev. Immunol. 20, 197–216. doi: 10.1146/annurev.immunol.20.083001.084359
Frontiers in Microbiology | www.frontiersin.org 16 April 2016 | Volume 7 | Article 519

Poole et al. Role of Complement in Aiptasia pallida
Katoh, K., Misawa, K., Kuma, K. I., andMiyata, T. (2002). MAFFT: a novel method
for rapid multiple sequence alignment based on fast Fourier transform. Nucleic
Acids Res. 30, 3059–3066. doi: 10.1093/nar/gkf436
Kimura, A., Sakaguchi, E., and Nonaka, M. (2009). Multi-component complement
system of Cnidaria: C3, Bf, and MASP genes expressed in the endodermal
tissues of a sea anemone, Nematostella vectensis. Immunobiology 214, 165–178.
doi: 10.1016/j.imbio.2009.01.003
Koressaar, T., and Remm, M. (2007). Enhancements and modifications
of primer design program Primer3. Bioinformatics 23, 1289–1291. doi:
10.1093/bioinformatics/btm091
Krediet, C. J., Carpinone, E. M., Ritchie, K. B., and Teplitski, M. (2013).
Characterization of the gacA-dependent surface and coral mucus colonization
by an opportunistic coral pathogen Serratia marcescens PDL100. FEMS
Microbio Ecol. 84, 290–301. doi: 10.1111/1574-6941.12064
Krediet, C. J., Meyer, J. L., Gimbrone, N., Yanong, R., Berzins, I., Alagely, A., et al.
(2014). Interactions between the tropical sea anemone Aiptasia pallida and
Serratia marcescens, an opportunistic pathogen of corals. Environ. Microbiol.
Rep. 6, 287–292. doi: 10.1111/1758-2229.12151
Krediet, C. J., Ritchie, K. B., Alagely, A., and Teplitski, M. (2012). Members
of native coral microbiota inhibit glycosidases and thwart colonization
of coral mucus by an opportunistic pathogen. ISME J. 7, 980–990. doi:
10.1038/ismej.2012.164
Kubinak, J. L., and Round, J. L. (2012). Toll-like receptors promote mutually
beneficial commensal-host interactions. PLoS Pathog 8:e1002785. doi:
10.1371/journal.ppat.1002785
Kvennefors, E. C. E., Leggat, W., Kerr, C. C., Ainsworth, T. D., Hoegh-Guldberg,
O., and Barnes, A. C. (2010). Analysis of evolutionarily conserved innate
immune components in coral links immunity and symbiosis. Dev. Comp.
Immunol. 34, 1219–1229. doi: 10.1016/j.dci.2010.06.016
Lehnert, E. M., Burriesci, M. S., and Pringle, J. R. (2012). Developing the
anemone Aiptasia as a tractable model for cnidarian-dinoflagellate symbiosis:
the transcriptome of aposymbiotic A. pallida. BMC Genomics 13:271. doi:
10.1186/1471-2164-13-271
Livak, K. J., and Schmittgen, T. D. (2001). Analysis of relative gene expression
data using real-time quantitative PCR and the 2−11CT method.Methods 25,
402–408. doi: 10.1006/meth.2001.1262
Matsushita, M., Thiel, S., Jensenius, J. C., Terai, I., and Fujita, T. (2000). Proteolytic
activities of two types of mannose-binding lectin-associated serine protease. J.
Immunol. 165, 2637–2642. doi: 10.4049/jimmunol.165.5.2637
Matthews, J. L., Sproles, A. E., Oakley, C. A., Grossman, A. R., Weis, V. M.,
and Davy, S. K. (2015). Menthol-induced bleaching rapidly and effectively
provides experimental aposymbiotic sea anemones (Aiptasia sp.) for symbiosis
investigations. J. Exp. Biol. 219, 306–310. doi: 10.1242/jeb.128934
Mayilyan, K. R., Kang, Y. H., Dodds, A. W., and Sim, R. B. (2008). "The
complement system in innate immunity,” in Innate Immunity of Plants,
Animals, and Humans, ed H. Heine (Heidelberg: Springer), 219–236.
McFall-Ngai, M. (2007). Adaptive immunity: care for the community. Nature 445,
153–153. doi: 10.1038/445153a
Medzhitov, R., and Janeway, C. A. (1997). Innate immunity: the virtues of
a nonclonal system of recognition. Cell 91, 295–298. doi: 10.1016/S0092-
8674(00)80412-2
Muscatine, L., Grossman, D., and Doino, J. (1991). Release of symbiotic algae by
tropical sea anemones and corals after cold shock. Mar. Ecol. Prog. Ser. 77,
233–243. doi: 10.3354/meps077233
Ocampo, I. D., Zárate-Potes, A., Pizarro, V., Rojas, C. A., Vera, N. E., and Cadavid,
L. F. (2015). The immunotranscriptome of the Caribbean reef-building coral
Pseudodiploria strigosa. Immunogenetics 67, 515–530. doi: 10.1007/s00251-015-
0854-1
Pangburn, M., and Rawal, N. (2002). Structure and function of complement C5
convertase enzymes. Biochem. Soc. T 30, 1006–1010. doi: 10.1042/bst0301006
Pfaffl, M. W., Tichopad, A., Prgomet, C., and Neuvians, T. P. (2004).
Determination of stable housekeeping genes, differentially regulated
target genes and sample integrity: BestKeeper–Excel-based tool
using pair-wise correlations. Biotechnol. Lett. 26, 509–515. doi:
10.1023/B:BILE.0000019559.84305.47
Prado-Alvarez, M., Rotllant, J., Gestal, C., Novoa, B., and Figueras, A. (2009).
Characterization of a C3 and a factor B-like in the carpet-shell clam, Ruditapes
decussatus. Fish Shellfish Immun. 26, 305–315. doi: 10.1016/j.fsi.2008.11.015
Punta, M., Coggill, P. C., Eberhardt, R. Y., Mistry, J., Tate, J., Boursnell, C., et al.
(2012). The Pfam protein families database. Nucleic Acids Res. 40, D290–D301.
doi: 10.1093/nar/gkr1065
RCoreTeam (2015). R: A Language and Environment for Statistical Computing
[Online]. Vienna: R Foundation for Statistical Computing.
Ren, J., Wen, L., Gao, X., Jin, C., Xue, Y., and Yao, X. (2009). DOG 1.0:
illustrator of protein domain structures. Cell Res 19, 271–273. doi: 10.1038/cr.
2009.6
Riesgo, A., Farrar, N.,Windsor, P. J., Giribet, G., and Leys, S. P. (2014). The analysis
of eight transcriptomes from all poriferan classes reveals surprising genetic
complexity in sponges. Mol. Biol. Evol. 31, 1102–1120. doi: 10.1093/molbev/
msu057
Schwarz, J. A. (2002). Cellular and Molecular Aspects of Cnidarian-Algal
Associations. PhD. Oregon State University.
Schwarz, J. A., Krupp, D. A., and Weis, V. M. (1999). Late larval development and
onset of symbiosis in the scleractinian coral Fungia scutaria. Biol. Bull. 196,
70–79. doi: 10.2307/1543169
Sekiguchi, R., Fujito, N. T., and Nonaka, M. (2012). Evolution of the thioester-
containing proteins (TEPs) of the arthropoda, revealed by molecular cloning of
TEP genes from a spiderHasarius adansoni.Dev. Comp. Immunol. 36, 483–489.
doi: 10.1016/j.dci.2011.05.003
Sekiguchi, R., and Nonaka, M. (2015). Evolution of the complement system
in protostomes revealed by de novo transcriptome analysis of six species
of Arthropoda. Dev. Comp. Immunol. 50, 58–67. doi: 10.1016/j.dci.2014.
12.008
Shinzato, C., Shoguchi, E., Kawashima, T., Hamada, M., Hisata, K., Tanaka,
M., et al. (2011). Using the Acropora digitifera genome to understand
coral responses to environmental change. Nature 476, 320–323. doi:
10.1038/nature10249
Sim, R., and Tsiftsoglou, S. (2004). Proteases of the complement system. Biochem.
Soc. T 32, 21–27. doi: 10.1042/bst0320021
Skjoedt, M., Palarasah, Y., Rasmussen, K., Vitved, L., Salomonsen, J., Kliem,
A., et al. (2010). Two mannose-binding lectin homologs and a MBL-
associated serine protease are expression in the gut epithelia of the
urochordate species Ciona intestinalis. Dev. Comp. Immunol. 34, 59–68. doi:
10.1016/j.dci.2009.08.004
Sutherland, K. P., Porter, J. W., and Torres, C. (2004). Disease and immunity in
Caribbean and Indo-Pacific zooxanthellate corals. Mar. Ecol. Prog. Ser. 266,
265–272. doi: 10.3354/meps266273
Sutherland, K. P., Porter, J. W., Turner, J. W., Thomas, B. J., Looney, E. E., Luna, T.
P., et al. (2010). Human sewage identified as likely source of white pox disease of
the threatened Caribbean elkhorn coral, Acropora palmata. Environ. Microbiol.
12, 1122–1131. doi: 10.1111/j.1462-2920.2010.02152.x
Suzuki, M. M., Satoh, N., and Nonaka, M. (2002). C6-like and C3-like molecules
from the cephalochordate, amphioxus, suggest a cytolytic complement
system in invertebrates. J. Mol. Evol. 54, 671–679. doi: 10.1007/s00239-001-
0068-z
Tagawa, K., Yoshihara, T., Shibata, T., Kitazaki, K., Endo, Y., Fujita, T., et al. (2012).
Microbe-specific C3b deposition in the horseshoe crab complement system in
a C2/factor B-dependent or-independent manner. PLoS ONE 7:e36783. doi:
10.1371/journal.pone.0036783
Takahashi, M., Ishida, Y., Iwaki, D., Kanno, K., Suzuki, T., Endo, Y., et al.
(2010). Essential role of mannose-binding lectin-associated serine protease-
1 in activation of the complement factor D. J. Exp. Med. 207, 29–37. doi:
10.1084/jem.20090633
Thiel, S., Vorup-Jensen, T., Stover, C. M., Schwaeble, W., Laursen, S. B., Poulsen,
K., et al. (1997). A second serine protease associated with mannan-binding
lectin that activates complement. Immunol. Lett. 56, 18. doi: 10.1016/S0165-
2478(97)85069-9
Untergasser, A., Cutcutache, I., Koressaar, T., Ye, J., Faircloth, B. C., Remm, M.,
et al. (2012). Primer3—new capabilities and interfaces. Nucleic Acids Res. 40,
e115. doi: 10.1093/nar/gks596
Vandesompele, J., De Preter, K., Pattyn, F., Poppe, B., Van Roy, N., De Paepe,
A., et al. (2002). Accurate normalization of real-time quantitative RT-PCR
data by geometric averaging of multiple internal control genes. Genome Biol.
3:research0034. doi: 10.1186/gb-2002-3-7-research0034
Weis, V. M., and Allemand, D. (2009). What determines coral health? Science 324,
1153–1155. doi: 10.1126/science.1172540
Frontiers in Microbiology | www.frontiersin.org 17 April 2016 | Volume 7 | Article 519

Poole et al. Role of Complement in Aiptasia pallida
Weis, V. M., Davy, S. K., Hoegh-Guldberg, O., Rodriguez-Lanetty, M., and Pringle,
J. R. (2008). Cell biology in model systems as the key to understanding corals.
Trends Ecol. Evol. 23, 369–376. doi: 10.1016/j.tree.2008.03.004
Weis, V. M., Verde, E. A., Pribyl, A., and Schwarz, J. A. (2002). Aspects of the
larval biology of the sea anemones Anthopleura elegantissima and A. artemisia.
Invertebrate Biol. 121, 190–201. doi: 10.1111/j.1744-7410.2002.tb00059.x
Yoshizaki, F. Y., Ikawa, S., Satake, M., Satoh, N., and Nonaka, M. (2005). Structure
and the evolutionary implication of the triplicated complement factor B genes
of a urochordate ascidian, Ciona intestinalis. Immunogenetics 56, 930–942. doi:
10.1007/s00251-004-0752-4
Zhong, L., Zhang, F., and Chang, Y. (2012). Gene cloning and function analysis
of complement B factor-2 of Apostichopus japonicus. Fish Shellfish Immun. 33,
504–513. doi: 10.1016/j.fsi.2012.06.001
Zhu, Y., Thangamani, S., Ho, B., and Ding, J. L. (2005). The ancient origin of the
complement system. Embo J. 24, 382–394. doi: 10.1038/sj.emboj.7600533
Conflict of Interest Statement: The authors declare that the research was
conducted in the absence of any commercial or financial relationships that could
be construed as a potential conflict of interest.
Copyright © 2016 Poole, Kitchen andWeis. This is an open-access article distributed
under the terms of the Creative Commons Attribution License (CC BY). The use,
distribution or reproduction in other forums is permitted, provided the original
author(s) or licensor are credited and that the original publication in this journal
is cited, in accordance with accepted academic practice. No use, distribution or
reproduction is permitted which does not comply with these terms.
Frontiers in Microbiology | www.frontiersin.org 18 April 2016 | Volume 7 | Article 519