the role of co-working spaces in local economic development
TRANSCRIPT

Beyond the Core:
The Role of Co-working Spaces in Local
Economic Development
Veronica Chuah
Submitted in partial fulfillment for the degree of
Master of Science in Urban Planning
Graduate School of Architecture, Planning and Preservation
May 2016
2
Abstract
By 2020, the number of independent workers and freelancers are expected to comprise
40% of the working population. This subset of the economy requires different work configurations,
and as a result, co-working spaces have emerged as a new office typology. While research has
been conducted on the internal dynamics and impact on the worker in the new space, there has
been little study into the impact of co-working spaces on the immediate community. Reports
released by municipalities recognize the potential impact that co-working spaces have on
economic development - however they are policy recommendations. The purpose of this paper is
to expand on the relationship between co-working spaces and its surrounding community's
economic development by collecting and analyzing both qualitative and quantitative data. Co-
working space users will be surveyed on their perception of the surrounding neighborhood
and gauge their participation in the community events while various community members and
stakeholders will be interviewed about their opinions of the co-working space and any perceived
changes associated with the new neighborhood fixture. Supplementing this qualitative data,
demographic data and building/construction statistics will be analyzed pre and post opening of the
co-working space. As co-working spaces evolve from being an office alternative outlier to viable
office option, developing an understanding of co-working spaces’ impact on the surrounding
community is essential – integrating co-working spaces into the urban fabric. Co-working space
have the potential to play a significant role in local economic development but there must also be
community and local government communication and commitment to provide neighborhood
services and amenities in order to tap into the potential of co-working spaces.

3
Table of Contents
Introduction 4
Background 7
Literature Review 12
Research Methodology 19
Results 31
Survey 31
Observations & Conversations 43
Secondary Data 52
Discussion 62
Conclusion 64
Bibliography 68
Appendix 73
Survey 74
4
Introduction
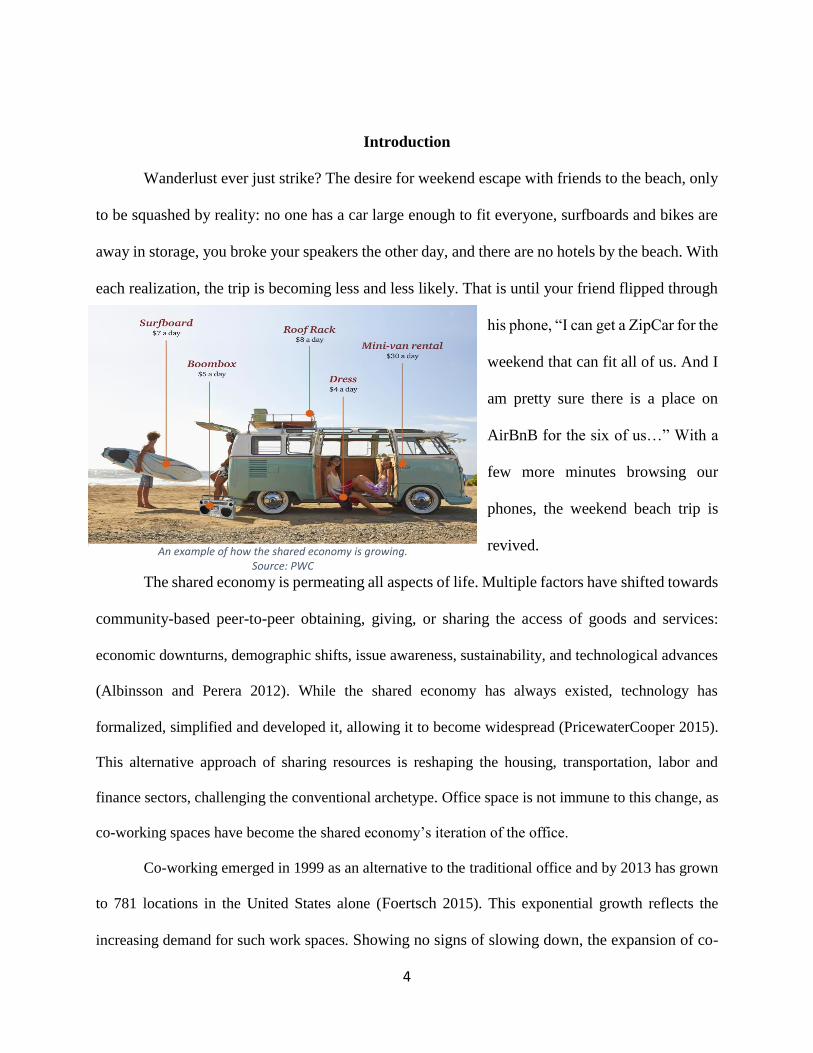
Wanderlust ever just strike? The desire for weekend escape with friends to the beach, only
to be squashed by reality: no one has a car large enough to fit everyone, surfboards and bikes are
away in storage, you broke your speakers the other day, and there are no hotels by the beach. With
each realization, the trip is becoming less and less likely. That is until your friend flipped through
his phone, “I can get a ZipCar for the
weekend that can fit all of us. And I
am pretty sure there is a place on
AirBnB for the six of us…” With a
few more minutes browsing our
phones, the weekend beach trip is
revived.
The shared economy is permeating all aspects of life. Multiple factors have shifted towards
community-based peer-to-peer obtaining, giving, or sharing the access of goods and services:
economic downturns, demographic shifts, issue awareness, sustainability, and technological advances
(Albinsson and Perera 2012). While the shared economy has always existed, technology has
formalized, simplified and developed it, allowing it to become widespread (PricewaterCooper 2015).
This alternative approach of sharing resources is reshaping the housing, transportation, labor and
finance sectors, challenging the conventional archetype. Office space is not immune to this change, as
co-working spaces have become the shared economy’s iteration of the office.
Co-working emerged in 1999 as an alternative to the traditional office and by 2013 has grown
to 781 locations in the United States alone (Foertsch 2015). This exponential growth reflects the
increasing demand for such work spaces. Showing no signs of slowing down, the expansion of co-
An example of how the shared economy is growing. Source: PWC

5
working spaces indicate that this office typology is no longer a stand-alone alternative, but a viable
competitive option as an office space. Co-working spaces are generally viewed favorably as many
studies have found that users of co-working spaces find the internal environment supportive – enabling
them to be more productive, find greater job satisfaction, and foster meaningful professional and
personal relationships (Spreitzer, Bacevice & Garrett 2015). Despite co-working rising in
popularity, the research has been primarily focused on the internal co-working ecosystem.
However co-working does not exist within a bubble, these changes in physical space and
demographics could have positive or negative effects on the surrounding neighborhood. The
overwhelming majority of current literature hails co-working for increasing density, attracting the
creative class and re-purposing buildings (Gandini, 2015). This being said, research in this co-
working facet is minimal and needs to be expanded upon. By understanding the co-working model
holistically, within the space itself and its impact beyond the physical building, cities and
municipalities will be better informed in how to hone the externalities of co-working spaces to
support economic development and stability within local communities.
In order to understand co-working spaces and its impact, I will first discuss the factors that
have prompted the rise of this office typology. With a background in the changing nature and
perceptions of work and the workplace landscape, the current research on co-working will be
presented and contextualized. With many variables in the co-working paradigm, co-working takes
many forms and is constantly evolving therefore making it difficult for academic research to keep
pace. Much of the existing research is focused on the internal dynamics and benefits of the co-
working. While cities and municipalities support the expansion of co-working spaces,
acknowledging the existing relationship between economic development and co-working spaces –
there is little analytical research that verifies this correlation or the causation, (Vaccaro 2014;
Arlington Future Office Market Task Force 2015; Sonoma County Economic Development Board

6
and Coworking Alliance of Sonoma County 2015). With many co-working spaces expanding
beyond CBDs and into neighborhoods that are in transition or on the cusp, this research will focus
on how co-working spaces can contribute to local economic development.
Accompanying a review of the existing literature, this research will include qualitative and
quantitative data collection at various co-working sites around the metropolitan New York City
area. First, the qualitative data will comprise of conversations and interviews with co-workers and
space managers about their experience and interaction in the community. There will also be
conversations with local community board members and local business owners about their opinion
of the new neighborhood fixture and any perceived impact. Secondly, the quantitative data portion
will consist of surveys about co-workers’ perceptions of their work neighborhood. This will be
accompanied by an analysis of building/construction developments pre and post the opening of
the co-working space. Lastly, I will suggest best practice recommendations for the integration of
co-working spaces to spur local economic and community development which will foster
successful live-work-play neighborhoods.

7
Background
The workplace is changing. It has evolved, adapting to changing times and norms (Brown
2009). Demographic shifts, technological innovations, and a growing emphasis on human
psychology has forced employers and employees to re-evaluate how work is perceived and its
value.
The changing nature of who is an employee is a driving force in the transformation of the
workplace. The workforce is primarily dominated by millennials who place a greater emphasis on
work-life balance (Deal, Altman & Rodelberg 2010). Older generations viewed work as a central
defining factor of their identity, whereas work is only a factor in millennials’ self-identity, and are
therefore more likely to switch careers for greater work satisfaction (Smith 2010). Today’s
workforce is opting for careers that do not force them to choose between work and their personal
lives, but rather, complement one another (Gerson 2011).
Technology is the greatest driver of the changing workplace. Technological advances have
facilitated the transition of the American economy from manufacturing to the service industry.
Advances in computer and communication technology have revolutionized how and where work
is done (U.S. Department of Commerce 1996). The ability to telecommunicate had transformed
the workforce composition and culture – paving the way for remote working and providing
employers with greater access to larger labor pools (SHRM Foundation 2014). There is greater
fluidity in the workplace as work becomes more flexible: work is no longer confined to the
traditional work day hours nor the office; greater equality and diversity in the workforce breaks
away from the formal corporate hierarchy for a more relaxed and flattened structure that
encourages sharing of information and communication (Brown 2009; Morgan 2013). The most

8
successful companies and employees are those with the agile ability to adapt to clients’ needs and
existing infrastructures.
Today, more than 53 million Americans are earning income beyond the traditional confines
of work, beyond the 9-to-5, beyond the cubicle. That is about a third of all workers (Horowitz
2015). Younger working populations, new technology and changing employer and employee
perceptions of work are facilitating the transformation of work and the workplace. This evolution
is expected to continue with The Bureau of Labor Statistics estimating that about 65 million
Americans, 40% of the workforce, will be freelancers, temps, independent contractors and
solopreneurs by 2020 (Henderson 2012; Lopez 2013).
A workplace model has permeated the office space real estate market is co-working spaces.
Co-working spaces are defined as “workplaces diverse groups of freelancers, remote workers, and
other independent professionals work together in a shared, communal setting” (Spreitzer 2015).
The cubicles of yesteryear are disappearing as greater attention is given to individual and
collaborative work with open floor plans and varied breakout session options.
Co-working is not just about the arrangement of a space but rather a lifestyle movement.
As a new generation dominates the workforce, they bring with them new ideas and approaches to
life and work. With technology freeing people from established work locations, there is a greater
sense of individualism among today’s workforce – there is greater autonomy and ownership of
ideas and responsibilities. Yet there is also this desired sense of belonging hence the emergence of
co-working spaces, as an extension of the shared economy mentality (Spreitzer, Bacevice and
Garrett 2015). As a membership-based model, co-working spaces meet both lifestyle needs of the
emerging workforce – flexibility, individuality, community.
9
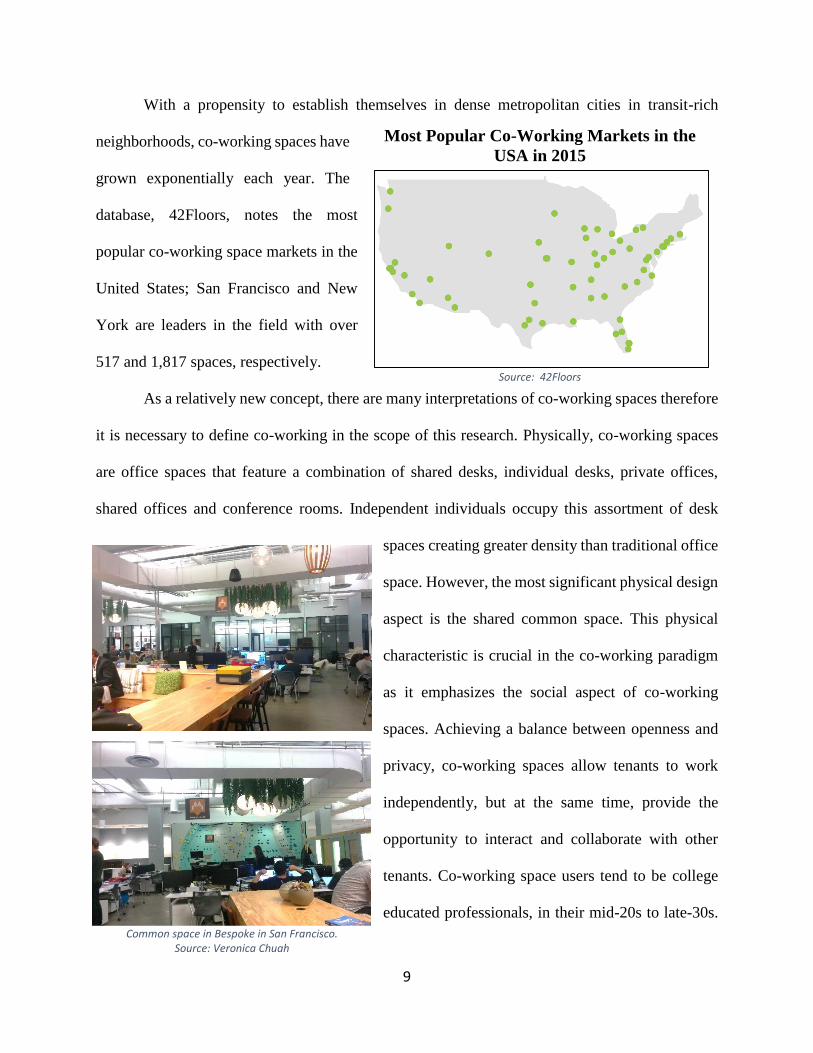
With a propensity to establish themselves in dense metropolitan cities in transit-rich
neighborhoods, co-working spaces have
grown exponentially each year. The
database, 42Floors, notes the most
popular co-working space markets in the
United States; San Francisco and New
York are leaders in the field with over
517 and 1,817 spaces, respectively.
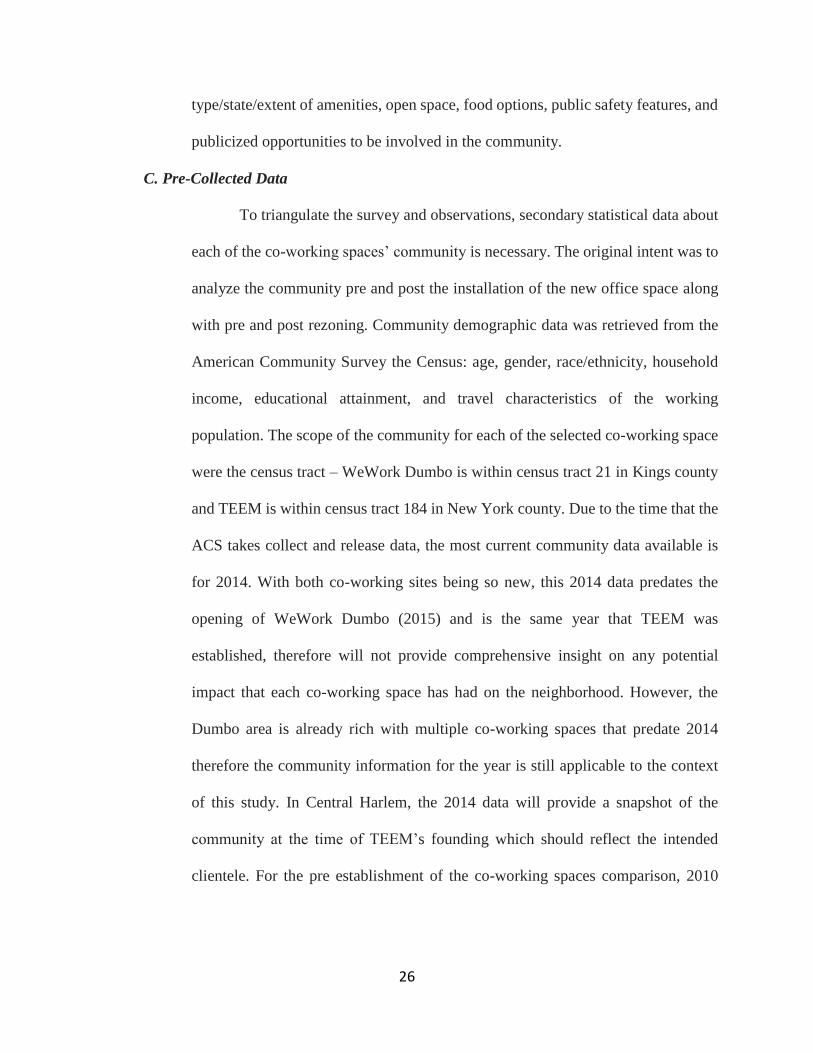
As a relatively new concept, there are many interpretations of co-working spaces therefore
it is necessary to define co-working in the scope of this research. Physically, co-working spaces
are office spaces that feature a combination of shared desks, individual desks, private offices,
shared offices and conference rooms. Independent individuals occupy this assortment of desk
spaces creating greater density than traditional office
space. However, the most significant physical design
aspect is the shared common space. This physical
characteristic is crucial in the co-working paradigm
as it emphasizes the social aspect of co-working
spaces. Achieving a balance between openness and
privacy, co-working spaces allow tenants to work
independently, but at the same time, provide the
opportunity to interact and collaborate with other
tenants. Co-working space users tend to be college
educated professionals, in their mid-20s to late-30s.
Common space in Bespoke in San Francisco. Source: Veronica Chuah
Most Popular Co-Working Markets in the
USA in 2015
Source: 42Floors

10
Co-working spaces are primarily home to creative industries such as technology and design
(Foertsch 2010). While all co-working spaces have common areas, they are all unique – differing
in interior aesthetic, reflective of the tenants, location, and degree of fostered social interactive-
ness. Some examples of commons space rooms are game rooms, nap rooms, rock climbing walls,
and dining rooms. Co-workings spaces function with a hybrid leasing model, offering
unprecedented flexibility in the office space market with daily desk rental options along with
month and year-long leases. As co-working spaces continue to grow and become a substantial part
of the office market, their impact on real estate markets, along with local economic and community
development must be understood.
New York City became a pioneering city of co-working. While there were “plug & play”
centers in the early 1990s, where people met together and shared internet connections, the first
incarnation of co-working emerged in 1999 when a software company, 42 West 24, offered flexible
office space for individuals and teams that could be cancelled on short notice (Foertsch and Cagnol,
2013). The model was ideal for the fast moving pace of the tech industry of the 1990s. However,
after the tech bubble burst in 2001, the company was still able to maintain desk occupancy by
expanding its membership beyond the technology sector. The recovery of the first co-working
space in New York City is attributed to the city’s high concentration of the creative class and the
prevailing workforce preference to work independently (Center for an Urban Future, 2015;
Greenstone Miller and Miller, 2012). In addition, about 10% of the working population in the
metropolitan New York City area are self-employed (Florida, 2013). Below is a map indicated the
percentage of workforce within each neighborhood that work from home. All of these conditions
in the aggregate indicate the market gap for office space for individuals and small teams along
with a sense of community (Salovaara, 2014). In the mid-2000s companies started to meet this

11
market demand for
shared offices spaces
with a sense of
community. But this new
office typology didn’t
become mainstream until
the economic crisis of
2008. The convergence
of the economic crisis,
countless empty office
space, workforce trends and large numbers of
freelancers/startups created the perfect setting for co-
working to flourish. By breaking up large office floor plates
to flexible desk and office space, co-working has allowed
the independent/self-employed sector to access formal
offices space. In 2005, there were only a handful of co-
working spaces. Today, there are 127 different co-working
spaces servicing different populations and sectors in the
metropolitan area, according to New Worker Magazine.
With co-working models thriving in New York City, the
city can continue to pioneer the office typology by
understanding the relationship that co-working spaces and
their users have with their immediate community.
Percentage of workers 16 and older who worked from home Source: DNAIinfo
List of co-working spaces Source: New Worker Magazine

12
Literature Review
The demand for co-working spaces is huge and growing. Today, about 30% of the working
population are independent individuals: freelancers, temps, independent contractors and
solopreneurs. This working subpopulation are the core tenants of co-working. With the heightened
desire of workers to separate work and home, this subpopulation is more likely to explore co-
working spaces (Arlington Future Office Market Task Force 2015; Horowitz 2015). This huge
portion of the working population doesn’t include another subset, employees that telecommute.
Today about 25% of the workforce telecommutes (Global Workplace Analytics 2015). This means
at least half the workforce could be considering a co-working place as either a primary or
secondary office. By 2020, this figure is expected to comprise of at least 60% of the workforce
(Global Workplace Analytics 2015; Henderson).
Co-working spaces and co-working (using said spaces) are gaining clout and garnered a
great deal of academic attention, however, much of the research is focused on the internal
dynamics of the physical co-working space and benefits of co-working for participants. Prior to
co-working, the only feasible options for independent workers and telecommuters were working
from home or working in a café/coffee shop. Both lacking a professional atmosphere, neither
option were conducive to productivity due to the noise levels and potential distraction (Spinuzzi
2012; Leforestier 2009; Ross & Ressia 2015). Co-working fills that void – defined as
“membership-based workspaces with diverse groups of freelancers, remote workers, and other
independent professionals work together in a shared, communal setting” (Speitzer, Bacevice &
Garrett 2015). Establishing themselves as an emerging anchor of a “third place” – a place outside
of work and the home – co-working spaces are more than just a physical space to do work.
Combating the isolation that often accompanies freelancing and independent work, co-working

13
spaces emphasize the importance of community, relationships and productivity (Kwiatkowski &
Buczynski; Spinuzzi 2012; Moriset 2013). The careful curation of co-working space and screening
of community members create a supportive internal environment that allows for clustering,
uncompetitive collaboration and relationship building (Moriset 2013). For example, Bespoke is a
co-working space designed specifically for retail technology based companies. The space
managers screen new applicants to avoid creating an unhealthy competitive environment.
Similarly, co-working giant WeWork’s 60+ locations are all uniquely designed, reflective of the
workers’ demographics and work needs, original building layout and desired amenities. Within
each site, managers’ performance is based on the number of relationships they foster. Some co-
working spaces recognize the importance of social interaction and collaboration, they are
expanding their services and amenities: offering tailored workshops for users, fostering mentorship
programs, hosting happy hours, holiday parties and networking mixers, and organizing a week of
adult camp – programming that happen on and offsite. Successful co-working spaces embody this
comprehensive approach in redefining the workplace to be reflective of changing work norms.
Purposefully planned co-working spaces have reaped positive feedback by users, verified by
research. As attitudes towards work are evolving to be more holistic and workers seek meaningful
work (SHRM Foundation 2014), co-working spaces are blending the personal and professional
realms as co-working space users have higher levels of self-reports professional and personal
satisfaction (Speitzer, Bacevice & Garrett 2015). Co-working spaces users enjoy the social aspect,
which was often lacking prior to their participation. While co-working space users are a self-
selecting group, they report having greater professional satisfaction due to greater autonomy and
agency in defining their work (Hamari, Sjoklint, & Ukkoen 2015). The positive externalities of
the personal benefits of co-working are evident in the professional sphere as the personal

14
relationships built in the social atmosphere evolve into professional relationships through the
collaborative nature that co-working spaces encourage – creating agglomerations of
interconnected and related business sector professionals co-working together, driving innovation
and creativity within the field, benefiting co-working space users and their businesses (Arzaghi
and Henderson 2007; Moriset 2013; International Economic Development Council; Capdevila
2015). While working alone, co-workers are still working together, harnessing their collective
social capital. The breadth of research about the design of co-working spaces and its positive
impact on the individual worker and the business sectors is extensive. Despite all the research on
the effects of co-working on the internal community, there is little exploration into the greater
impact and effect of co-working spaces beyond their physical structures and on their surrounding
neighborhood. Academics, planners and local governments are struggling to keep pace with the
expansion of co-working spaces.
Thus far, local governments are the leaders in exploring the relationship that co-working
spaces have with their surrounding community. Based on basic planning principals, municipalities
through the country are generally in favor for co-working spaces due to their potential ability to
contribute to local economic development: increasing density, attracting highly skilled workforce,
utilizing and repurposing alternative/Class B office space (Sonoma County Economic
Development Board and Coworking Alliance of Sonoma County 2015; Arlington Future Office
Market Task Force 2015). Municipalities of all sizes throughout the country are offering resources
for co-working spaces such as creating co-working spaces (directly and indirectly), compiling
current available co-working spaces for the public and the forming of task forces to better
understand the concept and practice of co-working: Sonoma, Los Angeles (CA), Asotin,

15
Columbia, Whitman (WA), Montgomery, Arlington, Hanover (VA), Steuben (IN), Pinellas (FL),
La Plata, Denver (CO), Evansville (IL), New York City (NY), Madison (WI).
While local governments recognize the opportunity that co-working spaces present for
economic development, they also acknowledge that the space itself cannot and will not be the only
driver of local economic development. Municipality task forces around the country are developing
recommendations to harness the potential transformative power of co-working spaces: diversifying
building and office stock, ensuring varied street-level activity, and leveraging public transportation
networks. However, in order to better understand the full effects of co-working spaces, drawing
on existing research is necessary. The literature draws parallels between the rise of co-working
spaces and the creative class (Ericson 2015; Florida 2002; Moriset 2013). While the creative class
referred to artists and writers in the past, in the post-industrial economy the creative class has
expanded to include programmers, designers and information workers. Ultimately, the creative
class are knowledge-based professionals that innovate, create, and problem solve (Florida 2012).
This is manifested in today’s average co-worker – a college educated professional within their
mid-twenties and their late-thirties, “primarily working within the creative industries, such as web
developing, graphic design and programing, or new media” (Foertsch 2015). The two groups share
near identical core values of individuality, meritocracy, collaboration, diversity and openness. On
the same note, the creative class has been a proponent of loosening work norms, pushing for
flexible schedules, relaxed dress code, greater autonomy, and more open office layouts – a few of
the defining of co-working (Florida 2002; Golinski and Mosebach 2010; Spreitzer, Bacevice and
Garrett 2015). Given the similarities between co-workers and creative class, exploring the research
about the creative class’ lifestyle preferences and drivers can provide insight on co-workers. The
creative class is attracted to high quality amenities and experiences, a driving factor in their

16
lifestyle preferences. They enjoy stimulating environments that will encourage their own
creativity: a diverse educated and talented population, walkable and transit-oriented cities, areas
with a vibrant cultural scene, communities with varied multi-use street-level activities (Florida
2002, 2004).
The places that the creative class desire to live are the definition live-work-play
communities – dense, diverse, connected places that support mixed-use and offer amenities,
allowing community members to live, work and play locally (Malizia 2015; King et al. 2010).
Diversity is key in achieving LWP places, permeating all aspects of the community: the people,
the buildings, and the uses. The LWP concept encompasses mixed-use developments meet the
basic requirements of “affordable and accessible housing, transport, healthcare, education and
training, leisure and reaction facilities, other public amenities, and opportunities for social
interaction” (Insch and Florek, 2008). Interactions and the atmosphere brand a community, making
local stakeholders its ambassadors. Therefore, when stakeholders are satisfied, they relay a positive
image of the area. When community members can live, work, and play in the same area, there is a
greater sense of community.
Further refining the concept is the innovation district model which emphasizes economic
development, placemaking and networking. Innovation districts require the convergence of social
and monetary capital, infrastructure along with spaces in the public and private realms that
encourage interaction, and relationships among community members and institutions (Katz and
Wagner 2014). The success of innovation districts pivot upon compactness of all services and
amenities – walkability and transit options are essential. Proximity fosters interaction leading to
civic engagement and increased economic activity which cultivates a sense of community coupled
with the desire to engaging with neighborhood – creating a cyclic effect (Hracs and Massam 2008).

17
In addition to creating a sense of community, the LWP model diversifies the uses within a
neighborhood, driving local economic development. In homogenous communities, single use
developments bring a predetermined amount of residents and create a set number of jobs. These
neighborhoods are active only during work hours or home hours in the evening. But in a LWP
area, the conglomeration of the different uses serves as its own economic engine. The
neighborhood is activated – not limited to work or home hours – becoming a round-the-clock
multi-use neighborhood. With growing community needs, new jobs are created; new jobs draw
new residents; new residents will further grow community needs. In the LWP model, the sum is
greater than its parts.
Sharing the similar goals of community building it is intuitive that co-working and LWP
places would go hand in hand. Both are dependent on the conglomeration and interaction of varied
types of people to be successful. With the co-working population primarily consisting of the
creative class, there is a natural draw to LWP places. Whereas LWP places want to incorporate
co-working spaces due to the clout that comes with them – it is a new buzzword that is often used
in branding and marketing (Gandini, 2015). Co-working spaces serve as an essential third place in
communities – they serve as a place for people to work that is outside of home and the traditional
constraints of the office typology. By incorporation a co-working facility, LWP communities have
provided an affordable venue for at-home workers and potential start-ups to be visible and more
opportunities to interact with the surrounding neighborhood. With both programs are dependent
on density and interaction, the collaboration of the two in only natural to drive local economic
development.
While prior literature provides insight on the creative class’ lifestyle and work preferences
along with the economic potential of the places that attract the creative class, they are explored

18
separate from each other. The goal of this paper is to bridge the literature, specific to co-working
space users’ work and lifestyle preferences can be leveraged to economic development for urban
planning applications.

19
Research Methodology
As co-working spaces continue to expand, they are venturing beyond CBDs and into
surrounding communities. Many of these areas outside of the CBD are in transition or on the cusp,
therefore co-working spaces establishing themselves in these locations may have the potential to
impact the type and pace of change in the neighborhood. In order to understand the big picture and
nuances of co-workings spaces’ impact, a case study research design with both qualitative and
quantitative methods was utilized for this research – focusing on economic and community
development indicators.
Case Selection
The criteria for determining the population were:
Location – beyond the Manhattan CBDs but within the metropolitan NYC area. Within
the CBD, the sense of community is already established – diversified and already
economic hubs. The Manhattan core has no issues attracting employers, workers, or local
spending. When co-working spaces establish themselves within the core, they introduce
little impact to such an established area. However outside of the Manhattan core,
neighborhoods are beginning to diversify and rebrand themselves to strengthen their
community and spur economic development. It is in these communities that co-working
spaces have the greatest potential impact since they attract a new population and new use,
creating a new urban fabric.
Definition – the co-working space must have a social and collaborative aspect within the
internal environment. Using these parameters, 42Floors and Google were used to filter
through existing co-working spaces in the metropolitan area. This narrowed the study
population to 33 co-working spaces.

20
Since the start of the research on September 2015, this number has grown. Of the
established population, locations were selected randomly to be included in the research.
However, some co-working spaces were unresponsive or reluctant to partake,
consequently, another site was selected randomly from the remaining population until 2
co-working spaces that fit the above criteria agreed to participate. The 2 sites ultimately
part of the case study analysis were WeWork in Dumbo and TEEM Coworking in Central
Harlem (near Fredrick Douglas Blvd). Both of these neighborhoods have recently been
rezoned by the Department of City Planning rezoning, in 2009 and 2003, respectively.
Dumbo, a formerly manufacturing district, was rezoned with the goals of promoting mixed-
use development through increasing density and residential stock while maintaining the
unique commercial aspect of the urban fabric.1 Meanwhile the goals of the rezoning of
Fredrick Douglas Blvd in Central Harlem were to foster new opportunities for residential
development and encourage ground floor retail and service uses.2 WeWork lies within a
rezoned Dumbo area while TEEM is on the peripheral of the Central Harlem rezoning.
Both neighborhoods’ rezoning reflects the city’s effort to spur growth and community
development. The major difference in the rezoning of the two neighborhoods is the
emphasis on residential growth in Central Harlem. The different zoning provides an
opportunity to observe how well the co-working spaces have integrated with
neighborhoods with different development goals.
1 http://www.nyc.gov/html/dcp/html/dumbo/dumbo3.shtml 2 http://www.nyc.gov/html/dcp/html/fdb/fdb1.shtml

21
TEEM Coworking is located in Central/East Harlem, areas that have been recently rezoned to support residential development.
Source: OASIS NYC
WeWork Dumbo is located in Dumbo which has been recently rezoned for greater mixed-use developments.
Source: OASISI NYC

22
While WeWork Dumbo and TEEM are relatively new – opening in 2015 and 2014,
their operating model and scale are the major differentiating factors. WeWork in Dumbo
one of the locations that WeWork offers. The company is the largest co-working provider
in the world with over 54 locations and over 15,000 member-users globally (Torrance,
2015). WeWork’s model is to design and build a physical and virtual community through
the common space in their locations and on their members-only social networking site. The
online platform allows members from all the different and specific WeWork locations to
connect. There are weekly workshops and networking events are geared towards the
population of each site along with regional social events. The WeWork Dumbo location
spans two formerly manufacturing building, totaling 162,000 square feet -which could
accommodate up to 800 members. At the time of the data collection, WeWork Dumbo has
been functioning for 6 months and still renovating the second building in its complex –
therefore not occupied to capacity but membership is growing. The space is managed by a
team of 10 WeWork employees. Monthly memberships at WeWork Dumbo range from
$500 - $800, depending on the type of desk and office space. WeWork Dumbo is staffed
during typical business hours 8am to 6pm n weekdays with security at the front desk
24hours however members have access to the building 24/7 with their access card. On the
other end of the spectrum is TEEM Coworking, a co-working space based in one location
– the ground floor of a residential building totaling about 13,000 square feet. In addition to
being a co-working space, TEEM offers its venue for private events. The space can
accommodate up to 100 people, however on a typical day about 30 members use the space.
Membership packages range from $200 - $400 depending on access and type of desk space.
Without the same economies of scale of WeWork, TEEM doesn’t have much of a digital

23
presence but still offer monthly workshops/webinars. The space is owner managed. Access
to the TEEM space is limited to typical office hours – 8am to 6pm on weekdays. The range
between WeWork Dumbo and TEEM Coworking will offer greater insight in the case study
analyses – bringing to light similar successes/issues and scale/model specific matters.
Data Collection
As a case study, several forms of data collection were utilized for each of the sites
and their immediate community. A combination of surveys, observations and
conversations with co-working space users/managers comprise the qualitative component
of this research’s data. In addition, pre-collected data about each of the co-working spaces’
community was analyzed pre and post the installation of the new office space. Data was
retrieved from the American Community Survey and the Census to determine whether
there have been any changes in the composition and demographics of residents and
employment details. I also examined Department of Building issued permits for each of
the neighborhoods to evaluate the state of the real estate market and note any change since
the area rezoning and the introduction of co-working spaces.
A. Surveys
The survey was designed to gauge co-working space users’ perceptions and
level of interaction and civic engagement with the surrounding area. In addition,
the survey collected participants’ basic demographic data employment status, home
neighborhood, commute pattern, why they selected their particular co-working
location, perception of community amenities, along with least and favorite aspects
of the neighborhood. The purpose of the survey was to indicate how invested co-

24
working space users are in the community and the likelihood of them remaining in
the area. Surveys at both sites were collected throughout the month of January 2016.
At WeWork Dumbo, surveys were distributed in two different methods –
digitally and physically. Utilizing the social platform, I posted twice a week to the
Dumbo location site, inviting members to take the survey. In addition, the study
was featured as part of one the building-specific weekly events – "Coworking Space
Surveys and Cookies with Veronica.” A station was set up by the elevator bank in
the lobby during lunch hours so people were able to take the survey while they
waited for the elevator – there was also an option for members to return the survey
later during the day. These two approaches maximized exposure of the study to the
building population, capturing the highest response rate possible. A month of
survey collection efforts resulted in 24 responses – 8 digitally and 16 physically.
At TEEM, surveys were distributed physically. At the beginning of the
month, I presented my research to the members, answering questions they had. A
survey station was established in the communal kitchen area with signage about my
study, survey and my contact information for any further questions. Surveys were
collected daily by the owner-manager and stored until I came by weekly to pick
them up. A total of 16 surveys were collected.
Regarding the surveys, a low response rate could be reflective of the month
of survey collection – January. It is after the holiday season and there were several
snow storms, including a near-record breaking snowfall, along with a 3-day
weekend that might have resulted in fewer than expected people to commute to
their respective co-working spaces. While both sites offer daily use of the space,

25
the main focus is on monthly members. That being said, TEEM is part of a co-
working space membership program, Croissant. This program grants users access
to 23 co-working locations throughout the 5 boroughs. This could have effected
survey responses since it could change the consistency of members with more day-
users rather than month long members.
At the end of the survey collection period, all the physical and digital
responses were compiled together to allow for easy analysis. Data was analyzed
site specific and as an aggregate for a small and big picture view of users’
perceptions and interactions with their respective neighborhoods. A copy of the
survey can be viewed in Appendix A.
B. Observations & Conversations
During the month of January, I was a participatory observer at the co-
working spaces. At WeWork, the only way to access the members for them to take
the survey was to be part of the network, therefore I worked out of the space part-
time (1 day a week) for the data collection month. During my time there, I had the
opportunity to speak other members and WeWork managers about their experience
and perception of the space. TEEM, on the other hand, was more relaxed about the
access to its members for survey collection and didn’t require membership.
However, I still had the chance to interact with the members and owner-manager
during my weekly survey collection. At both locations I was also able to note
members’ level of interaction with the community and compare it to survey
responses. Beyond human observations, I also explored each of the co-working
spaces’ neighborhood to contextualize the survey responses – noting the
26
type/state/extent of amenities, open space, food options, public safety features, and
publicized opportunities to be involved in the community.
C. Pre-Collected Data
To triangulate the survey and observations, secondary statistical data about
each of the co-working spaces’ community is necessary. The original intent was to
analyze the community pre and post the installation of the new office space along
with pre and post rezoning. Community demographic data was retrieved from the
American Community Survey the Census: age, gender, race/ethnicity, household
income, educational attainment, and travel characteristics of the working
population. The scope of the community for each of the selected co-working space
were the census tract – WeWork Dumbo is within census tract 21 in Kings county
and TEEM is within census tract 184 in New York county. Due to the time that the
ACS takes collect and release data, the most current community data available is
for 2014. With both co-working sites being so new, this 2014 data predates the
opening of WeWork Dumbo (2015) and is the same year that TEEM was
established, therefore will not provide comprehensive insight on any potential
impact that each co-working space has had on the neighborhood. However, the
Dumbo area is already rich with multiple co-working spaces that predate 2014
therefore the community information for the year is still applicable to the context
of this study. In Central Harlem, the 2014 data will provide a snapshot of the
community at the time of TEEM’s founding which should reflect the intended
clientele. For the pre establishment of the co-working spaces comparison, 2010

27
ACS data was used. The pre-zoning year for analysis for both neighborhoods was
2000 Census data.
Furthermore, Department of Building issued permits for each of the
neighborhoods to evaluate the state of the real estate market and note any change
since the area rezoning and the introduction of co-working spaces. To better
understand the micro-market immediately around the co-working space, the study
area for this portion of the research is the area immediately by the site within the
rezoned area. This encompasses 35 blocks around TEEM and 40 blocks around
WeWork Dumbo. The Dumbo study area includes more blocks since there were
several blocks in the immediate vicinity that are dedicated to city infrastructure and
bridge support. The Department of Building publishes monthly statistical reports
with all issued permits for work within the city. Analysis of the volume and type of
work permits for the different use type of buildings over time will shed light on the
state of the real estate market and any changes since each area’s rezoning and how
the establishment of the co-working sites fit into the market.
Blocks within the Study Area of each Co-working Space
WeWork Dumbo TEEM Coworking
1, 3, 18, 19, 20, 21, 27, 28, 29, 30, 31, 32,
35, 36, 37, 38, 40, 41, 42, 45, 51, 52, 53,
54, 55, 63, 66, 68, 76, 77, 201, 202, 204,
207, 210, 211, 212, 214, 215, 216
1594, 1595, 1596, 1599, 1600, 1601,
1717, 1718, 1820, 1821, 1822, 1823,
1824, 1825, 1826, 1827, 1828, 1829,
1830, 1831, 1846, 1847, 1848, 1849,
1901, 1902, 1903, 1904, 1922, 1923,
1924, 1925, 1943, 1944, 1945

28
TEEM Coworking Study Area in Central Harlem
Source: ZOLA NYC
WeWork Dumbo Study Area in Dumbo
Source: ZOLA NYC

29
However, they only have data available dating back to 2003 which is after the 2002
rezoning of Central Harlem, therefore the neighborhood building permit analysis
for the around TEEM will be limited to the time immediately after its rezoning
rather than before. While all permits issued were reviewed there was special focus
on earthwork and foundation permits since it is substantial work that indicates the
conversion of a building’s use, along with new building permits. This dataset will
reflect what developers and property owners perceive as the best and highest use of
their assets and whether compatible with the city’s rezoning goals.
A case study of WeWork Dumbo and TEEM Coworking provides a
comprehensive understanding of the sites and their surrounding neighborhoods.
Qualitative data from surveys and conversations offer a human aspect as users share
their experiences in the neighborhood while the quantitative data from the ACS,
Census and DOB reflect whether the market has responded at all to the rezoning.
Summary of Subject Sites
WeWork Dumbo TEEM Coworking
Within the 2009 Dumbo rezoning,
promoting mixed use development in a
formerly manufacturing area.
Neighboring the 2003 Central Harlem
rezoning which was aimed at fostering
residential growth.
Part of a large co-working company that
has locations across the globe. A 2-
building complex that can support 800
member-users at capacity.
Single location co-working company that
can support about 100 members at
capacity.
Weekly workshops and social networking
events specific to each location. In
addition, WeWork hosts regional and
national events for members throughout
the year.
Monthly workshops/webinars for users

30
Summary of Data
WeWork Dumbo TEEM Coworking
Survey Count 24 13
Census Tract for
Community Demographic
Analysis
Kings 21 New York 184
Community Demographic
Data Sources
Prezoning - 2000 Census
Pre Co-Working Space – 2010 ACS
Snapshot when Co-Working Spaces Established – 2014 ACS
DOB Issued Permits Study
Area Blocks 40 35
DOB Issued Permits Study
Area Time Frame
January 2007 to October
2015
January 2003 to October
2015

31
Results A. Surveys
There were a total of 36 completed surveys from both sites – 23 from WeWork Dumbo
and 13 from TEEM. Given the recent openings of both the spaces, the timing of survey
collection, the weather conditions and the continued membership lease-up efforts, the survey
results are representative of the population within each respective space.
Demographics
While both sites are co-working sites, their member-users vary greatly. The
results of DeskMag’s “1st Coworking Survey” as a benchmark to compare the
demographics of the WeWork Dumbo and TEEM’s users. DeskMag (2013) found that
the most coworkers in the United States tend to be young and male; primarily ranging
between their mid-twenties to late-thirties and the male to female ratio is 2:1. While the
average age of coworking space users is relatively low, their educational attainment is
high with 75% of member-users having completed at least a bachelor’s degree. WeWork
Dumbo is on par with DeskMag’s profile: 70% of the sample lie within the 25-34-year-
old age group, 57% are male, 92% have completed at least a Bachelor’s degree and 43%
have a graduate or professional degree with average income hovering $99,000. The
majority of the WeWork Dumbo population is White (57%), followed by 17% of the
population being Asian and 13% being Black/African American.
13%
70%
13% 4%
Age Breakdown at WeWork Dumbo Under 17yo
18-24yo
25-34yo
35-44yo
45-54yo
55-64yo
75yo and older
Sample Size 24
23%
23%
38%
8%8%
Age Breakdown at TEEM
Under 17yo
18-24yo
25-34yo
35-44yo
45-54yo
55-64yo
75yo and older
Sample Size 13

32
38%
54%
8%
0%
50%
100%
Educational Attaimment at TEEM
Did Not Disclose Ongoing Bachelors
Bachelors Masters
Professional Degree
4%4%
48%
30%
13%
0%
50%
100%
Educational Attainment at WeWork Dumbo
Did Not Disclose Ongoing Bachelors
Bachelors Masters
Professional Degree
31%
23%15%
8%
23%
Race & Ethnicty at TEEMWhite
Black or AfricanAmericanNative American
Asian
Other
Multiple
Hispanic/Latino
57%
13%
17%
4%9%
Race & Ethnicity at WeWork Dumbo
White
Black or AfricanAmericanNative American
Asian
Other
Multiple
Hispanic/Latino
57%
39%
4%
0%
20%
40%
60%
Male Female Other
Gender Breakdown at WeWork Dumbo
23%
77%
0%0%
20%
40%
60%
80%
100%
Male Female Other
Gender Breakdown at TEEM
0%
5%
10%
15%
20%
25%
8%
15%
8%8%
23%
8%
15%
8% 8%
Annual Incomes at TEEM
Less than $10k$10k-$14,999$15k - $24,999$25k - $34,999$35k - $49,999$50k - $74,999$75k - $99,999$100k - $149,999$150k - $199,999Greater than $200kDo not wish to disclose
0%
5%
10%
15%
20%
25%
4%
9%9%
22%
9%9%
4%
17%17%
Annual Incomes at WeWork Dumbo
Less than $10k$10k-$14,999$15k - $24,999$25k - $34,999$35k - $49,999$50k - $74,999$75k - $99,999$100k - $149,999$150k - $199,999Greater than $200kDo not wish to disclose

33
TEEM, on the other hand, diverges from the profile that DeskMag compiled from
its survey. The age composition is a bit more diverse and skew to a slightly older cohort,
with the largest age group being the 35 to 44 year olds. TEEM’s population is
overwhelmingly comprised of females – 77%. Race and ethnic composition of TEEM’s
population is extremely diverse – split fairly evenly among the different groups. In terms
of educational attainment, TEEM users have higher levels of education than their
WeWork Dumbo and DeskMag (2013) profiled counter parts with 62% of users having a
graduate of professional degree. Average incomes hover around $70,000.
Employment Status
The popular belief about co-working space users is that they are primarily
freelancers or self-employed individuals. However, DeskMag (2013) found that to be a
misconception – since only 44% fall within those categories while the other 55% own or
work for a company with other employees. The population at WeWork Dumbo confirm
these findings with 61% of the population a contracted employee while 46% of the
TEEM population is comprised of self-employed individuals. There is also a trend that
co-working space users work primarily in the arts, media, and technology sectors. While
there is strong representation among these sectors – 30%, business services and
hospitality were the leaders at this location at 43%. TEEM is more align with the
DeskMag profile with 38% of the population working in the arts/entertainment sector and
another 13% in the information field.

34
0%
10%
20%
30%
40%
1
0% 0%
8%
0% 0%
15%
8%
15%
38%
0% 0%
15%
0%
Industry Sectors within TEEM
Agriculture Construction
Manufacturing Wholesale/Retail
Transportation Information
Financial Services Business Services
Arts/Entertainment Hospitality
Government Education/Healthcare
Other
0%
5%
10%
15%
20%
25%
30%
0% 0% 0%
4%
0%
17%
4%
17%
13%
26%
4%
9%
4%
Industry Sectors within WeWork Dumbo
Agriculture Construction
Manufacturing Wholesale/Retail
Transportation Information
Financial Services Business Services
Arts/Entertainment Hospitality
Government Education/Healthcare
Other
16%
23%
15%
46%
Employment Status at TEEM
Contracted F/T
Contracted P/T
Freelancer
Self-employed
57%
4%
9%
30%
Employment Status at WeWork Dumbo
Contracted F/T
Contracted P/T
Freelancer
Self-employed

35
Live Work Play Factors or Indicators
One of the defining features of a LWP neighborhood is the proximity and
accessibility of activities, amenities, recreation, and employment to home. Commute time
to each co-working space is an indicator of whether or not co-workers view the work
neighborhood is a multifunctional use community. The most common commute time for
both members at TEEM and WeWork is 15-19 minutes, 31% and 22% respectively. The
WeWork Dumbo population tend to have longer commute times with 55% having
commute times greater than half an hour each way and 26% actually traveling more an
hour each day. Commute times of TEEM members are more equally distributed with
travel times ranging from less than 5 minutes to more than 90 minutes.
There are many other indicators that would identify whether a community is a LWP place
or not. The amount of time and involvement that co-working space users spend in the
area along with perceptions and interactions with the immediate neighborhood. At
WeWork Dumbo, 78% of the population used the space as their primary work site
compared to the 46% of the TEEM population.
0%5%
10%15%20%25%30%35%
8% 8% 8%
31%
0%
15%
0% 0%
8% 8% 8% 8%
Commute Time at TEEM
0%5%
10%15%20%25%30%
0% 0%4%
9% 9%
22%
4% 4% 4%
17%
26%
0%
Commute Time at WeWork Dumbo
36
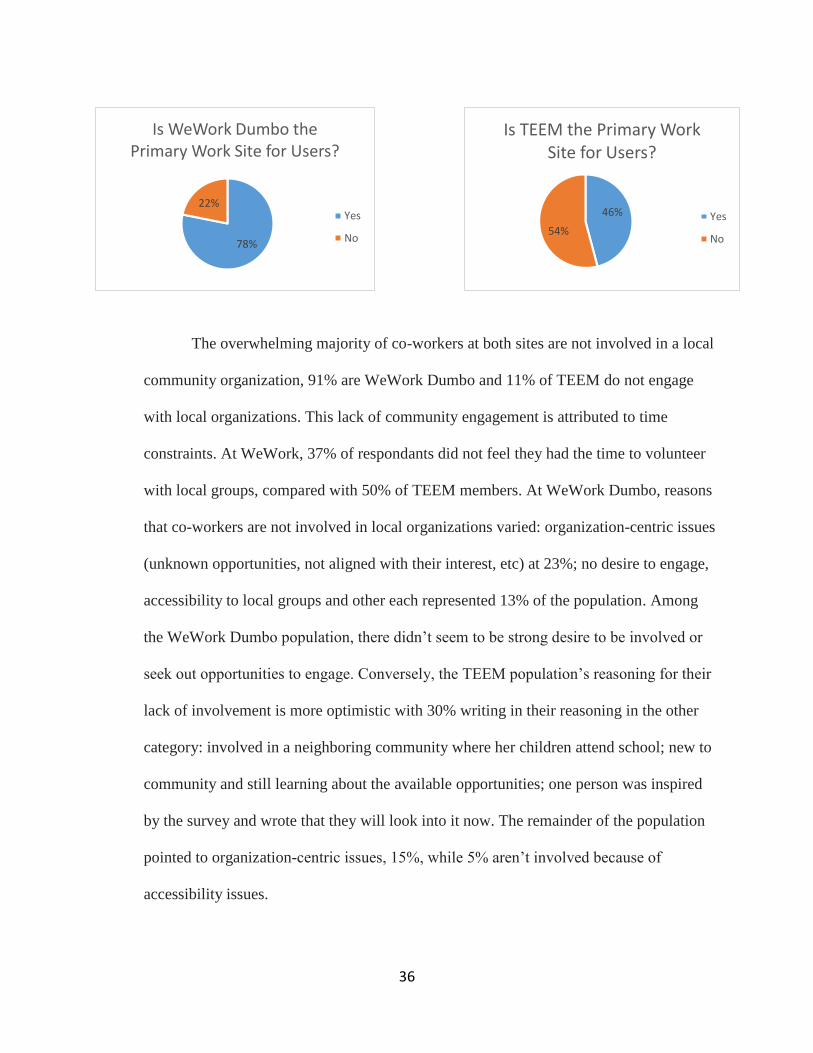
The overwhelming majority of co-workers at both sites are not involved in a local
community organization, 91% are WeWork Dumbo and 11% of TEEM do not engage
with local organizations. This lack of community engagement is attributed to time
constraints. At WeWork, 37% of respondants did not feel they had the time to volunteer
with local groups, compared with 50% of TEEM members. At WeWork Dumbo, reasons
that co-workers are not involved in local organizations varied: organization-centric issues
(unknown opportunities, not aligned with their interest, etc) at 23%; no desire to engage,
accessibility to local groups and other each represented 13% of the population. Among
the WeWork Dumbo population, there didn’t seem to be strong desire to be involved or
seek out opportunities to engage. Conversely, the TEEM population’s reasoning for their
lack of involvement is more optimistic with 30% writing in their reasoning in the other
category: involved in a neighboring community where her children attend school; new to
community and still learning about the available opportunities; one person was inspired
by the survey and wrote that they will look into it now. The remainder of the population
pointed to organization-centric issues, 15%, while 5% aren’t involved because of
accessibility issues.
78%
22%
Is WeWork Dumbo the Primary Work Site for Users?
Yes
No
46%
54%
Is TEEM the Primary Work Site for Users?
Yes
No

37
When asked how long members expected to continue staying at their respective
co-working space, over 50% at both WeWork Dumbo and TEEM anticipated staying for
less than a year – 60% and 77% respectively. WeWork Dumbo members are more likely
to stay at the site for longer periods of time with 21% expecting to work out of the
Dumbo location for at least the next 2 years while only 15% at TEEM co-workers had the
same expectation.
91%
9%
Are WeWork Dumbo users involved in a community
organization?
Yes
No
23%
77%
Are TEEM users involved in a community organization?
Yes
No
37%
13%
23%
13%
13%
0% 10% 20% 30% 40%
Time Constraints
Location/Accessibility Issues
Organization-centric Concerns
Don't want to engage
Other
Factors Affecting Lack of Community Organization Involvement at WeWork
Dumbo
0% 10% 20% 30% 40% 50%
Time Constraints
Location/Accessibility Issues
Organization-centric Concerns
Don't want to engage
Other
50%
5%
15%
0%
30%
Factors Affecting Lack of Community Organization Involvement at TEEM

38
The factors that draw people to the community are important. The survey sought
to determine the aspects that drew co-workers to the co-working space and the
neighborhood. The most influential factors among populations at WeWork Dumbo and
TEEM were price (24% and 23%) and commute times (17% and 23%), followed by the
people within the space (17% and 19%) and the familiarity/preference for the particular
neighborhood (18% and 23%). Specific to WeWork Dumbo, the WeWork brand attracted
a significant amount of the population – 16%. The WeWork brand is built on flexibility
and collaboration – encapsulating the creative class mentality. The company’s tagline is
“Do what you Love,” reinforcing the new wave of the changing nature and approach to
work. As an innovator that embraced new ideas and trends, there is a certain among of
“coolness” factor that the WeWork has.
0%
20%
40%
60%
<6 mo 6 mo - 1 yr 1 - 2 yrs 2 - 3 yrs >3 yrs
46%
31%
8%15%
0%
USERS' EXPECTION TO CONTINUE AT TEEM
0%
10%
20%
30%
40%
50%
<6 mo 6 mo - 1 yr 1 - 2 yrs 2 - 3 yrs >3 yrs
43%
17% 17%
4%
17%
USERS' EXPECTATION TO CONTINUE AT WEWORK DUMBO

39
Neighborhood interactions, engagement and perception are also indicators LWP
places and how co-working spaces are impacting the local community. Overall, TEEM
members do not feel as though they are integrated with the Central Harlem community.
Their responses to how well they knew the neighborhood, how safe they felt, and how
satisfied they were with the community were overwhelmingly “not at all,” “slightly,” and
“moderately.” This is in line with their self-reported interactions with Central Harlem.
Almost all of reported to “never” or “rarely” shopping or spending time in the area
outside of work. TEEM members reported to dining out in the area sometimes. The only
dividing activity in the area was running errands; there were two groups, those that
'“rarely” and “always” did so. These responses don’t really align with the perceived
amenities in the area. It seemed as though the majority of the TEEM population believed
there to be “the right amount” of convenience stores, parks, and retail options. However
the largest market in the neighborhood according to TEEM members were restaurant and
food options, though retail options could also be increased. WeWork Dumbo members
reported having a different experience in Dumbo. While they feel extremely safe and
moderately to extremely satisfied working in the community, they admitted that they do
not feel as though they know or integrated with the Dumbo area. This is aligned with
their self-reported interactions with the community with the more than 90% of the
respondents never, rarely, or sometimes shop, run errands or hang out in the Dumbo area.
The only interaction that most have with the community is dining out, where almost
everyone responded that they do so often. These responses are aligned with the
perception of neighborhood amenities. Across the board, WeWork Dumbo members
believed there to be too few restaurants/dining options, convenience stores and retail

40
options. There population is split between having too few or just the right among of park
space.
Not at All
Slightly
ModeratelyVery
Extremely
Self-Perceived Neighborhood Integeration at WeWork Dumbo
How well do you know the neighborhood?
How integrated do you feel in the community?
Overall, how satisfied are you working in this neighborhood?
Overall, how safe do you feel in this neighborhood?
Not at All
Slightly
ModeratelyVery
Extremely
Self-Perceived Neighborhood Integeration at TEEM
How well do you know the neighborhood?
How integrated do you feel in the community?
Overall, how satisfied are you working in this neighborhood?
Overall, how safe do you feel in this neighborhood?
Never
Rarely
SometimesOften
Always
WeWork Dumbo Neighborhood Interactions
[Dining Out] [Shop]
[Run Errands] [Spend time outside of Work]
Never
Rarely
SometimesOften
Always
TEEM Neighborhood Interactions
[Dining Out]
[Shop]
[Run Errands]
[Spend time outside of Work]

41
The final question in the survey asked co-working space users about their favorite
and least favorite aspects of the neighborhood that their work space is in. Below are the
word clouds created based on their responses. The WeWork Dumbo population loved the
Brooklyn location with views and proximity to the city and bridges along with the trendy
cultural Dumbo neighborhood. The most disliked features of the Dumbo area were the
lack of food options, traffic noise, expensive gentrifying neighborhood and the relative
inaccessibility by public transit. Co-workers at TEEM raved about the convenient
location and neighborhood – it is accessible, diverse, close to home and kids. There was a
positive overtone in all the responses. TEEM members shared the same woe as their
WeWork Dumbo counterparts: lack of food options, primarily healthy choices. Central
Harlem specific features included safety, lack of general amenities and the dirty
streetscape.
0%
20%
40%
60%
80%
Too Few The Right Amont Too Many
Perception of Neighborhood Amenities at TEEM
Restaurants/Eating Out Options Convenience Stores
Retail Options Parks and Green Space
0%
20%
40%
60%
80%
Too Few The Right Amont Too Many
Perception of Neighborhood Amenities at WeWork Dumbo
Restaurants/Eating Out Options Convenience Stores
Retail Options Parks and Green Space

42
Favorite Neighborhood Feature of WeWork Dumbo
Favorite Neighborhood Feature of TEEM
Least Favorite Neighborhood Feature of WeWork Dumbo
Least Favorite Neighborhood Feature of TEEM

43
While there are common threads between the TEEM and WeWork Dumbo
populations, there are also some fundamental differences. Price, commute times, and
familiarity of the neighborhoods were the driving factors in co-working space selection
for both sites. Most of the co-working space users anticipated only a short stay (less than
6months) at their site. Both populations noted the lack of food options and interactive
neighborhood amenities/activities. The co-working space at TEEM and WeWork did not
involve themselves with the surrounding community though TEEM members were more
likely to get involved if given the opportunity/resources/information. The fundamental
differences among the two populations lie within the demographics. TEEM was much
more diverse in almost all aspects: age, race and ethnicity, employment status, and annual
income. WeWork Dumbo comprised mostly of young White adults that were contracted
employees from various industry sectors.
B. Observations & Conversations
i. WeWork
The crux of the WeWork mission is community – however my experience at
WeWork Dumbo didn’t convey the communal feeling that the brand strives for. While I
was surrounded by people and a vibrant community, there was still a sense of isolation.

44
Physically the WeWork Dumbo space is not
conducive to member interaction with the community.
Each floor serves as inclusive environment with a
common space by the elevators that included a dining
bar, Brooklyn-centric art, cozy looking couches/sofas
and a kitchen area. The kitchen are always stocked with
coffee, tea and a rotating beer on tap along with a refrigerator, microwave and espresso
machine. There was also a wide selection of games and books in the lounge area. Beyond
the common area for casual working and lounging, there are varied work spaces:
conference rooms for professional meetings, secluded nooks for additional privacy, and
shared and private offices for working. In addition, there is a convenience stand, Honesty
Market, part of the WeWork Dumbo facilities where snacks and beverages could be
purchased. The community managers acknowledge the bare food options in the area and
believe that Honesty Market is great addition to the community since it increases food
options. However, the space is only accessible to key card holding members of the space.
In addition, speaking with many members in the space, many were unaware of the space
and still ventured out in the community for lunch, followed by complaints about the limited
Source: WeWork
Source: Veronica Chuah

45
options and price. The various office options suit various types of work styles. During my
time at site, I witnessed very few interactions among members. Many remained in their
designated office for the entire day, leaving only for the occasional coffee and lunch. With
narrow hallways full of offices, the only space for organic encounters was in the kitchen
lounge area which is bothersome since re-entry required a key card. Ultimately, the layout
of the WeWork building supports an insular environment that doesn’t promote engagement
with the community beyond.
Within the WeWork structure there is a team of community managers who are
responsible for fostering a sense of community. They are responsible for planning events,
assisting in IT issues, serving as a point person for logistics, growing the WeWork
community, and facilitating interactions among members. Their goal is to build a lasting
community of members – they are not trying to create place of transient workers. The
community managers’ responsibilities fall within the WeWork building parameters. While
not directly involved in building external community relations, successful relationship
made within the WeWork Dumbo network could spill over into the neighborhood as
connections made can lead to patronizing other local businesses, product/service awareness
Source: Veronica Chuah

46
and branding outreach around Dumbo, and collaborations with other locally based
individuals/groups. However, WeWork Dumbo, having been in operation for about 6
months, is still struggling to hit stride at around 60% occupancy. The community
management team is ever changing. When I first started my fieldwork at WeWork Dumbo,
there was a team of 6. At the end of my month of research, 2 of the original 6 were moved
to a different WeWork location and 3 new people joined the community managing team.
With the rotation the community managers, there isn’t a sense of stability among the staff
therefore no social infrastructure to support member interactions that could potentially spill
over into the Dumbo neighborhood.
There are also some community
aspects that impact the level of WeWork
Dumbo users’ engagement with the
neighborhood. Serviced by the A,C,F
trains, Dumbo is accessible. However,
WeWork Dumbo is nestled between the
Manhattan and Brooklyn Bridges, there
are many overpasses to walk under,
curved streets to navigate, sloped streets to
climb and highway traffic to dodge – walking to the site from the train station are a bit
challenging. Several prospective members that toured the site mentioned how difficult it
was to find the building despite using GoogleMaps and other GPS apps. It takes a bit of
effort to find the WeWork facility. Because of the proximity to the highway and bridges,
there are very few commercial uses along the walk to the site. Much of the commercial
Neighborhood around WeWork Dumbo Source: Google Maps
47
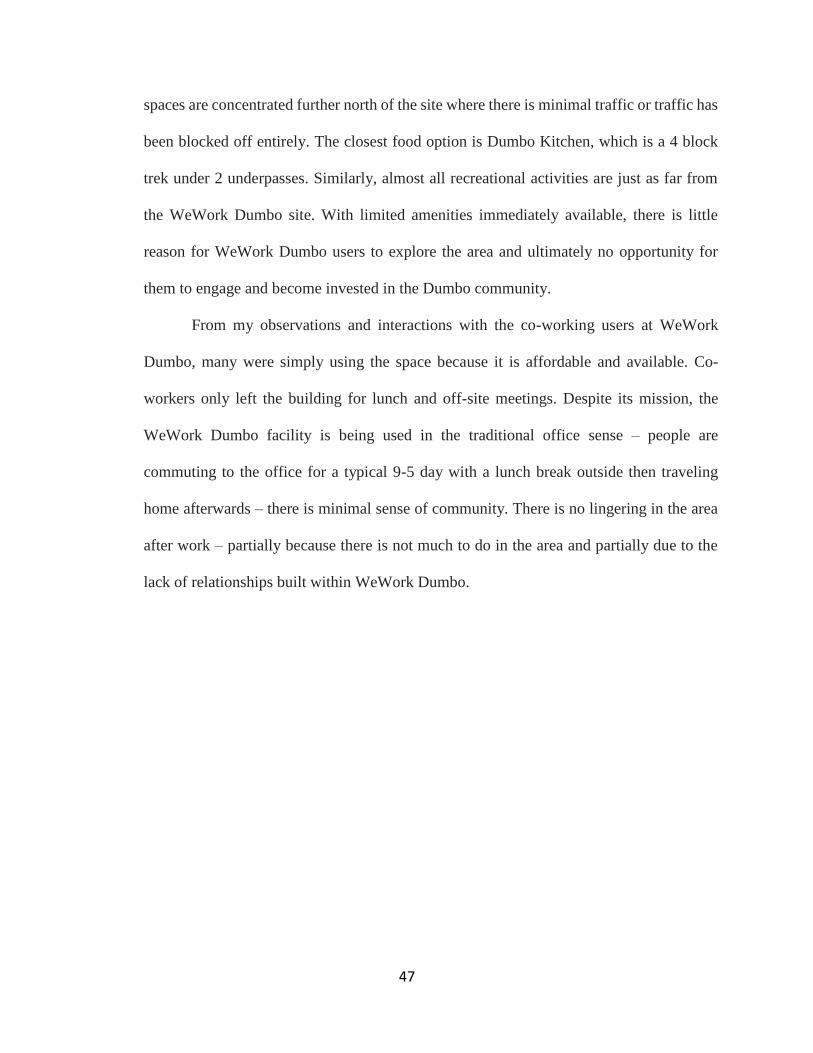
spaces are concentrated further north of the site where there is minimal traffic or traffic has
been blocked off entirely. The closest food option is Dumbo Kitchen, which is a 4 block
trek under 2 underpasses. Similarly, almost all recreational activities are just as far from
the WeWork Dumbo site. With limited amenities immediately available, there is little
reason for WeWork Dumbo users to explore the area and ultimately no opportunity for
them to engage and become invested in the Dumbo community.
From my observations and interactions with the co-working users at WeWork
Dumbo, many were simply using the space because it is affordable and available. Co-
workers only left the building for lunch and off-site meetings. Despite its mission, the
WeWork Dumbo facility is being used in the traditional office sense – people are
commuting to the office for a typical 9-5 day with a lunch break outside then traveling
home afterwards – there is minimal sense of community. There is no lingering in the area
after work – partially because there is not much to do in the area and partially due to the
lack of relationships built within WeWork Dumbo.
48
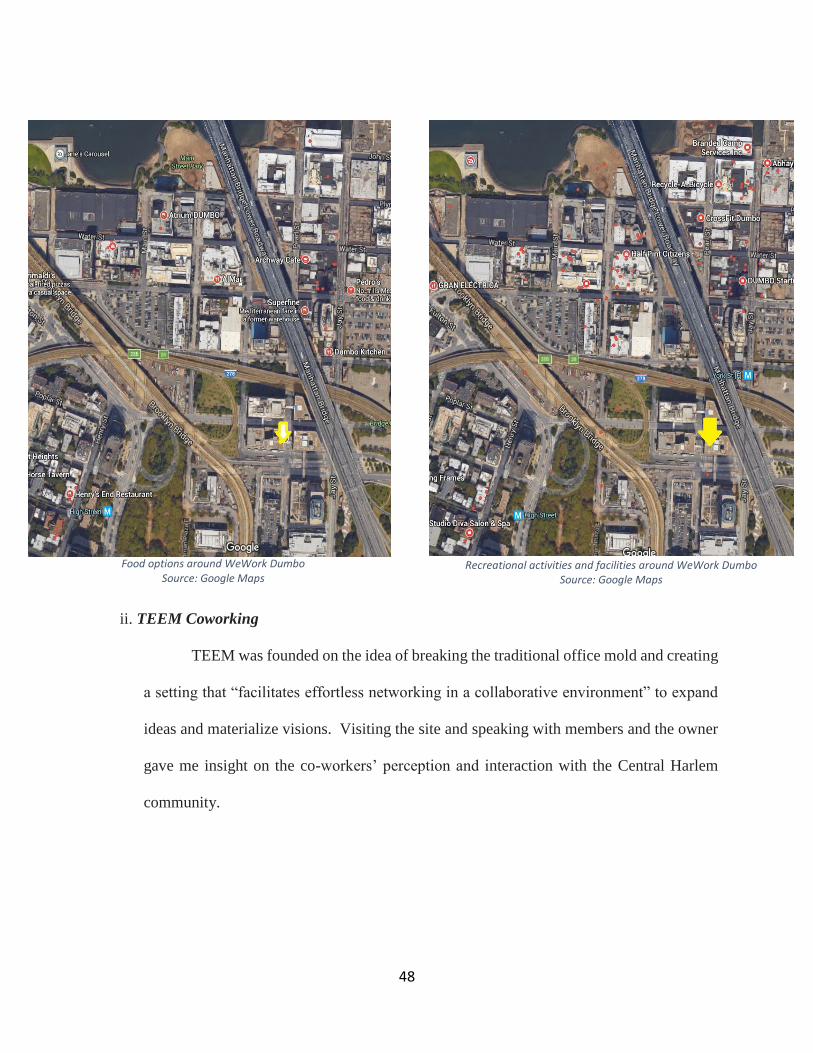
ii. TEEM Coworking
TEEM was founded on the idea of breaking the traditional office mold and creating
a setting that “facilitates effortless networking in a collaborative environment” to expand
ideas and materialize visions. Visiting the site and speaking with members and the owner
gave me insight on the co-workers’ perception and interaction with the Central Harlem
community.
Food options around WeWork Dumbo Source: Google Maps
Recreational activities and facilities around WeWork Dumbo Source: Google Maps
49
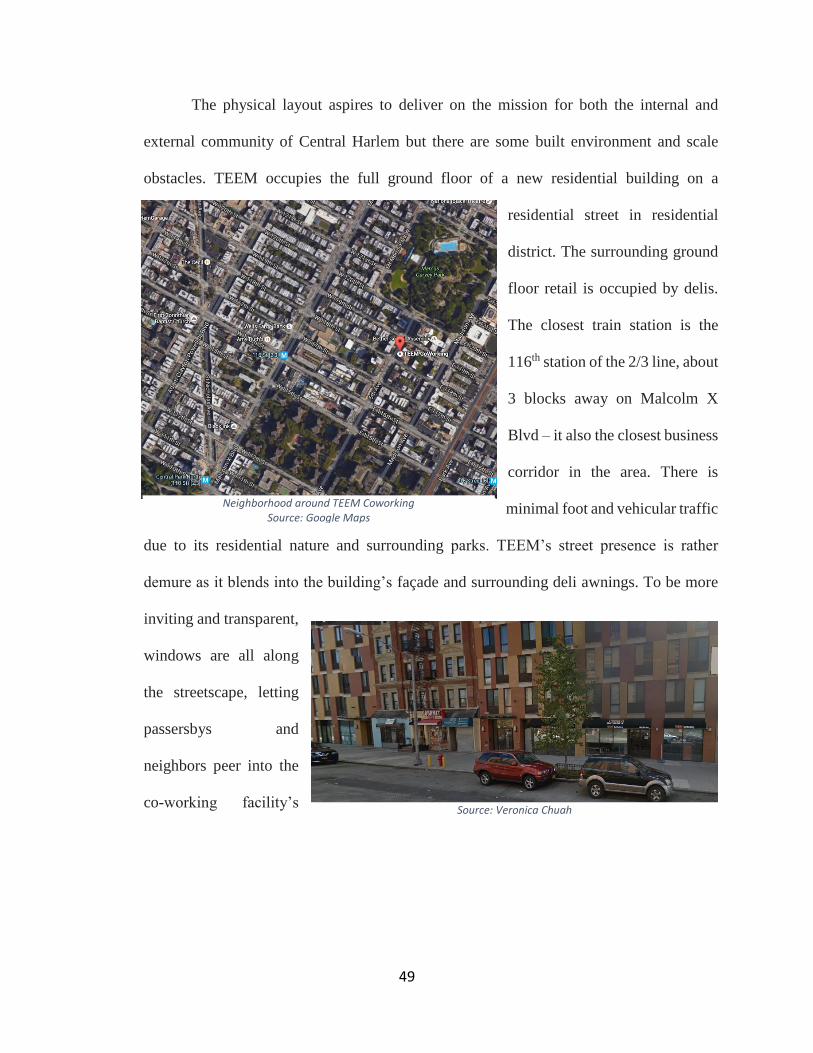
The physical layout aspires to deliver on the mission for both the internal and
external community of Central Harlem but there are some built environment and scale
obstacles. TEEM occupies the full ground floor of a new residential building on a
residential street in residential
district. The surrounding ground
floor retail is occupied by delis.
The closest train station is the
116th station of the 2/3 line, about
3 blocks away on Malcolm X
Blvd – it also the closest business
corridor in the area. There is
minimal foot and vehicular traffic
due to its residential nature and surrounding parks. TEEM’s street presence is rather
demure as it blends into the building’s façade and surrounding deli awnings. To be more
inviting and transparent,
windows are all along
the streetscape, letting
passersbys and
neighbors peer into the
co-working facility’s
Neighborhood around TEEM Coworking Source: Google Maps
Source: Veronica Chuah

50
conference room and workspace. Inside, is an open floor plan with four large tables for
members. There are no columns or partitions separating the 4 large tables for members to
work at – facilitating interactions among users. Off to the side are break-out round tables
for small group collaborations. The existing columns delineate the work space from the
kitchen. The kitchen was rather small,
stocked with snacks and basic appliances –
it wasn’t meant to be the socializing corner
of the space, that was supposed to happen
at the desks. This small kitchen also
encourages co-workers to venture into
Central Harlem for meals and special
refreshments. Most eventually buy food
from the area but often return complaining about the lack of options and the distance food
options beyond delis. On the other hand, there are several recreational activities in the
Food Options by TEEM Coworking Source: Google Maps
Recreational activities and facilities around TEEM Coworking Source: Google Maps
Source: Veronica Chuah

51
immediate area. With the optimistic responses from the survey, there is potential with
TEEM members participating with one of these local groups.
In spite of physical layout that supports collaboration and openness through work
along with engagement with the Central Harlem community, these rarely happened since
many TEEM members worked independently on projects and often with headphones in. In
fact, members almost are purposefully selecting to sit at least several seats away from other
members – as if to give each other privacy. Also being a smaller owner-operated co-
working space than WeWork, there were significantly fewer people at TEEM – each day
averaged to about 15 people. There are also two ways to attain TEEM membership: directly
with the owner-operator and through a co-working consortium membership program. This
impacts the type of members that use TEEM. While the majority of TEEM users had
monthly memberships, there is also a noticeable flow of daily members from the
consortium program. While the physical layout of the TEEM facilitates work collaboration,
almost all the members are intent on their individual project and not seeking the collective
working process nor are there enough consistent daily members to capitalize on the
opportunities framed by the layout. With minimal interaction within the space,
relationships are not really developed therefore neither is investment in the co-working
space and the community it is in.
Despite being vastly different physically and programmatically, I observed the
same trend among the WeWork Dumbo and TEEM members – they were more interested
in the third-place aspect than the collaboration aspect of co-working. Most were there to
work – there was minimal expressed interest in being a part of the community their co-
working space is located in. The commodity was the physical office space not the
52
programming and built-in networking system. Seeking food options was the primary
reason members ventured into the local area. However, both Dumbo and Central Harlem
did not have the amenities that co-workers sought therefore many were dissatisfied with
the area. Despite the new type of work that members were engaged in, the traditional divide
between work and life is persisting.
Secondary Data
Pre-collected secondary data about Dumbo and Central Harlem demographics were
collected and compared. Snapshots into each neighborhood were taken from three years: 2000,
2010 and 2014. For neighborhood demographics, the study area parameters was the census tract
that the co-working space is located. These three years provide a glimpse into the composition of
residents in the area, pre-rezoning, post re-zoning and around the time of the co-working space
opening. Similarly, to gain insight on response of the real estate market in the immediate area,
DOB issued permits were reviewed from 2000 to present.
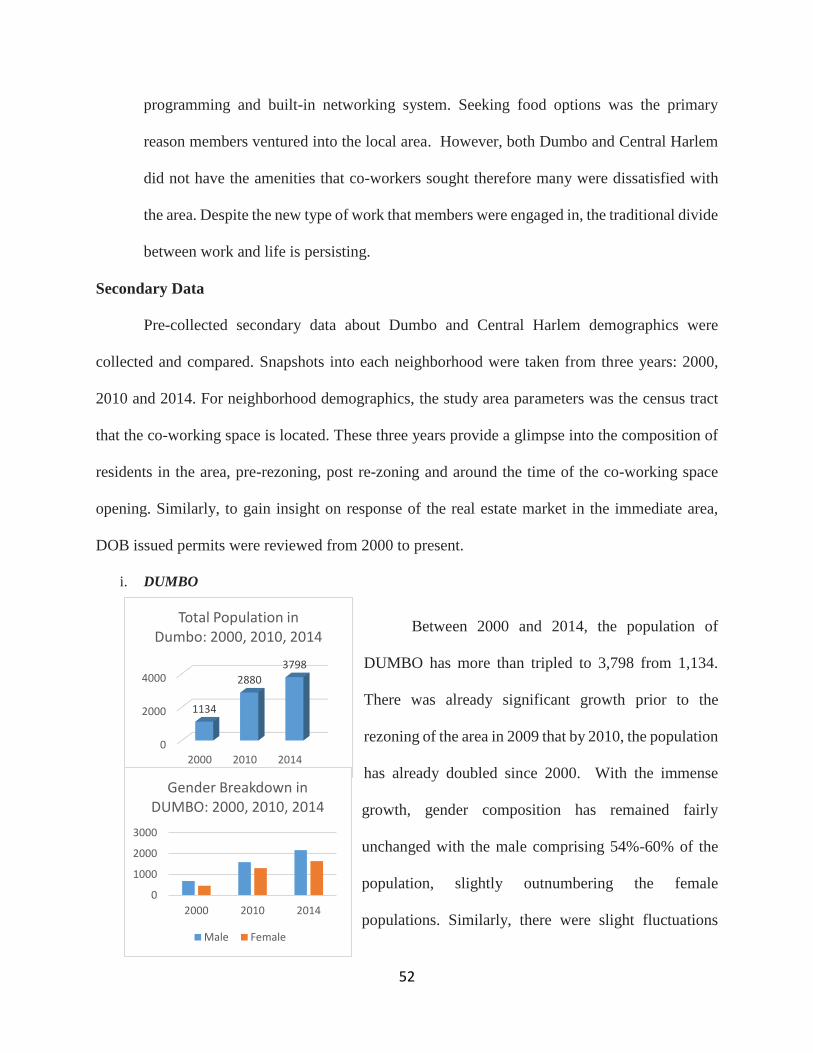
i. DUMBO
Between 2000 and 2014, the population of
DUMBO has more than tripled to 3,798 from 1,134.
There was already significant growth prior to the
rezoning of the area in 2009 that by 2010, the population
has already doubled since 2000. With the immense
growth, gender composition has remained fairly
unchanged with the male comprising 54%-60% of the
population, slightly outnumbering the female
populations. Similarly, there were slight fluctuations
0
2000
4000
2000 2010 2014
1134
2880
3798
Total Population in Dumbo: 2000, 2010, 2014
0
1000
2000
3000
2000 2010 2014
Gender Breakdown in DUMBO: 2000, 2010, 2014
Male Female

53
with the race and ethnic composition of DUMBO residents. While there was overall growth
among all the race and ethnic groups, the resident composition grew more homogenous
over time with the White population grew from about 67% to almost 80% of the population.
While rezoned for mixed-use developments, the residential population exploded in the
area, which had the largest impact on the income distribution among residents over the
study period. Median household incomes have nearly tripled since 2000, from $74,464 to
$204,205 in 2014. The area is the reigns as the most expensive neighborhood in Brooklyn
(Leon, 2015; Upadhye, 2012). There has been exponential growth of the number of
households with annual incomes greater than $200,000 while the number of all other
household income groups remained fairly consistent over the 14 year time span. Given the
clear correlation between income and educational attainment, DUMBO residents’
education attainment has increased over the
study period. The influx of residents in to the
neighborhood since 2000 have been highly
educated. In 2000, only about 62% of the over
25 years old portion of the population had a
bachelor’s degree or higher. By 2014, it is almost 80%.
$74,464
$163,147 $204,205
$-
$100,000
$200,000
$300,000
2000 2010 2014
Median HH Income in
Dumbo: 2000, 2010, 2014
0%20%40%60%80%
100%
White Black orAfrican
American
AmericanIndian and
Alaska Native
Asian NativeHawaiian andOther Pacific
Islander
Someother race
Two ormore races
Race in Dumbo: 2000, 2010, 2014
2000 2010 2014

54
While DUMBO has acquired a reputation for being a creative hub and home to the
New York Silicon Valley (Upadhye, 2012), the majority of residents still commute out of
the neighborhood to work. About 77% in 2014, took public transportation or some sort of
automobile to commute to work, compared to the 75% in 2000. While this may seem like
a slight difference in percentage, the drastic difference between the total populations
between the two years suggests that the new wave of residents is primarily working outside
of DUMBO. Conversely, a larger percentage of DUMBO residents seemed to live and
work in the neighborhood in 2000 than they did in 2014, 25% and 18% respectively. Mean
travel time to work for the over 25 years old working population rose from 30.8 minutes in
2000 to 34.1 minutes in 2014.
0
500
1000
2000 2010 2014
Household Income in DUMBO: 2000, 2010, 2014
Less than $10,000 $10,000 to $14,999 $15,000 to $24,999
$25,000 to $34,999 $35,000 to $49,999 $50,000 to $74,999
$75,000 to $99,999 $100,000 to $149,999 $150,000 to $199,999
$200,000 or more
0200400600800
100012001400
Less than 9thgrade
9th to 12thgrade, nodiploma
High schoolgraduate(includes
equivalency)
Somecollege, no
degree
Associatedegree
Bachelor'sdegree
Graduate orprofessional
degree
Education Attainment in DUMBO: 2000, 2010, 2014
2000 2010 2014

55
The real estate market in DUMBO changing. Overall, from 2007 to 2015, the
number of permits have been rising over the years, however there has been a shift building
typology. In 2007, about 10% of permits were for residential buildings. However, each
year, there has been more residential permits were issued. The turning point year is 2013
when residential permits made up 50% of total permits. Since then residential permits have
been the majority of permits. By 2015, about 65% of permits issued were for residential
buildings. With residential permits are growing to be a larger share of permits issued,
permits for other building uses have declined; from about 40% to 20%.
9%
3%
63%
12%
0%
13%10%
2%
65%
7% 6%11%
0%
10%
20%
30%
40%
50%
60%
70%
Automobile -alone
Automobile -carpool
Publictransportation
Walked Other means Worked athome
Commuting to Work from Dumbo: 2000, 2010, 2014
2000 2010 2014

56
1 2 3 4 5 6 7 8 9
0%
10%
20%
30%
40%
50%
60%
70%
0
50
100
150
200
250
300
350
400
2007 2008 2009 2010 2011 2012 2013 2014 2015
Building Permits Issued from 2007 - 2015 in DUMBO
# of Permits
# of Residential Permits
# of Non-Residential New Building, Earth Work, Foundation Permits
# of Residential New Building, Earth Work, Foundation Permits
% Residential Permits
% of Non-Residential NB,EW,FO Permits
% Residential NB,EW,FO Permits

57
ii. Central Harlem
Between 2000 and 2014, the overall population of Central Harlem grew slightly,
from 6,006 to 8,274. Already a residential area, the nearby rezoning of the nearby Fredrick
Douglas Blvd in 2003 reinforced the residential nature of Central Harlem with ground floor
commercial. Even with the population growth throughout the 14 years, the gender ratio has
remained consistent; 44% males and 56%
females. Central Harlem is fairly diverse.
Over the study time span, there had been
some fluctuations in the race composition of
Central Harlem, however, overall maintained
the same composition; consisting of about
50% Black/African American residents.
During the study period, the Central Harlem
percentage of White residents shrank from
20% to about 15% while the Asian
population rose to 7.6% from 1.6%. Perhaps
the biggest change within the 14-year time
6006
8434 8274
0
2000
4000
6000
8000
10000
2000 2010 2014
Total Population in Central Harlem: 2000, 2010, 2014
0
1000
2000
3000
4000
5000
2000 2010 2014
Gender Breakdown in Central Harlem: 2000, 2010, 2014
Male Female
0%
20%
40%
60%
White Black or African American American Indian and Alaska Native Asian Native Hawaiian and Other Pacific Islander Some other race Two or more races
Race in Central Harlem: 2000, 2010, 2014
2000 2010 2014

58
span is the rise in median household
income – it nearly quadrupled from
$14,103 to $59,782. There has been a
steady decrease in households with annual
incomes less than $10,000. The two
income brackets with the greatest growth
are households with annual incomes $75k to $99,999 and $100k to $149,999. There was
also the emergence of the households earning more than $150k. The number of households
with incomes less than $75k remained steady throughout the study period. This increase in
median income and the emergence of a middle and upper class in Central Harlem is aligns
with the educational attainment of Central Harlem residents. Over the course of 14 years,
the percentage of the over 25 years old population with at least a high school degree grew
from about 55% to 78.5% while the percentage with at least a bachelor’s degree more than
quadrupled from 5.3% to 23.3%. Central Harlem residents, on average, are attaining higher
education and earning more in 2014 than they did in 2000.
$14,103
$27,682
$50,782
$-
$10,000
$20,000
$30,000
$40,000
$50,000
$60,000
2000 2010 2014
Median Houshold Income in
Central Harlem: 2000, 2010, 2014
0
200
400
600
800
1000
2000 2010 2014
Household Income in Central Harlem: 2000, 2010, 2014
Less than $10,000 $10,000 to $14,999 $15,000 to $24,999
$25,000 to $34,999 $35,000 to $49,999 $50,000 to $74,999
$75,000 to $99,999 $100,000 to $149,999 $150,000 to $199,999
$200,000 or more

59
Despite the population growth and change in the income distribution, the commute
patterns of residents to work remained fairly consistent with about 90% of the population
work outside of Central Harlem. Commute times have reduced by 8 minutes, from
43minutes to 35minutes. There has actually been a decrease in the percentage of people
that work locally – dropping from 16.1% to about 12.9%.
10.3% 9.8%
61.2%
16.1%
2.6% 0.0%
9.2%2.6%
71.4%
10.1% 8.0%2.8%
0.0%
10.0%
20.0%
30.0%
40.0%
50.0%
60.0%
70.0%
80.0%
Automobile -Alone
Automobile -Carpool
Publictransportation
(includingtaxicab)
Walked Other means Worked athome
Communting to Work From Central Harlem: 2000, 2010, 2014
2000 2010 2014
0
500
1000
1500
2000
Less than9th grade
9th to 12thgrade, nodiploma
High schoolgraduate(includes
equivalency)
Somecollege, no
degree
Associatedegree
Bachelor'sdegree
Graduate orprofessional
degree
Educational Attainment in Central Harlem: 2000, 2010, 2014
2000 2010 2014
60
From 2004 to 2015, the real estate market in Central Harlem changed and
continuing to do so. Overall, the number of permits have remained steady while the
building use has shifted. In 2004, about 33% of all permits were for residential buildings.
In 2007, after several years of decline, residential permits picked up speed rising to about
82% of all permits issued for Central Harlem. Following the residential building trend, the
percentage of residential earthwork, new building, and foundation permits have also grown
from barely 1% to about 40% from 2004 to 2015. As residential buildings permits grow to
a larger permit share, other building uses are declining in permit share and in count.
Nonresidential earthwork, foundation and new building permits dropped from a high of
about 180 in 2006 to 25 in 2015.

61
0%
10%
20%
30%
40%
50%
60%
70%
80%
90%
100%
0
100
200
300
400
500
600
700
2004 2005 2006 2007 2008 2009 2010 2011 2012 2013 2014 2015
Building Permits Issued fom 2004 - 2015 in Central Harlem
# of Permits
# of Residential Permits
# of New Building (NB), Earth Work (EW), Foundation (FO) that isnt residential
# of Residentail that were NB, FO, EW
% Residential
% Non-residential NB,EW,FO
% Residential NB,EW,FO
62
Discussion
In both case studies there was a mismatch between the co-working space and its larger
community. While city planning rezoned each area, there was little follow up in policy to ensure
the districts were successful with the new zoning and new uses. As a result, members are content
with their respective co-working space however generally dissatisfied with the greater community.
Both WeWork Dumbo and TEEM Coworking have no difficulty attracting people to their
space – the issue is retaining members. Co-workers bring social capital and monetary capital to
communities and retaining them in the urban fabric will enrichen the area. Through targeted
rezoning, the city sets the goal for these mixed-used integrated districts however this does not
manifest in either of the case study areas. Currently, there is a clear separation of the day time
population of workers commuting in the neighborhood for work and a night time population that
are returning home. This segmentation of the two groups is based on how they utilize space in the
community. In both Dumbo and Central Harlem, there two populations are distinct with little
overlap.
Within the co-working spaces, both with their affordable pricing and consortium of people
are able to draw people to their space however many members are unlikely to stay beyond 6
months. Despite co-working spaces known for the social and networking aspects, members didn’t
seem to be taking advantage of their conglomeration effect – as most were focused on individual
work. At WeWork Dumbo, this individualistic focus could be perpetuated by the physical layout
and staffing issues whereas at TEEM, it could be the result of the space-centric service provider
approach rather than a curator of people (Merkel, 2015). Without meaningful relationships being
developed, members are not tied to the co-working space or the community. Another huge
contributing factor in the transient nature of the members is the neighborhood. At both sites, most

63
of the co-workers were commuting into the community for work. At TEEM, about 24% of
members live within a half hour commute compared to the 4% working out of WeWork Dumbo.
The greater percentage of co-workers living in closer proximity to TEEM could explain the greater
willingness of members to engage with the community. Already living and working in Central
Harlem, TEEM members are contemplating “playing” in the community. Time constraint is the
most common factor why members aren’t involved. But members are pursing recreational
activities elsewhere, presenting local organization the opportunity to increase outreach and
awareness allowing members to pursue the same recreational activities in Central Harlem, where
they already live and/or work. The disconnect between members and local organization indicate a
gap but also huge potential for the two to collaborate and further community development and
investment in the neighborhood. Conversely, 96% of the WeWork Dumbo population live outside
of DUMBO, commuting into the area for just work. While time constraint was the main driving
factor, there was also an expressed blatant disinterest in engaging with the community. Of the live-
work-play paradigm, WeWork Dumbo members are only loosely tied to DUMBO by the work
aspect. With minimal ties to the community, co-workers can come and go as they please, especially
with the flexible lease terms that the WeWork model offers. Ultimately for Central Harlem and
DUMBO to be the live-work-play communities that city planning hope for them to be, there needs
to be live and work options available to draw new residents and employees. But the final piece is
the play portion, there needs to be a wide range of accessible recreational activities to retain
residents and workers in the neighborhood beyond their typical commute patterns – creating a 24
hour community rather than a segmented population that takes shifts activating the neighborhood.
64
Conclusion and Recommendations
Successful neighborhoods don’t just spring up from nowhere. They are fostered,
developed and established. It is a collective effort from all stakeholders. Municipalities that want
sustainable long term economic development need to be involved and working with communities
throughout the process. There needs to be a comprehensive effort with all parties involved for
successful community and economic development.
In the case study neighborhoods, there was little community engagement; while there was
a lack of involvement from co-workers, there was also little outreach efforts from local
community organizations. This gap is problematic since it highlights the minimal communication
among community stakeholders, stagnating integration and community development. But it also
presents the opportunity for a holistic approach. A huge reason that many co-workers didn’t
participate in a local organization was their unfamiliarity with the existing organizations and the
area. Local groups can tap into the new population through outreach efforts. By presenting all the
different way to be involved or engage in the community, co-workers are more likely to work
and play in the area. With greater involvement, the currently transient co-working population
will likely be more invested in the surrounding neighborhood and, in turn, more likely to remain
in the area and continue stimulating economic development in the area. Co-working spaces and
local organizations should collaborate to grow a long-term population that will be integrated into
the community, rather than a 9-5 crowd that only interacts with the surroundings during lunch
hour. While this strengthens co-workers’ ties to the community, it is only two legs of the live-
work-play paradigm. Alternatively, community organizations and co-working spaces can also
approach the paradigm from the residential side and address the work and play portion of the
equation. By meeting the all three parts, there should be greater success in spurring sustainable

65
economic and community development. Co-working spaces, by drawing members within a
catchment area, can blur the segmented worker and resident populations while community
organizations can offer the recreational activities that residents were previously pursuing outside
of the community. Ultimately, this creates a community with the full live-work-play package.
Municipalities should also have an active role in creating or revitalizing communities.
While the rezoning process incorporates community needs and opinions in the public review
process, it shouldn’t end there. In the case studies, the city stepped away after the rezoning. This
allowed developers and property owners to utilize the land based on the highest and best use,
which turned out to be residential. The commercial overlays were not particularly effective in
Central Harlem due to the pre-existing commercial corridor and in Dumbo, residential
conversations and developments garnered higher rents/sale prices than alternative uses. Zoning,
in these scenarios, were suggestions. Municipalities should adopt a multi-pronged approach that
facilitate community’s goals – zoning to create the parameters and policy to reinforce. Examples
of policies include: greater financial incentive for developments and projects that further the
intended rezoning goals; requirement for a community benefits agreement for projects that do
directly align with the rezoning goals.
Ultimately, there needs to buy-in from local organizations, property owners/developers,
municipality officials and residents for the goals for the area. All stakeholders must be on the
same page with developers or new business owners understanding the community goals and how
their new business or organization fits into the greater picture.
While this research did shed some light on co-working spaces outside of the Manhattan
core, there were also some restrictions that limited the study. Given the time constraints, the first-
hand data collection was limited to one cold January and only two sites were studied. For further

66
understanding of the dynamics between co-working space users and their work community,
further data can be collected on more co-working spaces outside of the CBD over a longer span
of time to capture a larger scope of co-workers’ experiences and perceptions. Since much of the
literature, including this one, focuses on the co-working space and its users, further investigation
on community perceptions on the co-working space will enrich the research on the field. Future
work can delve into how local communities perceive and interact with co-working spaces and
their members. It will provide greater insight as to how neighborhoods can tap into the potential
of a new worker population surge.
Co-working space offices is new typology that addresses many of the technological,
demographic and workplace trends. Flexible and evolving in its manifestation, co-working
spaces are able to adapt to their neighborhood and member population. As the sharing economy
has grown, co-working spaces have acquired a sense of “coolness” and clout. Most of the
existing literature and popular media regarding co-working has been positive – noting all the
benefits to participants and the urban landscape. However, while co-working addresses many
issues, it is not a solve-all solution for communities. Most of the literature have evaluated co-
working in a very insular environment without much context of the surrounding area. Based on
my research, it seems that co-working outside of CBDs have little impact. With little tying co-
workers to the neighborhood, there is littler personal or social investment in the area creating a
transient working population. I propose that co-working spaces work with local communities and
organizations to be mutually beneficial. Co-working spaces would be stabilized with consistent
long-term members; this would make programming easier to tailor and more successful.
Communities would benefit with involved co-workers that work and play in the area, which
means greater local spending. Another subset of the population will be more integrated and

67
enthusiastic about the neighborhood. Municipalities would benefit as their rezoning goals for the
area and city at-large will be achieved.
Co-working spaces have a great deal of potential to change and revitalize communities,
however they are not the only variable. The other variables are community and municipal input
and engagement or else co-working will simply be another generic building in the urban
landscape.
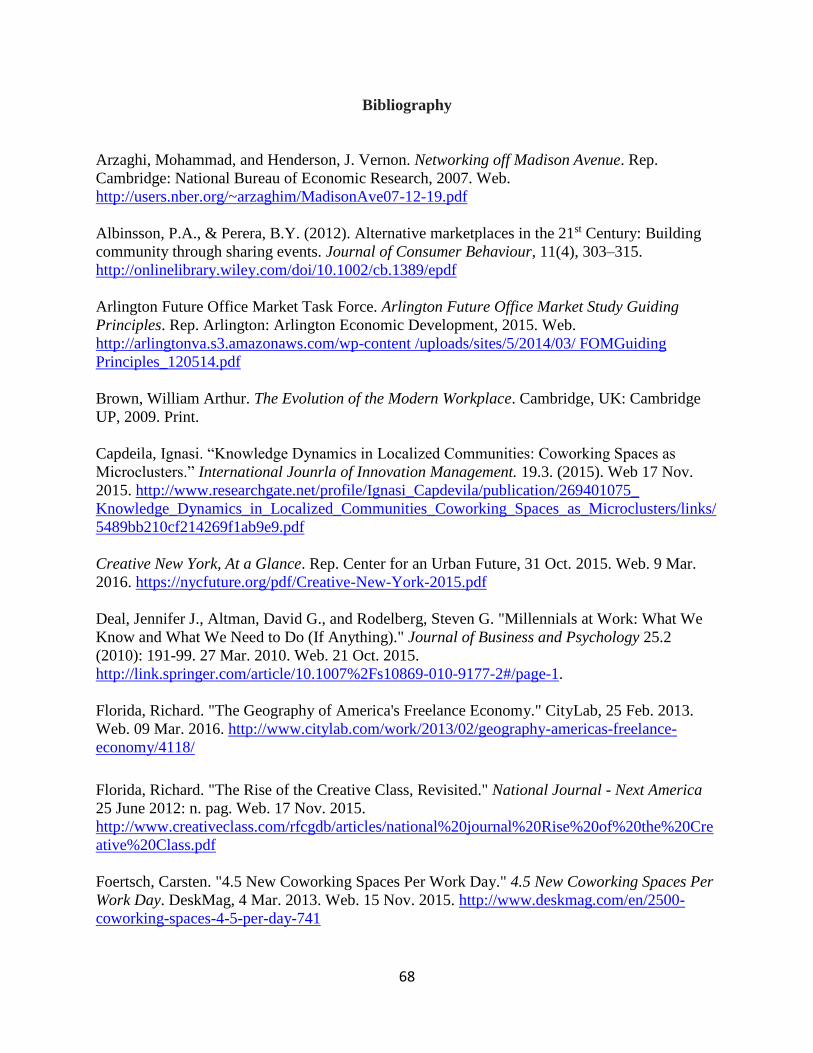
68
Bibliography
Arzaghi, Mohammad, and Henderson, J. Vernon. Networking off Madison Avenue. Rep.
Cambridge: National Bureau of Economic Research, 2007. Web.
http://users.nber.org/~arzaghim/MadisonAve07-12-19.pdf
Albinsson, P.A., & Perera, B.Y. (2012). Alternative marketplaces in the 21st Century: Building
community through sharing events. Journal of Consumer Behaviour, 11(4), 303–315.
http://onlinelibrary.wiley.com/doi/10.1002/cb.1389/epdf
Arlington Future Office Market Task Force. Arlington Future Office Market Study Guiding
Principles. Rep. Arlington: Arlington Economic Development, 2015. Web.
http://arlingtonva.s3.amazonaws.com/wp-content /uploads/sites/5/2014/03/ FOMGuiding
Principles_120514.pdf
Brown, William Arthur. The Evolution of the Modern Workplace. Cambridge, UK: Cambridge
UP, 2009. Print.
Capdeila, Ignasi. “Knowledge Dynamics in Localized Communities: Coworking Spaces as
Microclusters.” International Jounrla of Innovation Management. 19.3. (2015). Web 17 Nov.
2015. http://www.researchgate.net/profile/Ignasi_Capdevila/publication/269401075_
Knowledge_Dynamics_in_Localized_Communities_Coworking_Spaces_as_Microclusters/links/
5489bb210cf214269f1ab9e9.pdf
Creative New York, At a Glance. Rep. Center for an Urban Future, 31 Oct. 2015. Web. 9 Mar.
2016. https://nycfuture.org/pdf/Creative-New-York-2015.pdf
Deal, Jennifer J., Altman, David G., and Rodelberg, Steven G. "Millennials at Work: What We
Know and What We Need to Do (If Anything)." Journal of Business and Psychology 25.2
(2010): 191-99. 27 Mar. 2010. Web. 21 Oct. 2015.
http://link.springer.com/article/10.1007%2Fs10869-010-9177-2#/page-1.
Florida, Richard. "The Geography of America's Freelance Economy." CityLab, 25 Feb. 2013.
Web. 09 Mar. 2016. http://www.citylab.com/work/2013/02/geography-americas-freelance-
economy/4118/
Florida, Richard. "The Rise of the Creative Class, Revisited." National Journal - Next America
25 June 2012: n. pag. Web. 17 Nov. 2015.
http://www.creativeclass.com/rfcgdb/articles/national%20journal%20Rise%20of%20the%20Cre
ative%20Class.pdf
Foertsch, Carsten. "4.5 New Coworking Spaces Per Work Day." 4.5 New Coworking Spaces Per
Work Day. DeskMag, 4 Mar. 2013. Web. 15 Nov. 2015. http://www.deskmag.com/en/2500-
coworking-spaces-4-5-per-day-741
69
Foertsch, Carsten. "1st Global Coworking Survey, The Results Part Two: The Coworker's
Profile." The Coworker's Profile. DeskMag, 29 Dec. 2010. Web. 18 Nov. 2015.
http://www.deskmag.com/en/the-coworkers-global-coworking-survey-168
Foertsch, Carsten, and Remy Cagnol. "The History Of Coworking In A Timeline." The History
Of Coworking In A Timeline. DeskMag, 2 Sept. 2013. Web. 09 Mar. 2016.
http://www.deskmag.com/en/the-history-of-coworking-spaces-in-a-timeline
Gandini, Alessandro. “ The Rise of Coworking Spaces: A Literature Review.” Ephemera –
Theory & Politics in Organization 15.1 (2015): 193-205. Web. 15 Feb. 2016.
http://www.ephemerajournal.org/sites/default/files/pdfs/contribution/15-1gandini.pdf Gerson, Kathleen. Moral Dilemmas, Moral Strategies, and the Transformation of Gender. The
Kaleidoscope of Gender, 2011, p. 399.
Golinsku, Sophie & Moseback, Hendrik. “The Rise of the Creative Class... and how it’s
transforming work, leisure, community and everyday life Richard Florida.” Universität Leipzig.
Saxony, Germany. 12 August 2010. http://www.uni-leipzig.de/~sozio/mitarbeiter/m19/
content/dokumente/555/Creative_Class___Golinski_Mosebach.pdf
Greenstone Miller, Jody, and Matt Miller. "The Rise of the Supertemp." Harvard Business
Review, 01 May 2012. Web. 09 Mar. 2016. https://hbr.org/2012/05/the-rise-of-the-supertemp
Hamari, Juho; Sjoklint, Mimmi; and Ukkoen, Antti. (2015). The Sharing Ecnomy: Why People
Participate in Collaborative Consumption. Journal of the Asociation for Information Science and
Technology. http://www.researchgate.net/publication/255698095_The_Sharing_Economy_Why
_People_Participate_in_Collaborative_Consumption
Henderson, Richard. Industry Employment and Output Projections to 2020. Rep. Washington,
DC: U.S. Bureau of Labor Statistics, 2012. Web.
http://www.bls.gov/opub/mlr/2012/01/art4full.pdf.
Horowitz, Sara. "Freelancers in the U.S. Workforce : Monthly Labor Review: U.S. Bureau of
Labor Statistics." Freelancers in the U.S. Workforce. U.S. Bureau of Labor Statistics, Oct. 2015.
Web. 02 Nov. 2015.
Hracs, B. J and Massam, B. H. (2008). Places/Spaces of Celebration and Protest: Citizenship,
civic conversations and the promotion of rights and obligations. Canadian Journal of Urban
Research. Vol. 17 (1) pp. 63–81.
Insch, A., & Florek, M. (2008). A great place to live, work and play. Journal of Place
Management and Development, 1(2), 138-149.
http://dx.doi.org.ezproxy.cul.columbia.edu/10.1108/17538330810889970
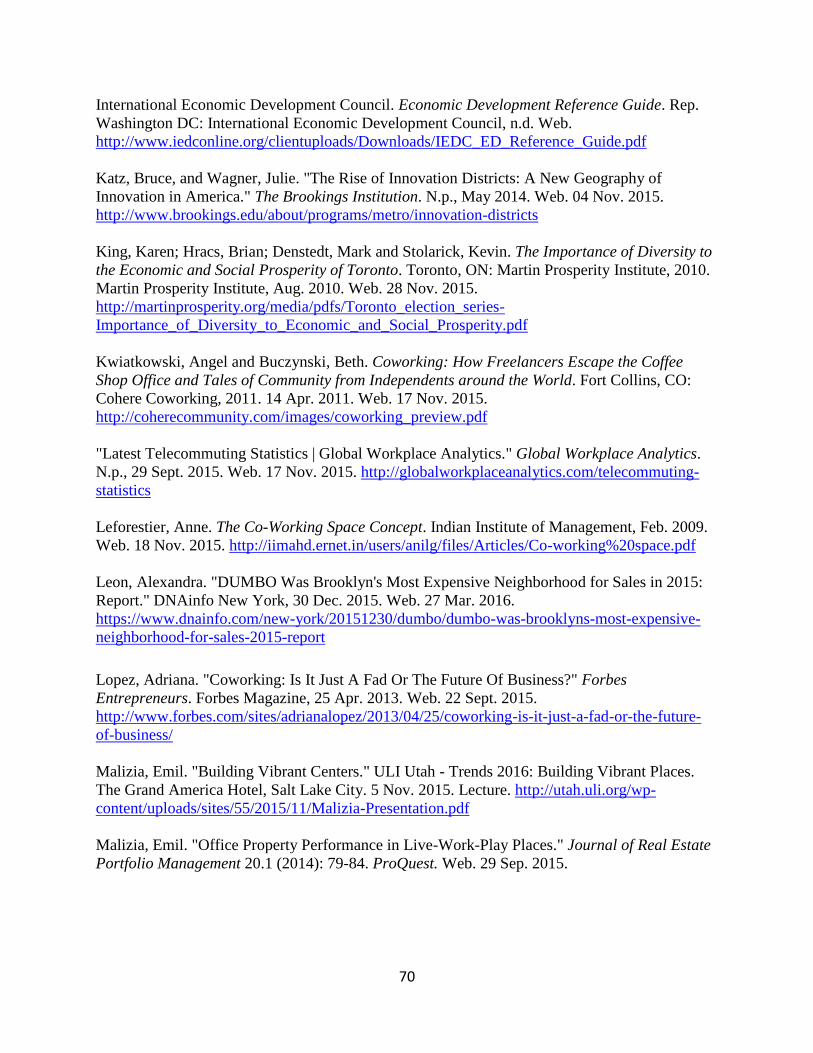
70
International Economic Development Council. Economic Development Reference Guide. Rep.
Washington DC: International Economic Development Council, n.d. Web.
http://www.iedconline.org/clientuploads/Downloads/IEDC_ED_Reference_Guide.pdf
Katz, Bruce, and Wagner, Julie. "The Rise of Innovation Districts: A New Geography of
Innovation in America." The Brookings Institution. N.p., May 2014. Web. 04 Nov. 2015.
http://www.brookings.edu/about/programs/metro/innovation-districts
King, Karen; Hracs, Brian; Denstedt, Mark and Stolarick, Kevin. The Importance of Diversity to
the Economic and Social Prosperity of Toronto. Toronto, ON: Martin Prosperity Institute, 2010.
Martin Prosperity Institute, Aug. 2010. Web. 28 Nov. 2015.
http://martinprosperity.org/media/pdfs/Toronto_election_series-
Importance_of_Diversity_to_Economic_and_Social_Prosperity.pdf
Kwiatkowski, Angel and Buczynski, Beth. Coworking: How Freelancers Escape the Coffee
Shop Office and Tales of Community from Independents around the World. Fort Collins, CO:
Cohere Coworking, 2011. 14 Apr. 2011. Web. 17 Nov. 2015.
http://coherecommunity.com/images/coworking_preview.pdf
"Latest Telecommuting Statistics | Global Workplace Analytics." Global Workplace Analytics.
N.p., 29 Sept. 2015. Web. 17 Nov. 2015. http://globalworkplaceanalytics.com/telecommuting-
statistics
Leforestier, Anne. The Co-Working Space Concept. Indian Institute of Management, Feb. 2009.
Web. 18 Nov. 2015. http://iimahd.ernet.in/users/anilg/files/Articles/Co-working%20space.pdf
Leon, Alexandra. "DUMBO Was Brooklyn's Most Expensive Neighborhood for Sales in 2015:
Report." DNAinfo New York, 30 Dec. 2015. Web. 27 Mar. 2016.
https://www.dnainfo.com/new-york/20151230/dumbo/dumbo-was-brooklyns-most-expensive-
neighborhood-for-sales-2015-report
Lopez, Adriana. "Coworking: Is It Just A Fad Or The Future Of Business?" Forbes
Entrepreneurs. Forbes Magazine, 25 Apr. 2013. Web. 22 Sept. 2015.
http://www.forbes.com/sites/adrianalopez/2013/04/25/coworking-is-it-just-a-fad-or-the-future-
of-business/
Malizia, Emil. "Building Vibrant Centers." ULI Utah - Trends 2016: Building Vibrant Places.
The Grand America Hotel, Salt Lake City. 5 Nov. 2015. Lecture. http://utah.uli.org/wp-
content/uploads/sites/55/2015/11/Malizia-Presentation.pdf
Malizia, Emil. "Office Property Performance in Live-Work-Play Places." Journal of Real Estate
Portfolio Management 20.1 (2014): 79-84. ProQuest. Web. 29 Sep. 2015.

71
Merkel, Janet. "Coworking in the City." Coworking in the City. Ephemera - Theory & Politics in
Organization, 1 Feb. 2015. Web. 28 Mar. 2016.
http://www.ephemerajournal.org/contribution/coworking-city
Morgan, Jacob. "The Evolution Of Work." Forbes. Forbes Magazine, 10 Sept. 2013. Web. 21
Oct. 2015. http://www.forbes.com/sites/jacobmorgan/2013/09/10/the-evolution-of-work/
Moriset, Bruno. Building new places of the creative economy. The rise of coworking spaces.
2013. https://halshs.archives-ouvertes.fr/halshs-00914075/document
PricewaterhouseCooper. "The Sharing Economy." The Sharing Economy (2015): 1-35.
PricewaterhouseCoopers. Web. 15 Nov. 2015. https://www.pwc.com/CISsharing
SHRM Foundation. What’s Next: Future Global Trends Affecting Your Organization Evolution
of Work and the Worker. Rep. New York: Economist Intelligence Unit, 2014. Web.
https://www.shrm.org/about/foundation/shapingthefuture/documents/2-
14%20theme%201%20paper-final%20for%20web.pdf
Spinuzzi, Clay. "Working Alone Together: Coworking as Emergent Collaborative Activity."
Journal of Business and Technical Communication 26.4 (2012): 399-441. Web. 17 Nov. 2015.
Ross, Peter and Ressia Susan. “Neither office nor home: Coworking as an emerging workplace
choice.” Employment Relations Record, 15.1 (2015): 42-57.
http://search.informit.com.au/documentSummary;dn=237909907440429;res=IELBUS
Salovaara, Perttu. "A Brief History of Shared Workspace | New Worker Magazine." New Worker
Magazine, 16 July 2014. Web. 09 Mar. 2016. http://newworker.co/mag/brief-history-shared-
workspace/
Smith, Katherine T. "Work-Life Balance Perspectives of Marketing Professionals in Generation
Y." Services Marketing Quarterly 31.4 (2010): 434-47. Web. 21 Oct. 2015.
Spreitzer, Gretchen, Bacevice, Peter and Garrett, Lyndon. "Why People Thrive in Coworking
Spaces." Harvard Business Review. N.p., 13 May 2015. Web. 22 Sept. 2015.
https://hbr.org/2015/05/why-people-thrive-in-coworking-spaces
Torrance, Jack. "Management Today." 'Our Biggest Competitor Is Work Itself' Management
Today, 9 Jan. 2015. Web. 07 Mar. 2016.
http://www.managementtoday.co.uk/news/1328586/our-biggest-competitor-work-itself-adam-
neumann-wework/
Upadhye, Janet. "DUMBO Still Most Expensive Brooklyn Neighboorhood." DNAinfo New
York24, 24 July 2012. Web. 27 Mar. 2016. https://www.dnainfo.com/new-
york/20120724/dumbo/dumbo-still-most-expensive-brooklyn-neighboorhood

72
Vaccaro, Adam. "Coworking Funding Stays Alive in Economic Development Push."
Boston.com, 7 July 2014. Web. 02 Dec. 2015.
http://www.boston.com/business/news/2014/07/07/coworking-funding-stays-alive-economic-
development-push/XkUzx5XQWsAaijpDn5ZIRP/story.html
U.S. Department of Commerce. Service Industries and Economic Performance. Rep.
Washington DC: n.p., 1996. Print.
http://www.esa.doc.gov/sites/default/files/serviceindustries_0.pdf

73
Appendix

74
CO-WORKING SPACE NEIGHBORHOOD PERCEPTION SURVEY
Age: Gender:
Home Zip Code: Race/Ethnicity:
Highest Level of Education:
1) What industry sector do you work in?
Agriculture Construction Manufacturing Wholesale/Retail
Transportation Information Financial Services Business Services
Arts/Entertainment Hospitality Government Education/Healthcare
Other _________________________
2) What is your employment status?
Contracted Full-Time Contracted Part-Time Independent Freelancer
Self-Employed Other________________
3) What is your annual income?
>$10,000 $10k-$14,999 $15k-$24,999 $25k-$34,999
$35k-$49,999 $50k-$74,999 $75k-$99,999 $100k-$149,999
$150k-$199,999 $200k+ Do not wish to disclose
4) How long is your commute to TEEM? ____________________________________
4a) Please check all modes of transportation that you use: Car Train Bus Bike Walk
5) Is TEEM your primary place of work? Yes No
5a) If not, where is your primary place of work? ___________________________
6) Are you involved in a community organization close to TEEM? Yes No
6a) If you are involved in one, how much time do you dedicate to it each week?
<1hr 1-2hr 2-4hr 4-6hr 6-8hr 8-10hr >10hr
6b) If you’re not involved in one, what factors inform your decision? (select all that apply)

75
Too much of a time commitment Doesn’t fit into my schedule
Venues are inconveniently located Organizations didn’t feel welcoming
Organizations unaligned w/ my interests I don’t see a need to engage
Other __________________________
7) How long have you worked at TEEM? <6mo 6mo-1yr 1yr-2yr 2yr-3yr >3yrs
8) How long do you plan to continue working at TEEM? <6mo 6mo-1yr 1yr-2yr 2yr-3yr >3yrs
9) Why did you choose to work at this location? (select all that apply)
Familiarity with the Area Price Neighborhood Aesthetics
Interior Design Commute Time People w/in the space
Neighborhood Amenities Other _______________
Neighborhood Interactions Scale
How often do you participate in the following activities
in the neighborhood? Never Often Always
10) Dine out/buy food 1 2 3 4 5
11) Shop 1 2 3 4 5
12) Run errands 1 2 3 4 5
13) Spend time outside of work 1 2 3 4 5
Neighborhood Perceptions Scale
How do you feel about the number of the below
amenities offered in the neighborhood? Too Many
The Right
Amount Too Few
14) Restaurants/Eating Out Options 1 2 3
15) Convenience Stores 1 2 3
16) Retail Options 1 2 3
17) Parks and Green Space 1 2 3
Neighborhood Integration Scale
Not at all Often Extremely
18) How well do you know the neighborhood? 1 2 3 4 5
19) How integrated do you feel in the community? 1 2 3 4 5
20) Overall, how satisfied are working in this
neighborhood? 1 2 3 4 5
21) Overall, how safe do you feel in this
neighborhood? 1 2 3 4 5

76
22) What do you like most about this neighborhood? _______________________________________
23) What do you like the least about this neighborhood? ____________________________________
24) If there was one thing that you could change about the neighborhood, what would it be?
________________________________________________________________________________