the role of china in regional south-south trade in...
TRANSCRIPT

1
The Role of China in Regional South-South Trade in Asia-Pacific: Prospects for
industrialization of the low-income countries
M. Shafaeddin*
Paper presented at
the conference on ‘The future of trade relations in the global South’, organized by
Frederick S. Pardee Centre
for the Study of the Longer-Range Future, Boston University
23-24 September 2010
Abstract
The author provides an alternative approach for the rationale for South-South trade as a vehicle for industrialization and development of developing countries in Asia-Pacific region as the literature on this issue is not satisfactory. Further, refuting the “de-coupling” thesis—that is, the East Asian countries are decoupled from the business cycle in developed countries—he analyses the merits and shortcomings of China’s regional trade with its partners in the region. Moreover, considering the growing weight of China in the global production network and international trade he proposes policies for the future of industrialization and development of the partner countries for strengthening the role of China as a growth “pole”. He suggest, inter alia, the need for industrial collaboration among the low-income countries, which benefit less than others from the dynamics of the Chinese economy as a “hub” complemented by adjustment assistance by China and NIEs. He also proposes technological cooperation among other main partner countries which are involved in production sharing in a limited number of electric and electronic products for exportation to the third markets in developed countries. The aim is to upgrade their industrial structure, and reduce their vulnerability to changes in the economic strategy of China and the business cycles in developed countries.
---------------------------------------------------------------------------------------------------------------------------
* The author is a development economist affiliated with the Institute of Economic Research, University of Neuchatel, Switzerland. He is the former head of the Macroeconomics and Development Policies Branch, UNCTAD, and author of many articles on industrialization and development policies in international journals. His books include Trade policy at the Crossroads, Recent Experience of Developing Countries (Macmillan, 2005) and Competitiveness and Development (Anthem Press, forthcoming). This paper is developed mainly based on the earlier work of the author (Shafaeddin, 2008). The author can be contacted at: [email protected] and [email protected].

2
I. Introduction
China has been the most dynamic economy during the last couple of decades. Its rapid GDP
growth and MVA has also been accompanied by a fast expansion of its foreign trade and
rapid integration into the world economy. It has become the third largest economy, after the
USA and Japan, in terms of GDP and second largest global exporter. Furthermore, it has been
functioning as a “hub” for the expansion of regional trade in the Asia-Pacific region, thus
increasing its importance as a source of growth for its neighbouring economies in East Asia
even further (Kozluk and Mehrotra, 2008). Through its expansion of processing trade,
production sharing and assembly operation in manufacturing products, it has exported its final
products mainly to the third markets in developed countries. Others argue that it has been
playing an increasing role as an independent source of growth for the East Asian countries
(Haltmaier et al., 2007). Nevertheless, while China has attracted imports of raw materials
from some of the low-income countries, its regional trade has been concentrated on
manufactured goods with more industrial countries of the region such as Asian NIEs (newly
industrialized economies). In other words, while China’s expansion of international trade has
had mainly complementarities effects with these countries, it has had some competitive
effects on low-income countries of the region (Shafaeddin, 2004).
The recent global economic crisis led to negative growth in developed country
markets. Yet, China has recovered more quickly than the industrial countries in terms of
growth in GDP, MVA and international trade.1 Some have even argued that China and the
East Asian countries are being decoupled from the developed countries (Anderson, 2007;
Economist, 2007; Bergsten, 2008). Some others have argued that “…at its current pattern of
domestic spending, China is not a good substitute for the USA and the EU markets for East
Asian DEEs [East Asian Developing and Emerging Economies]” (Akyüz, 2010:8).

3
What distinguishes China from other large economies is its rapid growth rate not only
in output but also in international trade. Considering the growing weight of the country in
international trade and global and regional production network, we will try to gauge whether
in the future China can act primarily as a “regional pole industrialization and growth” rather
than a “hub”. In other words, to what extent, and how, the dynamics of economic change in
China (as an “industrial pole”) can promote industrialization and development of the countries
of the region, particularly the low-income ones, through expansion of South-South trade. We
will also discuss whether market forces alone will be sufficient for China’s economy to spread
growth through a sort of “flying geese” pattern to low-income countries of the region, or it
requires deliberate policy measures for the purpose not only by China, but also by low-income
countries themselves through industrial collaboration.
To do so, we will first review the literature on South-South (S-S) trade in section II
before presenting an alternative theoretical framework in section III. Subsequently, in sections
IV and V the economic dynamism of China will be explained in order to critically analyze its
role as a regional industrial pole. Section VI is devoted to the limited role of market forces in
the future expansion of China’s regional trade with low-income countries. Section VII will
refer to implications for the future by making proposals for taking proactive policy measures
to extend regional cooperation beyond trade agreements in the future to stimulate
industrialization of the countries of the region. The final section will conclude the study.
II: The literature on the rationale for South-South trade
Cooperation among developing countries for the expansion of South-South trade and regional
trade agreements (RTAs) has been subject to controversy in the literature between
neoclassical/neo-liberal economists and their opponents. The proponents of universal free
trade have argued against discriminatory trade agreements, in general, and FTAs among

4
developing countries for the expansion of S-S trade, in particular. For example, it has been
argued that regional integration among developing countries would result in diversion of
some trade from low-cost to high-cost producers and would involve welfare costs, so it is
undesirable and unconvincing (Viner, 1950; Greenaway and Milner, 1990:1). Corden (1993:
457 & 459) goes even further, arguing that developing countries will be far better off if they
liberalize their trade regime “unilaterally in a non-discriminatory fashion” rather than
targeting markets in the South. Some others argue that RTAs between the South and North are
more advantageous than RTAs among developing countries (World Bank, 2000; Moen, 1998;
Subramanian and Tamirisa, 2001); that “South-South trade does not clearly have a vast
development potential”, as the theory of comparative advantage would indicate that “North-
South trade would achieve higher gains” and “the potential for trade based on economies of
scale among relatively small and poor countries of the South is uncertain” (Kowalski and
Shepherd, 2006:10).
However, inefficiency of regionalization has been disproved empirically (Ng and
Yeats, 2003; Baier, Bergstrand and Vidal, 2007); regionalism has trade creation effects not
only for members but also for trade with third parties (Cernat, 2003).
The neo-liberal views against S-S trade are based on their ideological bias in favour of
universal free trade, which is, in turn, based on the static version of the theory of comparative
cost advantage. This theory is based, further, on hypothetical and unrealistic assumptions,
including full employment of resources, availability of the same technology to all countries,
independence of present and future costs of production, as well as the lack of influence of
experience on the production cost, the lack of external economies, atomistic units of
production, constant returns to scale, and the lack of risk and influence of power in trade. The
opponents of South-South trade do not take into account the characteristics of developing
countries, such as underemployment of resources and their lack of technological capabilities;

5
existence of scale economies in many manufacturing industries, and the interdependence of
present and future costs.
List (1856) was among the first to challenge the classical “theory of exchangeable
value” (universal free international trade) as he argued that trade was a means to enhancing
“productive power” – not an aim per se (Shafaeddin, 2005c). In the same context, contrasting
neo-classical theorists, Kaldor (1972) suggested that developing countries should be
concerned mainly with promoting “creative efficiency” (growth and development) rather than
allocative efficiency, (i.e., allocation of given and “fully employed” resources among different
activities efficiently) which is the concern of the static theory of comparative cost advantage.
In other words, they should be concerned with attaining dynamic comparative advantage for
the sake of promoting “creative efficiency”. However, to attain dynamic comparative
advantage requires actions by the government as it will not be attained automatically through
the operation of market forces alone (Cline, 1983; Amsden, 1989; Shafaeddin, 2005a and
2005b).
List (1856) also introduced, inter alia, the idea of regional integration in his proposal
for German unification and cooperation among European countries, which eventually led to
the signature of the Treaty of Rome in 19582. In the early 1950s, Raul Prebisch provided the
strongest dynamic argument for regional integration in developing countries in the context of
his theory of “collective import substitution” for industrialization and upgrading of the
industrial structure3 (ECLA, 1950; Prebisch, 1984; Shafaeddin, 2005a:151-153).
For many years, following the initial ideas of Prebisch, arguments in favour of S-S
trade centred mainly on the issues of small size of the domestic market, economies of scale,
problems of access to developed country markets (UNCTAD, 1986:10-11; Agatiello, 2007) or
a slowdown in growth rates of developed-country economies thus growing potential for S-S
trade expansion (South Centre, 1996: ix-xiii). Some elements of these arguments are no

6
longer valid. For example, access to markets of the North has improved considerably.
Moreover, the experience of 1960s and 1970s has shown that S-S trade will not necessarily
expand, even when regional preferential or free trade agreements are signed among a number
of developing countries (de Melo and Panagariya, 1993:14-15 and chapters 8 and 9).
One argument in favour of S-S trade is that trade among equal partners will have a
positive influence on the net barter terms of trade (Sarkar and Singer, 1991). Another is that
too much reliance on trade with the North will increase vulnerability and risks of dependence
on trade (Hirschman, 1968). But, it should be noted that geographical diversification would be
possible only to the extent that alternative sources of supply are available in the South; the
question is “how” alternative sources of supply can be developed.
In the recent era of globalization, some scholars attribute the revival of regionalism in
the 1990s to disappointment by the United States at slow progress in Uruguay Round
negotiations (Bhagwati, 1993), and, more recently in the Doha Round, to the lack of
development dimensions in multilateral institutions and to weaknesses in the international
trading system (UNCTAD, 2007a: 40-45 and chapter VI; Kowai and Wingaraja, 2007: 8).
Others regard regionalization as a possible option for countries that risk exclusion, or
marginalization, from the growth dynamics of globalization (Oman, 1994). Another argument
is that N-S plurilateral and bilateral agreements can limit policy space of developing countries
because of the inclusion of “WTO-plus” conditions and “Singapore issues”, in these
agreements; that the approved agreements have not been fully respected by developed
countries; and that “post-modern” hidden protectionist “backslidings such as antidumping
practices are still present even in advanced North-South or East-West RTAs” (Cernat and
Laird, 2007). By contrast, S-S trade agreements do not limit policy space of the partners
(UNCTAD, 2007a: 54-64 and chap. IX). Unfulfilled expectations from N-S RTAs, such as

7
NAFTA, is another reason provided (Gallagher and Zarsky, 2007; Shafaeddin and Pizarro,
2010).
Although the above-mentioned “defensive” arguments are valid, they are not
necessarily arguments in favour of S-S regionalism or S-S trade. Even if it is proved desirable
theoretically, under what conditions and through what mechanism would be it beneficial to
industrialization and development of the partner countries particularly low-income ones?
These countries, have, in fact, benefited less from regional integration than those with a more
diversified production structure (UNCTAD, 2007a: 41; xxi).
If economic development is the key objective, in order to benefit from S-S
regionalism, should a country develop first before integrating regionally, rather than using
regional integration and S-S trade as a vehicle for industrialization and development? Should
it wait until it is developed and conditions for intra-industry trade prevail? The “normative”
aspect of S-S regionalism for the expansion of S-S trade as a means of industrialization
requires a more solid ground than the analysis of the “positive economics” of S-S regionalism
and trade.
III. An alternative conceptual framework
Why and how can S-S regional trade work as a vehicle for industrialization and development?
The rationale for S-S trade in general can be based on a combination of four main elements:
an extension of the “vent for surplus theory”; dynamic comparative advantage; scarcity of
resources needed for industrialization and development; and “division of labour” and
specialization.
A developing country possesses some potential surplus productive capacity, which can
be mobilized for producing additional goods for export without shifting resources away from
production for the domestic market (Myint, 1958), or one can add, from domestic

8
consumption and exports to the North. This is the essence of the “vent for surplus theory”
(ibid.). In theory, international trade can provide effective demand and employment for the
army of unemployed labour through the expansion of supply of products for which domestic
demand is insufficient, provided complementary factors of production were not scarce.
In neoclassical theory, trade liberalization, in addition to trade with the North, could
provide the necessary effective demand leading to specialization and division of labour. Yet
the experience of the last quarter century indicates that even when trade liberalization has led
to export expansion in lower-income countries, it has often resulted in deindustrialization, and
unemployment. It has also led to specialization based on natural-resource-based industries
and/or assembly operations, in line with static comparative advantage rather than to upgrading
of the industrial structure (Shafaeddin, 2006a). The North will not provide effective demand
for high-cost new products of a developing country that is at the early stages of
industrialization. The experience of successful industrializers indicates that creating supply
capabilities is a prerequisite for export expansion, intra-industry and inter-industry trade
(Amsden, 1989; Malhotra, 2006; Shafaeddin, 2006b). It requires following the principle of
dynamic comparative advantage.
The potential surplus capacity of a developing country would not, however, be turned
into actual production capacity because of scarcity of the complementary resources necessary
for industrialization such as skilled labour, finances, technology, organization back-up
services, entrepreneurship, and, more importantly, decision-making capabilities of the
government machinery (Hirschman, 1958).
Foreign direct investment by transnational corporations (TNCs) of the industrial
countries can, in theory, remedy some of the scarcity problems and act as a channel for
exports to developed countries. However, foreign direst investment (FDI) has a number of
limitations in deepening industrialization and upgrading of the industrial structure. First, the

9
experience of the last quarter century demonstrates that lower-income countries in particular
encounter difficulties in attracting FDI in the industrial sector because of their low capabilities
and scarcity of complementary factors of production. Second, the interests of TNCs—which
is to earn profits—are different from those of a host developing country which are, or are
supposed to be, industrialization and development. Even when TNCs contribute to export
expansion, it is basically in assembly operations and resource-based activities that are
governed by static comparative advantage of the host country (Lall, 2004). The experience of
Mexico in this respect is telling (Gallaher and Shafaeddin, 2010; Pizarro and Shafaeddin,
2010). Third, TNCs’ contribution to development of the host country would depend on the
extent to which these firms are managed and regulated by the government of the host country
as well as capabilities of their domestic firms. The policy space of developing countries has
become, however, limited by international trade and investment rules and bilateral trade
agreements and arrangements.
To remedy the scarcity problem, instead of relying on trade to lead to division of
labour and specialization, it should be the other way round. That is, concerted effort is needed
to achieve the division of labour and specialization in production, through industrial
collaboration and cooperation for the provision of the necessary back-up services. FTAs or
preferential tariff agreements can facilitate, inter alia, the S-S flow of trade in products that
are already being produced, yet they are insufficient to promote industrialization.
To do so, three policy measures are required. First, industrial collaboration and
production sharing for division of labour for supply capacity creation, production of new
“industrial” goods and, or, upgrading of the industrial structure, in accordance with dynamic
comparative advantage. Each country would be allocated the production of particular parts
and components for production of a product, the output of which would be exchanged with
other countries or would be sent to another country for assembly. At the same time, each

10
country may be engaged in assembly operations, or production of a final product. In this way,
both the scarcity problem and the “effective demand” constraint would be remedied. Although
for a while, high cost products would be exchanged, this would be only an accounting issue as
long as bilateral trade or the trade balance of each country with its partners is balanced. The
result would be the creation of employment and income. As industrialization proceeds, the
cost of production would decline gradually due to learning-by-doing, experience, internal and
external economies of scale and increasing return, which are characteristics of manufacturing
(Young, 1928).
Of course, in the meantime lower cost alternatives would be available on the
international market, but the necessary purchasing power for acquiring the extra imports
would be missing in this case. The modalities of such an arrangement would depend on the
level of development and industrial capacity of the countries concerned, as will be explained
later in this paper.
The second requirement is cooperation in the provision of producer services, training
and skills development, back-up services, including trade facilitation, export credit, insurance
and infrastructure necessary for the expansion of regional trade and supply capacity and
R&D, among others. The third requirement is development of a clear industrial policy, both
by individual countries and collectively.
Further, all countries should follow a dynamic industrial policy, with performance
requirements in exchange for facilities and a collective market, provided that over time they
improve their competitiveness in the international market. The advantage of this scheme over
traditional import substitution, where protection was provided across the board to all
industries, is selectivity in the use of scarce resources as well as benefiting from the larger
size of the collective market. Its advantage over selective infant industry protection is the
benefit of the larger market provided by the member countries.

11
In the light of the above, the role of China in the promotion of S-S trade in East, South
and South East Asian (ESSEA) region and industrialization of both NIEs and low-income
countries of the region, provides clues as to the potential and possibilities for and problems in
enhancing and strengthening the role of China in S-S cooperation in the region, particularly
through production sharing, in order that the country can act as a “pole” of industrialization
and development. The paper deals with these issues below.
IV. China as a regional industrial “pole” 10548
In this section and the following section, after referring briefly to the dynamism of the
Chinese economy, we will show that China has been a dynamic market and source of supply
for South-South regional trade in ESSEA mainly through production sharing, particularly in
electrical and electronic products. Nevertheless, the trade relation of China with the countries
of the ESSEA region reveals three main shortcomings as far as industrialization and
development of these countries is concerned. First, China’s trade in these products is
concentrated in trade with the first-tier NIEs and, to some extent, with the second-tier NIEs.
The low-income countries of the region have benefited little from the dynamism of the
Chinese market. Second, main China’s partner countries in the region have become
vulnerable to the risks of dependence on the Chinese market, as a hub, because of its exposure
to external shocks and vulnerability to changes in economic situation in developed countries
Third, there has not been sufficient technological development by the second-tier NIEs
in order to prepare themselves for the ultimate changes in the Chinese economy as their
market for parts and components (P&C). To deepen their industrialization they need to
upgrade their technological capabilities.
a. China’s economic dynamism and trade performance
Since the early 1980s China has been the fastest growing economy in terms of GDP,
MVA and fixed capital formation. Moreover, the country’s growth of international trade

12
in, both manufactured goods, and primary commodities has exceeded those of other
developing countries and the world as a whole in more recent decades (table 1). As a
result, it accounts for a significant share of global merchandise trade (both exports and
imports), and various product groups, except foods, (table 2). When Hong Kong is
included, in 2008, China has become the largest global exporter and the second world
importer, after the USA. It also accounts for nearly a quarter of exports and over one-
fifth of imports of developing countries (table 2).
Table 1189, 2 289
Table 1: Annual average of growth of trade of China and developing countries (1995-2008)
Non Fuel
Raw materials Food (SITC 0 + 1 + 22 + 4)
Agriculture (SITC 2 - 22 - 27 - 28)
Minerals (SITC 27 + 28 + 68)
Manufacturing (SITC 5 to 8 less 68)
Non fuel (SITC 0 to 8 less 3)
Fuel (SITC 3)
Total (SITC 0 to 9)
Region
(%) Exports
1. China 9.3 7.1 19.4 21.5 20.7 14.2 20.5 2. Developing Asia including China
7.2 6.4 15.1 11.9 11.8 15.5 12.4
3. Developing countries excluding China
7.0 6.0 14.0 8.8 9.1 15.9 10.6
4. Developing countries including china
7.2 6.1 14.4 11.5 11.2 15.9 12.1
World 6.4 4.7 11.9 8.4 8.3 16.1 9.2
Imports
1. China 14.8 16.0 29.3 18.9 19.3 30.2 20.2 2. Developing Asia including China
7.5 7.4 16.9 10.0 10.2 18.9 11.1
3. Developing countries excluding China
6.6 3.6 12.2 8.1 8.2 16.9 9.1
4. Developing countries including china
7.3 6.8 16.2 9.6 9.7 18.2 10.6
World 6.5 4.1 11.8 8.4 8.3 16.4 9.2
-------------------------------------------------------------------------------------------------------------------------------------------------- Source: Calculated by the author based on UNCTAD (2009) and UNCTAD Handbook of Statistics, database.

13
Table 2: Percentage Share of China in world trade (2008) Non Fuel
Raw materials Food (SITC 0 + 1 + 22 + 4)
Agriculture (SITC 2 - 22 - 27 - 28)
Minerals (SITC 27 + 28 + 68)
Manufacturing (SITC 5 to 8 less 68)
Non fuel (SITC 0 to 8 less 3)
Fuel (SITC 3)
Total (SITC 0 to 9)
Non fuel (SITC 0 to 8 less 3)
Region
(%) Value (Billions USD)
Exports
Share in world:
1. China 3.3 28 3.6 12.7 10.6 1.2 9.0 1,399 2. Developing Asia including China
18.1 21.3 17.6 31.2 28.8 34.8 29.8 3,809
3. Developing countries excluding China
32.3 30.6 36.2 23.0 24.8 53.8 29.6 3,289
4. Developing countries including china
35.6 33.4 39.8 35.7 35.4 55.0 38.7 4,688
Share in developing countries:
5. Share of China in Developing Asia
18.0 13.3 20.3 40.7 36.7 3.5 30.3
6. Share of China in Developing countries.
9.2 8.5 8.9 35.5 29.8 2.2 23.3
World: values at end year Billions USD
1,101 225 660 10,467 13,243 2,636 15,87
9
Imports
Share in world:
1. China 4.3 15.9 18.8 7.0 7.2 6.0 7.0 963 2. Developing Asia including China
20.4 34.5 39.9 25.6 26.1 27.9 26.4 3,475
3. Developing countries excluding China
28.1 26.2 26.5 27.5 27.6 28.8 27.8 3,671
4. Developing countries including china
32.4 42.0 45.3 34.5 34.8 34.8 34.8 4,634
Share in developing countries:
5. Share of China in Developing Asia
21.2 46.0 47.2 27.2 27.7 21.5 26.6
6. Share of China in Developing countries.
13.3 37.7 41.5 20.2 20.8 17.2 20.2
World: values at end year Billions USD
1,147 235 737 10,487 13,323 2,822 16,14
5
------------------------------------------------------------------------------------------------------------------------------------------------------------------ Source: Calculated by the author based on UNCTAD (2009) and UNCTAD Handbook of Statistics, database.
Furthermore, trade in manufactured goods, has been the most dynamic element of
China’s trade with ESSEA (table 3). Nevertheless, on the whole China has been more of a

market for exports of ESSEA, than a source of supply for their imports as well as imports of
various trade blocs in the ESSEA region (table 4). Instead, the USA and Europe, in particular,
have been the most dynamic market for exports of China. As will be explained later in this
section, this pattern of trade is influenced mainly by trade in information technology (IT)
products and by the role of China as a “hub” in the international trade of the ESSEA region.
Table 3: Direction of trade of China, 1995-2008
Exports Imports Shares (%) Growth rate Share (%) Growth rate Groups 1995 2008 95-08 1995 2008 95-08 Developed countries:
52.3 51.8 19.1 55.9 35 14.2
Europe 14.2 21.4 23.1 16.5 10.9 14.7 USA 16.6 18.6 20.2 12.2 6.7 13.1 Japan 19.1 8.2 11.7 21.9 12.4 13.3 Others 2.4 3.7 23.2 4.3 5 19.8 Developing countries:
46.3 43.8 18.7 38.7 53.8 21.5
of which ESSEA
40.5 31.3 16.9 33.9 38 19.5
Others* 1.4 4.4 30.2 3.8 3.1 16.6 Total 100 100 ---- 100 100 ---- Mimeo: Value ($b.)
149 1,469 19.3 132 1197 18.4
Note: *Transitional economies and Oceania
Source: Based on UNCTAD (2009), table 2.1
Table 4: Annual average growth rate of exports of various Asian trade blocs (%), (1990-2008)
Destination (importer)
Exporters
ASEAN (10)
SAARC (7)
APTA (6)
Total
China
Developing economies excl. China
China 21.08 22.48 17.95 21.92 - 16.46
ASEAN 12.2 14.2 18.3 13.5 24.1 12.3
SAARC 15.3 15.9 14.1 15.8 31.8 16.3
APTA 16.4 17.2 24.1 20.7 33.1 14.5
Total (ASEAN, SAARC, APTA) 13.46 15.84 20.71 14.47 21.92 11.93 Developing economies excluding China
11.3 11.9 15.6 13.7 17.5 10.8
-------------------------------------------------------------------------------------------------------------------------------------------------------- Source: Calculated by the author based on UN COMTRADE database.
14

It is also interesting to note that imports of China from members of various trade blocs
in ESSEA region has increased faster than their intra-bloc trade (tables 4). As a result, the
importance of China not only as a source of supply of imports, but also as a market for
exports of various trade blocs has increased significantly (table 5). Such a development
implies that factors other than preferential trade agreements must have been at work in the
expansion of regional trade in general and the regional trade of China with the countries of the
ESSEA in particular. Such a conclusion is strengthened by the comparison of trade of China
with SAARC (South Asian Association for Regional Cooperation) and intra-trade of SAARC.
China has had trade agreements with ASEAN (Association of South East Asian Nations) and
APTA (Asia-Pacific Trade Agreement) since 2002 and 2001, respectively, but not with
SAARC. Yet, imports of China from SAARC have grown over two times faster than the intra-
bloc trade of SAARC (table 4). Further, the exceptionally high rate of growth of intra-bloc
Table 5: Matrix of trade of China with various economic groups in ESSEA (%), 1995-2008
Destination (importer)
Exporters
ASEAN
SAARC
APTA
Total
China
Developing economies excl. China
1995 7.0 1.7 5.6 12.2 46.3 China 2008 7.8 3.1 7.5 15.8 43.8
1995 24.4 2.2 7.6 28.2 2.7 43.8 ASEAN 2008 25.4 4.1 17.4 43.1 9.6 50.0
1995 6.4 4.7 6.4 12.2 1.0 32.6 SAARC 2008 7.5 6.3 15.9 25.8 9.2 45.9
1995 9.8 2.1 6.8 15.6 3.0 41.1 APTA 2008 8.6 3.2 11.7 20.8 5.3 42.8
1995 16.0 2.2 6.9 23.4 3.0 43.1 Total (ASEAN, SAARC, APTA) 2008 13.9 3.6 13.5 28.0 7.4 45.2
1995 11.2 1.9 10.4 21.1 6.5 33.6 Developing economies excluding China 2008 10.3 2.8 19.5 30.4 13.8 36.2
Source: Based on UNCTAD Handbook of Statistics 2009.
15

16
trade of APTA is due to the involvement of China in the related regional agreement; China
accounted for over half of intra-bloc trade of members of APTA in 2008 (table 5).
b. Structure of imports of China
We have looked into the origins of imports of China from the main trade blocs in the ESSEA
region (ASEAN and SAARC) as shown in tables 6 and 7. Table 6 also shows the data for
India as a separate item because of size. The tables indicate first of all that manufactured
goods, particularly SITC 7 items, and minerals and metals have been the most dynamic
imports of China from ESSEA. SITC 7 products account for over 60 per cent of China’s
imports from ASEAN.
Secondly, When India is excluded from SAARC, other members of the regional group
(all are low-income countries) benefit little from the dynamism of China’s market. In fact,
India alone accounts for about 76 per cent and 99 per cent of imports of manufactured goods
and SITC 7 products of China from SAARC respectively. The remaining countries, excluding
Pakistan, account for only over 2 per cent of the China’s imports of these products from
SAARC (table 7). Similar tendencies are observed in the case of low-income country
members of ASEAN (table 7).
Therefore, it appears that the level of development and the degree of industrialization,
thus the supply capabilities, of the partner countries, are important factors in the expansion of
imports of China from countries of the region.
Finally, two main SITC items, mainly electric and electronic products, account for the bulk of
China’s import of manufactured goods in the case of countries where manufactured goods constitute
the bulk of imports of China from the country. Such trade pattern makes them vulnerable to the
business cycle in the third markets, i.e. markets of developed countries as will be explained shortly.

Table 6: Imports of China from ASEAN 10 and SAARC, 1995-09 ($m)
Manufactured Items Total
Non-fuel Total (SITC
6+8-68) SITC 7
Others (light manufactured)
Ores
&Metal
Ag.R.Mat.
Food
2 Main SITC Items*
ASEAN 10: Total value (2009)
106713.9 93574.5 74932.5 56226.5 8466.1 5350.6 4944.5 8214 40560 (SITC 776 &,752)
Share in Non-fuel(2009)
114 100 80.1 60.1 9 5.7 5.3 8.8 43.3 (54.1)
Growth rate (1995-09
23 24 27 32 14 30 16 16 47.5
SAARC Total value (2009)
1519.9 15095.6 4685.4 718.8 2783.2 9254.7 628.3 506.5 1443.8 (SITC 651&667)
Share in Non-fuel (2009)
100.6 100 31 4.8 18.4 61.3 4.2 3.4 6.5 (20.9)
Growth rate (1995-09)
28.8 29 20.9 39.7 16.3 41.4 30.8 10 5.3
India Total value(2009) 13714.3 136190 3551 709.8 1716.5 9106.7 508.9 431.8 284.5
(SITC512& 682) Share in Non-fuel(2009)
100.6 100 26.1 5.2 12.6 66.8 3.7 3.2 2.1(8)
Share of India in imports of China from SAARC
90.2 90.2 75.7 98.7 61.6 98.4 81 85.2
Note: *Figures in brackets are shares of the item in imports of manufactured goods of China from the regions/country.
Sources: Calculated by the author, based on UN, COMTRADE Database.
17
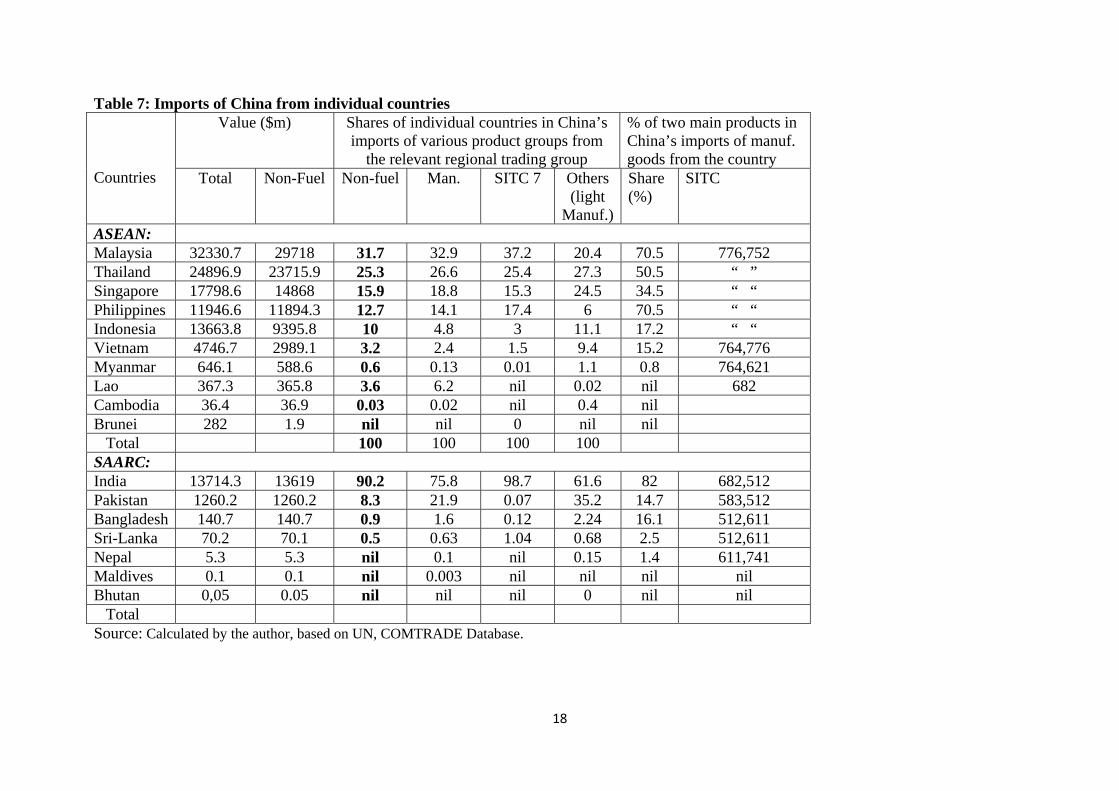
Table 7: Imports of China from individual countries Value ($m) Shares of individual countries in China’s
imports of various product groups from the relevant regional trading group
% of two main products in China’s imports of manuf. goods from the country
Countries Total Non-Fuel Non-fuel Man. SITC 7 Others
(light Manuf.)
Share (%)
SITC
ASEAN: Malaysia 32330.7 29718 31.7 32.9 37.2 20.4 70.5 776,752 Thailand 24896.9 23715.9 25.3 26.6 25.4 27.3 50.5 “ ” Singapore 17798.6 14868 15.9 18.8 15.3 24.5 34.5 “ “ Philippines 11946.6 11894.3 12.7 14.1 17.4 6 70.5 “ “ Indonesia 13663.8 9395.8 10 4.8 3 11.1 17.2 “ “ Vietnam 4746.7 2989.1 3.2 2.4 1.5 9.4 15.2 764,776 Myanmar 646.1 588.6 0.6 0.13 0.01 1.1 0.8 764,621 Lao 367.3 365.8 3.6 6.2 nil 0.02 nil 682 Cambodia 36.4 36.9 0.03 0.02 nil 0.4 nil Brunei 282 1.9 nil nil 0 nil nil Total 100 100 100 100 SAARC: India 13714.3 13619 90.2 75.8 98.7 61.6 82 682,512 Pakistan 1260.2 1260.2 8.3 21.9 0.07 35.2 14.7 583,512 Bangladesh 140.7 140.7 0.9 1.6 0.12 2.24 16.1 512,611 Sri-Lanka 70.2 70.1 0.5 0.63 1.04 0.68 2.5 512,611 Nepal 5.3 5.3 nil 0.1 nil 0.15 1.4 611,741 Maldives 0.1 0.1 nil 0.003 nil nil nil nil Bhutan 0,05 0.05 nil nil nil 0 nil nil Total Source: Calculated by the author, based on UN, COMTRADE Database.
18

19
c. Nature of production sharing and its role in East Asian trade
Production sharing is a form of industrial collaboration and intra-industry trade whereby the
process of production is fragmented into various P&C that are produced in different countries,
crossing borders to another country for assembly. The intensity of such a vertical production
chain depends on the nature of the product involved, which in turn depends positively on the
following factors: technical divisibility of the product, factor intensity of its process of
production, technical complexity of each process and the value-to-weight ratio of the product
(Lall et al., 2004). SITC 7 items, particularly ICT and automobile products, have many of
these characteristics. For example, for three SITC 7 items, P&C accounted for 56.5 per cent of
their world exports, 80.8 per cent of exports of East Asia and 82.5 per cent of exports of
China. These items include: office machine and data processing products (SITC 75),
Telecommunication and sound recording (SITC 76) and Electric machinery etc (SITC77)
(Athukorala et al., 2010: table 5).
Production sharing is also facilitated by liberalization of trade and FDI, a reduction of
transaction costs due to reduced costs of transportation and communication (Arndt, 2002) and
the involvement of TNCs as a source of technology and as a marketing channel. Meanwhile,
the possibility of involvement of a country in production sharing also depends on capabilities
of its domestic firms and its availability of skills, transport and communication infrastructure,
institutions and the necessary back-up services—all of which are lacking in low-income
countries (Lall et al., op. cit.) and political stability as well as capability in governance (World
Bank,2009).
Trade in P&C has been a dynamic source of global trade in manufactured goods,
particularly ICT products (table 8). Accordingly, during 1992/93-2005/06 over 57 per cent of
global growth in ICT products originated from P&C as against about 24 per cent for
manufactured goods as a whole, 43 per cent for SITC 7 products, 10.4 per cent for electric
20
machinery and 6.7 for light manufactured goods (SITC 8) (Athukorala and Menon, 2010:
table 1). As a result, the share of ICT in global trade in P&C has increased from nearly 43 per
cent in 1992/93 to 52.6 per cent in 2005/6 (loc. cit.).
The sharp increase in intra-regional trade in the East Asia region has been also largely
due to the expansion of intra-industry trade, particularly in skill-, capital- and/or technology-
intensive goods such as electronic products and other machinery and transport equipment
(SITC 7) (Ng and Yeats, 2003). As countries develop and industrialize the prospects for
regional trade increases. In particular, China has been increasingly expanded its share of
global and regional trade in P&C (table 8).
d. The role of China in regional production sharing
China is regarded in the literature as the leading country in terms of deepening of vertical
intra-industry trade specialization (i.e., production sharing), and as the engine of export
growth of the East Asian region (e.g., Kozo, Sazanami and Yu Ching, 2006; Lall and
Albaladejo, 2004; Haltmaier et al., 2007). Apart from Japan, China has been the biggest

21
Table 8: Importance of trade in P&C in trade in manufactured goods ----------------------------------------------------------------------------------------------------------
Exports Imports
------------------------- ------------------------------- 1992/93 2005/6 1992/3 2005/6
--------------------------------------------------------------------------------------------------------- Share of P&C in Global Manufacture Trade (%): Total 18.9 22.3 19 22.3 SITC 7 36.6 40.7 36.6 40.7 ICT products 50.5 55.5 51.2 55.5 Share of P&C in trade of ICT products of PRC(%) 26.2 38.3 62.7 81.3 Share of ICT in global trade of P&C 42.92 52.70 Share of various groups and China in global trade in P&C (%): Developing countries: of which: 23.8 46.1 30.3 48.4 East Asia 30.1 40.6 24.4 38.1 Developing East Asia (14.4) (30.6) (21.2) (34.1) PRC (1.1) (10.9) ( 2.4) (11.5) % Share of P&C in China’s trade with: World 17.5
39.3
Developing East Asia 30.6
44.7
ASEAN 35
47.1
ASEAN 3 28.7 39.1 ------------------------------------- Sources: Based on Athukorala & Menon (2010), Tables 1,2,3,4
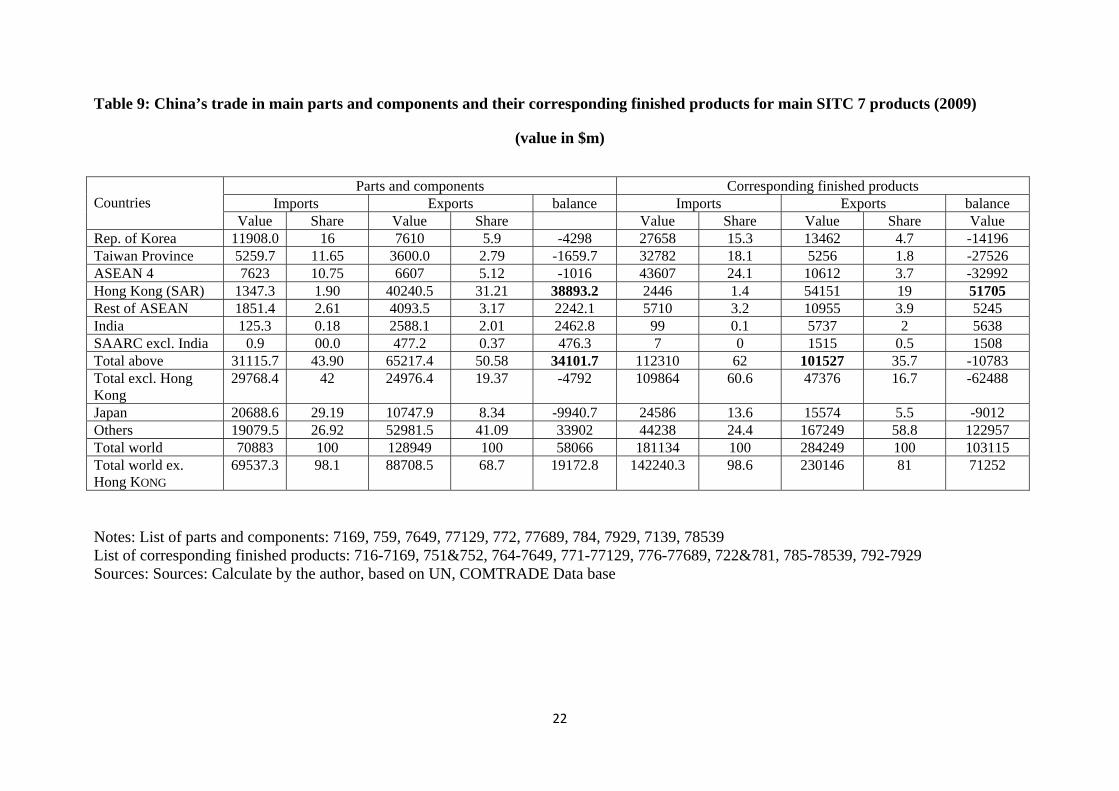
Table 9: China’s trade in main parts and components and their corresponding finished products for main SITC 7 products (2009)
(value in $m)
Parts and components Corresponding finished products Imports Exports balance Imports Exports balance
Countries
Value Share Value Share Value Share Value Share Value Rep. of Korea 11908.0 16 7610 5.9 -4298 27658 15.3 13462 4.7 -14196 Taiwan Province 5259.7 11.65 3600.0 2.79 -1659.7 32782 18.1 5256 1.8 -27526 ASEAN 4 7623 10.75 6607 5.12 -1016 43607 24.1 10612 3.7 -32992 Hong Kong (SAR) 1347.3 1.90 40240.5 31.21 38893.2 2446 1.4 54151 19 51705 Rest of ASEAN 1851.4 2.61 4093.5 3.17 2242.1 5710 3.2 10955 3.9 5245 India 125.3 0.18 2588.1 2.01 2462.8 99 0.1 5737 2 5638 SAARC excl. India 0.9 00.0 477.2 0.37 476.3 7 0 1515 0.5 1508 Total above 31115.7 43.90 65217.4 50.58 34101.7 112310 62 101527 35.7 -10783 Total excl. Hong Kong
29768.4 42 24976.4 19.37 -4792 109864 60.6 47376 16.7 -62488
Japan 20688.6 29.19 10747.9 8.34 -9940.7 24586 13.6 15574 5.5 -9012 Others 19079.5 26.92 52981.5 41.09 33902 44238 24.4 167249 58.8 122957 Total world 70883 100 128949 100 58066 181134 100 284249 100 103115 Total world ex. Hong KONG
69537.3 98.1 88708.5 68.7 19172.8 142240.3 98.6 230146 81 71252
Notes: List of parts and components: 7169, 759, 7649, 77129, 772, 77689, 784, 7929, 7139, 78539 List of corresponding finished products: 716-7169, 751&752, 764-7649, 771-77129, 776-77689, 722&781, 785-78539, 792-7929 Sources: Sources: Calculate by the author, based on UN, COMTRADE Data base
22

23
importer of P&C of SITC 7 products, particularly electric and electronic ones, in the region as
well as the most important exporter of related finished goods (after Japan). This is because
trade in P&C, particularly electrical and electronic P&C, has been one of the most dynamic
elements of China’s trade in manufactured goods in general, including its regional trade with
ESSEA (Pizarro and Shafaeddin, 2010). China has also become a net exporter of P&C. For
example, according to one estimate, in 2005, trade in P&C accounted for about 30 per cent of
China’s total exports and 41 per cent of its exports of machinery and equipment (Haltmaier et
al., 2007: table 2). Trade in the 10 main items of P&C (mostly electrical and electronic goods)
expanded even faster than those of total P&C (Pizarro and Shafaeddin, 2010).
Data for the regional trade of China in P&C and their corresponding finished products
for SITC 7 items are exhibited in table 9, in which the countries/regions are ranked according
to the value of imports of P&C in 2009. The data also includes total trade of China with
ESSEA, excluding Hong Kong (SAR, China). It is excluded because of its special situation as
a major re-exporter of the related products imported from China and the discrepancies
between the data reported by China and Hong Kong (SAR) as exporter and importer,
respectively. Such discrepancies cannot be explained by transport costs alone.
According to the table, first of all, China is not only a large market, but also a net
importer of P&C and finished products from ESSEA even when Hong Kong (SAR, China) is
excluded. Yet it is a net exporter to the rest of the world, particularly for finished products.
Therefore, it acts as an export hub (bridge) for the ESSEA region; in 2009, 43 per cent of its
imports of P&C originated from ESSEA while over 64 per cent of its finished products were
exported to other countries (5.5 per cent to Japan and 58.8 mainly to the USA and Europe
(table 8; see also Table A). When Hong Kong is excluded the last figure increases to 64.3 per
cent.
24
e. Lack of integration of low-income countries
All developing countries of the region have not benefited from the dynamism of the Chinese
market to the same extent. Three groups can be distinguished in order of their importance as
providers and markets for the selected products. The first group includes the Republic of
Korea and Taiwan (Province of China). China’s trade balance with these economies is
significantly negative for both P&C as well as finished products. This is because they are
major regional suppliers to China of sophisticated P&Cs that are not produced domestically in
China but are required for assembly operations. They also export some sophisticated finished
consumer goods and capital equipment to China for its own domestic consumption.
The second group consists of four ASEAN members: Indonesia, Malaysia, Singapore
and Thailand (ASEAN 4). China is also a net importer of both P&C and finished products
from these countries. Nevertheless, as far as finished products are concerned, the figure is
heavily influenced by imports from Singapore4. Otherwise, China is a net exporter of finished
goods to these countries.
The third group consists most of other ASEAN member countries and members of
SAARC (low-income countries). China’s import from the rest of ASEAN and members of
SAARC is insignificant except for the Philippines and to some extent Vietnam. China imports
a small amount of electronic goods (worth about $430m) from Vietnam (as table 6). The
Philippines have become an increasingly important exporter of electronic products since the
late 1980s because of the involvement of Japanese and United States TNCs. Three
characteristics of the country have attracted FDI: its proximity to other East Asian countries
involved in the vertical production network; its ease of regional transport due to its vast
coastal areas; and its low-wage and skilled manpower. Japan and the United States have been
its main markets, but its exports of high-tech products to China have also increased
significantly, from 1.3 per cent of its total exports in 2000 to 13 per cent in 2005 (Haltmaier et

25
al., 2005: 32-36). In 2009, the Chinese imports of 7 main electric and electronic products,
accounted for over 79 per cent and 89 per cent respectively of China’s imports from the
Philippines, out of which, two products (SITC 776 and 752) accounted for 63% and 71%,
respectively.
V. Vulnerability of ESSEA countries, or de-coupling
The ESSEA countries which depend on the production sharing system, dominated by China,
face a couple of short/medium and long run risks.
a. Short/medium-run risks
One short/medium run risk facing the countries concerned is related to their exposure to the
business cycle, directly and through the “hub”, thus a fall in demand for finished IT products
of China in the market of developed countries. It is a myth to believe that China (and East
Asia) is decoupling with developed countries as argued by some (Anderson, 2007; Economist,
2007; Bergsten, 2008). In fact, the link between China and other ESSEA countries with those
economies has increased due to their heavy integration into the world economy. Generally
speaking, OECD countries accounted for over 61 per cent of destination of processing exports
of the East Asian region, out of which the USA and EU-19 accounted for 31.1 per cent and
25 per cent, respectively (Ma et al., 2009: table 2). The correlations of East Asian countries
with China as well as developed countries have increased considerably as shown in table 10.
The only exception is the correlation of direct trade of East Asia, excluding China, with G7.
The correlation between growth in East Asia’s interregional exports and USA’s non-oil
imports increased from -0.01 during the 1990s to 0.83 during 2000-August 2009 (Kim et al.,
2010: 8).

26
Table 10: Business cycle correlation of East Asiana countries
Pre-(1997/8) crisisb Post-crisisc Business cycle correlation with PRC: East Asia excluding PRC -0.379 0.549 G7 -0.304 0.580 US -0.490 0.517 Japan -0.633 0.477 Inter-regional Business Cycle correlation: East Asia-G7 0.084 0.611 East Asia-Us 0.233 0.715 East Asia excluding PRC-G7 0.619 0.537 East Asia excluding PRC-US -0.345 0.724 Notes: a: PRC, Hong Kong (SAR), Taipei, China, Indonesia, Rep. of Korea, Malaysia, the
Philippines, Singapore and Thailand. b: 1990 Q 1-1996 Q4. c: 2000Q1-2007Q2.
Source: Kim et al., (2009: 37).
Similarly, growth rates of exports of China to G3 (USA, EU and Japan) are “highly
correlated with those of the PRC imports from the rest of East Asia” (Kim et al., 2010: 8). In
other words, not only China itself is exposed to the business cycle in developed countries, but
also are the Asian exporters of P&C via their exposure through China. In fact, East Asian
countries and the US/European economies are “recoupling” rather than decoupling (Kim, et
al., 2009).
The argument on decoupling is based on an erroneous methodology of analysis in
which the rates of growth of GDP of China and developed countries, rather than their
deviation from the trend growth rates, are compared (Walti, 2009).
Another source of short-term risk is related to the interdependence of these countries
as the correlation of business cycles between economies across the East Asian region has
increased considerably since the mid-1980s (Zebregs, 2004: 14; Kim et al., 2009).5
Development of bottlenecks in production of an item of P&C or a shock in one country may
be transmitted to another country through the production sharing network, leading to
slowdown in growth of the exporting countries.

27
Yet further source of risk is the change in the exchange rate system in China. The
Chinese currency is fixed and pegged to the US dollar with a band. Recently, the band has
been widened and there is a pressure on China to revalue its currency, or to switch from a
fixed exchange rate system to a floating one. In the former case the appreciation of the
currency makes Chinese exports more expensive reducing its demand for imports of P&C. At
the same time it makes the imported price of P&C cheaper. The overall effects on exports of
China, thus the demand for P&C, which is a derived demand, is not clear depending on the
import intensity of exports and the behaviour of the pass-through of the import price of P&C
(according to Athukorala et Al., 2010 and Jangwanich, 2010). In East Asia, where importance
of P&C in international trade has increased from 20 per cent in 1992 to about 41 per cent in
2008 (Kim et al., 2010: 9), the link between exports and exchange rate has weakened. P&C
are less sensitive to changes in exchange rates. Meanwhile, it is also argued that devaluation
by other East Asian countries does not necessarily affect China’s exports (Liao et al., 2010).
This is because the complementarity effects of China’s exports (through imports of P&C)
with most exporters of P&C are greater than their competitive effects with their exports of
final products. Thus China would benefit from cheaper imports of P&C which accounted for
nearly 29 per cent of its total exports from developing East Asian countries in 2005/06
(Athukorala et al., 2010). In East Asia, “world demand, FDI and production capacity have
increased their importance in determining exports” (Jangwanich, 2010). World demand is
basically influenced by the income elasticity of demand and business cycles. TNCs act as
marketing channels. Development of production capabilities depends on the level of
industrialization and development of the exporting country and its productivity growth. A
switch to floating exchange rate creates instability in export of P&C to China (Thorbecke,
2008).

28
b. Long-run risks
The long-run risks are related to the slowdown of China’s imports of P&C from ESSEA for
two different reasons: the substitution of domestically produced P&C for imports, and a shift
from export-led growth to consumption-led growth, or a combination of both.
China has been increasing its capabilities in production of P&C and expanding
domestic value added in assembly operation particularly in ICT products (electric, electronic)
and other items of SITC 7 group which are the main source of production sharing (Pizarro and
Shafaeddin, 2010). As a result, its imports of P&C decelerated from annual average rate of
about 44 per cent during 1992/3-2001/2 to 35.3 during 2001/2-2004/5 period despite
acceleration of its exports of manufactured goods (Pizarro and Shafaeddin, 2010: table 4) . It
has been improving its revealed comparative advantage not only in exports and production of
P&C through technological development (Pizarro and Shafaeddin, 2010: table 4; Gallagher
and Shafaeddin, 2010). During 2005-2009, China’s imports of P&C for production of SITC 7
items declined in absolute terms, while their exports expanded rapidly; thus the balance of
total trade in these products has improved by over 5 times (table 11).

29
Table 11: Trade of China in P&C and their corresponding finished products for SITC 7, (2005-2009) ($m.)
P&C Finished products 2005
(1) 2009 (2)
Ratio 3=2:1
2005 (4)
2009 (5)
Ratio 6=5:4
Total world Exports 97502 128949 1.32 199486 284249 1.42 Imports 86185 70883 0.82 172618 181134 1.05 Exports (X)-Imports(M)
11317 58066 5.1 26868 103115 3.84
X-M/M (%) 13.1 81.9 6.25 15.3 56.9 3.7 Total world excluding Hong Kong Exports 67611 88708.5 1.31 156375 230146 1.47 Imports 84459 69537.3 0.82 170770 142240.3 0.83 X-M -16848 19172.8 na -14395 87905.7 na (X-M)/M (%) -19.9 27.6 na -8.4 61.8 na ESSEA Exports 49327 65217.4 1.32 72592 101527 1.40 Imports 29535 31115.7 1.05 94343 112310 1.19 X-M 19792 34101.7 1.72 -21751 -10783 0.49 (X-M)/M(%) 67 109.5 1.63 -0.23 -0.07 0.30 ESSEA excluding Hong Kong Exports 19436 24975.4 1.28 29481 47376 1.6 Imports 27809 29768 1.07 92495 109864 1.18 X-M -8368 -4791.6 0.57 -63014 -62470 0.99 (X-M)/M (%) -30 -16 0.53 -68.1 -56.8 0.83 Source: Calculated by the author, based on UN, COMTRADE Database.
So far, China’s imports of P&C from ESSEA region have been increasing both as a
share of its total imports of P&C and in absolute terms—although the pace of the latter has
been slow.6 Furthermore, the country’s export of finished products to the world as a whole
expanded faster than its exports to ESSEA region. Hence, the role of China as a “hub” in the
ESSEA region has been increasing. Nevertheless, as exports of P&C of China to ESSEA is
increasing faster than its imports from the region, whether Hong Kong is included or not,
(table 10), it is very likely that its role as a “hub” may become gradually less important in the
future (Gallagher and Shafaeddin, 2010).
Shift to consumption-led growth

30
One reason for a possible shift from export-led growth to consumption-led growth is the
development of protectionism in the importing developed countries, particularly the USA
with its growing trade imbalance with China (Akyuz, 2010; Kozo, Sazanami and Yu Ching,
2006), and its knock-on effects on exporters of P&C to China. If China wishes to continue its
export growth at the rate of 20 t0 30 per cent a year, which it has been doing during the years
before the emergence of the recent global financial crisis, one has to take this risk seriously.
Export growth of 20 to 30 per cent a year at a low base is not a cause for concern of the
developed countries, but at a high base it is a different thing. Currently China’s exports
exceed 1.4 trillion dollars. Hence, such a risk should not be underestimated.
Optimistic appraisal of China’s strength reflected in its massive trade surplus
underestimates its structural vulnerabilities (Fischer, 2010). China’s “massive rerouting of
East Asian centred international production networks” entailed development of trade deficit
with East Asian countries and trade surplus with the USA and EU (Ibid.). The large volume of
imports of developed countries from China makes China vulnerable to the risk of a tendency
towards protectionism in the importing countries. If further development of surplus with these
countries encounters difficulties, Chinese imports of P&C from the ESSEA region will be
adversely affected.
A shift from export-led growth to consumption-led growth may entail less import
intensity as production of consumer goods for the domestic market is less import intensive
than production of ICT products for the export market (Akyuz, 2010; Lall, 2004; Humphrey
and Schmitz, 2006).
Currently, the X/GDP, the savings/GDP and I/GDP ratios of China are relatively high
in comparison with those of the other ESSEA countries and they have been rising in recent
years (Prasad, 2009). By contrast, its C/GDP ratio is lower, its Wage/GDP has not been
keeping pace with labour productivity and its rural population suffer from inequality in

31
income and consumption with city dwellers. In fact, there are indications that a shift from
export-led growth to consumption-led growth will also improve the distribution of income in
favour of the lower-income strata through wages. According to an empirical study by Xing
(2010: 1): “China’s export share of GDP has a positive effect on the enlargement of the upper
half distribution”. Thus there is some scope for structural shift towards consumption-led
growth. If it happens, such a shift will decrease not only the pace of China’s imports of parts
and components, but also will reduce, it is argued, the import intensity of GDP in general,
particularly exports of ICT products as mentioned earlier (See also Akyuz, 2010).
The related risk is, however, somewhat overstated. It is true that in such a case the
exporters of P&C may also have to adjust their production structure. Nevertheless, the
experience of industrialized countries demonstrates that as countries industrialize, intra-
industry trade in differentiated consumer goods as well as investment products also increases.
During 1996-2008, the share of imports of P&C in total imports of China has declined (from
about 35% to 25%), but the share of final products in its imports has changed little. More
importantly, during the same period, the share of final goods in imports from East and South
East Asia has increased considerably—from about 35% to 55 % (Kim et. al., 2010: 14-15).
Therefore any shift to consumption-led growth would also lead to further increases in china’s
imports of these goods from the ESSEA region. It is also very likely that for a given growth
rate of GDP, imports of raw materials and foods will also be accelerated
VI: The future of regional trade; the questionable role of market
Neither the integration of lower-income countries nor the technological upgrading of the
second-tier NIEs is feasible through the operation of market forces alone. There is a need for
policy initiatives by the governments of the region in order to enhance regional cooperation
for these purposes. Here we will concentrate on the particular case of low-income countries.

32
There is a misconception about the role of the market in the expansion of regional
trade in East Asia as it is believed that such an expansion has been market-driven (Kawai and
Wignaraja, 2007). In fact, the experience of Asian NIEs and second-tier NIEs as well as
China indicates that intra-industry trade through production sharing has not developed
through the operation of market forces alone. Thus the expansion of regional trade of China
with low-income countries of ESSEA also requires proactive policies by the governments of
low-income countries as well as China.
We have shown elsewhere that: the bulk of intra-regional trade in East Asia takes
place through intra-firm trade, it does not go through the market; that such trade was mostly
policy driven resulting from changes in the FDI policies of the governments of Japan and the
East Asian countries, particularly after the Plaza accord of 1985. The Japanese firms initially
played a significant role in integrating the East Asian region by producing mainly for export
to other countries, including ESSEA countries and played an important role in the
development of the production network in the region. Japanese firms purchased the bulk of
their input of goods and services from the local markets and local firms. By contrast, the US
firms involved produced mostly for exporting to the United States. Most Governments in the
region pursued a new development strategy for providing suitable location for FDI and for
efficient and beneficial use of FDI through requesting local content requirement etc. At the
same time, they built up the production capabilities of their local firms, developed their
infrastructure and utilities and provided the facilities for necessary back-up services. China
also adopted similar policies with the difference that initially, inward-FDI originated mainly
from ethnic Chinese investors—mainly Hong Kong (SARS), Taiwan Province of China and
Singapore (Shafaeddin, 2008: 36-37 and the sources reported therein). Between 70 to 80 per
cent of cumulative inward FDI of China during 1990-2002 period originated from Hong Kong

33
(SAR, China) and Taiwan Province of China depending on whether one uses China or these
two teritories as reporting trade partner (Ibid.: 37).
Although the pattern of expansion of the regional pattern of trade and industrialization
in East Asia resembles the flying geese model (Akamatsu, 1961; Kasahara, 2004; Memis,
2009), the geese did not fly automatically either in Japan or at the regional level in East Asia.
Various government policies played an important role in development of domestic capabilities
in Japan and East Asian NIEs (Fan and Watanabe, 2006; Lall, 2004; Gallaher and Shafaeddin,
2010). The trickle-down effects of the process have also reached the second-tier NIEs,
although it has not had sufficient impact on their technological development. Moreover, the
low-income countries of the region were not a part of the flying geese process.
Will low-income countries benefit from the flying geese pattern through the trickle-
down impact of economic dynamism of China? Or, as China upgrades its industrial structure,
will it leave some low-technology intensive industries to create opportunities for low-income
countries of the region?
Although China has been improving its revealed comparative advantage in production
and exports of technology-intensive products, it still remains, and will remain for the
foreseeable future, a massive producer of labour-intensive products.
Moreover, currently, under new global economic conditions governed by market
forces and liberalization, the policy space available to the low-income countries to follow
similar policies followed by the NIEs to enhance capabilities of their local firms is limited.
Hence, it is not clear whether the geese could easily fly over these economies to facilitate their
industrialization through trickle-down effects of the dynamism of the Chinese economy.
Neither is it clear whether market forces alone could induce technological upgrading of the
second-tier NIEs. In both cases proactive policies are needed
34
VII: Policy implications for the future of industrialization of the region
What sort of policy measure is required to enhance the positive impact of China’s South-
South regional trade on industrialization and development of the low-income countries and
the exporters of P&C.
We will explain that, in both cases, there are needs for some adjustment in the
production and export structure of the countries concerned. Nevertheless, such adjustment
will not take place automatically through market forces alone. There is a need for proactive
policies by the related governments. We will concentrate here on further regional cooperation
in the case of low-income countries and refer briefly to cooperation among second-tier NIEs,
China and India for upgrading their technological capacities.
Industrial collaboration
In order to benefit from the dynamism of the Chinese economy as well as ESSEA region as a
whole, the low-income countries need to expand their industrial supply capabilities. Market
forces alone will not be of much help in allowing them to exploit the opportunities for trade
expansion in industrial products because they lack the necessary supply capacity. And the
expansion of the supply capabilities is faced with scarcity problems, including the scarcity in
finance, skills, infrastructure, organization and entrepreneurship. Further, policies of regional
investors do not favour them as outward FDI by NIEs is directed mainly to China and the
ASEAN-4 (Isoga and Shibanuma, 2000). They need to mitigate their scarcity problem
through industrial collaboration among themselves with some adjustment assistance by China
and, possibly, NIEs. They can enter into an agreement for industrial collaboration as
explained in section III.
Industrial collaboration can be facilitated by regional FDI by countries like China and
NIEs as it will be beneficial to the host country as well as the investing countries as they are

35
market seekers. The processing of raw materials before exporting to China could be one
possibility, as mentioned before, but it is not the only one. India’s investment cooperation
with Nepal and Sri Lanka for production of manufactured goods is an example (Wishwanath,
2007: 2).
As mentioned before, industrial collaboration is necessary but not sufficient.
Arrangements have to be made for the division of labour in required back-up services, export
credit, information and the development of the necessary infrastructure, training and skills
development, and business cooperation through chambers of commerce.
Cooperation among countries concerned necessitates political will, harmonization of
rules of origin as well as external assistance. Often, there are political problems in securing
agreements among the countries for industrial collaboration. Each country may have its own
individual interest as against the common interest of the group. Understanding by the partners
of the ultimate benefits of such arrangements for individual countries requires dialogue and
the dissemination of information and knowledge. The scarcity of financial and other resources
also requires external financial and technical assistance: it is in the interest of China itself to
provide such assistance. If China is faced with obstacles in expanding its markets in
developed countries, it may be interested in expanding its regional market in ESSEA. Such
expansion in low-income countries requires expansion of their effective demands which is, in
turn, a function of their level of development and industrialization.
Technological collaboration
The countries which rely on export of P&C to China needs to, inter alia, adjust their
production/export structure by upgrading their technological and skill capabilities in order to
reduce their vulnerabilities. One option is to emphasize production for the domestic market

36
rather than exports. More recently in a shift from its traditional stance of propagating export-
led growth, the Managing Director of IMF also recommended that “Asia, which has until now
relied heavily on exports for economic growth, needed to boost domestic investment and
consumption” (Choonsik and Jong-woo, 2010). Such adjustment will also help the expansion
of exports of differentiated products to China even if this country shifts to consumption-led
growth. As mentioned before, as the countries of the region develop, their intra-trade in
differentiated products will also expand.
Their growth strategy requires, inter alia, upgrading of their technological capabilities
for production of sophisticated consumer and investment goods which, in turn, requires R&D,
skill development etc. Regional cooperation can help the countries concerned to attain their
growth objective through division of labour and specialization in R&D and development of
skills.
The lack of skills and financial and technical resources prevents countries in the group
to undertake research in a large number of areas individually. Large countries, such as China
and India, are in a better position than others to develop their technological capabilities
independently. For example, India has succeeded to some extent in the particular case of
pharmaceuticals and software industries; so has China in IT technology. Nevertheless, even
for these countries the R&D/GDP ratios are far below those of developed countries (Gallagher
and Shafaeddin, 2010). Therefore, the division of labour and specialization could help all
countries of the group in advancing their technological capabilities.
Attempts have been made by ASEAN and China to cooperate in research on ICT
activities for which they have envisaged the establishment of an R&D centre for
telecommunications equipment. Nevertheless, with the exception of the Republic of Korea,

37
Singapore and to some extent China, R&D expenditure in ESSEA countries is relatively small
(Shafaeddin, 2008).
There are a number of other areas in which China and other countries of the ESSEA
region can cooperate. One is coordination of their policies for intensifying the technological
spill-over of FDI. Another is cooperation on financial issues to reduce the risks of financial
crisis. Having experienced the financial crisis of 1997/8, the East Asian countries have
increased their currency reserves, developed on the Chiang Mai Initiative (a kind of “ASEAN,
swap arrangement”) and a network of bilateral financial swap arrangements among
ASEAN+3 countries (For details see Shafaeddin, 2008). Nevertheless, there are areas on
which they can further expand their cooperation. One can mention a few: “stronger regional
cooperation in monitoring and regulating financial markets”7; modalities of capital controls in
the region; establishment of a regional South Bank (Shafaeddin, 2008).
VIII. Concluding remarks
We have explained in this paper that neither the neo-liberal argument against S-S trade is
justified nor have their critics provided a strong economic rationale in favour of active
expansion of such trade. Subsequently, we proposed such a rationale based on a combination
of four elements: the theory of “vent for surplus”; the resource scarcity problem of developing
countries; the principal of dynamic comparative advantage; and the need for division of
labour and specialization at the regional level. Accordingly, instead of international trade
leading to specialization, specialization will lead to trade. S-S trade is being viewed as an
addition to N-S trade, and as a vehicle for enhancing industrialization, upgrading and general
economic development.
In the light of the above, we have looked into the implications of the dynamics of the
Chinese economy for the expansion of regional South-South trade, and have shed some light

38
on its merits as well as its caveats and proposed some changes in the strategies of the ESSEA
countries in the future.
More specifically, it was shown that China has been a dynamic market and source of
supply for South-South regional trade in ESSEA mainly through production sharing,
particularly in electrical and electronic products. Nevertheless, the trade relation of China
with the countries of the ESSEA region reveals three main shortcomings as far as its impact
on industrialization and development of these countries is concerned. First, China’s trade in
these products has been concentrated on trade with the first-tier NIEs and, to some extent, the
second-tier NIEs. While low-income countries of the region have acted as a market for
exports of China, they have benefited little from the dynamism of the Chinese market in the
process of their industrialization.
Second, through production sharing China’s regional partners have become vulnerable
to the risks of dependence on the Chinese market, as a hub, because of its exposure to external
shocks and vulnerability to the business cycle in developed countries. China depends mainly
on the markets of developed countries for exports of the related finished-assembled-products.
For example, in 2009, China’s imports of two items of P&C (SITC 776 and 752) from
Malaysia amounted to over $17 billions, accounting for about 17 per cent of its total imports
and 86 per cent of imports of manufactured goods from this country.
Third, there has not been sufficient technological development by China’s trade
partners which are involved in regional production sharing. They are also vulnerable to the
ultimate changes in the Chinese trade and development strategy. To deepen their
industrialization they need to upgrade their technological capabilities.
The regional agreements and market forces alone have not been responsible for the
expansion of S-S trade in the region; trade agreements are necessary, but they are not

39
sufficient. Demand and supply dynamism as well as policies of governments and TNCs have
been among important contributory factors. In particular, the low industrial and skills
capabilities have prevented the lower-income countries from getting involved in the rapid
expansion of production sharing.
Similarly, in the future also neither the integration of lower-income countries nor the
technological upgrading of the second-tier NIEs is feasible through the operation of market
forces alone. There is a need for proactive policy initiatives by the governments of the region
in order to enhance regional cooperation for these purposes. There is a common
misconception about what has driven the rapid expansion of regional trade and production
sharing in ESSEA. We have argued that production sharing is basically an inter-firm
operation, initially driven by changes in the policies of the government of Japan, the Japanese
TNCs and the governments of the East Asian countries themselves.
As the low-income countries have a common production and export structure, they have
little prospects for expanding intra-regional trade. Such an expansion is to be policy-driven. It
can be enhanced through industrial collaboration among themselves for building up their
supply capacity. There is also a need for cooperation, coordination and harmonization of their
development and industrial policies with a view to achieve dynamic comparative advantage.
Further, it is also in the interests of China, and other “market seekers” (NIEs), to provide them
with adjustment assistance, building up their supply capacity, skills, training facilities, and
back-up services, etc.
Another area for enhanced cooperation is R&D and technological capacity building by
China and the second-tier NIEs for upgrading their industrial structure.
The idea is to develop complementarity through the division of labour and
specialization in different products and industries. By specialization and division of labour

40
through industrial collaboration and/or cooperation in R&D, developing countries can
overcome scarcity in complementary factors of production, and benefit from larger markets
and scale economies. Instead of trade leading to division of labour specialization,
specialization and division of labour, in accordance with the principle of dynamic
comparative advantage, is to lead to trade. The expansion of supply capabilities and S-S trade
could, in turn, reduce the risk of dependence on markets of developed countries and improve
their bargaining position in multilateral forums as well as in their bilateral trade relations with
the developed countries. % Value
References
Agatiello, O. R. (2007), “Is South-South Trade the Answer to Bringing the Poor into the Export Process?” Paper presented at the UNCTAD Expert Meeting on Participation of Developing Countries in New and Dynamic Sectors of World Trade: The South-South Dimension, Geneva, 16–17 October 2007.
Akamatsu, K. (1961), “A Theory of Unbalanced Growth in the World Economy,”
Welwirtschaftliches Archiv-Review of World Economics, 86, pp. 3-25. Akyüz, Y. (2010), “Export Dependence and Sustainability of Growth in China and The East
Asian production Network”, South Centre, Geneva, Research Paper, No. 27. Amsden, A.H. (1989), Asia's Next Giant: South Korea and Late Industrialization, New
York: Oxford University Press. Anderson, J. (2007), “Is China Export-Led?” UBS Investment research, Asian
Focus, 26 September, available at www.ubs.com/economics. Athukorala, P-C, and J. Menon (2010), “Global Production Sharing, Trade Patterns, and
Determinants of Trade Flows in East Asia”, Asian Development Bank, Working Paper series on Regional Economic Integration, No.41.
Baier, S., J.H. Bergstrand, and E. Vidal (2007), “Free Trade Agreements in the Americas: Are the Trade Effects Larger than Anticipated?” World Economy, 30 (9), pp. 1347-77.
Bhagwati, J. (1993), “Regionalism and Multilateralism,” in J. de Melo, and A. Panagariya
(eds), New Dimensions in Regional Integration, Cambridge: Cambridge University Press, for Centre for Economic Research.
Bergsten, F. (2008), “ Trade has saved America from recession”, Financial Times,
41
July 1.
Cernat, L. (2003). “Assessing South-South Regional Integration: Some Issues, Many Metrics”, UNCTAD, Policy Issues in International Trade and Commodities, Study Series no. 21, Geneva: UNCTAD.
Cernat, L., and S. Laird (2007), “North, South, East, West: What’s Best? Modern RTAs and
Their Implications for the Stability of Trade Policy”, CREDIT Research Paper no. 03/11, Centre for Research in Economic Development and International Trade (CREDIT), School of Economics, Nottingham: University of Nottingham.
Cline, R.W. (1983), “Trade Policy in the 1980s”, Washington, DC: Institute for International
Economics. Choonsik, Y., and Jong-woo, C. (2010), “Asia faces risk from rising capital flows: IMF”,
available at: http/finance.yahoo.com/news/Asia-faces-risks-from-rising-rb-13. Corden, W.M. (1993), “Round Table Discussion,” in J. de Melo, and A. Panagariya (eds),
New Dimensions in Regional Integration, Cambridge: Cambridge University Press, for Centre for Economic Research, pp. 457-60.
de Melo, J., and A. Panagariya (1993), New Dimensions in Regional Integration, Centre for
Economic Research Cambridge: Cambridge University Press. ECLA (Economic Commission for Latin America) (1950), The Economic Development of
Latin America and its Principal Problems, New York: United Nations. Fan, P., and C. Watanabe (2006), “Promoting Industrial Development through Technology
Policy: Lessons from Japan and China”, Technology in Society, 28, pp. 303-20. Fischer, A. M. (2010), “Is China Turning Latin? China’s balancing Act Between Power and
Dependence on the Wave of globalization”, International Institute of Social Studies, Hague, working Paper, No. 496.
Gallagher, K., and M. Shafaeddin (2010), Policies for Industrial Learning in China and
Mexico: Technology in Society, forthcoming. Gallagher, K., and L. Zarsky (2007), The Enclave Economy: Foreign Investment and
Sustainable Development in Mexico’s Silicon Valley, Cambridge, MA: MIT Press. Greenaway, D., and C. Milner (1990), “South-South Trade, Theory, Evidence and Policy”,
The World Bank Research Observer, Vol. 5, No. 1, pp. 47-68. Haltmaier, J.T., Shaghil Ahmed, Brahima Coulibaly, Ross Knippenberg, Sylvain Leduc,
Mario Marazzi, and Beth Anne Wilson (2007). “The Role of China in Asia: Engine, Conduit or Steamroller”, Washington, DC: Federal Reserve System.
Hirschman, A.O. (1958), The Strategy of Economic Development, New Haven, CT: Yale
University Press.

42
Hirschman, A.O. (1968), National Power and the Structure of Foreign Trade. Berkeley: University of California Press.
Humphrey, J., and H. Schmitz (2006), “The Implications of China’s Growth for other Asian
Countries”, Sussex, UK: University of Sussex, Institute of Development Studies. Jongwanich, J. (2010), “Determinant of Export performance in East and Southeast Asia”, The
World Economy, pp. 20-41. Kaldor, N. (1972), “The Irrelevance of Equilibrium Economics”, Economic Journal, 8 (338),
pp. 1237-55. Kasahara, S. (2004), “The Flying Geese Paradigm: A Critical Study of Its Application to East
Asian Regional Development”, UNCTAD Discussion Paper no. 169, Geneva: UNCTAD.
Kawai, M., and G. Wignaraja (2007), “ASEAN+3 or ASEAN+6: Which Way Forward?”
Paper presented at the Conference on Multilateralizing Regionalism, sponsored and organized by World Trade Organization (WTO)-Graduate Institute of International Studies (HEI) and co-organized by the Centre for Economic Policy Research at WTO, Geneva, 10 September 2007.
Kim, S., J-W Lee, and C-Y Park (2009), “Emerging Asia: Decoupling or Recoupling”, Asian
Development Bank, Working Paper Series on regional Economic Integration, No. 31. _______ (2010), “The Ties that Bind Asia, Europe, and United State”, Asian development
Bank, Economic Working Series, No. 192. Kowaski, P. and B. Shepherd (2006), “South-South Trade in Goods”, OECD Trade Policy
Working Papers, No. 40, Paris: Organisation for Economic Cooperation and Development.
Kozluk, T., and M. Mehrotra (2008), “The Impact of Chinese Monetary Policy Shocks on
East Asia”, Bank of Finland, Institute for economies in Transition, Discussion paper, No. 5.
Kozo, K., Y. Sazanami and W. Yu Ching (2006), “Intra-regional Trade in Asia: Dynamics of
Product Sharing”, Working Paper, Yokohama: Yokohama National University. Lall, S. (2004), “Reinventing Industrial Strategy: The Role of Government Policy in Building
Industrial Competitiveness.” UNCTAD, G-24 Discussion Papers no. 28. Geneva: United Nations.
Lall, S. and Albaladejo, M. (2004), “China’s Competitive Performance: A Threat to East
Asian Manufactured Exports?” World Development, 32(9), pp. 1441-66. Lall, S. and M. Albaladejo and J. Zhang (2004), “Managing Fragmentation: Electronics and
Automobiles in East Asia and Latin America”, Oxford Development Studies, 32(3), September, pp. 407-432.

43
Liao, W., K. Shi and Z. Zhang (2010), “Vertical Trade and China’s Export Dynamics”, Hong Kong Institute for Economic Research, Working Paper, No. 10/2010.
List, F. (1856), The National System of Political Economy (translated into English by G.A.
Matile,), Philadelphia, PA: J. B. Lippincott & Co. Ma, A.C., A.V. Asschee and C. Hong (2009), “Global production Network and the People’s
Republic of China’s Processing Trade”, Asian Development Bank Institute, Working Paper No. 175.
Malhotra, K. (2006), “National Trade and Development Strategies: Suggested Policy
Direction”, Background paper prepared for the 2006 UNDP Human Development Report: Trade on Human Terms: Transforming Trade for Human Development in Asia and the Pacific, New York: United Nations Development Programme.
Moen, J. (1998), “Trade and Development: Is South-South Cooperation a Feasible Strategy?”
Paper Series 21, Bergen, Norway: Norwegian School of Economics and Business Administration.
Myint, H. (1958), “The Classical Theory of International Trade and Underdeveloped
Countries”, Economic Journal, 68. Reprinted in Livingstone, I. (1971), Economic Policy for Development, London: Penguin Books.
Ng, F. and A. Yeats (2003), “Major Trade Trends in East Asia: What Are Their Implications
for Regional Cooperation and Growth?” World Bank Policy Research Paper, Working Paper Series no. 3084, Washington, DC: World Bank.
Oman, C. (1994), Globalization and Regionalization: The Challenge of Developing
Countries, Paris: OECD. Prasad, E.S. (2009), “Rebalancing Growth in Asia”, Institute for the Study of Labour, Bonn, IZA Discussion Paper, No. 4298. Pizarro, J. and M. Shafaeddin (2010), “The Evolution of Value Added in Assembly
Operations; the Case of China and Mexico”, Journal of Chinese Economic and Business Studies, forthcoming, November 2010.
Prebisch, R. (1984), “Five Stages in My Thinking on Development,” in J.M. Mier and D.
Seers (eds), Pioneers in Development, Oxford: Oxford University Press. The Economist (2007), “China’s Economy: How fit is the panda?” 27 September. Sarkar, P. and H.W. Singer (1991), “Manufactured Exports of Developing Countries and
Their Terms of Trade since 1965”, World Development, Vol. 19 (4), pp. 333-40. Shafaeddin, M. (2005a), Trade Policy at the Crossroads: The Recent Experience of
Developing Countries, Basingstoke and New York: Palgrave Macmillan. _______(2005b), “Towards an Alternative Perspective on Trade and Industrial Policies.”
Development and Change, 36 (6), pp. 1143-62.
44
_______(2005c), “F. List and the Infant Industry Argument”, in K. S. Jomo (ed.), The
Pioneers of Development Economics, New Delhi: Tulika Books, and London and New York: Zed Books.
_______(2006a), “Is Industrial Policy Relevant in the 21st Century?” Keynote speech to the
plenary session of the International Conference on New Approaches to Design of Development Policies, Beirut, 20-21 March, organized by the Arab Planning Institute (published by the same Institute as a monograph).
_______(2006b), “Does Trade Openness Favour or Hinder Industrialization and Development?” A text of a paper presented at the Technical Group Meeting of the International Group of Twenty-Four on International Monetary Affaires and Development (G24) in Geneva during 16-17 March 2006, Third World Network, Geneva, Trade and Development Series, No. 31.
_______(2008), South-South Regionalism and Trade cooperation in the Asia-Pacific Region,
UNDP, Colombo, Regional Centre in Colombo. South Centre (1996), Enhancing South-South Trade, Geneva: South Centre. Subramanian, A. and N.T. Tamirisa (2001), “Africa’s Trade Revisited”, IMF Working Paper
01/33, Washington, DC: International Monetary Fund. Thorbecke, W. (2008), “The effects of Exchange Rate Volatility on Fragmentation in East
Asia: Evidence from Electronics Industry”, Tokyo, RIETI, Discussion Paper Series No. 08-E-016.
UNCTAD (1986), South-South Trade and Finance: Strengthening the Weakest Link, New
York and Geneva: United Nations. _______(2007a), Trade and Development Report, 2007, New York and Geneva: United Nations. _______(2007b), World Investment Report 2007, New York and Geneva: United Nations. _______(2007c), Handbook of Statistics, 2006-2007, New York and Geneva: United Nations. Viner, J. (1950), “The Customs Union Issue”, Washington, DC: Carnegie Endowment for
International Peace. Walti, S (2009), “The Myth of decoupling”, Vox, available at
http://www.voxeu.org/index.plp?q=node/3814 Wishwanath, T.C. (2007), “South-South Cooperation: A Business Perspective on India’s
Engagement”, Presentation at the Expert Meeting on Participation of Developing countries in New and Dynamic Sectors of World Trade: the south-South Dimension, UNCTAD, Geneva, 16-17 October 2007.
World Bank (2000), Trade Blocs, New York: Oxford University Press.
45
_______(2009), “Global Economic crisis and Vertical Specialization in Developing Countries”, PREM notes, April.
Xing C. (2010), “Residual Wage Inequality in Urban China, 1995-2007”, IZA] Institute for
the Labour study Bonn] Discussion paper, No. 5003. Young, A.R. (1928), “Increasing Return and Economic Progress”, The Economic Journal,
December. Zebregs, H. (2004), “Intraregional Trade in Emerging Asia.” IMF Discussion Paper no.
PDP/04/1, Washington, DC: International Monetary Fund.
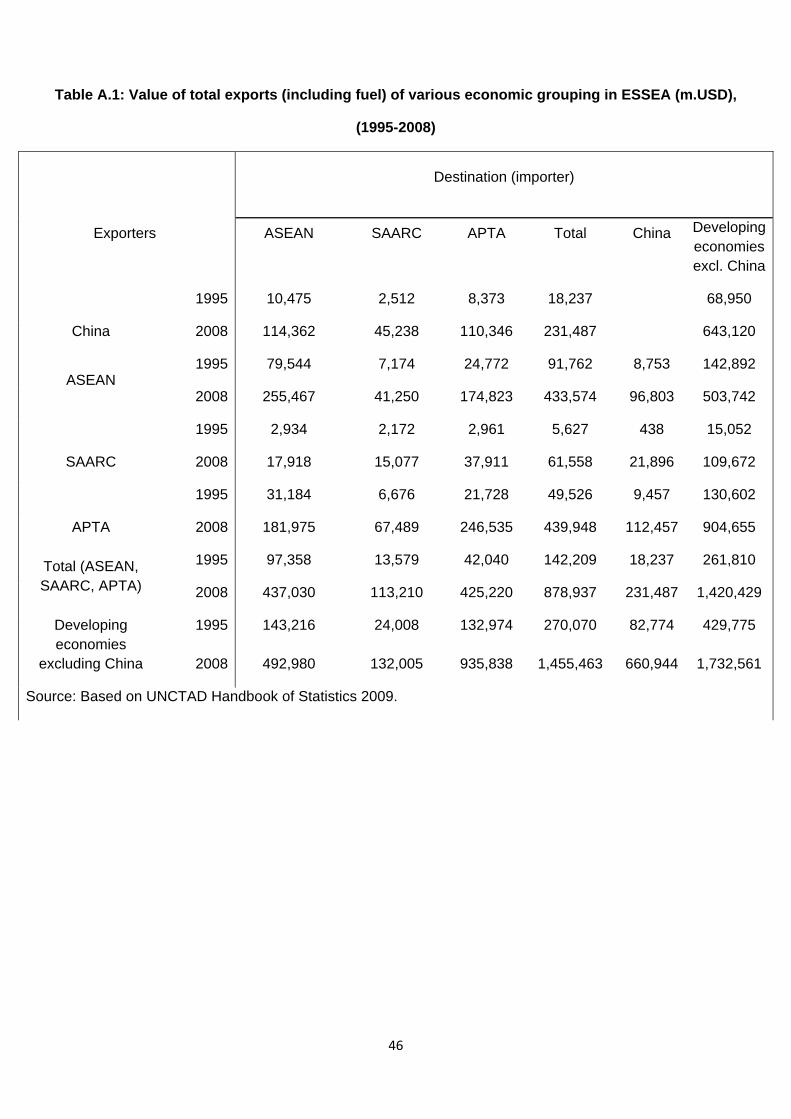
Table A.1: Value of total exports (including fuel) of various economic grouping in ESSEA (m.USD),
(1995-2008)
Destination (importer)
Exporters
ASEAN
SAARC
APTA
Total
China
Developing economies excl. China
1995 10,475 2,512 8,373 18,237 68,950
China 2008 114,362 45,238 110,346 231,487 643,120
1995 79,544 7,174 24,772 91,762 8,753 142,892 ASEAN
2008 255,467 41,250 174,823 433,574 96,803 503,742
1995 2,934 2,172 2,961 5,627 438 15,052
SAARC 2008 17,918 15,077 37,911 61,558 21,896 109,672
1995 31,184 6,676 21,728 49,526 9,457 130,602
APTA 2008 181,975 67,489 246,535 439,948 112,457 904,655
1995 97,358 13,579 42,040 142,209 18,237 261,810 Total (ASEAN, SAARC, APTA) 2008 437,030 113,210 425,220 878,937 231,487 1,420,429
1995 143,216 24,008 132,974 270,070 82,774 429,775 Developing economies
excluding China 2008 492,980 132,005 935,838 1,455,463 660,944 1,732,561
Source: Based on UNCTAD Handbook of Statistics 2009.
46

47
Table A.2: Trade of Hong Kong (SAR) in parts and components and corresponding finished goods, main SITC product 2008
Parts & components Finished products Imports Exports Balance Imports Exports Balance
Total world (US$million) 67884 76943 9059 100118 89129 -10989 ESSEA (US$million) 52561.0 62008.6 9447.6 82507 63588 -18919 Shares(%) China 59.38 67.68 11764 38.0 58.5 14079 Taiwan(province of China) 6.27 1.51 -3096.5 12.2 2.8 -9658 ASEAN 4 4.84 5.83 1195.4 13.0 3.2 -10103 Rep. of Korea 2.68 2.39 16.6 5.4 2.2 -3449 Rest of ASEAN 4.13 2.46 -913 13.5 3.5 -10481 India 0.11 0.69 456.1 0.3 1.1 694 SAARC (excl. India) 0.02 0.5 23.4 0.0 0.2 161 Total ESSEA 77.43 80.59 9448.6 82.4 71.3 -18919 Japan 13.80 4.21 -6125.5 7.4 3.3 -4495 Others 8.78 15.20 5737.8 1.2 25.4 12480 Total world 100 100 9059 100 100 -10989 Sources: Calculated by the author, based on UN, COMTRADE Database.
1 China rebounded to its pre-crisis levels in June 2010 when exports increased to $137 billion up from $117.3 billion in June of 2008, available at http//www.staribune.com/templates/fdcp, accessed on 11.07.2010. 2 The first attempt at regionalism was initiated in the 1660s by 12 provinces in the Paris Basin for political reasons (UNDP, 2005:18). 3 He, however, modified his theory later, first in 1958 when he regarded both import substitution and export expansion as parts of a long-term dynamic trade policy. 4 Based on the same sources as table A.2 5 According to Kim, intra-regional correlation of East Asian countries increased from zero during the 1990s to 0.448 during 2000-August 2009. When China is excluded, the relate figures are 0.007 and 0.446. 6 This is so, despite the fact that its share in total imports from ESSEA has declined as mentioned before. 7 ADB Newsletter, 22 November, available at http//www.adb.org/media.