the role of ccs as a mitigation technology and challenges ... · the role of ccs as a mitigation...
TRANSCRIPT

The Role of CCS as a Mitigation Technology and Challenges to
its Commercialization
by
Sadia P. Raveendran
B.A. Physics & Economics Wellesley College, 2009
Submitted to the Engineering Systems Division
in Partial Fulfillment of the Requirements for the Degree of Master of Science in Technology & Policy
at the
Massachusetts Institute of Technology
June 2013
© 2013 Massachusetts Institute of Technology. All rights reserved.
Signature of Author ………………………………………………………….......................
Technology and Policy Program, Engineering Systems Division May 10, 2013
Certified by …………………………………………………………...................................
Howard J. Herzog Senior Research Engineer, MIT Energy Initiative
Thesis Supervisor
Accepted by …………………………………………………………..................................
Dava J. Newman Professor of Aeronautics & Aeronautics and Engineering Systems
Director, Technology and Policy Program

2

3
The Role of CCS as a Mitigation Technology and Challenges to its Commercialization
by Sadia Raveendran
ABSTRACT
Greenhouse gases are being emitted at an increasing rate, which may cause irreversible damage to the earth’s climate. Considering the magnitude of CO2 emissions from industrial facilities and power plants, carbon capture and storage (CCS) is expected to play an important role in mitigating climate change. The estimated contribution of CCS to a given emissions reduction target depends on assumptions made about various factors such as the availability of the technology, the availability of substitutes such as nuclear technology, and the stringency of emissions reduction targets. Given that the global energy economy has largely been operating in “business as usual” mode, the effective implementation of a carbon policy is likely to be delayed. In addition, other trends in the energy sector such as the availability of inexpensive gas-based generation and the uncertainty related to nuclear capacity expansion may also have an impact on the role of CCS. Part A of this thesis analyzes the importance of CCS as a mitigation technology under different future policy responses and incorporating these current trends.
Using the Emissions Prediction & Policy Analysis (EPPA) model developed by the Joint Program on the Science & Policy of Global Change at the Massachusetts Institute of Technology (MIT), the study finds that the more stringent the emission caps, the more important the role of CCS becomes. In addition, the role of natural gas based generation is found to be transitional in its contribution to emissions reduction. Consequently, the availability of inexpensive gas-based generation does not eliminate the need for CCS towards the end of the century. Furthermore, advanced nuclear technology and CCS are found to be close substitutes for technologies that serve the needs of a low-carbon economy in the latter half of the century. The role of one technology, therefore, is in part determined by how technological development and cost reduction occurs in the other.
Part B of this thesis focuses on challenges experienced in the current demonstration phase
of CCS technology development. Most demonstration projects are typically supported by a combination of policy incentives such as grants, investment tax credits, production tax credits, loan guarantees, or additional sources of revenue. Regardless, many of these demonstration projects have been cancelled in the recent past primarily due to poor project economics. A financial model was developed and used to analyze the impact of each of these policy incentives on project economics. In addition, case studies have been conducted on two major demonstration projects: ZeroGen (Australia) and the Kemper Country (USA).
The study finds that even with the combined impact of all incentives, first-of-a-kind CCS
plants are not economical when compared to supercritical pulverized coal plants. CCS and similar low carbon technologies are also facing increasing economic pressure from cheaper natural gas-based electricity. These factors, in addition to endogenous risks associated with first-of-a-kind plants, are likely to deter potential developers. Therefore, CCS demonstration plants may require other policy mechanisms such as a rate-based pay that allow costs to be passed on to consumers. Policymakers may need to consider the distributional impacts of such a mechanism because costs are borne by consumers within a particular jurisdiction whereas the benefits of commercializing CCS accrue to a larger group of consumers. Regardless, incurring costs in the short-term may be inevitable to ensure the availability of CCS as a competitive, longer-term low carbon technology option.

4

5
ACKNOWLEDGEMENTS My research at the MIT Energy Initiative (MITEI) gave me the opportunity to learn more about the conventional electric power sector. Understanding the interplay between different energy technologies and the challenges arising from the differences between them has been incredibly rewarding. I wish to express my sincerest gratitude to my advisor Howard Herzog and the Carbon Sequestration Initiative for the opportunity to pursue a degree in Technology & Policy (TPP) and further my research interests. I could not have asked for a better advisor to guide me through this journey. You constantly encouraged me to think critically, develop my knowledge base, and deliver my best. You taught me how to delve into the details without losing focus on the bigger picture. I am, therefore, inspired to become the kind of leader envisioned in the mission of the TPP.
I also wish to express my gratitude to John Parsons at the Sloan School of Management for helping me understand financing and risk management at a fundamental level. These were abstract concepts that I learned on the job, and I now have a strong base that I can build upon. I am grateful for the many conversations that we had during my time at TPP. My sincerest thanks also to Chris Greig at the University of Queensland and Richard Esposito at Southern Company for helping me better understand the projects that I investigated in this thesis. I also wish to thank several members of the Joint Program at MIT, especially Niven Winchester for his invaluable guidance in helping me work with the EPPA Model. I am also grateful to Sergey Paltsev, Henry Chen, David Ramberg, Paul Kishimoto, and Jennifer Morris for being so forthcoming with my many questions. Thanks are also due to the organizing teams of the 2011 and 2012 EPPA Workshops for doing an incredible job with initiating novices like me into using the model.
My fellow group members in the Carbon Sequestration Research Group at MITEI
have been a tremendous source of support. Thank you Jan Eide, Cristina Botero, Amanda Cuellar, Anna Delgado, and Rob Brasington. I am also grateful to Mary Gallagher for being extremely helpful, and going out of your way when needed. My experience at MITEI would not have been the same without your support. Thank you Ed Ballo, Krista Featherstone, and Barbara DeLaBarre for your support and friendship. A special thank you to my friends Rahul Dash, Tanya Gupta, Apoorv Gehlot, Saba Sulaiman, Sangeetha Ramesh, Sabina Sayeed, Lin Lee Cheong, Euclid Moon, and Bina Ajay for cheering me on when I needed it the most.
I dedicate this thesis to my parents and my sister. I would not have made it this far
without your support, and I cannot thank you enough for everything that you have done for me. I hope to continue to make you proud.

6
TABLE OF CONTENTS
LIST OF TABLES .............................................................................................................. 9
LIST OF FIGURES .......................................................................................................... 10
LIST OF ACRONYMS & UNITS ................................................................................... 12
1. INTRODUCTION ........................................................................................................ 15
PART A: Analysis of CCS in a Carbon Mitigation Portfolio ..................................... 19
2. REVIEW OF RESULTS FROM INTEGRATED ASSESSMENTS ........................... 19
2.1 Role of CCS in a carbon mitigation portfolio ..................................................... 19
2.2 Costs associated with different mitigation portfolios ......................................... 24
2.3 Timing of CCS technology ................................................................................. 25
3. DESCRIPTION OF THE EPPA MODEL .................................................................... 27
3.1 Emissions Prediction & Policy Analysis (EPPA) Model ................................... 27
3.2 Mitigation & other technologies for electricity generation................................. 28
3.3 Updating markup factors..................................................................................... 31
3.4 Construction of base case scenarios .................................................................... 33
4. RESULTS FROM ANALYSIS USING EPPA ............................................................ 37
4.1 Base case policy scenarios .................................................................................. 37
4.2 Exclusion of advanced nuclear as a mitigation technology ................................ 41
4.3 Exclusion of advanced nuclear and inexpensive gas-based generation .............. 44
4.4 Global electricity-mix and its evolution ............................................................. 47
4.5 Policy implications.............................................................................................. 48
PART B: Analysis of CCS Project Economics ............................................................. 50
5. STATUS & COSTS OF CCS DEMONSTRATION PROJECTS ................................ 50
5.1 State of CCS technology development ............................................................... 50
5.2 Factors contributing to economics of CCS demonstration projects.................... 52
5.3 Nth-of-a-kind (NOAK) & first-of-a-kind (FOAK) estimates of project costs ... 54
5.4 RAND study & relevant results .......................................................................... 56
6. ZEROGEN – A CASE STUDY IN COST ESCALATION ......................................... 60

7
6.1 Project history ..................................................................................................... 60
6.2 Results of the pre-feasibility study ..................................................................... 61
6.3 Storage uncertainty & related cost implications ................................................. 63
6.4 Conclusions from the case study......................................................................... 64
7. DEVELOPING THE FINANCIAL MODEL ............................................................... 66
7.1 Construction of the financial model .................................................................... 66
7.2 Incentives built into the model ............................................................................ 70
7.3 Base case assumptions ........................................................................................ 72
7.4 Verification of the model .................................................................................... 74
8. RESULTS FROM ANALYSIS ON PROJECT ECONOMICS ................................... 75
8.1 Updating economic parameters........................................................................... 75
8.2 Analyzing generic estimates of FOAK costs ...................................................... 76
8.3 Analyzing the impact of incentives..................................................................... 78
8.3.1 Impact of incentives on SCPC plants ........................................................... 78
8.3.2 Impact of incentives on IGCC plants ........................................................... 79
8.3.3 Impact of incentives on NGCC plants .......................................................... 80
8.4 Discussion & policy implications ....................................................................... 81
9. KEMPER COUNTY – A CASE OF A SUCCESSFUL PROJECT ............................. 84
9.1 Project description .............................................................................................. 84
9.2 Regulatory support – federal and state-level ...................................................... 85
9.3 MSPUC V. Sierra Club ....................................................................................... 86
9.4 Financial analysis & details on EOR arrangement ............................................. 89
9.5 Conclusions of this case study ............................................................................ 93
10. POLICY DISCUSSION.............................................................................................. 95
10.1 Analysis of the state of CCS development ....................................................... 95
10.2 Short-term outlook ............................................................................................ 96
10.2.1 RD&D spending & other policy drivers .................................................... 96
10.2.2 Current trends in the energy sector ........................................................... 97
10.2.3 Technology-specific risk factors ................................................................ 98
10.2.4 Passing costs onto consumers .................................................................... 99

8
10.3 Policy recommendations ................................................................................. 100
11. BIBLIOGRAPHY ..................................................................................................... 103
12. APPENDICES .......................................................................................................... 113
APPENDIX A: Evolution of fuel-mix in energy in various regions of the world .. 113
APPENDIX B: EPPA Model – Details .................................................................. 117
APPENDIX C: Global Electricity Mix ................................................................... 118
APPENDIX D: Monetary & non-monetary reasons for cancellation/uncertainty .. 123
APPENDIX E: Studies on generic FOAK estimates .............................................. 126
APPENDIX F: Estimated Costs of Demonstration Projects................................... 128

9
LIST OF TABLES Table 1: Mitigation potential as a function of costs of CO2 avoided ................................ 21
Table 2: Markup factors used for analysis ........................................................................ 32
Table 3: Differences between cases analyzed ................................................................... 37
Table 4: Funding of demonstration projects in the U.S. ................................................... 51
Table 5: DOE's CCPI Round III Projects ......................................................................... 52
Table 6: Nth-of-a-kind costs of power plants with and without CCS............................... 55
Table 7: Input Sheet - Model ............................................................................................ 66
Table 8: Base case data sourced from DOE baseline study .............................................. 72
Table 9: Verification of the model .................................................................................... 74
Table 10: Updating Economic Parameters ....................................................................... 75
Table 11: FOAK Costs for plants with CCS ..................................................................... 77
Table 12: Cost of CO2 avoided (in $/tCO2) ...................................................................... 82
Table 13: Kemper County - Assumptions for Economic Analysis................................... 89
Table 14: Structure of the EPPA Model ......................................................................... 117
Table 15: Changing markup factors ................................................................................ 119
Table 16: Reasons for cancellation/uncertainty of Demonstration Projects ................... 123
Table 17: Analysis on FOAK Costs using GCCSI Estimates......................................... 126
Table 18: Estimated impact of the addition of CCS on COE ......................................... 127
Table 19: Estimated Costs for a Sample of Demonstration Projects .............................. 128

10
LIST OF FIGURES Figure 1: Carbon Emissions Reduction Pathway.............................................................. 16
Figure 2: Competitiveness of technologies determined by various costs ......................... 23
Figure 3: Mitigation/Abatement costs as a proportion of global GDP (for 400 ppm) ...... 24
Figure 4: Mitigation/Abatement costs as a proportion of global GDP (for 550 ppm) ...... 25
Figure 5: Structure of electricity sector in EPPA .............................................................. 30
Figure 6: Structure of bioelectric, wind, and solar technologies ...................................... 30
Figure 7: Structure of storage technologies ...................................................................... 31
Figure 8: Policy response I - Floating Emissions Caps .................................................... 35
Figure 9: Policy Response II - Strict Emission Caps ........................................................ 36
Figure 10: Generation from CCS – Case 1a ..................................................................... 38
Figure 11: Shadow Carbon Price – Case 1a...................................................................... 39
Figure 12: Generation from CCS – Case 1b ..................................................................... 40
Figure 13: Shadow Carbon Price – Case 1b ..................................................................... 41
Figure 14: Generation from CCS – Case 2a ..................................................................... 42
Figure 15: Generation from CCS – Case 2b ..................................................................... 43
Figure 16: Shadow Carbon Price – Case 2a...................................................................... 44
Figure 17: Shadow Carbon Price – Case 2b ..................................................................... 44
Figure 18: Generation from CCS – Case 3a ..................................................................... 45
Figure 19: Generation from CCS – Case 3b ..................................................................... 45
Figure 20: Shadow Carbon Price – Case 3a...................................................................... 46
Figure 21: Shadow Carbon Price – Case 3b ..................................................................... 47
Figure 22: Sample of CCS demonstration projects and their statuses .............................. 53
Figure 23: Estimated cost of demonstration projects as a function of capacity ................ 56
Figure 24: Escalation of Capital Costs.............................................................................. 61
Figure 25: Cumulative Impact of Incentives on FOAK SCPC plants with CCS.............. 79
Figure 26: Cumulative Impact of Incentives on FOAK IGCC plants with CCS .............. 79
Figure 27: Cumulative Impact of Incentives on FOAK NGCC plants with CCS ............ 80
Figure 28: Cumulative Impact of Incentives for FOAK NGCC Plants (Coal/gas parity) 81
Figure 29: Impact of Incentives on COE of Kemper County ........................................... 91
Figure 30: Parity between EOR Price & Capital Cost of Pipeline ................................... 92

11
Figure 31: Historical capacity additions - By technology type......................................... 98
Figure 32: Electricity Generation and fuel-mix in North America ................................ 113
Figure 33: Electricity generation & fuel-mix in Central and South America ................. 114
Figure 34: Electricity generation & fuel-mix in the Middle East ................................... 114
Figure 35: Electricity generation & fuel-mix in OECD Europe ..................................... 115
Figure 36: Electricity generation & fuel-mix in Non-OECD Asia ................................. 115
Figure 37: Electricity generation & fuel-mix in Africa .................................................. 116
Figure 38: Global Electricity Mix - No Delay - Case 2a & 2b ....................................... 118
Figure 39: Global Electricity Mix - 10-year Delay - Case 2a ......................................... 118
Figure 40: Global Electricity Mix - 10-year delay - Case 2b ......................................... 119
Figure 41: Global Electricity Mix - No Delay ................................................................ 120
Figure 42: Global Electricity Mix - 10-year delay – Case 1a ......................................... 120
Figure 43: Global Electricity Mix - 10-year delay – Case 1b ......................................... 121
Figure 44: Global Electricity Mix - No Delay – Case 3a & 3b ...................................... 121
Figure 45: Global Electricity Mix - 10-year delay – Case 3a ......................................... 122
Figure 46: Global Electricity Mix - 10-year delay – Case 3b ......................................... 122
Figure 47: Estimates of FOAK costs .............................................................................. 126
12
LIST OF ACRONYMS & UNITS List of Acronyms
ABARE Australian Bureau of Agriculture and Resource Economics
ACALET Australian Coal Association for Low Emission Technologies Limited
AEO Annual Energy Outlook
AEP American Electric Power
ARRA American Recovery & Reinvestment Act
AU$ Australian Dollar
BAU Business As Usual
BP British Petroleum
BSER Best System of Emissions Reduction
CCPI Clean Coal Power Initiative
CCS Carbon Capture and Storage
CCUS Carbon Capture Utilization and Storage
CES Constant Elasticity of Substitution
CGE Computable General Equilibrium
COE Cost of Electricity
CP Carbon Price
CWIP Construction Work In Progress
DOE Department of Energy
EGU Electricity Generating Unit
EIA Energy Information Administration
EIS Environment Impact Statement
EOR Enhanced Oil Recovery
EPA Environment Protection Agency
EPPA Emissions Prediction & Policy Analysis
ERCOT Electric Reliability Council Of Texas
ETA Emission Trading Allowances
ETP Energy Technology Perspectives
EUA Emission Unit Allowances
FEED Front End Engineering Design
13
FOAK First-of-a-kind
GDP Gross Domestic Product
GHG Greenhouse Gas
GCCSI Global CCS Institute
ICCSP Industrial CCS Projects
IEA International Energy Agency
IGCC Integrated Gasification Combined Cycle
IPCC Intergovernmental Panel on Climate Change
ITC Investment Tax Credit
LCOE Levelized Cost of Electricity
MHI Mitsubishi Heavy Industries
MPC Mississippi Power Company
MSPSC Mississippi State Public Services Commission
NACC North American Coal Corporation
NDT Northern Denison Trough
NETL National Energy Technologies Limited
NGCC Natural gas Combined Cycle
NOAK Nth-of-a-kind
NSPS New source performance standards
OECD Organization for Economic Cooperation and Development
O&M Operation & Maintenance
PISC Post injection site care
PTC Production Tax Credit
PUC Public Utilities Commission
R&D Research & Development
RD&D Research, Development, & Demonstration
RfP Request for proposals
RUS Rural Utilities Service
SAM Social Accounting Matrix
SBC Schlumberger Business Consulting
SCC State Corporate Commission

14
SCPC Supercritical Pulverized Coal
SMEPA South Mississippi Electric Power Association
SOP Standard Operating Procedure
SPV Special purpose vehicle
T&D Transmission & Distribution
TOC Total Overnight Costs
TRIG Transport Integrated Gasifier
TS&M Transport Storage & Monitoring
w/o without
List of Units
AU$ Australian dollar
bbl barrel of oil
Btu British thermal units
GtCO2 gigaton of CO2
mcf million cubic feet
MMBtu Million Btu
Mtpa Million tons per annum
MW Megawatt
MWh Megawatt-hour
km kilometer
kW kilowatt
kWh kilowatt-hour
lb pound
tCO2 ton of CO2
TgCO2 teragrams or million metric tons of CO2

15
1. INTRODUCTION According to estimates by the International Energy Agency (IEA), global CO2
emissions in 2011 reached a record high of 36.1 gigatons (GtCO2) with coal accounting
for 45% of total energy-related emissions followed by oil (35%) and natural gas (20%)
(IEA, 2012). This problem is exacerbated by the fact that the countries with the largest
emissions also have abundant reserves of fossil fuels such as coal and natural gas.
Furthermore, the extraction of fossil fuels is increasing through the application of new
technology to resources in the deep sea, shale rock, and oil sands. Therefore, in the
absence of regulatory intervention, emitters have no incentive to reduce the consumption
of these economically viable fuels. Consequently, greenhouse gases are being emitted at
an increasing rate, which may cause irreversible damage to the earth’s climate.
Pathways for carbon emissions reduction depend on the source of these
emissions; fuel efficiency standards are employed in the transportation sector, energy
conservation and efficiency initiatives are common in the commercial and residential
sectors, while carbon capture and storage (CCS) technology is targeted at stationary
sources such as power plants and industrial facilities using fossil fuels. Considering the
magnitude of CO2 emissions from industrial and power plants, CCS is expected to play
an important role in mitigating climate change. In the BLUE Map scenario developed by
the IEA, a 50% reduction in emissions by 2050 (compared to 2005) were projected to be
delivered by options as illustrated in Figure 1 (Fischedick et al., 2011).

16
Figure 1: Carbon Emissions Reduction Pathway (IEA, 2011)
The estimated contribution of CCS technology to a given emissions reduction
target depends on the assumptions made about various factors such as the availability of
the technology, the availability of substitutes such as nuclear technology, the stringency
of emissions reduction targets, and the development of renewable energy technologies. In
addition, many assumptions used to build scenarios in published studies may not hold
true when viewed in the context of current trends in the energy sector. For example,
while the results from these studies are predicated on the assumption that countries will
establish and enforce emissions reduction targets, only the European Union (EU) has
made significant progress to meet its goals under the Kyoto Protocol. Considering that
the global energy economy has largely been operating in “business as usual” (BAU)
mode, the focus of this thesis is to ascertain the importance of CCS as a mitigation
technology under different policy responses in the future.
Other trends in the energy sector may also have an impact on the role of CCS. It
may be argued that various mitigation technologies such as renewables are becoming
uncompetitive due to the availability of inexpensive gas-based electricity. Furthermore, in
a post-Fukushima world, industrial economies seem to be proceeding cautiously with
their plans to expand their nuclear capacity. The uncertainty related to nuclear capacity
expansion and the related costs (increasingly stringent safety standards and consequent
cost escalation) may result in a switch to fossil fuel-based plants with CCS for emissions

17
reduction. In Part A of this thesis, I examine how the role of CCS in a carbon
mitigation portfolio changes when current trends in the energy sector are accounted
for.
I use the Emissions Prediction & Policy Analysis (EPPA) model developed by the
Joint Program on the Science & Policy of Global Change at the Massachusetts Institute of
Technology (MIT) to build on the results of energy economic models while accounting
for the aforementioned trends in the energy sector. Chapter 2 highlights relevant results
from various top-down models on the importance of CCS technology under different
assumptions. Two kinds of policy responses that account for the delay in implementing a
comprehensive carbon policy represent the base case scenarios in EPPA, and these are
presented in Chapter 3. One scenario has more stringent targets in later years to
compensate for the lack of adequate regulatory intervention at present, and in the other
scenario no attempt is made to compensate for inadequate action at present, which results
in higher atmospheric concentrations of greenhouse gases. The results, including the
annual electricity generated from plants with CCS, the carbon price needed to support
relevant policy responses, and the technologies constituting the electricity mix are
presented in Chapter 4. I also analyze the sensitivity of these results to varying
assumptions about the availability of advanced nuclear technology and the cost of gas-
based electricity.
In Part B of this thesis, I analyze CCS as a mitigation technology from a
bottom-up perspective. Specifically, I examine financing and related challenges for
CCS demonstration projects. Many of these demonstration projects, that planned to
capture carbon dioxide (CO2) at the rate of over one million tons per annum (Mtpa), have
been cancelled in the recent past. For example, Jänschwalde, a project in Germany, was
withdrawn due to local opposition to the project based on environmental concerns. PGE,
a proponent of the Belchatow project in Poland, stated that it was in no position to
execute the project in the absence of incentives. Considering that the cost of capturing a
ton of CO2 at its pilot plant was approximately €60 – 65 while emission unit allowances
(EUAs) were trading at €6.53 per ton of CO2 (tCO2), additional support was needed to

18
bridge this gap (BusinessWeek, 2012). ZeroGen, a project in Australia, suffered from
escalating costs, with the project cost estimate increasing from AU$4.3 billion to
AU$6.93 billion.
Most demonstration projects are typically supported by a combination of grants,
investment tax credits, production tax credits, loan guarantees, or additional sources of
revenue. In Part B, I use a financial model to analyze the impact of each of these
policy incentives on project economics. The impact of these policy incentives is first
analyzed using data gathered from studies on generic power plants using CCS
technology. Then, I use data from specific projects to further investigate policy incentives
that contribute positively to the economics of a demonstration project. This section of the
thesis, therefore, analyzes specific cases of CCS demonstration projects - ZeroGen
(Australia) and the Kemper Country (USA) project are used as case studies.
The costs associated with CCS demonstration projects are catalogued in Chapter
5. The results from studies that attempt to explain why actual costs for plants that use a
new technology deviate significantly from initial or generic estimates are also presented
in this chapter. These cost estimates, along with other project data are used in the
financial model, which is described in Chapter 7. The impact of policy incentives is
analyzed and presented in Chapter 8 to delineate the factors that contribute positively to
the economics of a project versus the factors that may lead to a project’s cancellation.
Case studies on ZeroGen and the Kemper County projects are presented in Chapters 6
and 9 respectively.
The results from both the top-down and bottom-up approaches to analyzing CCS
technology may answer the following questions: Under what future carbon policies are
CCS integral to an emissions reduction strategy? To develop CCS as a mitigation
technology, how should the demonstration phase of CCS technology development be
supported? Relevant policy implications that emerge from the analyses in Part A and
Part B, and conclusions are discussed in Chapter 10.
19
PART A: Analysis of CCS in a Carbon Mitigation Portfolio
2. REVIEW OF RESULTS FROM INTEGRATED ASSESSMENTS In this chapter, results from integrated assessments on mitigation scenarios are
reviewed to estimate the contribution of CCS in achieving carbon emissions reduction
targets. Apart from the contribution of CCS relative to other technology options, the costs
associated with different mitigation portfolios are also presented. The uncertainty related
to the assumptions incorporated in these assessments translates to the uncertainty
regarding both the contribution and timing of CCS technology in a carbon mitigation
portfolio. A few important assumptions are discussed, and some conditions that may
negate their validity are also included in this chapter.
2.1 Role of CCS in a carbon mitigation portfolio
The estimated role of CCS technology in achieving targets of carbon emissions
reduction varies based on the assumptions used to build different scenarios. One such
assumption is the pace of development of CCS technology. The Australian Bureau of
Agriculture and Resource Economics (ABARE) global model1 that accounts for higher
energy prices and CCS opportunities estimates that CCS shall account for 4.4 GtCO2 of
greenhouse gas (GHG) emissions avoided in 2030, which represents a 17% reduction
from its reference base case (R.E.H. Sims et al., 2007). In contrast, the Energy
Technology Perspectives (ETP) report by the IEA estimated a 0.3 – 1.0 GtCO2
contribution by CCS with regard to GHG emissions avoided in 2030. These results are
consistent with the idea that the technology is to be demonstrated on a commercial scale
before it can be deployed widely (R.E.H. Sims et al., 2007).
Factors such as capital and operating costs for various technology options,
perceptions of how these costs are expected to evolve, and the inclusion of externalities
associated with carbon emissions (typically through a carbon price) determine the switch
to mitigation technology options (R.E.H. Sims et al., 2007). The uncertainty in the
contribution of each mitigation technology option to emissions reduction targets is 1 Based on an original version produced for the Asia Pacific Partnership - US, Australia, Japan, India, Korea

20
primarily determined by the uncertainty in two factors – the estimated cost of the
technology option and the effective carbon price. Table 1 below indicates the mitigation
potential, in percentage terms, of various technology options spread over a set of cost
ranges. The entries in these cost ranges take into account the estimated range of
mitigation costs associated with each option. To illustrate, CCS with coal and CCS with
gas are viable technology options for mitigation at cost ranges of $20 – 50/tCO2 avoided
and $50 – 100/tCO2 avoided respectively while nuclear may be viable at $20/tCO2
avoided or below. These numbers are based on the results presented in the Fourth
Assessment Report of the Intergovernmental Panel on Climate Change (IPCC) published
in 2007. Results from more recent studies are also presented in this chapter.

21
Table 1: Mitigation potential as a function of costs of CO2 avoided (R.E.H. Sims et al., 2007)
At this juncture, it is important to note that nuclear technology and CCS are
assumed to be close substitutes for base-load electricity generation in many scenarios of
integrated assessments, i.e. when one is not available, the majority of generation is
provided by the other rather than by renewable energy sources (Fischedick et al., 2011).
In a post-Fukushima world, there may be a higher level of uncertainty associated with the
costs of nuclear technology due to increasingly higher safety requirements and the
acceptability of the technology. It is, therefore, highly likely that the contribution of CCS
22
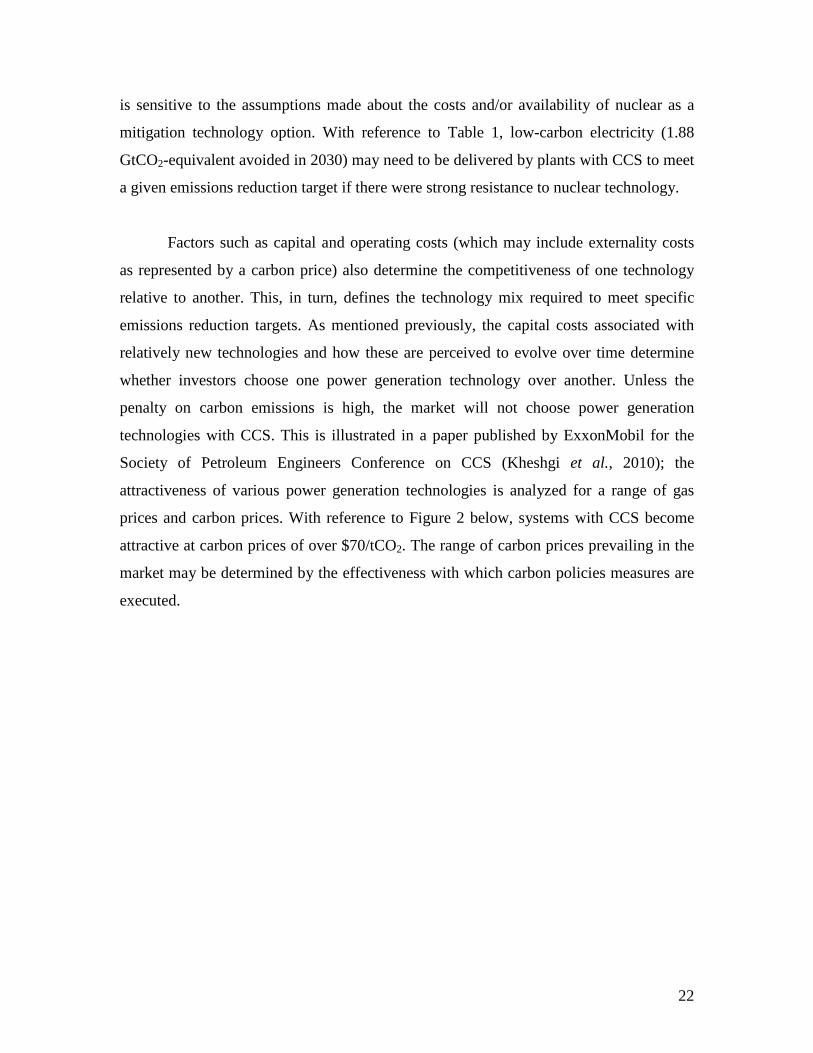
is sensitive to the assumptions made about the costs and/or availability of nuclear as a
mitigation technology option. With reference to Table 1, low-carbon electricity (1.88
GtCO2-equivalent avoided in 2030) may need to be delivered by plants with CCS to meet
a given emissions reduction target if there were strong resistance to nuclear technology.
Factors such as capital and operating costs (which may include externality costs
as represented by a carbon price) also determine the competitiveness of one technology
relative to another. This, in turn, defines the technology mix required to meet specific
emissions reduction targets. As mentioned previously, the capital costs associated with
relatively new technologies and how these are perceived to evolve over time determine
whether investors choose one power generation technology over another. Unless the
penalty on carbon emissions is high, the market will not choose power generation
technologies with CCS. This is illustrated in a paper published by ExxonMobil for the
Society of Petroleum Engineers Conference on CCS (Kheshgi et al., 2010); the
attractiveness of various power generation technologies is analyzed for a range of gas
prices and carbon prices. With reference to Figure 2 below, systems with CCS become
attractive at carbon prices of over $70/tCO2. The range of carbon prices prevailing in the
market may be determined by the effectiveness with which carbon policies measures are
executed.

23
Figure 2: Competitiveness of technologies determined by various costs (Kheshgi et al., 2010)
Low gas prices are likely to generate either or both of these responses –
generators choose to run their gas plants at higher capacity factors, and generators invest
in gas plants over coal plants. With the shale gas revolution increasing the supply of
inexpensive natural gas, both of these effects are observed; for the first time since the
Energy Information Administration (EIA) began collecting data, generation from gas was
essentially equal to that from coal in the U.S. in April 2012 (EIA, 2012), and no new
coal-fired power plants are under development. At low gas prices, gas-based power
generation systems (with and without CCS) are the clear choice for a wide range of
carbon prices, as illustrated in Figure 2 above. Supercritical coal-fired plants are
competitive with gas-based plants at a gas price of over $5 per million British thermal
units (MMBtu). If power generation plants are subject to a carbon price, the gas price at
which investment decisions tip in favor of supercritical coal-fired power plants increases
with an increase in carbon price. Given that the carbon intensity of coal-fired power
plants is higher than that of gas-based plants, these results are expected. Supercritical
coal-fired power plants with CCS are only competitive at high gas and high carbon
prices. There are considerations that complicate the above analysis. For example, gas

24
prices are traditionally volatile while coal prices are stable, which could help coal better
compete with gas.
2.2 Costs associated with different mitigation portfolios
The costs associated with different mitigation portfolios are examined in the
IPCC’s Special Report on Renewable Energy, and the results from various integrated
models are compiled and compared in this report (Fischedick et al., 2011). As illustrated
in Figure 3 below, to meet a carbon emissions standard of 400 ppm, which is arguably
impractical at this stage, the cheapest and most expensive mitigation portfolios are
determined by the role that biomass plays in energy supply. Limiting the role of nuclear
technology yields the second most expensive mitigation portfolio, but by less than half
the costs of a portfolio that limits the role of biomass. In these models, mitigation costs
are measured in terms of global gross domestic product (GDP) losses. Here, it is
important to note that an emissions standard of 400 ppm cannot be achieved without the
use of CCS or renewable energy in a carbon mitigation portfolio at any mitigation or
adaption cost. Evidently, the more stringent the emission caps, the more important the
role of CCS in a carbon mitigation portfolio.
Figure 3: Mitigation/Abatement costs as a proportion of global GDP (for 400 ppm) (Fischedick
et al., 2011)

25
Figure 4 below shows that a carbon emissions cap of 550 ppm can be achieved
without CCS. However, mitigation costs associated with a portfolio that excludes CCS is
the second most expensive portfolio after one that excludes renewable energy. In one
integrated model (MERGE) these costs are estimated at more than twice the costs of
portfolios that i) consider all options, ii) limit the role of nuclear technology, and iii) limit
the role of energy from biomass. In another model (POLES), a technology mix that
excludes CCS constitutes the most expensive portfolio; these abatement costs are
measured in terms of the percentage of global GDP needed to deliver a given target. In
these scenarios, mitigation is more expensive if CCS is not available.
Figure 4: Mitigation/Abatement costs as a proportion of global GDP (for 550 ppm) (Fischedick
et al., 2011)
2.3 Timing of CCS technology
Renewable energy technologies are expected to be the mainstay of the future
supply of energy enabled by significant advancements in the conversion efficiencies of
these technologies and in storage technology. In comparison, CCS is generally viewed as
a transitional technology; it was expected that CCS technology will be deployed
commercially from 2015 onwards, total capacity utilizing the technology will peak after
26
2050 as existing heat and power-plant stock is replenished, and deployment will decline
thereafter (R.E.H. Sims et al., 2007). In comparison, renewable energy is expected to
become the dominant low-carbon energy supply option by 2050 in the majority of
scenarios reviewed (164 scenarios from 16 different large-scale integrated models) in the
IPCC Special Report on Renewable Energy Sources and Climate Change Mitigation
(Fischedick et al., 2011). Some studies, however, suggest that there would be continued
expansion of CCS capacity even towards the end of the century after deployment starting
from 2015, and yet other studies suggest that there would be no significant use of CCS
technology until 2050 (R.E.H. Sims et al., 2007).
Differences in such results across studies may be attributed to differences in the
assumptions about interrelated factors such as the costs of CCS relative to other
technologies, how these costs evolve over time, the commercial availability of the
technology, the policy incentives established by various governments, and the emissions
reduction requirements that are imposed. To the latter point, it has been suggested that the
use of CCS technology could result in negative emissions (net removal of carbon-dioxide
from the atmosphere) when applied to biomass sources (R.E.H. Sims et al., 2007), and
therefore increase the attainability of low emission standards. As we continue operating
on BAU mode, CCS may arguably become increasingly relevant to attain even less than
ideal emission standards (550 ppm over 400 ppm for example).
The role of CCS may also be determined by how the fuel-mix of electricity is
expected to evolve in regions with the largest emissions. For example, coal-based
capacity is expected to play an increasing and significant role in supplying electricity in
non-OECD Asia through 2035 (refer Appendix A). Considering that coal-fired power
plants have a useful life of at least 40 years, the new capacity that will be added in 2035
may serve the region’s needs until 2075. Assuming that reducing carbon emissions will
continue to be important towards the end of the century, development of CCS technology
is essential to ensure continued growth in this region. Therefore, it may be argued that the
role of CCS is likely to be more than just transitional.

27
3. DESCRIPTION OF THE EPPA MODEL In this chapter, the EPPA Model, which is a computable general equilibrium
model (CGE), is described in detail. A description of how mitigation technologies
available to the electric power sector are modeled is included in this chapter, which
explains the factors that determine the competitiveness of one mitigation technology
relative to another. The construction of the base case scenarios that represent two kinds of
policy responses is explained in the latter half of this chapter.
3.1 Emissions Prediction & Policy Analysis (EPPA) Model (Palstev et al., 2005)
The EPPA model is a recursive-dynamic multi-regional general equilibrium
model of the world economy. It is designed to estimate economic growth and
anthropogenic emissions of GHG under BAU assumptions and under specific carbon
policies such as an emissions cap or carbon tax. Similar to other economic simulation
models that are categorized as CGE models, EPPA represents the circular flow of goods
and services in the economy. Capital and labor inputs flow from consumers to producers,
who, in turn, provide goods and services to consumers. Consumers make payments for
goods and services to producers, who, in turn, use revenues to provide returns to labor (in
the form of wages) and capital to consumers. The government acts as a passive entity to
ensure that savings by consumers are invested in producers, and that taxes collected by
the government are used for the consumers’ benefit.
The circular and closed nature of the model implies that all revenues generated in
each production sector are allocated to consumers as their return on capital or wages, to
intermediate producers, and/or to the government as taxes. Similarly, the costs of all
inputs, capital, and labor are reflected in the price of the good produced by a specific
sector. A basic feature of the EPPA model is the elasticities of substitution between
various inputs of production that allow producers to make tradeoffs between these inputs
in response to changes in price of these inputs, the availability of cheaper technology etc.
Similarly, consumers can substitute between goods and services when there are
exogenous shocks to the economy. For example, considering that a carbon policy
increases the price of fossil fuels, the degree to which the cost of production increases

28
depends on the share of energy as an input to production, the carbon content of energy
used, and the ability to substitute to less carbon-intensive inputs or technology. The
degree to which consumers’ are able to substitute goods or services that are more carbon
intensive to goods that are not, also depends on the elasticities of substitution between the
two goods and how the prices of these goods change as a result of the carbon policy.
Therefore, these elasticities of substitution are important determinants of the cost of
carbon policies such as a carbon price or emission caps.
Data that describe the economy of each region in the base year 1997 (refer
Appendix B for regions and sector represented in EPPA), including national income and
product accounts and data on inter-industry flows of goods and services, are used to
create Social Accounting Matrices (SAMs). These SAMs determine the structure of the
EPPA model. To capture the dynamics of the economy through time, EPPA assumes that
savings and investment are based only on the current period, and these are optimized
within a given period. The model also contains data on calorific values of various fuels
and their carbon emissions to determine which sectors are most affected by carbon
policies. Further, technological change, which is an important source of growth of any
given economy, is modeled in three ways: i) there is an exogenous augmentation of
supplies of capital and labor, ii) the energy use per unit output decreases exogenously
over time, and iii) the model includes a class of technologies referred to as backstop
technologies which are available for use when fossil fuel resources begin to deplete or
when a carbon policy increases the price of energy from fossil fuels. The solution to the
EPPA model is one that maximizes consumer welfare and producer profits subject to the
technologies of production, the availability of factors of production, and other constraints
imposed by policies such as a carbon price.
3.2 Mitigation & other technologies for electricity generation (Ereira, 2010)
Mitigation technologies (or backstop technologies) are available for use when
fossil fuel resources are depleted and/or when a carbon policy increases the cost of
existing technologies relative to mitigation technologies. The share of factor endowments
of capital, labor, land, fuel, and other factors that are required for production defines
29
these existing and mitigation technologies. In addition, mitigation technologies are also
defined by their mark-up, which are defined as the ratio of the levelized cost of electricity
(LCOE) for a given mitigation technology to the LCOE of traditional coal-fired
generation. The mark-up factors for mitigation technologies used in electricity production
are given in subsequent section. Together, the shares of various factor endowments and
the mark-up factors determine the competitiveness of one technology relative to another
as the price of inputs change.
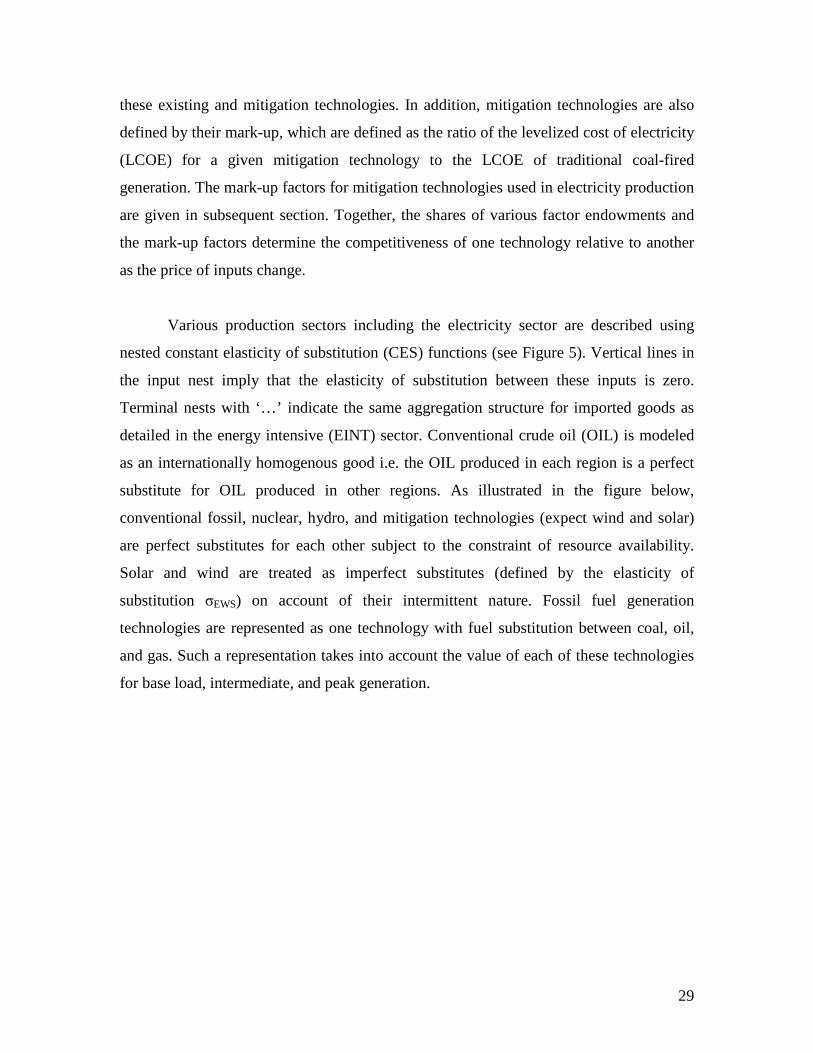
Various production sectors including the electricity sector are described using
nested constant elasticity of substitution (CES) functions (see Figure 5). Vertical lines in
the input nest imply that the elasticity of substitution between these inputs is zero.
Terminal nests with ‘…’ indicate the same aggregation structure for imported goods as
detailed in the energy intensive (EINT) sector. Conventional crude oil (OIL) is modeled
as an internationally homogenous good i.e. the OIL produced in each region is a perfect
substitute for OIL produced in other regions. As illustrated in the figure below,
conventional fossil, nuclear, hydro, and mitigation technologies (expect wind and solar)
are perfect substitutes for each other subject to the constraint of resource availability.
Solar and wind are treated as imperfect substitutes (defined by the elasticity of
substitution σEWS) on account of their intermittent nature. Fossil fuel generation
technologies are represented as one technology with fuel substitution between coal, oil,
and gas. Such a representation takes into account the value of each of these technologies
for base load, intermediate, and peak generation.
30
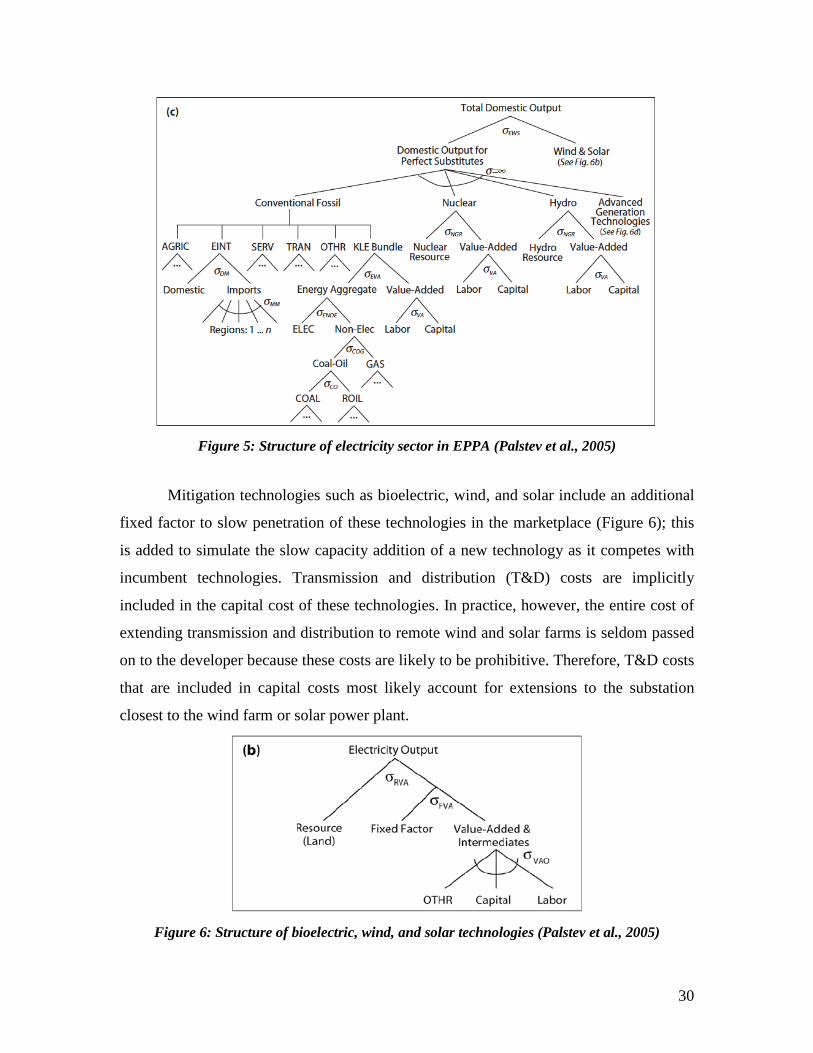
Figure 5: Structure of electricity sector in EPPA (Palstev et al., 2005)
Mitigation technologies such as bioelectric, wind, and solar include an additional
fixed factor to slow penetration of these technologies in the marketplace (Figure 6); this
is added to simulate the slow capacity addition of a new technology as it competes with
incumbent technologies. Transmission and distribution (T&D) costs are implicitly
included in the capital cost of these technologies. In practice, however, the entire cost of
extending transmission and distribution to remote wind and solar farms is seldom passed
on to the developer because these costs are likely to be prohibitive. Therefore, T&D costs
that are included in capital costs most likely account for extensions to the substation
closest to the wind farm or solar power plant.
Figure 6: Structure of bioelectric, wind, and solar technologies (Palstev et al., 2005)

31
Mitigation technologies that store carbon are described using the nested structure
in Figure 7. As mentioned earlier, the vertical lines for T&D and generation & storage
imply that the elasticity of substitution between theses inputs is zero. Similarly, the share
of inputs for fuel, generation, and storage cannot be substituted for one another. Carbon
permits and generation & storage are defined by elasticity of substitution σPT. The capture
rate, which is defined at 90% in the base year, is a variable. Together, these two factors
imply that the capture rate increases when the price of carbon permits increases relative
to the price of electricity because it becomes economical to capture more carbon. This
structure of the electricity sector and that of various mitigation technologies define how
the electricity mix changes in response to a carbon policy.
Figure 7: Structure of storage technologies (Palstev et al., 2005)
3.3 Updating markup factors
The methodology used to calculate the markup factors for mitigation or backstop
technologies is consistent with that in Morris et al. (2010). Data from the EIA’s Annual
Energy Outlook (AEO) 2013 Early Release (AEO, 2013) is used to derive these markup
factors. Data on overnight capital cost, fixed operation and maintenance (O&M) costs,
variable O&M, and heat rate are sourced from the AEO 2013 and presented in Table 2
below. The total capital requirement is estimated by accounting for escalation during the
period of construction. Assuming a discount rate of 8.5% and a project life of 20 years, a
capital recovery rate is calculated. This recovery rate is used to estimate the amount of

32
capital that is to be recovered annually. The assumptions of capacity factors are
consistent with those used in Morris et al. (2010). Fuel costs are also sourced from the
EIA; a 6-year average for the price of coal and natural gas is considered (EIA, 2012a).
The markup factors for natural gas based technologies are also calculated when the 3-
year average price is considered, which yields a value of $4.85/MMBtu versus
$6.27/MMBtu in the 6-year average case. The prices for uranium and biomass are
consistent with data in Morris et al. (2010).
The cost of CO2 transport, storage, and monitoring (TS&M) for CCS is
technologies estimated at $10/tCO2 in Hamilton (2009). This data is compared to a study
published by the DOE (2010), wherein CO2 TS&M costs are estimated, and presented in
terms of mills per kilowatt-hour (mills/kWh). When the DOE estimates were converted to
yield CO2 costs in $/tCO2 terms, the values were lower than $10/tCO2. Considering that
TS&M costs are subject to high variability on account of site-specific factors, the higher
value of $10/tCO2 is maintained for calculation of markup factors. Relevant escalation
factors were applied to reflect prices in 2011-dollar terms (BEA, 2013). The costs of
capital recovery, fixed and variable O&M, fuel, and TS&M are then calculated in $/kWh
terms, and added up to give total levelized costs. The ratio of the LCOE of each
technology in the table below to that of Pulverized Coal is calculated to determine the
markup factor associated with each technology.
Table 2: Markup factors used for analysis
Pulverized
Coal
NGCC NGCC with CCS
NGCC NGCC with CCS
IGCC with CCS
Advanced
Nuclear
Wind Biomass
"Overnight" Capital Cost ($/kilowatt (kW))
2883 1006 2059 1006 2059 3718 5429 2175 4041
Construction time (years)
4 3 3 3 3 5 5 2 4
Total Capital Requirement ($/kW)
3344 1127 2306 1127 2306 4462 7601 2349 4688
Fixed (f) O&M ($/kW)
30.6 15.1 31.2 15 31 50.5 91.7 38.9 103.8

33
Variable (v) O&M ($/kWh)
0.004 0.003 0.007 0 0 0.007 0.002 0.000 0.006
Project Life (years)
20 20 20 20 20 20 20 20 20
Capital Recovery Charge Rate (%)
10.6% 10.6% 10.6% 10.6% 10.6% 10.6%
10.6% 10.6%
10.6%
Capacity Factor (%)
85% 85% 80% 85% 80% 80% 85% 35% 80%
Operating Hours (hours)
7446 7446 7008 7446 7008 7008 7446 3066 7008
Capital Recovery Required ($/kWh)
0.047 0.016 0.035 0.016 0.0348 0.07 0.11 0.08 0.0707
Fixed O&M Recovery Required ($/kWh)
0.004 0.002 0.004 0.002 0.004 0.007 0.01 0.01 0.01
Heat Rate (Btu/kWh)
8740 6333 7493 6333 7493 7450 10452 0 13500
Fuel Cost ($/MMBtu)
1.94 6.27 6.27 4.85 4.85 1.94 0.72 0.00 1.17
Fuel Cost ($/kWh)
0.017 0.040 0.047 0.031 0.036 0.015 0.008 0.000 0.016
Cost of CO2 TS&M ($/kWh)
0.004 0.004 0.007
LCOE 0.073 0.061 0.097 0.052 0.086 0.103 0.130 0.094 0.107 Markup Over Coal
1.00 0.84 1.33 0.71 1.18 1.42 1.78 1.28 1.47
The base year in the EPPA model used for analysis is 1997. Therefore, all costs
were represented in 1997-dollar terms, and the markup factors were recalculated. They
were estimated to be the same as those indicated in Table 2.
3.4 Construction of base case scenarios
Despite efforts to mitigate climate change through the ratification of the Kyoto
Protocol, carbon emissions have been on the rise. It is, therefore, arguable that carbon
policy implementation is likely to be delayed i.e. countries shall continue to operate in
BAU mode and delay the effective implementation of carbon emission caps. Therefore,
to analyze the role of CCS in reducing carbon emissions, the current state of carbon

34
policy implementation needs to be accounted for. A representative emissions reduction
scenario is considered wherein emissions caps are implemented from the year 2010
onwards. To incorporate delay in policy implementation, two cases are considered –
implementation of emission caps are delayed by 10 years and 20 years i.e. they are only
implemented from the year 2020 or 2030 onwards. From these points of implementation,
two kinds of policy responses are considered:
Floating emission caps: Operating in BAU mode for 10 or 20 additional years implies
higher emissions in those periods when compared to emissions under the representative
scenario, which is defined as a ‘No Delay’ scenario. The first kind of policy response
does not attempt to compensate for inadequate action at present i.e. policymakers do not
attempt to reduce the impact of higher emissions in earlier periods by imposing stricter
caps in later periods. The 10-year or 20-year delayed emissions pathway represents a
fairly fixed deviation from the representative pathway starting from the point of
implementation. The emission caps under delays are constructed such that the ratio of the
emission cap in year ‘t+1’ to that in year ‘t’ is the same as that in the ‘No Delay’
scenario. The representative emissions pathway along with the ones representing a 10-
year or 20-year delay in implementing emissions caps are illustrated in Figure 8 below.
Under floating emission caps, emissions increase as the policy implementation is
delayed. This is apparent in Figure 8 below given that the area under the emissions curve
increases as the delay in implementation of emission caps increases from 10 years to 20
years. The costs associated with increasing emissions and related impacts, however, are
beyond the scope of the results presented in this thesis.

35
Figure 8: Policy response I - Floating Emissions Caps
Strict emission caps: In this policy response, an attempt is made to compensate for
higher emissions in earlier periods by imposing stricter emission caps in later periods.
The delayed emission pathways are constructed such that the total emissions under the
curve are the same for all emission pathways i.e. total emissions under all three curves
from 1997 to 2100 is the same. In order to ensure that i) total emissions remain the same,
and ii) the emissions pathways represent a reasonable version of a carbon policy, the
emission caps allow for initial increases and become progressively more stringent. It may
be argued that such a pathway accounts for the development of low carbon technologies
to make them more competitive with existing technologies. The representative emissions
pathway, along with those that pertain to 10 and 20-year delays in this policy response,
are illustrated in Figure 9 below.
0
2000
4000
6000
8000
10000
12000
14000
16000
18000
1997
2000
2005
2010
2015
2020
2025
2030
2035
2040
2045
2050
2055
2060
2065
2070
2075
2080
2085
2090
2095
2100
Car
bon
Em
issi
ons
(in m
mt)
No Delay
10-yeardelay
20-yeardelay

36
Figure 9: Policy Response II - Strict Emission Caps
0
2000
4000
6000
8000
10000
12000
14000
16000
18000
Carb
on E
mis
sion
s (in
mm
t)
No Delay
10-yeardelay
20-yeardelay

37
4. RESULTS FROM ANALYSIS USING EPPA The expected generation from CCS and shadow carbon prices under base case
policy scenarios (Case 1a and 1b), cases with the exclusion of advanced nuclear
technology (Case 2a and 2b), and cases with inexpensive generation from natural gas in
addition to the exclusion of advanced nuclear technology (Case 3a and 3b) are discussed
in this chapter. The conditions in cases 2 and 3 are created by rendering advanced nuclear
technology a non-viable option and by reducing the mark-up factors associated with
natural gas-based electricity to reflect 3-year average cost, see Table 2. All cases are
outlined in Table 3 below. Then, the global electricity-mix and its evolution are analyzed
for specific cases. The latter section of this chapter includes a discussion on limitations of
results and policy implications.
Table 3: Differences between cases analyzed
Assumptions built into case (Across)
Base Case No Advanced Nuclear
Inexpensive Gas-based Generation
Floating Emission Caps
Strict Emission Caps
Case 1a ✔ ✔ Case 1b ✔ ✔ Case 2a ✔ ✔ Case 2b ✔ ✔ Case 3a ✔ ✔ ✔ Case 3b ✔ ✔ ✔
The initial hypothesis of the role of CCS under these policy responses is – i) the
role of CCS is diminished when emissions caps are allowed to be less stringent, and ii) is
enhanced when any attempt is made to compensate for higher emissions in early periods.
This hypothesis is tested in the base case and under conditions of non-availability of
advanced nuclear technology and inexpensive electricity from natural gas.
4.1 Base case policy scenarios
In Case 1a, the amount of generation that needs to come from plants with CCS
reduces as policy implementation is delayed, see Figure 10. The generation reduces from
approximately 0.8 trillion kWh in 2100 in the ‘No Delay’ scenario to less than 0.5 trillion
kWh in the same year in the ‘20-year Delay’ scenario, which is a nearly 40% reduction.
The stringency of emission caps determines whether the market will substitute towards

38
clean energy technology options such as CCS. Therefore, the above result is expected
given that the emission caps become less stringent as implementation is delayed. CCS
enters the electricity mix in the latter half of the century, and therefore, may not play a
transitional role in an emission reduction strategy.
Figure 10: Generation from CCS – Case 1a
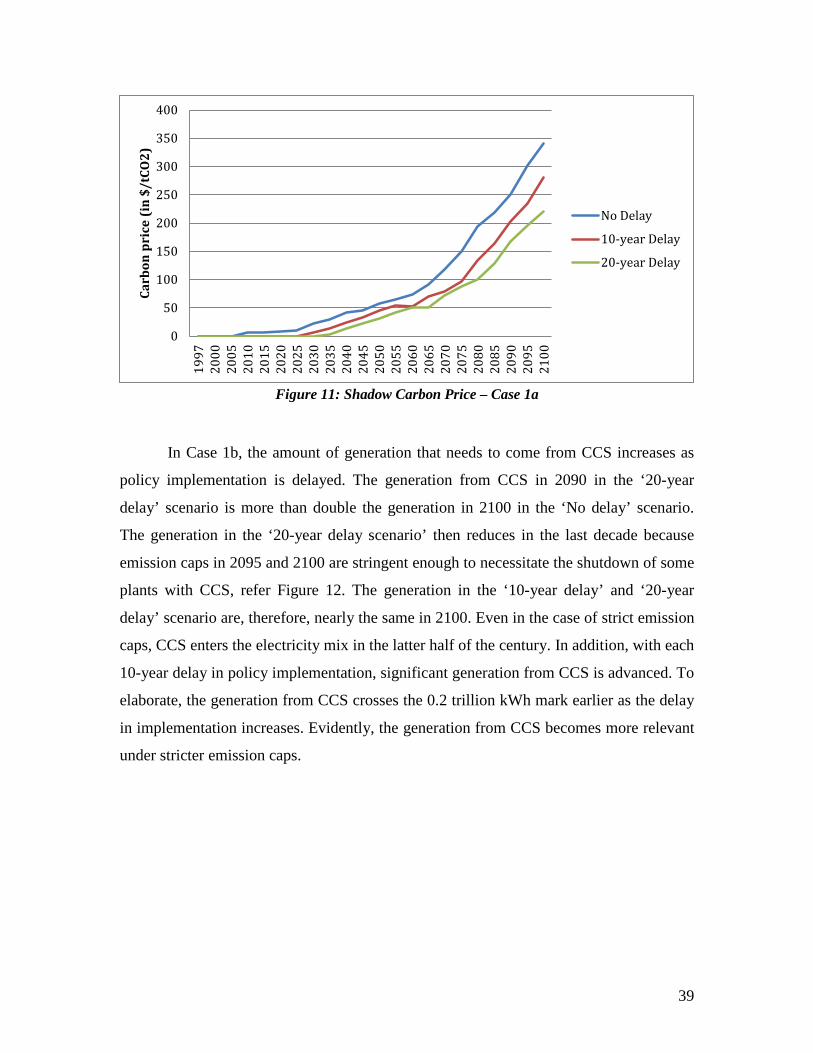
Given that the emission caps become less stringent, the shadow carbon price
needed to support these caps also reduces from the ‘No delay’ to the ‘20-year delay
scenario’ in Case 1a. With reference to Figure 11, the shadow carbon price is
approximately $340 and $220/tCO2 in 2100 in the ‘No delay’ and ‘20-year delay’
scenarios respectively. This represents a nearly 35% decrease in the shadow carbon price,
which renders CCS less competitive when compared to other mitigation technologies.
0.00.20.40.60.81.01.21.41.61.82.0
1997
2000
2005
2010
2015
2020
2025
2030
2035
2040
2045
2050
2055
2060
2065
2070
2075
2080
2085
2090
2095
2100
Gene
rati
on (i
n tr
illio
n kW
h)
No Delay
10-year Delay
20-year Delay
39
Figure 11: Shadow Carbon Price – Case 1a
In Case 1b, the amount of generation that needs to come from CCS increases as
policy implementation is delayed. The generation from CCS in 2090 in the ‘20-year
delay’ scenario is more than double the generation in 2100 in the ‘No delay’ scenario.
The generation in the ‘20-year delay scenario’ then reduces in the last decade because
emission caps in 2095 and 2100 are stringent enough to necessitate the shutdown of some
plants with CCS, refer Figure 12. The generation in the ‘10-year delay’ and ‘20-year
delay’ scenario are, therefore, nearly the same in 2100. Even in the case of strict emission
caps, CCS enters the electricity mix in the latter half of the century. In addition, with each
10-year delay in policy implementation, significant generation from CCS is advanced. To
elaborate, the generation from CCS crosses the 0.2 trillion kWh mark earlier as the delay
in implementation increases. Evidently, the generation from CCS becomes more relevant
under stricter emission caps.
0
50
100
150
200
250
300
350
400
1997
2000
2005
2010
2015
2020
2025
2030
2035
2040
2045
2050
2055
2060
2065
2070
2075
2080
2085
2090
2095
2100
Carb
on p
rice
(in
$/tC
O2)
No Delay
10-year Delay
20-year Delay

40
Figure 12: Generation from CCS – Case 1b
The shadow carbon price needed to support emission caps that get progressively
more stringent increases exponentially, as illustrated in Figure 13. This effect is observed
both in the ‘10-year delay’ and the ‘20-year delay’ scenarios. Here, it is important to note
that in the ‘20-year delay’ scenario, the emission cap in 2100 results in emissions that are
approximately half those in base year 1997. Therefore, the shadow carbon price needed
to support such a steep cut in emissions is likely to be high, about $8960/tCO2 in 2100. In
the ‘10-year delay’ scenario, the carbon price rises to about $1050/tCO2 in 2100. While it
is unlikely that such a steep cut in emissions is enforced, it is evident that compensating
for higher emissions in periods of no or ineffective policy becomes more expensive the
longer the delay in implementing a carbon policy.
0.0
0.2
0.4
0.6
0.8
1.0
1.2
1.4
1.6
1.8
2.0
1997
2000
2005
2010
2015
2020
2025
2030
2035
2040
2045
2050
2055
2060
2065
2070
2075
2080
2085
2090
2095
2100
Gene
rati
on (i
n tr
illio
n kW
h)
No Delay
10-year Delay
20-year Delay

41
Figure 13: Shadow Carbon Price – Case 1b
4.2 Exclusion of advanced nuclear as a mitigation technology
When advanced nuclear technology is excluded from a portfolio of mitigation
technologies, the generation from plants with CCS typically substitutes for generation
that would have come from advanced nuclear power plants. With reference to Figure 14,
the amount of generation that comes from plants with CCS increases by an order of
magnitude when advanced nuclear technology is excluded. In Case 2a, the generation
from CCS increases to nearly 30 trillion kWh in 2100 in the ‘No delay’ scenario. In the
‘No delay’ scenario in Case 1a, advanced nuclear supplies approximately 40 trillion kWh
in 2100. Therefore, CCS substitutes for a significant proportion of the generation that
would have come from advanced nuclear power plants. Furthermore, when deployment
of advanced nuclear capacity is curtailed, CCS technology enters the electricity mix
earlier than it does in Case 1a.
0
1000
2000
3000
4000
5000
6000
7000
8000
9000
10000
1997
2000
2005
2010
2015
2020
2025
2030
2035
2040
2045
2050
2055
2060
2065
2070
2075
2080
2085
2090
2095
2100
Carb
on p
rice
($/t
CO2)
No Delay
10-year Delay
20-year Delay

42
Figure 14: Generation from CCS – Case 2a
In Case 2b, the generation from CCS in all three scenarios is nearly the same at 25
trillion kWh by 2095. This implies that even though the entry of CCS in the electricity
mix is delayed in the ‘10-year delay’ and ‘20-year delay’ scenarios, plants with CCS may
need to contribute significantly to the electricity mix by the end of the century. In this
case, therefore, delaying implementation of policy implies that CCS capacity may need to
be ramped up faster to meet the prescribed emission caps. In addition, it is important to
note that when the generation from nuclear is curtailed, CCS needs to contribute at least
20 trillion kWh in 2100 regardless of whether policymakers choose strict or floating
emission caps, see Figure 14 and Figure 15.
0
5
10
15
20
25
30
1997
2000
2005
2010
2015
2020
2025
2030
2035
2040
2045
2050
2055
2060
2065
2070
2075
2080
2085
2090
2095
2100
Gene
rati
on (i
n tr
illio
n kW
h)
No Delay
10-year Delay
20-year Delay

43
Figure 15: Generation from CCS – Case 2b
With reference Figure 16 and Figure 17, the carbon prices needed to support caps
in Case 2a and 2b are very similar to those in the Case 1a and 1b respectively, with prices
being slightly higher when advanced nuclear technology is excluded. From these results,
the following inferences are made – i) emissions reduction is more expensive when there
are fewer low carbon technologies available and ii) advanced nuclear and CCS are close
substitutes for technologies that can meet the demands of low carbon energy economy.
Considering that endogenous factors that determine the competitiveness of one
technology vis-à-vis another are uncertain at this stage, it is difficult to make an argument
for investment in one technology over another. However, the availability of either as a
low carbon technology in the latter half of the century is contingent on investment in both
technologies in the present.
0
5
10
15
20
25
30
1997
2000
2005
2010
2015
2020
2025
2030
2035
2040
2045
2050
2055
2060
2065
2070
2075
2080
2085
2090
2095
2100
Gene
rati
on (i
n tr
illio
n kW
h)
No Delay
10-year Delay
20-year Delay

44
Figure 16: Shadow Carbon Price – Case 2a
Figure 17: Shadow Carbon Price – Case 2b
4.3 Exclusion of advanced nuclear and inexpensive gas-based generation
The generation from CCS in all scenarios in case 3a compared with those in case
2a is lower (see Figure 18 and Figure 14, respectively). Similar trends are observed when
0
50
100
150
200
250
300
350
400
1997
2000
2005
2010
2015
2020
2025
2030
2035
2040
2045
2050
2055
2060
2065
2070
2075
2080
2085
2090
2095
2100
Carb
on P
rice
(in
$/tC
O2)
No Delay
10-year Delay
20-year Delay
0
1000
2000
3000
4000
5000
6000
7000
8000
9000
10000
1997
2000
2005
2010
2015
2020
2025
2030
2035
2040
2045
2050
2055
2060
2065
2070
2075
2080
2085
2090
2095
2100
Carb
on P
rice
(in
$/tC
O2)
No Delay
10-year Delay
20-year Delay

45
Figure 19 and Figure 15 are compared for analysis on case 3b and case 2b. However, it is
important to note that i) the reduction across scenarios is no more than 20%, and ii) CCS
needs to contribute at least 20 trillion kWh in 2100 under most policy responses.
Therefore, while the use of inexpensive gas-based generation reduces the burden on CCS
technology, it does not eliminate the need for CCS in the latter half of the century.
Figure 18: Generation from CCS – Case 3a
Figure 19: Generation from CCS – Case 3b
0
5
10
15
20
25
30
1997
2000
2005
2010
2015
2020
2025
2030
2035
2040
2045
2050
2055
2060
2065
2070
2075
2080
2085
2090
2095
2100
Gene
rati
on (i
n tr
illio
n kW
h)
No Delay
10-year Delay
20-year Delay
0
5
10
15
20
25
30
1997
2000
2005
2010
2015
2020
2025
2030
2035
2040
2045
2050
2055
2060
2065
2070
2075
2080
2085
2090
2095
2100
Gene
rati
on (i
n tr
illio
n kW
h)
No Delay
10-year Delay
20-year Delay

46
When gas-based generation becomes inexpensive, the overall cost of emissions
reduction is expected to reduce because lower shadow carbon prices are needed to enable
deployment of natural gas combined cycle (NGCC) plants. However, when the
transitional gains in emission reduction from fuel switching delay the entry of other low
carbon technologies, the cost of reducing emissions may be higher. There is some
evidence of this effect when results on shadow carbon prices in Cases 2a and 3a (see
Figure 16 and Figure 20, respectively) are analyzed. The carbon prices in 2100 in the ‘No
Delay’ scenario and ‘10-year delay’ scenario are higher for a portfolio wherein gas-based
generation is cheaper. A similar trend is observed in cases 2b and 3b i.e. the carbon prices
in the same year in the ‘No delay’ and ‘10-year’ scenarios are higher in case 3b when
compared to case 2b (see Figure 17 and Figure 21, respectively).
Figure 20: Shadow Carbon Price – Case 3a
0
50
100
150
200
250
300
350
400
1997
2000
2005
2010
2015
2020
2025
2030
2035
2040
2045
2050
2055
2060
2065
2070
2075
2080
2085
2090
2095
2100
Carb
on P
rice
(in
$/tC
O2)
No Delay
10-year Delay
20-year Delay

47
Figure 21: Shadow Carbon Price – Case 3b
4.4 Global electricity-mix and its evolution
With reference to the markup factors derived using data in the AEO (2013) and
presented in Table 2, it is evident that NGCC is more economical when compared to
pulverized coal-based generation. Therefore, NGCC may displace fossil based generation
to become the dominant technology in a low carbon energy economy. This is supported
by trends observed the U.S. energy sector today – significant gas-based capacity is being
added and existing gas plants are being operated for longer hours. Analyzing the global
electricity mix and its evolution in the cases above may also help determine the role of
NGCC vis-à-vis other low carbon technologies.
The global electricity mix for the ‘No delay’ scenario (same for cases 2a and 2b),
and the ‘10-year delay’ scenario in cases 2a and 2b are presented in Figure 38, Figure 39,
and Figure 41 in Appendix C. The following trends emerge – i) inexpensive gas-based
generation is likely to displace fossil-fuel based generation, which is primarily coal-
based, and the degree of displacement is determined by the stringency of emission caps,
and ii) the role of inexpensive gas-based generation is likely to be transitional, and the
magnitude of its contribution is determined by the stringency of emission caps.
0
1000
2000
3000
4000
5000
6000
7000
8000
9000
10000
1997
2000
2005
2010
2015
2020
2025
2030
2035
2040
2045
2050
2055
2060
2065
2070
2075
2080
2085
2090
2095
2100
Carb
on P
rice
(in
$/tC
O2)
No Delay
10-year Delay
20-year Delay
48
Therefore, even with the availability of inexpensive gas-based generation, a low carbon
technology such as CCS or advanced nuclear is required to meet the demands of a low
carbon economy in the latter half of the century.
4.5 Policy implications
With reference to Appendix C, the contribution of one low carbon technology
compared to another in a low carbon electricity mix is sensitive to the markup factors
associated with these technologies. The uncertainty related to technology-specific factors
that determine a low carbon technology’s competitiveness translate into the uncertainty
related to its contribution to emissions reduction. Policymakers, therefore, have the
challenging task of making decisions under uncertainty to impact outcomes in the long-
term. By incorporating the most current information on costs and performance of various
low carbon technologies, an attempt has been made to better estimate the role of CCS vis-
à-vis other technology options.
On a related note, large-scale penetration of renewables is concomitant with
intermittency and related issues. While, contending with these challenges effectively may
require significant advancements in storage technology and grid operation, current levels
of penetration are managed through the use of significant reserve capacity. It is yet to be
determined how the regulations pertaining to electricity markets allocate these imposed
costs. Consequently, additional costs may be imposed on renewable capacity even if the
technology becomes competitive with technologies that can be dispatched. The true costs
of renewable generation, therefore, are difficult to estimate. Considering that the EPPA
model does not account for grid-level effects of adding renewable capacity, the
penetration of renewables is limited. Furthermore, it may be argued that the limited role
of renewables is consistent with the idea that technologies such as advanced nuclear or
CCS are more compatible with the electric power system without requiring many
significant changes to the way it is operated. While the impact of potentially disruptive
technologies cannot be ruled out, the analysis presented in this chapter incorporates
information available today.

49
As discussed earlier, the role of inexpensive gas-based generation is likely to be
transitional with a technology such as CCS or advanced nuclear meeting the demands of
low carbon economy in the latter half of the century. Therefore, it may be imperative that
the gains from fuel-switching are managed effectively, and resources be allocated to the
development of other low carbon technologies. Notwithstanding the limitations discussed
above, the role of CCS is estimated to be i) more important when emission caps become
more stringent, and ii) dominant in the latter half of the century if advanced nuclear
technology cannot be deployed on a large-scale. To ensure that a technology like CCS is
available as a viable option in the future, resources need to be allocated for its
development in the present.
50
PART B: Analysis of CCS Project Economics
5. STATUS & COSTS OF CCS DEMONSTRATION PROJECTS Considering that the development of CCS may be essential to meeting the
demands of a low carbon economy, especially in the latter half of the century, it is
imperative that the factors contributing to the success or cancellation of a demonstration
project be examined. This chapter is designed to provide sufficient background on the
analysis of the economics of demonstration projects through a case study-based approach.
First, the state of CCS development in various industrial countries or regions in the world
is outlined. Then, project cost estimates for power plants with CCS are collated from
various studies and compared to the estimates of ongoing demonstration projects. Insights
from a RAND study, which outlines the reasons for cost escalation in demonstration
projects using new technologies, may be applicable to CCS because the integration and
subsequent application of capture and storage technologies is yet to be demonstrated. As
cost escalation leading to poor project economics has been cited as an important reason
why projects were cancelled, a discussion on relevant results from the RAND study is
also included in this chapter.
5.1 State of CCS technology development
CCS is currently in the demonstration phase of technology development with
several projects under development and construction. The demonstration phase of
technology development typically is the most expensive stage of the innovation pipeline.
Apart from the capital-intensive nature of these projects, generators are limited by what
they are willing to invest at this stage because of the uncertainty in climate policy.
Therefore, government assistance to facilitate further development of the technology is
required. To that end, the United States Congress appropriated nearly $6 billion dollars
since FY’08 for CCS research, development, and demonstration (RD&D) at the
Department of Energy’s (DOE) Office of Fossil Energy; approximately $3.4 billion of
the above amount comes from the American Recovery & Reinvestment Act (ARRA) of
2009, and nearly all of the ARRA funds are allocated to demonstration projects as
indicated in Table 4 below (Folger, 2012). Projects are developed under three programs:

51
i) FutureGen, which is a large-scale demonstration project developed by a consortium of
leading power generators, ii) Clean Coal Power Initiative (CCPI), a DOE program that
supports large-scale power projects, and iii) Industrial CCS Projects (ICCSP) which
deploys CCS technology on industrial plants.
Table 4: Funding of demonstration projects in the U.S. (Folger 2012)
The experience from demonstrating CCS on power plants is more valuable
because power plants account for a significant proportion of CO2 emissions. In the US
alone, emissions from electricity generation accounted for over 40% of total emissions of
5439.3 teragrams (TgCO2) equivalent in 2010 (EPA, 2012). This, in turn, justifies greater
support for demonstration projects in the power sector. However, power projects are
more complex and therefore more expensive. Consequently, the projects developed under
CCPI encountered more challenges than the industrial projects under the ICCSP. Table 5
below provides a list of power projects developed under Round 3 of CCPI that used CCS
technology (Folger 2012). Three out of the six projects listed below were withdrawn.
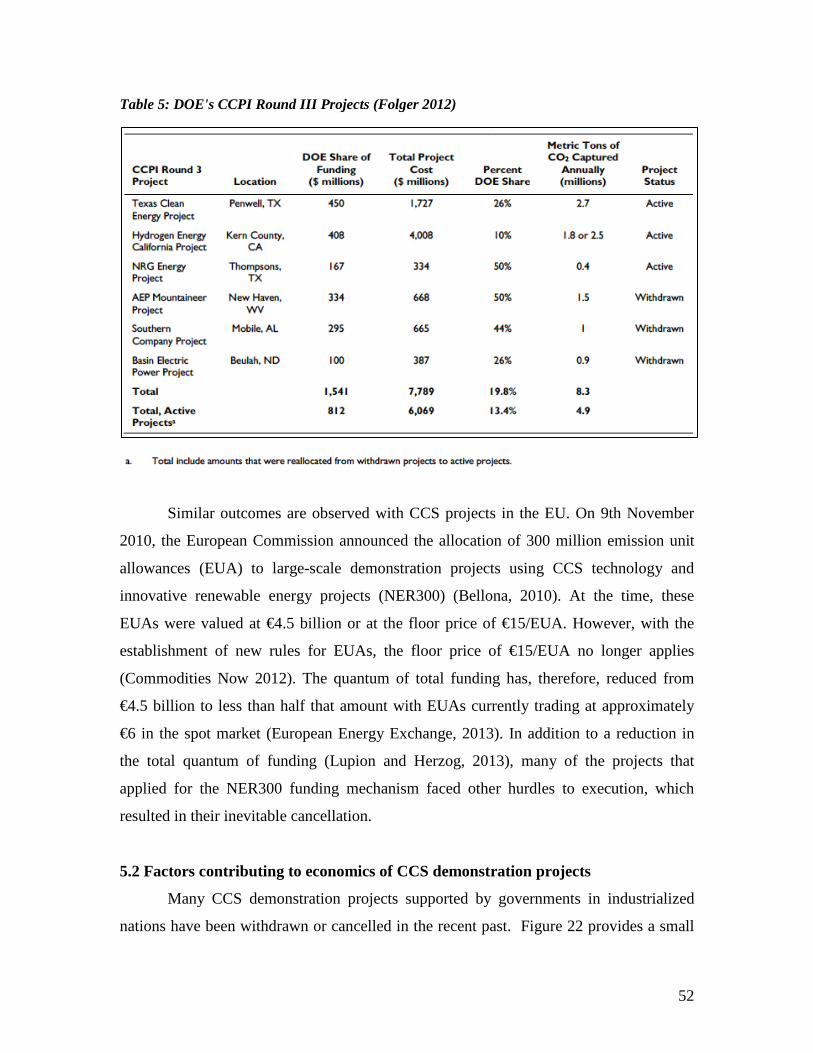
52
Table 5: DOE's CCPI Round III Projects (Folger 2012)
Similar outcomes are observed with CCS projects in the EU. On 9th November
2010, the European Commission announced the allocation of 300 million emission unit
allowances (EUA) to large-scale demonstration projects using CCS technology and
innovative renewable energy projects (NER300) (Bellona, 2010). At the time, these
EUAs were valued at €4.5 billion or at the floor price of €15/EUA. However, with the
establishment of new rules for EUAs, the floor price of €15/EUA no longer applies
(Commodities Now 2012). The quantum of total funding has, therefore, reduced from
€4.5 billion to less than half that amount with EUAs currently trading at approximately
€6 in the spot market (European Energy Exchange, 2013). In addition to a reduction in
the total quantum of funding (Lupion and Herzog, 2013), many of the projects that
applied for the NER300 funding mechanism faced other hurdles to execution, which
resulted in their inevitable cancellation.
5.2 Factors contributing to economics of CCS demonstration projects
Many CCS demonstration projects supported by governments in industrialized
nations have been withdrawn or cancelled in the recent past. Figure 22 provides a small
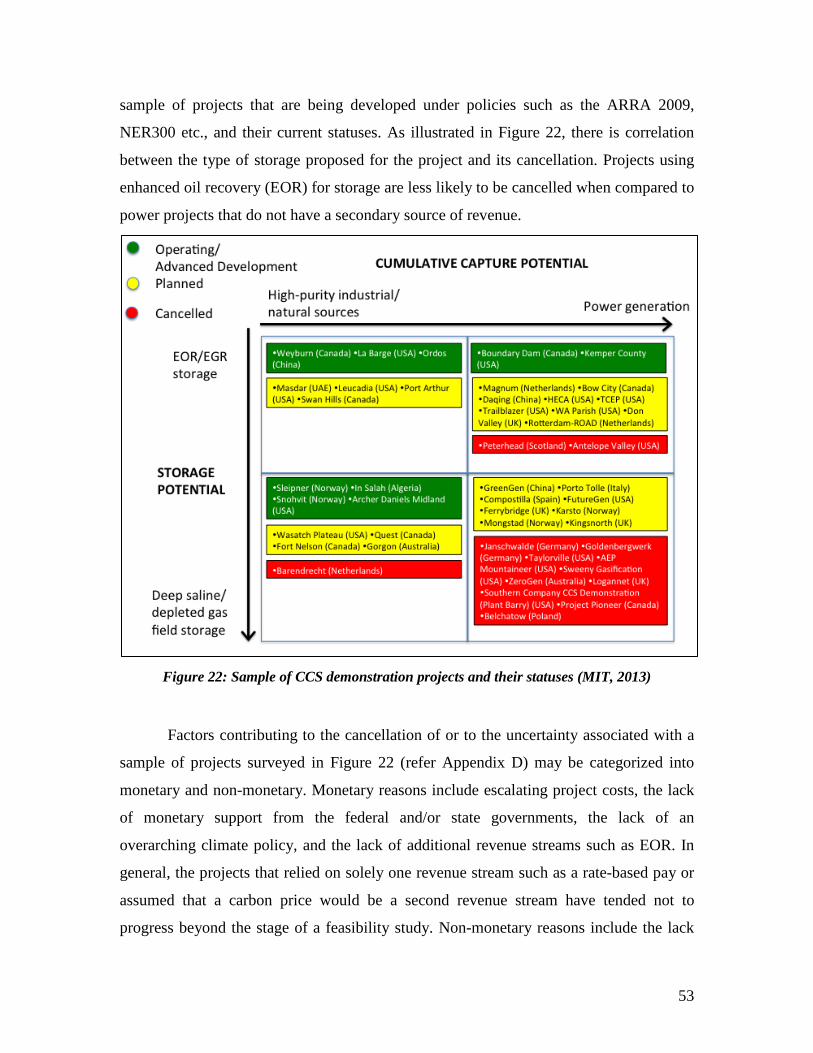
53
sample of projects that are being developed under policies such as the ARRA 2009,
NER300 etc., and their current statuses. As illustrated in Figure 22, there is correlation
between the type of storage proposed for the project and its cancellation. Projects using
enhanced oil recovery (EOR) for storage are less likely to be cancelled when compared to
power projects that do not have a secondary source of revenue.
Figure 22: Sample of CCS demonstration projects and their statuses (MIT, 2013)
Factors contributing to the cancellation of or to the uncertainty associated with a
sample of projects surveyed in Figure 22 (refer Appendix D) may be categorized into
monetary and non-monetary. Monetary reasons include escalating project costs, the lack
of monetary support from the federal and/or state governments, the lack of an
overarching climate policy, and the lack of additional revenue streams such as EOR. In
general, the projects that relied on solely one revenue stream such as a rate-based pay or
assumed that a carbon price would be a second revenue stream have tended not to
progress beyond the stage of a feasibility study. Non-monetary reasons include the lack

54
of political will (which may manifest itself as lack of funding), inadequate legal or
regulatory framework, local opposition to the project, opposition from environmental
groups, existing risk exposure through involvement in similar projects, disagreements
between companies forming the project company, and the general economic climate. The
Schlumberger Business Consulting (SBC) Energy Institute conducted a survey of private
developers of CCS projects and found that 89% of respondents believed that most
projects suffered from poor economics because there was no existing market for the
technology and that federal grants were insufficient to support these capital-intensive
projects (SBC, 2012). On a related note, 73% of respondents said that the uncertainty
arising from the lack of a climate mitigation policy, an unclear framework for storage,
and the tendency to substitute towards natural gas-based capacity were also significant
challenges to the development of projects.
5.3 Nth-of-a-kind (NOAK) & first-of-a-kind (FOAK) estimates of project costs
Given the stage of development of CCS technology, the cost estimates for
projects that are currently under development (first-of-a-kind) are significantly higher
than the estimates for projects that will be developed once the technology is
commercially demonstrated (nth-of-a-kind). Typically, FOAK estimates are derived from
NOAK estimates; costs that are likely to be unique to demonstration projects such as
higher design and engineering costs, higher contingencies etc. are accounted for to arrive
at FOAK estimates. As inferred from Table 6, the estimates of NOAK costs for plants
with and without CCS do not differ significantly across studies for most technologies.
The biggest difference is observed in the estimates for an integrated gasification
combined cycle (IGCC) plant with CCS. Considering that IGCC is a relatively new
technology, there is a higher degree of uncertainty with regard to cost estimates for a
plant that uses IGCC technology with CCS.

55
Table 6: Nth-of-a-kind costs of power plants with and without CCS
Parameter (Unit) IGCC w/o
IGCC SCPC w/o
SCPC NGCC w/o
NGCC
DOE Baseline Studies (DOE, 2010) Total overnight cost TOC ($/kW)
2716 3904 2024 3570 718 1497
O&M - (f) - $/kW p.a. 85 117 59 97 22 42 O&M - (v) mills/kWh 7.8 9.9 5.0 8.7 1.3 2.6
Global CCS Institute (GCCSI, 2011) Total overnight cost TOC ($/kW)
2618 3413 1921 3440 711 1447
The Global CCS Institute (GCCSI) estimates the investment costs for a large-
scale CCS demonstration project to be in the range of at least $5000 - $6000/kW
(GCCSI, 2012). A study conducted by the Belfer Center at the Harvard Kennedy School
provides a cost estimate in terms of the impact of adding CCS on the cost of electricity
(COE), which is estimated at a premium of least $0.08/kWh. The details of both studies
are presented in Appendix E. The implied impact of the premium on the capital cost, to
yield FOAK estimates, is presented in Chapter 8. Deriving generic FOAK cost estimates
from relevant NOAK estimates in a manner such that these estimates are useful for
decision makers is challenging for the following reasons – The costs associated with i)
conditions that are specific to the project site such as remoteness, the infrastructure at the
site, the compensation for local inhabitants, the availability/proximity of resources such
as fuel and water, and the ambient environmental conditions, ii) the owners’ requirements
such as office buildings and compliance with local regulations, and iii) other soft costs
such as legal and financing costs cannot be accounted for accurately in studies of this
nature. Furthermore, projects under execution are subject to volatility in the inflation and
exchange rates, and geological risk associated with storage. These factors, in turn, make
it more likely that the project costs are underestimated at the early stages of project
execution leading up to the start of construction. Therefore, a margin of error of +/- 40%
is typically given to the estimates provided in such studies.
The project costs of various CCS demonstration projects, sourced from
government websites, Front End Engineering Design (FEED) studies, news sources, and
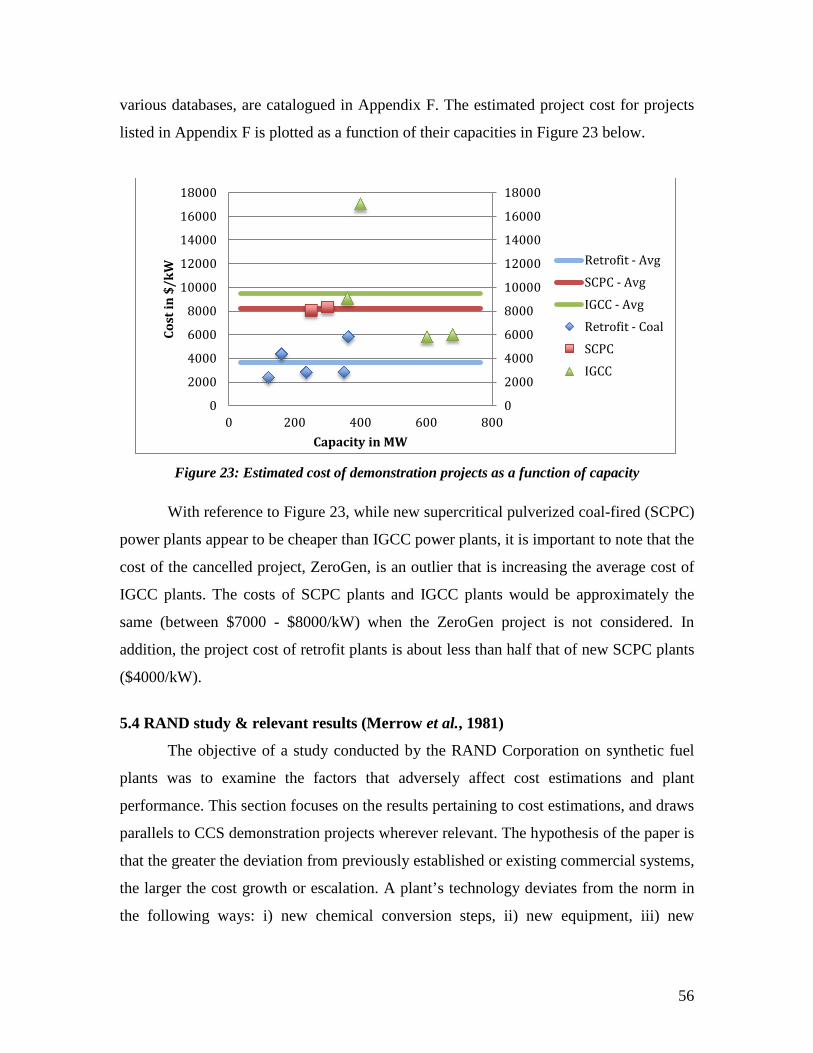
56
various databases, are catalogued in Appendix F. The estimated project cost for projects
listed in Appendix F is plotted as a function of their capacities in Figure 23 below.
Figure 23: Estimated cost of demonstration projects as a function of capacity
With reference to Figure 23, while new supercritical pulverized coal-fired (SCPC)
power plants appear to be cheaper than IGCC power plants, it is important to note that the
cost of the cancelled project, ZeroGen, is an outlier that is increasing the average cost of
IGCC plants. The costs of SCPC plants and IGCC plants would be approximately the
same (between $7000 - $8000/kW) when the ZeroGen project is not considered. In
addition, the project cost of retrofit plants is about less than half that of new SCPC plants
($4000/kW).
5.4 RAND study & relevant results (Merrow et al., 1981)
The objective of a study conducted by the RAND Corporation on synthetic fuel
plants was to examine the factors that adversely affect cost estimations and plant
performance. This section focuses on the results pertaining to cost estimations, and draws
parallels to CCS demonstration projects wherever relevant. The hypothesis of the paper is
that the greater the deviation from previously established or existing commercial systems,
the larger the cost growth or escalation. A plant’s technology deviates from the norm in
the following ways: i) new chemical conversion steps, ii) new equipment, iii) new
0
2000
4000
6000
8000
10000
12000
14000
16000
18000
0
2000
4000
6000
8000
10000
12000
14000
16000
18000
0 200 400 600 800
Cost
in $
/kW
Capacity in MW
Retrofit - Avg
SCPC - Avg
IGCC - Avg
Retrofit - Coal
SCPC
IGCC

57
feedstock, and iv) large scale-up of previously used equipment. The paper also
hypothesizes that cost growth declines as the completeness of plant definition increases.
Data on cost estimates at different stages of project development, the physical
character of the plant, various measures of technological change, and measures of project
development are collected from 44 different synthetic fuel plants. The dependent
variable, cost growth, is defined as the ratio of an estimate of project cost to the actual
project cost. The study defines five classes of estimates depending on which stage of
development the estimate was provided at; Class 0 is provided at the R&D stage, class 1
at the stage of project definition, class 2 when 30% of detailed engineering is completed,
class 3 at the end of detailed engineering, and class 4 is provided during construction.
Various independent variables are tested first for correlation with cost growth, the
dependent variable, and then for statistical significance. The equation given below was
found to be the most robust model to estimate variation in cost growth. PCTNEW is
defined as a measure of the percentage of capital investment made in technology
unproven in commercial use. COMPLEXITY is a count of the number of continuously
linked process steps or block units used in the plant. INCLUSIVENESS is a measure of
the percentage of the following three items included while making an estimate – i) land
purchase/leases/property rentals, ii) initial plant inventory/warehouse parts/catalysts, and
iii) pre-operating personnel costs. The variable, PROJECT DEFINITION, was
constructed using the average of the site information variables and adding a level-of-
engineering variable to it. PROJECT DEFINITION ranged from 2 (maximum definition)
to 8 (no definition). For each estimate in the dataset, PROCESS INFORMATION was
measured in the following manner – if most of the process information is obtained from
small-scale laboratory experiments or literature, or if a coordinated R&D program is
underway, the assigned value was 1. If either a demonstration unit or sufficient data to
start the design on a commercial scale were available, or if the major process
uncertainties were resolved, the assigned value was 0. The variable IMPURITIES ranged
from 0 to 5, and is a measure of the extent to which impurity buildup was a significant
source of design problems in the early stages of project development; 0 indicated that no

58
problems occurred and 5 indicated impurities were a major source of problems during the
early design stage.
COST GROWTH = A – B1*PCTNEW – B2*IMPURITIES – B3*COMPLEXITY +
B4*INCLUSIVENESS – B5*PROJECT DEFINITION – B6*PROJECT
DEFINITION*PROCESS INFORMATION
COST GROWTH = 1.12196 – 0.00297*PCTNEW – 0.02125*IMPURITIES –
0.01137*COMPLEXITY + 0.00111*INCLUSIVENESS – 0.04011*PROJECT
DEFINITION – 0.02350*PROJECT DEFINITION*PROCESS INFORMATION
All the coefficients of the independent variables listed in the above model are
statistically significant, and interpreted in the following manner. Each 10% of the capital
cost invested in new technology reduces the cost growth ratio by approximately 3% i.e.
the higher the percentage of investment in new technology, the less accurate the project
cost estimate is likely to be. For every unit increase in the count of process steps, the cost
growth ratio (and therefore the accuracy of the estimate) decreases by approximately
1.14%. If accurate measures of cost elements such as land lease cost, pre-operating
personnel cost, and inventory/warehouse costs are included in the cost estimate, the cost
growth ratio increases by 0.1% i.e. the estimate is more accurate because it is closer to
the actual project cost. With a decrease in the degree of project definition (value of
variable increases from 2 to 8), the cost growth decreases by approximately 4% i.e. the
estimate of cost is lower or less accurate. Further, if the process information for the plant
is sourced from lab experiments or early R&D, the lack of project definition reduces the
accuracy of the cost estimate by an additional 2.35%. The basic conclusion of the study,
therefore, is that the greater the degree of uncertainty associated with the technology in
use in a project, the higher the likelihood that the early estimates for project cost are
biased toward underestimation.
All the variables discussed above are relevant for a demonstration plant that uses
CCS. Prior to FEED studies, the project definition for a CCS demonstration plant is likely
59
to be lower compared to plants that use commercially available technology because many
aspects of the technical design and site-specific data can only be included during the
FEED study. In addition, the process information for an integrated CCS plant is derived
from smaller demonstration plants, which adds to the degree of inaccuracy of the project
cost estimate when the project definition is low. Further, in most demonstration projects
using CCS, upwards of 50% of the capital cost is invested in new technology. These
factors, in turn, may lead to grossly inaccurate pre-FEED estimates of the project cost.
Financial support from governing bodies, however, is typically announced on the
basis of early project cost estimates. As seen in the case of both Longannet and the
ZeroGen project, governing bodies were compelled to withdraw support for the project
because the estimates of project cost post a FEED study (or pre-feasibility study in the
case of ZeroGen) were significantly higher than the initial estimates. Therefore, it may be
recommended that governing bodies set aside a fund to support FEED studies for projects
that are applying for financial support, and grant the financial awards on the basis of the
results of the FEED study. This may reduce the likelihood that demonstration projects get
cancelled due to escalating project costs.

60
6. ZEROGEN – A CASE STUDY IN COST ESCALATION 6.1 Project history (Ashworth et al., 2011)
In March 2006, ZeroGen Proprietary Limited (ZeroGen) was incorporated as a
subsidiary of Stanwell Corporation Limited, a company that had conducted extensive
research on low-emission electricity generation. In March 2007, the ownership of
ZeroGen was then transferred to the Queensland State government, and it allocated funds
of over AU$100 million for the pre-feasibility study and the operational expenses of the
company. Through this project, the Queensland government expected to further its
strategic intent to preserve Queensland’s competitive advantage as a power generator and
to ensure the continued mining, use, and export of Australian black coal. In response to
the Clean Coal Council’s recommendation that the development of a commercial-scale
IGCC plant with CCS be accelerated, ZeroGen was reconfigured into a two-stage project
– 120 megawatt (MW) (gross) IGCC plant with CCS in 2012, and a plant of 450 MW
(gross) using the same technology in 2017. A pre-feasibility study and an Environmental
Impact Statement (EIS) were initiated for Stage I of the project.
During the development of Stage I, Mitsubishi Heavy Industries (MHI) proposed
the construction of a 550 MW (gross) IGCC plant with CCS to accelerate development of
the technology for commercial scale while addressing technical challenges. ZeroGen
subsequently issued Requests for Proposals (RfP) to various technology providers to
account for the possibility that their offers might be competitive with the MHI proposal;
ZeroGen received offers from General Electric and Shell. In October 2008, ZeroGen
initiated a scoping study, and the report generated at the end of that study and supporting
documentation was submitted to the Queensland government, the Australian Coal
Association Low Emission Technologies Limited (ACALET), and the Clean Coal
Council. After these several changes in the configuration, the project configuration of 530
MW (gross) IGCC plant with CCS was approved in June 2009, thus obviating the need
for a Stage I.

61
6.2 Results of the pre-feasibility study (Garnett et al., 2011)
The scoping study initiated in October 2008 generated a total project cost estimate
of AU$4.3 billion. Thereafter, the project configuration was finalized, and a pre-
feasibility study was initiated. The pre-feasibility study involved extensive engineering
and cost estimation studies, CO2 storage exploration, and detailed financial analysis. The
total cost of the pre-feasibility study was AU$138 million, and over 70% of this amount
was spent on exploration, drilling, and testing of the allotted CO2 storage sites. The
exploration of potential storage resources and the pre-feasibility study were conducted
concurrently rather than sequentially to meet the requirements and timelines for the
Commonwealth Government CCS Flagship grants. Furthermore, as the project was of an
FOAK nature, the technology providers were involved in the pre-feasibility stage to
ensure that the project configurations were aligned with their capabilities. At the end of
the pre-feasibility study, the estimate of total project cost increased to AU$6.93 billion.
The factors that resulted in cost escalation and the magnitude of their impact are
illustrated in Figure 24 below.
Figure 24: Escalation of Capital Costs (Greig, 2012)
4300
6937
366 816
300 505
650
0
1000
2000
3000
4000
5000
6000
7000
8000
Cost
s (i
n AU
$ m
illio
n)
Cost Escalation

62
The factors that contributed to cost escalation in ZeroGen are analyzed below:
a. Escalation & Exchange Rate: Given that approximately 34% of the total project
cost relied on non-Australian currency (US Dollar and Yen), escalation and
changes in relevant exchange rates resulted in a nearly 9% increase in the project
cost estimate.
b. Design Growth: In projects of this nature, wherein several technology providers
are working together, battery limits of each provider are not likely to be defined
clearly before the FEED study stage of execution. Better definition of the MHI
scope (IGCC plant with capture) led to design growth, which resulted in a 19%
increase in total project cost.
c. Au-US Productivity: There is a lack of skilled labor to execute this project in
Australia. A 7% increase in total project cost is on account of lower productivity
levels relative to skilled labor in the U.S.
d. Infrastructure Scope: Changes in the infrastructure scope to include enabling
infrastructure such as roads, buildings etc., in a remote area accounted for
approximately a 12% increase.
e. Forward Escalation: Escalation of the project cost over the construction period
accounted for approximately a 15% increase.
In effect, the project cost increased by over 60% from its scoping study levels.
The expected electricity price during the life of the project was AU$38 per
megawatt-hour (MWh) in 2014 rising linearly to AU$75/MWh in 2030. Similarly, the
expected carbon price during the life of the project was AU$28.3/tCO2 in 2014 rising
linearly to AU$56.6/tCO2 in 2030. Given the high capital cost and the expected market
price for electricity and the carbon price, the project was not expected to generate
sufficient revenues to cover its operating costs even without accounting for the capital
recovery requirement. In order for the project to be viable, the team concluded that the
project would require i) a capital subsidy, ii) an operating subsidy, iii) a CO2 storage
incentive, iv) must-run status by the Australian Energy Market Operator, and v) some
risk underwriting, perhaps in the form of a loan guarantee.

63
6.3 Storage uncertainty & related cost implications (Garnett et al., 2011)
In an internal risk assessment workshop for ZeroGen, three risks were identified
as “Extreme” i.e. risks that could not be resolved within a reasonable timeframe. Two of
these “Extreme” risks were related to storage. This subsection details ZeroGen’s
experience with storage exploration.
ZeroGen was awarded exploration permits (land tenements wherein exploration
may be conducted) in the Northern Denison Trough (NDT). At the time, these were the
only exploration permits allotted in Queensland (or even in mainland Australia) to any
project for the purposes of CO2 storage. The purpose of the exploration was to examine if
– i) the storage resource has a total capacity of at least 60 million tons, ii) the storage
resource can sustain an injection rate of 2 Mtpa, and iii) the storage costs are less than
$50/tCO2 (including the cost of capital and O&M of both transport and storage). The
capture rate for the project was initially fixed at 65% with plans to increase it to 90%.
Therefore, the storage capacity would also have to be able to support an injection rate of
3 Mtpa for a 90% capture plant.
After extensive exploration activities, the project team concluded that it was
unlikely that NDT’s storage resource could sustain an injection rate of 2 Mtpa even
though the storage resource had a capacity of 60 million tons. Further, it was considered
highly unlikely that NDT could sustain an injection rate of 3 Mtpa as required for 90%
capture. A cost estimate for the storage resource yielded the result that there was a greater
than 95% likelihood that total cost of TS&M will exceed AU$50/tCO2. ZeroGen then
actively advocated with the regulatory bodies and the funders to release exploration
permits in different areas. To this end, ZeroGen submitted a proposal to the Queensland
Government and ACALET to create a multi-user “hub” storage development, which
involved the exploration of many potential resources (prioritizing Surat Basin) while
seeking low cost and low commitment permits in Eromanga and/or Galilee Basins. The
desktop studies for storage resources in these basins yielded cost estimates of AU$8 -
AU$20/tCO2 excluding transport costs, which primarily depends on the new plant site.

64
When ZeroGen decided to close the project, the team was still waiting for new permits to
be released by the relevant authorities.
6.4 Conclusions from the case study
Based on an investigation of the ZeroGen case, the following reasons for why cost
escalation resulting in poor financial viability is observed in CCS demonstration projects
are outlined:
a. Conflicting political and economic goals resulting in scope changes – At the
very least scope changes result in sunk costs because the process of engineering
design needs to be repeated with every significant change in the scope of the
project. At most, these changes may result in uncertain battery limits of each
technology provider, which are likely to be resolved only in the later stages of
execution. As discussed in the RAND study, in most cases, the clarification of
said limits result in improvements in the project definition, and therefore cost
escalation.
b. Costs that cannot be accounted for until site is identified – There are certain cost
elements that cannot be accurately estimated until the project site is identified and
a pre-feasibility or feasibility study is conducted. Examples of these are the costs
of supply to site, the costs of CO2 TS&M, the infrastructure at site, the owner’s
costs, local labor productivity, and compliance with the local regulations. As the
RAND study indicates, the inclusiveness of the project cost estimate improves
when these cost items are accounted for, which results in cost escalation.
c. Volatility in financial parameters – Given that CCS technology is still under
development, no single technology provider has the experience of executing a
turnkey project. Therefore, there is a heavy reliance on imported technology and
expertise for project execution, the costs of which are subject to interest and
exchange rate volatility. While these risks are usually mitigated at the financing
stage of project development, cost increases during various feasibility studies
cannot be avoided. Furthermore, the risks associated with these parameters may
be greater for a project that invests a significant amount of capital in a new
technology. This is supported by results from the RAND study, which indicate
65
that the percentage invested in a new technology determines, in part, the extent of
cost escalation.
d. Storage exploration – While the global storage potential has been assessed,
individual storage sites have not been assessed for their capacity and threshold
injection rates, the two primary parameters that determine whether a particular
storage site is viable. The costs of storage exploration, therefore, are typically
borne by project developers. These costs can run into several hundreds of million
dollars depending on how many sites are assessed. Unless relevant governing
bodies support the storage exploration and feasibility studies for a project,
developers typically attempt to capitalize these costs, which, in turn, increase the
capital recovery requirements during the life of the project. These factors result in
higher than the initially estimated project costs. Furthermore, the storage related
uncertainty contributes to the lack of both project definition and process
information.

66
7. DEVELOPING THE FINANCIAL MODEL A financial model was developed to conduct analysis on the economics of CCS
demonstration projects. The model was then calibrated using data on NOAK plants with
and without CCS that use three different kinds of technologies – i) SCPC, ii) IGCC, and
iii) NGCC. In this chapter, the financial model is described along with the assumptions
and data that are used to test and verify the model.
7.1 Construction of the financial model
The financial model is a discounted cash flow model in which the annual cash
flows of investment, revenue, costs, debt, equity etc. are estimated for the life of the
plant, and it incorporates a detailed method of risk accounting and risk weighting that is
described below. The model is used to estimate the COE in the first year of operation of
the plant that is needed to ensure that equity holders receive their expected rate of return.
The inputs into the model include detailed information on plant characteristics such as its
capacity, heat rate, capital costs, O&M costs, fuel requirement and prices, and carbon
emissions. In addition, financing assumptions on the cost of capital, depreciation,
inflation and escalation rates are included. A snapshot of the input sheet of the financial
model is provided in Table 7 below.
Table 7: Input Sheet - Model
PLANT CHARACTERISTICS [1] Capacity MW (gross) Capacity MW (net) [2] Capacity Factor % Aux Consumption % [3] Generation MWh [4] Heat rate Btu/kWh [5a] Total Overnight Cost $ [5b] Overnight Cost (less grant) $/kW [5c] Overnight Cost (total) $/kW [6] Incremental capital costs $/kW/year [7a] Price of electricity - no incentives $/MWh [7b] Price of electricity - with incentives $/MWh [8] Plant Life years [9] Construction Schedule % OPERATION & MAINTENANCE

67
[10] Fixed O&M Costs $/kW/year Fixed O&M Costs $ [11] Variable O&M Costs mills/kWh FUEL & BYPRODUCTS [12] Fuel Costs $/MMBtu [13a] Carbon intensity kg-C/MWh [13b] Carbon intensity kg-CO2/MWh INFLATION & ESCALATION [14] Inflation Rate % [15] O&M real escalation % [16] Fuel real escalation % TAX & DEPRECIATION [17] Tax Rate % [18] Depreciation Schedule %
Max Depr. Tax Shield % of Pro-forma taxes COST OF CAPITAL [19] Debt fraction % [20] Interest rate % [21] Debt Tenure years [21] Risk-free interest rate % [22] Equity rate %
[23] WACC (weighted avg cost of capital) % INCENTIVES
[24] Additional Source of Revenue List [25a] Carbon Price $/tCO2 [25b] EOR Price $/tCO2 Price of Oil (for EOR) $/bbl % of Price of Oil (for EOR) % Price of CO2 (for EOR) $/mcf CO2 [26] % carbon utilized or stored % % carbon for EOR % carbon for CP [27] Production Tax Credit % of revenue
[28] Grant $/kW [29] Investment Tax Credit % of total investment

68
Sheets indicating the investment schedule, the debt repayment schedule, and the
income statement associated with a given set of input parameters are constructed in this
Microsoft Excel-based model.
Investment schedule: The investment schedule is calculated using two factors – the
percentage of the total capital expended in a given year during construction and the total
capital investment. An escalation rate of 3.6%, as defined in the DOE study (DOE, 2010)
is applied to account for the escalation of costs during construction.
Debt repayment schedule: A certain percentage of the capital investment, 45% or 50% in
the DOE baseline study, is expected to come from financial institutions as debt. This
percentage is multiplied by the required capital expenditure in each year of construction
to estimate the new debt issued each year. The interest accrued during construction is also
calculated to determine the total amount to be repaid once the plant is operational. This
amount is divided equally during the repayment period, which is 15 years in DOE
baseline study. In addition to the repayment of the principal, the interest that is paid each
year is calculated and shown on the sheet.
Income: The annual revenue is calculated using a price of electricity that is estimated in
the model. The method by which this price is calculated is described subsequently. From
this revenue, the O&M costs, fuel costs, and CO2 emission costs, if any, are deducted.
The depreciation is calculated using the depreciation schedule defined in the input sheet,
and deducted from gross revenue. The interest paid, as calculated on the debt repayment
schedule, is also deducted from the gross revenue, and the taxable income is calculated as
the amount remaining after these deductions are accounted for. The net income is
calculated as the income after tax.
The risk assumed by various agents (debtors, government, and equity holders)
contributing to the total value of the project is estimated by the discount rate used to
calculate the value of their contribution. These contributions can either be additions to or
subtractions from the project cash flows. For example, when debt is issued, it adds to
project cash flows, and subtracts from it when debt is repaid. The model then
incorporates a method of risk accounting and risk weighting that follows these basic
principles:

69
a. The equity cash flows are equal to the project cash flows minus the tax payments
and debt payments. The project cash flows are calculated as the difference
between total revenue and the sum of the operating costs such as O&M costs, fuel
costs etc. The equity holders, therefore, are residual claimants of project cash
flows.
b. Accordingly, the risk or discount rate associated with the equity cash flows in
each year is calculated as the weighted discount rate of the project cash flows
minus that of the tax payments and debt payments. These discount rates are
weighted by the year-on-year amounts of these cash flows.
c. The relevant discount rates are then used to calculate the value of each of these
cash flows. Based on the principles outlined above, the value of the equity
payments in each year must equal the value of the project cash flows minus the
value of the tax payments and debt payments.
d. The discount rate associated with the project cash flows is the weighted average
cost of capital, and that associated with debt payments is the rate of debt. The
discount rate associated with the tax payments are calculated using the principles
outlined below.
e. The cash flows of actual taxes should be equal to cash flows of pro-forma taxes
(tax liability if no tax shields were available to the project) minus that of tax
shields. Accordingly, the value of the actual taxes is equal to the value of the pro-
forma taxes minus the value of the tax shields.
f. It is important to note that the value of the tax shields cannot exceed the value of
the pro-forma taxes because the project can only use its tax shields to the extent
that it covers its liabilities. Therefore, adjustments may be made to the discount
rates associated with the various tax shields.
g. As in the case of the equity payments, the discount rate associated with tax
payments in each year is calculated as the difference between the weighted
discount rate of the pro-forma taxes minus that for the sum of all the tax shields.
This method of calculating the discount rates ensures that the value of the actual
taxes equals the value of the pro-forma taxes minus the value of the sum of all the
tax shields.

70
These principles are built into the model because the risk assumed by the equity
holders is not the same in each year of construction or plant operation. Availability and
timing of the contributions, positive or negative, by other agents changes the risk that the
equity holders assume. This method of risk accounting becomes especially important
when incentives become available to the project.
7.2 Incentives built into the model
The model is designed to analyze the individual and collective impact of a
production tax credit, a grant, an investment tax credit, a loan guarantee, a carbon price,
and an additional source of revenue such as EOR.
a. Production tax credit (PTC): In the base version of the model, a production tax
credit is defined as a fixed percentage of annual revenue that is exempt from
taxation. This amount is deducted from the gross revenue before the taxes are
calculated, and added back to the revenue after tax to estimate the net revenue.
The model can be adapted to include variations in the form of the production tax
credit such as a fixed amount per MWh or a fixed amount annually.
b. Investment tax credit (ITC): Considering that the project is not generating
revenues during construction, the investment tax credit is available to the project
once the plant is operational. The quantum of the investment tax credit is
calculated as a percentage of the total investment. This tax credit is then
distributed in a manner as defined in the terms of the investment tax credit i.e.
during the first 5 years of operation or the first 10 years of operation etc.
Variations to an ITC such as an R&D tax credit i.e. a tax credit for the amount
invested in R&D etc. can be built into the model.
c. Carbon price: A carbon price is a penalty for emissions from a plant, and
therefore, adds to its operating costs. For a plant with CCS and 90% capture, there
is a penalty for 10% of the emissions and an avoided cost for 90% of CO2 that is
captured. For a plant without CCS, the impact of a carbon price is much higher at
100% of the emissions from the plant. Therefore, unlike other incentives, a carbon

71
price adds to the COE for all plants, but adds more to the COE for a plant without
CCS.
d. Additional source of revenue: In the base version of the model, the additional
revenue is assumed to come from EOR. The EOR price is defined in terms of
$/tCO2, and the revenue is calculated using the emissions data. This model can be
adapted to account for other sources of revenue such as ammonia or any other
chemical production that requires CO2. The relevant price can be converted into a
$/tCO2 measure, if not measured in those units.
e. Grants: Many CCS demonstration project receive grants from the DOE to help
developers bridge the capital cost gap between a plant with and without CCS.
Grants reduce the required capital investment during construction, and its impact
is calculated in terms of its contribution to the value of gross project cash flows.
f. Loan guarantee: For capital intensive and technologically risky projects, the
DOE may provide loan guarantees. In other words, in the event the project is
unable to make its debt payments, the DOE will protect financial institutions by
bridging the gap between the payments made by the project and the required debt
payments. The extent of the DOE’s contribution is usually defined in the terms of
the loan guarantee. A loan guarantee may allow financial institutions to provide
more debt, to provide cheaper debt, or both. The model can incorporate any of the
above.
The principles outlined in the preceding section continue to apply even when these
incentives become available to the project. The impact of the incentives is accounted for
in the following manner – i) the value of both the PTC and ITC adds to the value of the
total tax shields, ii) the value of the grants, the additional sources of revenue, and a
carbon price adds to the value of the project cash flows, and iii) the loan guarantees
change the value of debt payments. In the analysis presented in the next chapter, the
impact of these incentives is analyzed in terms of the ability to charge a lower price of
electricity to consumers while ensuring that the project continues to be financially viable.
In other words, the user of the model can calculate the rate of electricity in year 1 of

72
operation (assumed to escalate at 3% per annum) that needs to be charged to consumers
to ensure that the equity holders receive their expected rate of return.
7.3 Base case assumptions
The base cases for the financial model are constructed using data from the 2010
DOE baseline studies (DOE, 2010). The study includes the estimates of cost and
performance data for NOAK plants that use the following generation technologies – i)
SCPC, ii) IGCC, and iii) NGCC. Data from six cases i.e. systems that use each of the
abovementioned technologies with and without CCS are used for base cases in the
financial model. These data are given in Table 8 below.
Table 8: Base case data sourced from DOE baseline study (DOE, 2010)
Parameter Case 11 SCPC
w/o
Case 12 SCPC
Case 5 IGCC w/o
Case 6 IGCC
Case 13 NGCC
w/o
Case 14 NGCC
Gross MW 580 662 737 673 565 512 Net MW 550 550 629 497 555 474 TOC ($/kW) 2024 3570 2716 3904 718 1497 Heat Rate 8687 12002 8099 10924 6798 7968 Fuel ($/MMBtu)
1.64 1.64 1.64 1.64 6.55 6.55
Fuel real escl. 0.00% 0.00% 0.00% 0.00% 0.00% 0.00% Capacity Factor
85% 85% 80% 80% 85% 85%
O&M (f) - $/kW pa
59 97 85 117 22 42
O&M (v) mills/kWh
5.0 8.7 7.8 9.9 1.3 2.6
O&M (f) – real escl
0.00% 0.00% 0.00% 0.00% 0.00% 0.00%
Depreciation 150% declining balance
150% declining balance
150% declining balance
150% declining balance
150% declining balance
150% declining balance
% of total overnight capital (TOC) that is depreciated
100% 100% 100% 100% 100% 100%
Debt repayment
15 years 15 years 15 years 15 years 15 years 15 years
Percentage Debt
50% 45% 45% 45% 50% 45%
Rate of Debt 4.5% 5.5% 5.5% 5.5% 4.5% 5.5%

73
Rate of Equity 12% 12% 12% 12% 12% 12% Tax Rate 38% 38% 38% 38% 38% 38% Capital Expenditure Period
5 years 5 years 5 years 5 years 3 years 3 years
Escalation of costs during construction
3.60% 3.60% 3.60% 3.60% 3.60% 3.60%
Distribution of capital costs
10%, 30%, 25%, 20%, 15%
10%, 30%, 25%, 20%, 15%
10%, 30%, 25%, 20%, 15%
10%, 30%, 25%, 20%, 15%
10%, 60%, 30%
10%, 60%, 30%
Escalation of O&M and Fuel Costs
3% 3% 3% 3% 3% 3%
Working Capital
0 0 0 0 0 0
CO2 Generated Kg-CO2/MWh
804 1111 724 976 364 426
CO2 Captured Kg-CO2/MWh
0 1000 0 879 0 384
CO2 Emitted Kg-CO2/MWh
804 111 724 98 364 43
CO2 TS&M mills/kWh
0 5.6 0 5.6 0 3.2
As expected, the heat rate for plants that include CCS is higher on account of the
energy penalty. Given that IGCC technology is not as mature as SCPC and NGCC, the
capacity factor is quoted at a lower rate of 80% compared to 85% for SCPC and NGCC
plants. Considering that IGCC and SCPC plants are more capital-intensive, the
construction period is longer for these plants at 5 years compared to 3 years for NGCC
plants. While the debt is repaid over 15 years for all plants, riskier plants (plants with
CCS and IGCC plants) have a lower debt percentage (45%) and a higher rate of debt
(5.5%) compared to plants that use existing technologies without CCS (50% debt and
4.5% rate of debt). The carbon emissions generated, and therefore captured, are highest
for SCPC plants and lowest for NGCC plants. This is a function of the fuel and
technology used in these plants. The depreciation schedule, percentage of the total
overnight costs (TOC) that are depreciated, escalation of costs during construction, and
escalation of O&M and fuel costs are the same across cases. Any working capital
requirements are assumed to be included in the fixed and variable O&M costs.

74
7.4 Verification of the model
The model is tested and verified using the data in Table 8; COE in year 1 which is
assumed to escalate at rate of 3% per annum as calculated using the financial model is
compared to the same cost as given in the DOE baseline study. The results are provided
in Table 9 below.
Table 9: Verification of the model
Parameter Case 11 SCPC w/o
Case 12 SCPC
Case 5 IGCC w/o
Case 6 IGCC
Case 13 NGCC w/o
Case 14 NGCC
COE (DOE Study) 59 110 81 119 59 86
COE (Model Verification)
58 105 79 116 62 88
As indicated in the table, the difference in the results obtained from the financial
model and the results of the study ranges from $1 - $5/MWh. These differences may be
attributed to the method of calculating COE in year 1 in the DOE study versus that in the
model developed for this study. The DOE study applies a capacity charge to the TOC to
account for capital costs that need to be recovered in year 1. The capacity charge is
multiplied by the TOC, and divided by the total generation to yield the capital recovery
component of the COE. To this value, the costs of all variable components such as fuel
costs and fixed and variable O&M costs in year 1 are added to estimate the total COE in
year 1. Our financial model calculates a COE such that the equity holders get their
expected rate of return after payments to the contractors and the debtors have been made.
Given that the capital charge is an approximate value that takes into account the expected
return on equity, tax rates etc. these small differences in the results obtained in the
financial model versus those in the study are expected. The next chapter describes how
the model is used to analyze the economics of FOAK CCS demonstration projects.

75
8. RESULTS FROM ANALYSIS ON PROJECT ECONOMICS This chapter focuses on the impact of various incentives on the economics of
demonstration projects, which are FOAK plants. Using the financial model described in
the previous chapter, an analysis of the economics of generic demonstration plants
follows the steps given below:
a. Updating economic parameters in the model: The economic parameters sourced
from the DOE baseline studies (DOE, 2010) are updated to reflect the current fuel
prices and reasonable escalation rates for certain costs.
b. Analyzing generic FOAK costs: In addition, the NOAK costs in the DOE baseline
studies are updated to reflect FOAK costs.
c. Analyzing the impact of incentives: The impact of a set of policy incentives on
generic FOAK plant costs is estimated. This impact is measured in terms of the
reduction on COE compared to a project without any incentives.
8.1 Updating economic parameters
Certain economic parameters from the DOE baseline studies (see Table 8) are
updated to reflect the current conditions (see Table 10). The fuel cost and real escalation
on the fuel costs are updated to reflect values in the AEO (2012). The O&M costs, both
fixed and variable, are expected to escalate by a nominal 1% per annum because the DOE
baseline study did not assume any real escalation these costs. The tax rate is updated to
reflect the increase in corporate taxes (USA Today, 2013). Updated results on the COE
are given in the table below.
Table 10: Updating Economic Parameters
Parameter Case 11 SCPC
w/o
Case 12 SCPC
Case 5 IGCC
w/o
Case 6 IGCC
Case 13 NGCC
w/o
Case 14 NGCC
Economic Parameters (DOE, 2010) Fuel ($/MMBtu) 1.64 1.64 1.64 1.64 6.55 6.55 Fuel real escl. 0.00% 0.00% 0.00% 0.00% 0.00% 0.00% O&M (f) – real escl 0.00% 0.00% 0.00% 0.00% 0.00% 0.00% Tax Rate 38% 38% 38% 38% 38% 38% COE (Model – Verification)
58 105 79 116 62 88

76
Updated Economic Parameters Fuel ($/MMBtu) 2.22 2.22 2.22 2.22 4.85 4.85 Fuel real escl. 0.90% 0.90% 0.90% 0.90% 1.40% 1.40% O&M (f) – real escl 1.00% 1.00% 1.00% 1.00% 1.00% 1.00% Tax Rate 39.2% 39.2% 39.2% 39.2% 39.2% 39.2% COE (Model – Updated Economic Parameters)
70 123 92 134 58 84
The COE for both SCPC and IGCC increased to reflect increases in all the
updated parameters. However, the COE for NGCC decreased to reflect a significant
decrease in the fuel cost from $6.55/MMBtu to $4.85/MMBtu despite the increases in
other parameters.
8.2 Analyzing generic estimates of FOAK costs
The NOAK costs in the DOE baseline studies are updated to reflect FOAK costs,
which are sources from two studies – GCCSI and Belfer Center (see Appendix E). The
GCCSI estimates that a demonstration plant costs $5000 - $6000/kW for an SCPC or an
IGCC plant, and the analysis uses an average value of $5500/kW. The Belfer Center
study concludes that adding CCS to a plant results in a premium of $85/MWh.
Considering that the analysis focuses on the impact on COE, results from the Belfer
Center study are chosen. FOAK costs are then estimated for each of the three
technologies, and presented in Table 11 below.
i) FOAK SCPC Plants: The first set of cases analyzed is an SCPC plant with and
without CCS. Notwithstanding the switch from coal-based to gas-based fleet, an
SCPC plant without CCS is assumed to be the reference plant against which all
other plants are compared in terms of their COE. As indicated in Table 11, FOAK
costs for an SCPC plant with CCS are estimated at $4909/kW, which is the capital
cost that yields a premium of $85/MWh.
ii) FOAK IGCC Plants: IGCC is a relatively new power generation technology
when compared to SCPC and NGCC. Therefore, the costs of IGCC plants without
CCS are also likely to be FOAK costs, which are derived from a GCCSI study
(GCCSI, 2011). In this study, the capital cost of an FOAK IGCC plants is
expected to be over 30% higher than its NOAK costs. Therefore, the capital cost

77
assumption for an IGCC plant without CCS is also updated. Then, FOAK costs
for an IGCC plant with CCS are estimated at $6364/kW, which is the capital cost
that yields a premium of $85/MWh.
iii) FOAK NGCC Plants: In general, NGCC plants have the lowest COE when
compared to IGCC and SCPC plants on account of its lower capital costs and now
lower fuel costs. Insights from the Belfer Center study cannot be applied to
NGCC plants because the results are only applicable to plants that use solid fuels.
However, NGCC plants are similar to SCPC plants because both are post-
combustion plants. Therefore, to estimate FOAK NGCC plant costs with CCS, the
following ratio is used:
𝐹𝑂𝐴𝐾 𝑆𝐶𝑃𝐶 𝑝𝑙𝑎𝑛𝑡 𝑤𝑖𝑡ℎ 𝐶𝐶𝑆 − 𝑁𝑂𝐴𝐾 𝑆𝐶𝑃𝐶 𝑝𝑙𝑎𝑛𝑡 𝑤𝑖𝑡ℎ𝑜𝑢𝑡 𝐶𝐶𝑆𝑁𝑂𝐴𝐾 𝑆𝐶𝑃𝐶 𝑝𝑙𝑎𝑛𝑡 𝑤𝑖𝑡ℎ 𝐶𝐶𝑆 − 𝑁𝑂𝐴𝐾 𝑆𝐶𝑃𝐶 𝑝𝑙𝑎𝑛𝑡 𝑤𝑖𝑡ℎ𝑜𝑢𝑡 𝐶𝐶𝑆
The value of this ratio is assumed to be the same for NGCC plants as well.
Therefore, using NOAK costs of an NGCC plant with and without CCS, the
calculation yields an estimate of $2172/kW for an FOAK NGCC plant with CCS.
Table 11: FOAK Costs for plants with CCS
Parameter Case 11 SCPC
w/o
Case 12 SCPC
Case 5 IGCC w/o
Case 6 IGCC
Case 13 NGCC
w/o
Case 14 NGCC
FOAK – Belfer Center
(+$85/MWh)
FOAK – Belfer Center
(+$85/MWh)
FOAK – Belfer Center
NOAK Costs TOC ($/kW) 2024 3570 2716 3904 718 1497 O&M (f) - $/kW pa 59 97 85 117 22 42 O&M (v) mills/kWh 5.0 8.7 7.8 9.9 1.3 2.6 CO2 TS&M mills/kWh
0 5.6 0 5.6 0 3.2
COE - (Model – Updated Economic Parameters)
70 123 92 134 58 84
Updated FOAK Costs TOC ($/kW) 2024 4909 3631 6364 718 2172 O&M (f) - $/kW pa 59 133 114 191 22 61 O&M (v) mills/kWh 5.0 12.0 10.4 16.2 1.3 3.7 CO2 TS&M mills/kWh
0 7.7 0 9.1 0 4.6
COE (Model - FOAK added to above)
70 155 114 199 58 98

78
Notwithstanding the differences between the technologies analyzed in Table 11,
the COE in year 1 is estimated to be in the range of $84 to $199/MWh, which represents
an increase of 40% to 180% over the COE of an SCPC plant without CCS. To consider
another measure of comparison, the average price of electricity in the Electricity
Reliability Council of Texas (ERCOT) Houston market in 2011 was approximately
$61/MWh (EIA, 2011). About 12% of the time, the price in the market averaged at
approximately $200/MWh. Such high prices were realized mostly during peak times of
the year in that market. Evidently, plants with CCS may need other incentives to be
competitive.
8.3 Analyzing the impact of incentives
The impact of a grant of $500 million, a PTC of 10%, an additional source of
revenue from using the captured CO2 for EOR at $20/tCO2, and a loan guarantee are
analyzed. With a loan guarantee, it is assumed that the project has access to more debt
(from 45% to 50%) at a lower rate (from 4.5% to 5.0%) because the government is
underwriting a certain portion of the total debt. With these changes, a project with CCS is
assumed to be able to raise debt on terms that are similar to those for established
technologies, as defined in the DOE baseline study. The cumulative impact of all these
incentives on the generic FOAK demonstration plants is presented below.
8.3.1 Impact of incentives on SCPC plants
The cumulative impact of a grant, PTC, EOR revenue, and loan guarantee on the
COE of an SCPC plant with CCS is illustrated in Figure 25. The EOR revenue has the
largest impact in reducing the COE, which is estimated at nearly 20% when you exclude
the savings from not having to pay TS&M costs. Including those savings, the impact
exceeds a 25% reduction in the COE. A $500 million grant reduces the COE by
approximately 8%. When the impact of all of these incentives is considered cumulatively,
the COE of an SCPC plant with CCS is still over 30% higher than an SCPC without
CCS.

79
Figure 25: Cumulative Impact of Incentives on FOAK SCPC plants with CCS
8.3.2 Impact of incentives on IGCC plants
The estimate for FOAK costs for an IGCC plant with CCS yields a COE of nearly
$200/MWh. This COE is higher than a similar estimate for an SCPC plant with CCS, and
the difference is attributed to the lower capital and operating costs for SCPC plants with
CCS and higher performance as measured by their capacity factors. The differences in
maturation of the technology contribute to the differences in these parameters.
Figure 26: Cumulative Impact of Incentives on FOAK IGCC plants with CCS
155 94 70
12 6 10 31
1 1
020406080
100120140160180200
CoE
(in
$/M
Wh)
SCPC plant with & w/o CCS
199
134
70 70
15 7
13 27
1 2
020406080
100120140160180200
CoE Grant PTC NoTS&M
EOR ChangeD:E
LowerRate of
Debt
CoE(after)
CoEw/o
CoEw/o
(SCPC)
CoE
($/M
Wh)
IGCC Plant with & w/o CCS

80
The cumulative impact of a grant, PTC, EOR revenue, and loan guarantee on the
COE of an IGCC plant with CCS is illustrated in Figure 26. Adding an additional source
of revenue has the highest impact in reducing the COE of an IGCC plant with CCS by
approximately 13%. The impact, in terms of percentage reduction on the base COE, is
lower than that in an SCPC plant with CCS because IGCC plants are more expensive.
The impact in an IGCC plant with CCS is even higher (~20%) when the TS&M costs are
eliminated. A grant of $500 million has the second highest impact on reducing the COE,
a 7% reduction. The impact of a loan guarantee is nominal because both the debt-to-
equity ratio and the rate of debt are assumed not to change significantly on account of the
loan being guaranteed. If the loan guarantee covers a significant proportion of total debt,
say 80% as proposed in some cases, the impact is expected to be higher.
8.3.3 Impact of incentives on NGCC plants
The COE of an NGCC plant is primarily driven by its operating costs. Therefore,
as increase in capital cost to reflect FOAK costs increases the COE by only about 17%
i.e. from $84/MWh to about $98/MWh.
Figure 27: Cumulative Impact of Incentives on FOAK NGCC plants with CCS
The cumulative impact of all incentives on COE is illustrated in Figure 27. The
EOR revenue and a $500 million grant have similar impacts on the COE, an
98 66 58 70
12 1 6 13 0.2 0.2
020406080
100120
CoE
(in
$/M
Wh)
NGCC with & w/o CCS

81
approximately 12 - 13% reduction in the COE. This is on account of the fact that a $500
million dollar grant is a much higher percentage of the total capital cost in an NGCC
plant when compared to IGCC or SCPC plants. Furthermore, NGCC plants are the least
carbon-intensive resulting in lower EOR revenues. When the TS&M savings are
included, EOR revenue contributes to an approximately 19% reduction in the COE. The
case of parity with an SCPC plant without CCS is considered in Figure 28. Parity is
achieved by varying the gas price such that the COE of an NGCC plant without CCS is
the same as the COE of an SCPC plant without CCS at $70/MWh. The results in the case
of parity with an SCPC plant are similar to those in Figure 27.
Figure 28: Cumulative Impact of Incentives for FOAK NGCC Plants (Case of gas price =
$6.10/MMBtu)
8.4 Discussion & policy implications
CCS adds to the total capital and operating costs of a power plant and has a
negative impact on its performance due to the energy penalty. While a grant helps
compensate for the increase in capital costs, EOR compensates for the loss of revenue.
Therefore, these incentives are found to have the most impact in terms of reducing the
base COE. A feed-in-tariff that is not market determined may have a similar impact on
the COE as EOR depending on the value of these incentives on a per MWh basis.
However, the added benefit of excluding the TS&M costs is not applicable for these other
incentives.
111
79 70 70
12 1 6
12 0.5 0.5
0
20
40
60
80
100
120
CoE Grant PTC NoTS&M
EOR ChangeD:E
LowerRate of
Debt
CoE(after)
CoEw/o
CoEw/o
(SCPC)
NGCC with & w/o CCS - Case of SCPC Parity
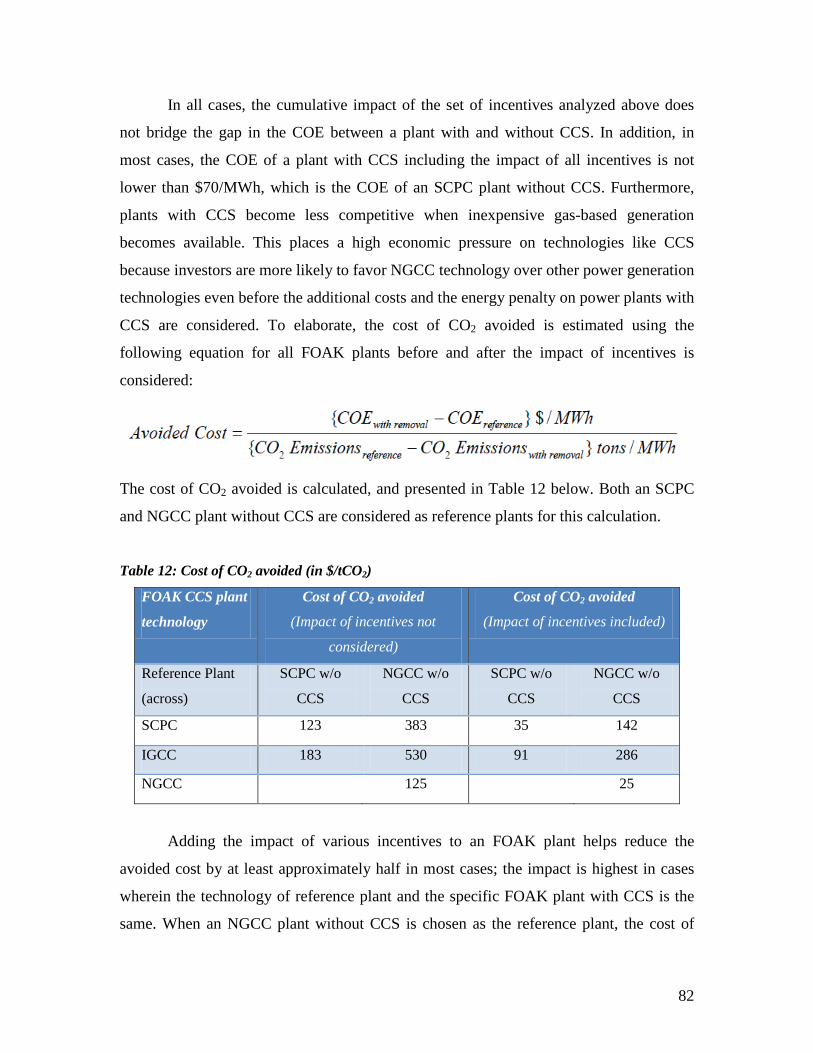
82
In all cases, the cumulative impact of the set of incentives analyzed above does
not bridge the gap in the COE between a plant with and without CCS. In addition, in
most cases, the COE of a plant with CCS including the impact of all incentives is not
lower than $70/MWh, which is the COE of an SCPC plant without CCS. Furthermore,
plants with CCS become less competitive when inexpensive gas-based generation
becomes available. This places a high economic pressure on technologies like CCS
because investors are more likely to favor NGCC technology over other power generation
technologies even before the additional costs and the energy penalty on power plants with
CCS are considered. To elaborate, the cost of CO2 avoided is estimated using the
following equation for all FOAK plants before and after the impact of incentives is
considered:
The cost of CO2 avoided is calculated, and presented in Table 12 below. Both an SCPC
and NGCC plant without CCS are considered as reference plants for this calculation.
Table 12: Cost of CO2 avoided (in $/tCO2)
FOAK CCS plant
technology
Cost of CO2 avoided
(Impact of incentives not
considered)
Cost of CO2 avoided
(Impact of incentives included)
Reference Plant
(across)
SCPC w/o
CCS
NGCC w/o
CCS
SCPC w/o
CCS
NGCC w/o
CCS
SCPC 123 383 35 142
IGCC 183 530 91 286
NGCC 125 25
Adding the impact of various incentives to an FOAK plant helps reduce the
avoided cost by at least approximately half in most cases; the impact is highest in cases
wherein the technology of reference plant and the specific FOAK plant with CCS is the
same. When an NGCC plant without CCS is chosen as the reference plant, the cost of

83
CO2 avoided is higher in all cases by at least three times when compared to the estimated
avoided costs when an SCPC plant without CCS is the reference plant. This result is
expected considering that NGCC plants have lower emissions and a lower COE. This
result explains the increasing economic pressure on low carbon technologies arising from
the availability of inexpensive gas-based generation.
As evidenced by the experience of the developers of demonstration projects,
plants with CCS are not competitive with a reference plant even when the impact of
various incentives is considered. If developers cannot pass their costs on to the
ratepayers, it becomes exceedingly difficult to make a case for why a plant with CCS is
financially viable. The appropriate strategy, therefore, may be to increase the quantum of
incentives with the most impact and offer it to fewer projects and/or allow project
developers to recover their costs by passing them on to the ratepayers. As an
investigation of the Kemper County project in Chapter 9 reveals, the mechanism by
which the costs are passed on to the ratepayers can also be challenging.

84
9. KEMPER COUNTY – A CASE OF A SUCCESSFUL PROJECT 9.1 Project description (MPC, 2013)
Located in Kemper County, Mississippi, this 582 MW project is arguably the
most advanced CCS demonstration project in the U.S. The proposed plant uses IGCC
technology and is designed to capture at least 65% of its CO2 emissions. Owned by the
Mississippi Power Company (MPC, a subsidiary of Southern Company), the project uses
a technology that was developed jointly by the Southern Company, KBR, and the DOE,
the air-blown Transport Integrated Gasifier (TRIG) technology (NETL, 2013). This
technology enables MPC to capitalize on the abundant reserves of lignite in the state,2
while simultaneously reducing the environmental impact of power plants that use coal
(MPC, 2013a). Furthermore, MPC’s experience with CCS is likely to prepare the
company for emission standards that are expected to become increasingly stringent. The
plant is scheduled to be operational in May 2014.
The plant is located next to a lignite mine site that spans an area of approximately
31,000 acres. These mines are owned by MPC, and developed by Liberty Fuels, a
subsidiary of North American Coal Corporation (NACC) (NETL, 2013). In June 2012,
the mine obtained a permit approval from the Mississippi Department of Environmental
Quality, thus securing a cheap source of fuel for the plant (World Fuels, 2012). The fuel
sourced from the mine has an average heat content of 5290 Btu/lb (as received) and
moisture content of at least 40% (NETL, 2011). Once operational, the plant will have a
heat rate of 11,708 Btu/kWh and generate approximately 3 million tons of CO2 annually
for EOR. Other by-products include 135,000 tons of sulphuric acid and 20,000 tons of
ammonia (NETL, 2011). Revenues generated from the sale of these by-products are not
estimated to be significant when compared to that generated from selling the CO2 for
EOR (Esposito, 2012).
Several benefits are expected to accrue to the state of Mississippi from the
construction and operation of this power plant (MPC, 2013a). The plant helps the state
diversify its electricity mix, which, in turn, protects consumers from short-term fuel price 2 Lignite accounts for approximately half of the world’s coal supply (MPC, 2013)

85
shocks. In terms of tax revenue, the plant will generate approximately $75 million during
construction and nearly $30 million annually once the plant is commissioned. As per
MPC, the project employs 3500 workers on site, and will generate nearly 12,000 direct
and indirect jobs during the construction phase. Once operational, the plant is expected to
generate over a 1000 permanent jobs. The project is also expected to increase the oil
production of Mississippi and therefore the U.S. by 2 million barrels annually.
9.2 Regulatory support – federal and state-level
The Kemper County project qualified for Round 2 of the DOE’s CCPI. Through
this initiative, the project qualified for a $270 million grant, which is nearly 10% of the
then estimated project cost of $2.8 billion (NETL, 2013). The project is also receiving
support in the form of federal investment tax credits to the tune of $133 million (GHG
News, 2012). After initially approving a cost of $2.4 billion, the Mississippi State Public
Service Commission (MSPSC) approved a 20% increase in capital costs (Arnold &
Porter LLP, 2010). The Sierra Club appealed the validity of this decision at the
Mississippi Supreme Court; details of the case and implications on the project are
provided in the next section.
With costs escalating during construction on account of factors such as switching
between contractors and related delays (Washington Examiner, 2012), the project looks
for any additional support that it can obtain. In 2012, the project was already nearing its
$2.88 billion project cost cap as approved by the MSPSC, and MPC requested a $55
million rate increase in June which was subsequently denied by the Mississippi court
(Reuters, 2012). The DOE is also considering providing a loan guarantee to the project
that will cover up to 80% of its costs (Mitchell Williams, 2012). Under these conditions,
a federal loan guarantee may help alleviate the impact of escalating costs on the financial
viability of the project. However, MPC has since withdrawn its request for a $1.5 billion
federal loan guarantee after the MSPSC approved a settlement that allowed the company
to pursue legislation to issue securitized bonds of up to $1 billion to recover costs over
the $2.8 billion cap (Reuters, 2013). Apart from the direct financial support, federal
agencies are considering supporting organizations that have a stake in the project. The

86
Rural Utilities Service (RUS) may provide a $480 million loan guarantee to South
Mississippi Electric Power Association (SMEPA) to support their acquisition of 15% in
the project (Federal Register, 2012).
For a power plant that uses commercially available technology, potential
financiers consider the regulatory risk associated with delays in approvals. Therefore,
securing early environmental approvals for the plant’s lignite mine contributes positively
to regulatory risk mitigation. The potential financiers of the project are also likely to be
concerned with the cost and performance related uncertainty, especially with the use of a
new technology. Therefore, strong support from federal and state government agencies
helps mitigate some of these risks perceived by potential financiers.
9.3 MSPUC V. Sierra Club (Arnold & Porter LLP, 2010)
In January 2009, MPC filed a petition with the MSPSC to seek permission to
build the proposed plant in Kemper County. MPC argued that as per Mississippi statute,
this power plant was required to serve the present and future “public convenience and
necessity”. MPC also argued that the MSPSC should either approve the proposed plant
right away for continued access to federal subsidies or rely on natural gas-based
generation that may be subject to price volatility. In its petition, MPC also indicated that
some risk needs to be shifted to the ratepayers during the construction phase of the
project through the construction work in progress (CWIP) mechanism. The CWIP
mechanism allows the project to recover costs during construction itself i.e. even before
the plant is operational, a certain portion of construction costs are recovered by increasing
the rate that consumers have to pay. This is to ensure that the company can maintain the
credit rating needed to raise the significant amount of capital needed for the project.
When MPC applied to the MSPSC for a Certificate to build the plant, the estimated cost
was indicated as $2.5 billion.
The MSPSC divided the hearing into two schedules - the first to determine a
reasonable range of forecasts for electricity demand and a consensus on the existing and
likely sources of supply. In Phase I, MPC showed that in 2014, the state could need

87
additional capacity ranging from 304 to 1276 MW. The second phase was to determine
what sources of supply were available to meet the forecasted demand, and the Kemper
County project was evaluated as source of supply. The MSPSC requested interested
parties to submit their bids, and the Boston Pacific Corporation was used as an
independent evaluator. During the second phase hearing in February 2010, MPC
requested that the company be allowed to exceed its cost estimate by as much as 33% to
avoid the risk of a downgrading credit rating and requested full CWIP financing on the
project. However, MPC maintained that the risk of rising capital costs was a manageable
one for consumers. The Sierra Club submitted that a hard cap must be imposed on MPC
if a certificate is granted, and that even a 20% cost overrun implies that the Kemper Plant
would be more expensive than natural gas-fired plants in the majority of the scenarios
presented. The order dated April 29, 2010 found that the Kemper plant did not serve the
“public convenience and necessity”. MPC was given 20 days to accept the conditions
proposed by the MSPSC – i) $2.4 billion cap and, ii) no CWIP.
MPC filed a Motion for Rehearing, in which it requested permission for a 20%
cost overrun and 100% CWIP. In an order dated May 26, 2010, the MSPSC reversed its
previous decision and stated that the project would be approved if MPC agreed to cap any
cost overruns at 20%. The MSPSC supported its decision by stating that the Boston
Pacific Corporation’s testimony indicated that 20% cost cap would be on the high end of
the acceptable range of cost caps that would still make the Kemper plant the best overall
choice for customers. MPC agreed to the conditions set out in this order, and a Certificate
to build the Kemper plant was issued to MPC on June 3, 2010. The Sierra Club filed a
petition within 30 days stating that i) nothing in the Boston Pacific Corporation’s
testimony supported the MSPSC’s decision, ii) the majority’s action was not supported
by record and was contradictory to its previous decision thus rendering it “arbitrary and
capricious”, and consequently, iii) the MSPSC’s decision to grant MPC a Certificate to
build the Kemper plant must be vacated.
In response to the Sierra Club’s petition, the MSPSC entered an order in favor of
MPC. The Sierra Club appealed to the Chancery Court of Harrison County, which

88
affirmed the MSPSC’s decision on the matter. The Sierra Club then appealed with the
Supreme Court of Mississippi, which stated that the MSPSC’s findings must be
“supported by substantial evidence presented,” which “shall be in sufficient detail to
enable [this] court on appeal to determine the controverted questions presented, and the
basis of the commission’s conclusion.” In a judgment delivered on February 28, 2011, the
Supreme Court found that the MSPSC’s approval of the project failed to satisfy the
abovementioned requirement, and reversed the Chancery Court’s judgment and the
MSPSC’s order, and remanded to the MSPSC for further proceedings. In response, the
MSPSC issued a more detailed order on 24 April 2012 authorizing MPC to continue the
project (HighBeam Business, 2012). The Sierra Club has contested this order.
Legal challenges to projects of this nature add to the risks perceived by potential
financiers of the project. It took three years from the time that MPC applied for a
Certificate to build the plant for the MSPSC to issue a detailed order authorizing MPC to
continue the project. MPC was able to mitigate some of the risks associated with project
delays and related escalation because the company chose to continue with plant
construction. Notwithstanding the debate surrounding cost overruns, MPC also requested
a 13% rate increase that would have generated $58 million (Reuters reported this as $55
million (Reuters, 2012)) in CWIP money (Mississippi Business Journal, 2013). When this
petition was denied by the MSPSC, MPC appealed to the Mississippi Supreme Court. In
a settlement between the MSPSC and MPC, it was decided that i) the hard cap on project
costs would be lowered from $2.88 billion to $2.4 billion, ii) the ratepayers would get
10% royalty share in the plant’s TRIG technology, and iii) if CWIP were granted to the
company, it cannot exceed $172 million, and the money would be held in an escrow and
only flow to the company if the Mississippi Supreme Court allows MPC to continue with
the project (Mississippi Business Journal, 2013). Subsequently, MPC filed for CWIP for
the project to recover $172 million, which may represent a 21% increase in the price of
electricity for retail customers. If approved, the typical residential customer using 1,000
kWh a month will see an increase of less than a $1 a day on bills in 2013 (MPC, 2013b).

89
9.4 Financial analysis & details on EOR arrangement
The assumptions used for the financial analysis in this section are given in Table
13 below. The parameters highlighted in blue most closely reflect project parameters, and
those highlighted in black are consistent with assumptions in the DOE study.
Table 13: Kemper County - Assumptions for Economic Analysis
Parameter Kemper County
Remarks
PLANT CHARACTERISTICS
Net MW 582
Capacity Factor (CF) 85% To generate ~3 Mtpa, CF = ~85%
COSTS
Total Overnight Cost $2.88 billion Hard-cap provided by PUC; MPC is allowed to pass through costs to consumers to the extent of the cap
Overnight Cost ~5000/kW
Working Capital 0 Zero for all parameters
FUEL & BY-PRODUCTS
Heat Rate 11708 Btu/kWh
Source: National Energy Technologies Laboratory (NETL)
Fuel Price $1.77/MMBtu EIA: 2010 price
Fuel Price escl. (real) 0.5% EIA: Avg real escl from 1980 - 2011
CO2 Generated Kg- CO2/MWh
1046 Carbon intensity assumed to be the same as Shell-IGCC = 197 lb/MMBtu
CO2 Captured Kg- CO2/MWh
680 65% Capture considered
CO2 Emitted Kg- CO2/MWh
366
O&M
O&M (fixed) $150 / kW / year
Adding 25% to O&M Costs of DoE Base Case
O&M (variable) 12.4 mills/kWh
Adding 25% to O&M Costs of DoE Base Case
TS&M costs 0 No TS&M costs assumed as CO2 is used for EOR
TAX & DEPRECIATION
Tax rate 39.2% Corporate Tax rate increased to 39.2%
Depreciation 150% declining balance
Depreciation over 20 years

90
% of total overnight capital that is depreciated
100% Even if a substantial amount of TOC is non-depreciable, it introduces a small error
FINANCING
Debt repayment 15 years
Percentage Debt 45% Lower % debt because of higher risk
Rate of Debt 5.5% Higher debt rate because of higher risk
Rate of Equity 12%
CAPITAL EXPENDITURE
Capital Expenditure Period 5 years
Escalation of costs during construction
3.60%
Distribution of capital costs 10%, 30%, 25%, 20%,
15%
Distribution of costs during construction Construction began in 2010, commissioning end 2014 – typical S-curve distribution assumed
For the purposes of this analysis, it is assumed that the MSPSC has authorized
MPC to pass on capital costs of up to $2.88 billion to the ratepayers, it has not granted
CWIP, and that MPC is still considering a loan guarantee. These assumptions are chosen
considering that the $172 million increase to ratepayers was reduced to a maximum of
$156 million by the MSPSC on March 22, 2013 (MSPSC, 2013). Further, the MSPSC
specified that the annualized CWIP amount shall be staggered as follows – i) beginning
from the first billing cycle in April 2013 to the last billing cycle in December 2013, the
annualized CWIP amount will be $125 million, and ii) beginning from the first billing
cycle in January 2014 to the last billing cycle in April 2014, MPC’s annualized CWIP
retail revenue requirement shall be escalated to $156 million. These revenue adjustments
represent increases of 15% for 2013 and 3% for 2014. It remains to be seen if MPC
accepts the abovementioned amounts or files a motion for rehearing considering that the
maximum amount agreed upon in the court settlement was $172 million, and that the cost
cap has been lowered from $2.88 billion to $2.4 billion.
As mentioned previously, the Kemper County project has access to a grant of
$270 million, investment tax credits of up to $133 million, and EOR revenue amounting
to approximately $50 million annually (MPC, 2012). Although this revenue is assumed to
be the total from the sale of all by-products, EOR is assumed to account for a significant

91
percentage of this revenue (Esposito, 2012). Therefore, it is assumed that all the captured
CO2 is used for EOR. The impact of the loan guarantee is assumed to be two-fold - the
project has access to more debt (from 45% to 80%), and half of the total debt has a lower
rate (from 5.5% to 4.5%) because the government is underwriting a certain portion of the
total debt.
Figure 29: Impact of Incentives on COE of Kemper County
Similar to analyses presented before, the cost with and without accounting for the
impact of various incentives is presented in Figure 29. The revenue from EOR adding up
to approximately $50 million in annual revenues has the most impact in reducing the
COE borne by the ratepayers. The reduction is approximately 9% from the base COE of
$139/MWh. The cumulative impact of a loan guarantee ($11/MWh + $2/MWh) is as
effective as the EOR revenue in terms of reducing the COE. The impact of the grant is
the next largest at an approximately 4% reduction from the base COE. The ITC protects
net revenue (total revenue minus operating costs) from taxation to the extent of the credit.
The value of this tax credit is then added to the revenue after tax. When the net revenue
before tax is not very high, the impact of a tax credit is minimal. A tax credit is most
effective for a company that has a lot of spare cash. For example, if the Kemper County
139 105
70
6 2 13 11 2
020406080
100120140160
CoE
(in
$/M
Wh)
Impact of Incentives

92
project were funded on the balance sheet of Southern Company, the parent company of
MPC, the impact of the ITC may be higher. However, technologically risky and capital-
intensive projects such as Kemper County are typically developed in a special purpose
vehicle (SPV) i.e. a separate project company to insure shareholders from the risks
associated with the project.
Denbury Resources Inc. entered into a purchase contract with MPC to purchase
70% of the CO2 captured from the Kemper County plant (Business Wire, 2011). As part
of the arrangement between MPC and Denbury, MPC agreed to build a portion of the
pipeline leading to the field in exchange for an EOR price that would have been higher
that the price that Denbury was willing to offer if it had to build that portion of the
pipeline instead (Esposito, 2012). Evidently, it was more economical for MPC to have
incurred the cost and received an estimated $13.65/tCO2, than not incurring the cost of
the pipeline and accepting a lower EOR price. Based on an analysis conducted using the
financial model, for every percentage of the total project cost ($2.88 billion) that MPC
spent on building the pipeline, it should have received an additional $0.50/tCO2, (see
Figure 30. The fact that MPC chose to build the pipeline implies that $13.65/tCO2 was
higher than the base price that Denbury was offering. By making the choice to build a
portion of the pipeline, MPC has attempted to reduce the burden on the ratepayers.
Figure 30: Parity between EOR Price & Capital Cost of Pipeline (in % of Kemper Costs)
10.00
11.00
12.00
13.00
14.00
15.00
16.00
17.00
18.00
19.00
20.00
1% 3% 5% 7%
EOR
Pric
e ($
/ton
ne C
O2)

93
9.5 Conclusions of this case study
Based on an investigation of the Kemper County case, factors that have contributed to the
success of the project are outlined below:
a. Passing costs on to the ratepayers – As is established previously, a demonstration
plant with CCS cannot compete with a reference plant without CCS (typically
SCPC) in terms of the COE. Therefore, other mechanisms of cost recovery are
needed for a demonstration plant to be economical. In the Kemper County case,
this mechanism is a rate-based pay i.e. the COE of the Kemper plant, an estimated
$105/MWh (see Figure 29) in its first year of operation, are passed on to the
ratepayers. MPC claims that the above price represents an average retail rate
increase of 20 – 25%, which implies that retailers on an average pay an estimated
$79 – $84/MWh plus transmission and distribution charges. Given the
uncertainties in this analysis, this seems consistent with the data on average retail
prices in Mississippi, which was approximately $85/MWh in January 2012 (EIA,
2013).
b. Additional government support – As part of a settlement between the MSPSC
and MPC, it was agreed that the price cap would be lowered from $2.88 billion to
$2.4 billion in exchange for CWIP financing to the extent of $172 million, and
legislative support to issue bonds worth up to $1 billion to recover costs over and
above the cap. Notwithstanding the legal challenges, this is indicative of the
willingness of relevant government authorities to support the project, and ensure
that the plant is commissioned. This helps inspire confidence in potential
financiers that the risks associated with the project can be mitigated.
c. Decision to continue construction – Despite all the legal and regulatory
challenges, MPC decided to continue construction at site. This may have been
critical in terms of avoiding cost escalation related to construction delays, delays
in contractor payments, and other related factors. The additional government
support, as described above, may have given the developers the confidence
needed to continue construction at site.
d. Storage related risks – Considering that projects of this nature are subject to
technological and regulatory risk, adding on the geological risk for projects that

94
only store the CO2 may be a strong deterrent for developers. Unless a clear policy
on storage is executed and a source of revenue is made available for CO2 that is
stored in deep saline aquifers, the developers of CCS demonstration projects may
only engage in projects that include revenue generation through EOR. The strong
focus on EOR by the DOE (DOE, 2012), and consequent efforts to rebrand CCS
as CCUS (carbon capture utilization & storage) only reinforces a potential
developer’s inclination towards projects with EOR.

95
10. POLICY DISCUSSION In this chapter, the policy implications of the results presented in this thesis are
discussed. Then, the factors that make the execution of these policy goals challenging are
investigated. These factors include the current policy environment for the development of
low-carbon technologies in addition to the factors that are specific to CCS technology.
Considering that there exists a need to deploy CCS technology in the long-term,
recommendations for policies that may better support the technology development of
CCS are presented.
10.1 Analysis of the state of CCS development
CCS technology development appears to have slowed recently. The analysis
presented thus far supports the following conclusions regarding the demonstration phase
of CCS, and the need to develop this technology:
a. Higher than expected costs of demonstration projects: There is a high degree of
uncertainty associated with both the project definition and the process information
in FOAK plants. As an investigation of the ZeroGen project reveals, the
resolution of these uncertainties at different stages of project execution results in
higher than the initially estimated costs. In the ZeroGen project, the resolution of
these uncertainties is estimated to have added 40% to the initial project cost of
AU$4.3 billion. In addition, FOAK plants are more vulnerable to interest and
exchange rate volatility, which also increases costs. Such high costs necessitate
policy support through various incentives for demonstration projects.
b. Current incentives are inadequate: CCS demonstration projects are not
economical in a market-based system, even when the impact of currently
available incentives is considered. The gap between the COE of an FOAK plant
and an SCPC plant without CCS ranges from $9 - $64/MWh depending on which
technology the FOAK plant uses. This gap increases when an NGCC plant
without CCS becomes the reference plant, thus increasing the economic pressure
on CCS demonstration projects.
c. Long-term need for CCS: A technology like CCS is essential in meeting the
demands of a low-carbon economy in the long-term. As emission caps get more

96
stringent, the role of CCS becomes more important. Further, its role is not
expected to diminish even with the availability of inexpensive gas-based
generation. To ensure that CCS technology is available for deployment in the
long-term, resources need to be allocated for its development in the short-term.
10.2 Short-term outlook
The short-term outlook for CCS technology is not encouraging given the results
discussed above. In this section, the factors that may contribute to a challenging
environment for the development of CCS technology are investigated. While some of
these factors are endogenous to the technology, external conditions also impact a
potential developer’s decision to build a demonstration plant.
10.2.1 RD&D spending & other policy drivers
The financial crisis of 2008, which led to a recession, changed the U.S.
administration’s priorities. Just as the U.S. economy was beginning to recover, the
deepening European debt crisis slowed progress. Cutting government spending and
reducing unemployment, therefore, are now the major concerns in these key
administrations. Even the ARRA, which provided significant financial support for CCS
demonstration projects, was sold to the American public as an initiative for employment
generation. As a result of tighter national budgets, discretionary spending including R&D
funding could be reduced, which is likely to impact funding for demonstration projects in
the future. If government support for CCS RD&D is expected to reduce, potential
developers of are less likely to invest their own funds while assuming the already high
risks associated with demonstration projects.
Under current economic conditions, other policy drivers such as a carbon policy
have not been very effective either. The economic downturn decreased demand for
Emission Trading Allowances (ETAs) resulting in lower than expected prices for these
allowances in the EU. In April 2013, after the European Parliament opposed a scheme
that could have helped boost carbon prices by extracting allowances from the market and
selling them later, prices reached €3/ETA (Lupion and Herzog, 2013). As mentioned
previously, the low ETA prices also reduced the total quantum of funding under the

97
NER300, which was initially estimated at €4.5 billion, by more than half. Therefore, a
carbon policy alone may not provide the requisite policy support for the developers of
demonstration projects.
10.2.2 Current trends in the energy sector
The current trends in the energy sector combined with policies that reinforce these
trends may also render technologies like CCS uneconomical. To elaborate, on 27th March
2012, the Environmental Protection Agency (EPA) released its proposal for “new source
performance standards” (NSPS) of 1000 lb/MWh for carbon emissions from new
electricity generating units (EGUs). As the EPA outlined in its notice for these standards
(EPA, 2012a), the rule does not impose any additional costs on the electric power sector
because i) NGCC is likely to be the predominant choice for new fossil fuel-based
generation, ii) NGCC is deemed the “best system of emission reduction” (BSER) for the
purposes of NSPS because these plants emit CO2 at a rate lower than 1000 lb/MWh
without requiring CCS, and iii) projections for the electric power sector estimate that few,
if any, new coal-fired power plants are likely to be built (see Figure 31), for which the
EPA estimates that CCS shall become available within the first 10 years of the plant’s
operation or by 2020. Therefore, the EPA’s emission standards may reinforce the trend of
fuel-switching from coal to natural gas for fossil fuel-based generation and arguably
delay the need for CCS development in the short term.
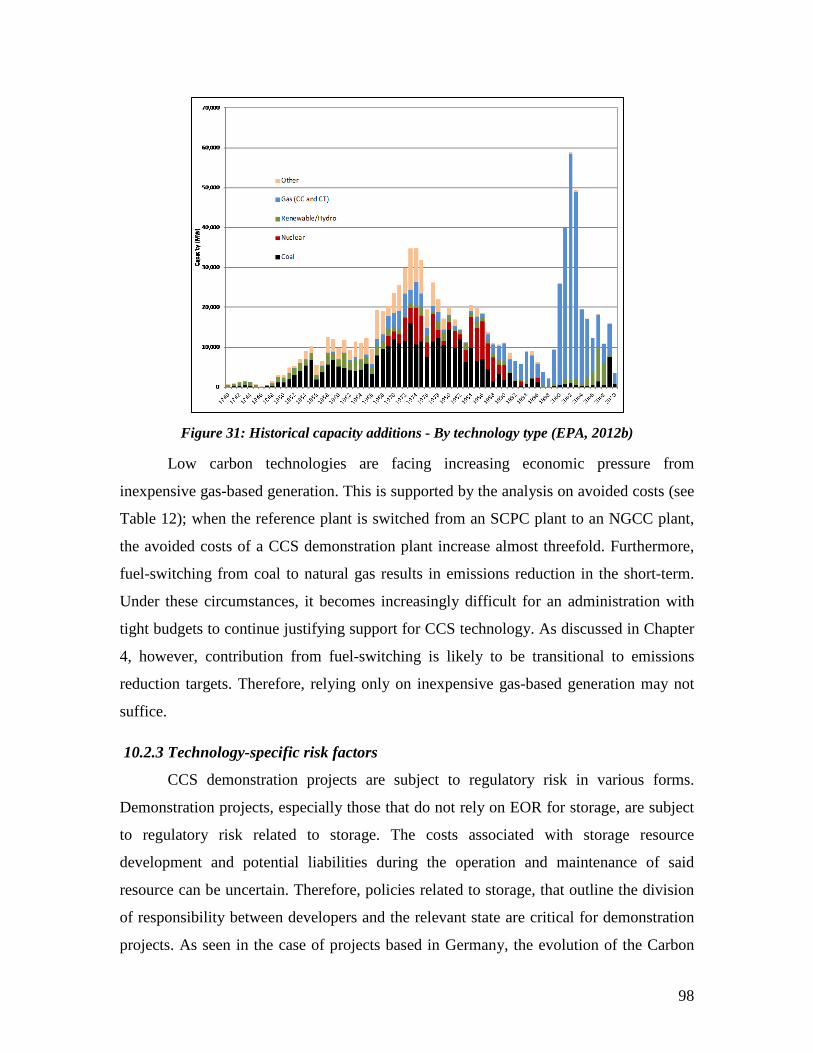
98
Figure 31: Historical capacity additions - By technology type (EPA, 2012b)
Low carbon technologies are facing increasing economic pressure from
inexpensive gas-based generation. This is supported by the analysis on avoided costs (see
Table 12); when the reference plant is switched from an SCPC plant to an NGCC plant,
the avoided costs of a CCS demonstration plant increase almost threefold. Furthermore,
fuel-switching from coal to natural gas results in emissions reduction in the short-term.
Under these circumstances, it becomes increasingly difficult for an administration with
tight budgets to continue justifying support for CCS technology. As discussed in Chapter
4, however, contribution from fuel-switching is likely to be transitional to emissions
reduction targets. Therefore, relying only on inexpensive gas-based generation may not
suffice.
10.2.3 Technology-specific risk factors
CCS demonstration projects are subject to regulatory risk in various forms.
Demonstration projects, especially those that do not rely on EOR for storage, are subject
to regulatory risk related to storage. The costs associated with storage resource
development and potential liabilities during the operation and maintenance of said
resource can be uncertain. Therefore, policies related to storage, that outline the division
of responsibility between developers and the relevant state are critical for demonstration
projects. As seen in the case of projects based in Germany, the evolution of the Carbon

99
Storage Law contributed to developers’ decisions to withdraw. In the U.S., applying
permitting rules pertaining to Class VI wells to CCS demonstration projects with storage
may have increased the regulatory risks associated with these projects. The length of time
for obtaining permits and for post-injection site care (PISC), and the long-term liability
presumptions inherent in Class VI rules may not be aligned with what potential
developers are comfortable assuming (Van Voorhees, 2013).
In a market-based regime in which the cheapest plants are dispatched first,
developers are subject to dispatch risk i.e. the risk that power from a CCS demonstration
plant is too expensive to be dispatched. This risk may be partly mitigated if a carbon
price were applied to fossil fuel-based generation to reflect its true costs. However, with
higher than anticipated costs and the lack of a strong carbon policy, projects such as
Kemper County and American Electric Power (AEP) Mountaineer requested relevant
Public Utilities Commissions (PUCs) for permission to pass their costs on to the
ratepayers. As an investigation of the Kemper County project reveals, even when the
process results in an approval, it can be subject to legal hurdles and resulting delays.
10.2.4 Passing costs onto consumers
In the face of the challenges described above, seeking regulatory approval to pass
the costs of a demonstration project onto the ratepayers seems to be the strategy that
potential developers are adopting. As described in Chapter 9, members of organizations
internal and external to the regulatory process opposed the project at various stages. The
reasons for their opposition included i) escalating project costs, ii) the availability of
inexpensive gas-based generation, and iii) MPC consumers assuming the cost burden for
developing a technology benefits the company. To address the latter concern, MPC and
the MSPSC agreed to a royalty-sharing model in a recent settlement i.e. MPC agreed to
share royalties from TRIG technology with consumers that are assuming the cost burden.
Considering that the development of the TRIG technology enables the state to use its
abundant lignite reserves and to produce CO2 for EOR, regulatory bodies in Mississippi
seem keen to support the project. Similar conditions may not be available to other
projects for such a model to be replicable. This is evident from the decision delivered by

100
regulators for the AEP Mountaineer project; the PUC in Virginia declined AEP’s request
for a $74 million rate increase to support its demonstration project (Bloomberg, 2011).
The Virginia State Corporation Commission (SCC) focused on the distributional
impacts if AEP’s request to pass costs on to its ratepayers were approved. To elaborate,
while the SCC agreed that it is reasonable for AEP to evaluate options for emissions
reduction, the regulator considered it unreasonable for AEP to incur high project costs
and recover them from its ratepayers (SCC, 2010). This request was deemed
unreasonable especially considering that the beneficiaries of the technology such as
consumers of AEP and of other U.S. utilities, shareholders of AEP etc. constituted a
larger group than the group of ratepayers shouldering the financial burden. Therefore,
such distributional impacts may necessitate different strategies to recover the costs of
demonstration projects.
10.3 Policy recommendations
The costs of CCS technology development may be recovered from sources such
as – i) markets created by comprehensive policies on carbon or by the need for EOR, ii)
ratepayers, iii) taxpayers, and iv) potential investors or equity holders of companies
developing the technology. As the administration’s priorities change under challenging
economic conditions and support for CCS technology wanes, equity holders are
discouraged from investing in the technology. Furthermore, in the U.S. context,
developers may be disinclined to allocate their resources into CCS RD&D because there
exists no comprehensive policy on carbon that they need to prepare for. EOR markets are
specific to particular regions, and therefore limited. The taxpayers indirectly support CCS
technology development through grants from federal organizations such as the DOE. As
national budgets become more constrained, indirect support from taxpayers may reduce
in magnitude. Therefore, the continued development of CCS technology may require
support from the ratepayers as well. In addition, recovering costs from the ratepayers may
need to be executed at the federal level to mitigate adverse distributional impacts, as
described above in relationship to the AEP Mountaineer Project.

101
An example of such a policy is a carbon surcharge of $0.001/kWh levied on all
electricity generated from fossil fuels. This policy may help spread the high costs of
demonstration projects across the potential beneficiaries of CCS technology. Considering
the fact that electricity generation from fossil fuel sources in 2010 totaled to
approximately 2880 billion kWh (EIA, 2012b), this surcharge could accumulate nearly
$3 billion annually for all climate change related initiatives. Assuming that an average
household in the country consumes about 11500 kWh annually and pays approximately
$0.12/kWh (EIA, 2011a), the household spends about $1380 on electricity annually. The
proposed surcharge would add approximately $12 to an average household’s annual
expenditure on electricity, which represents an increase of less than 1% compared to the
estimated 20 – 25% increase on the ratepayers of MPC. Legal barriers arising out of
conflicting state and federal mandates may prevent the federal government from
establishing such a policy. Allison supports this idea by suggesting that broad changes in
standard operating procedures (SOPs) are difficult to enforce (Allison, 1969). These
SOPs, therefore, become institutional barriers to instituting policies that are designed to
address an issue such as climate change. A discussion on these barriers, however, is not
in the scope of this chapter.
It is important to understand the impact of such a surcharge on utilities in addition
to considering how consumers are affected. Olson suggests that regulated entities in a
concentrated industry have an incentive to capture the regulatory process because the
benefits that could accrue to them are distributed among a few entities (Olson, 1984).
Therefore, in the electric power sector, utilities have an incentive to weaken any policy
that may impose additional costs on them. A suggested mitigation measure is to
compensate utilities in order to disincentivize them from weakening any policy that
affects them. The recommended surcharge may be an efficient way to do so because the
collected funds are likely to serve as adequate compensation for the utilities developing
CCS technology. Further, industrial nations such as the U.S. may have an interest in
supporting policies for technology transfer to create a global market for CCS, which
serves as an added incentive for technology developers in the country. In conclusion, to
ensure the availability of CCS technology in the long-term, the high costs of

102
demonstration projects need to be incurred in the short-term. Distributing these costs
among a large number of ratepayers may be the most practical way forward given the
current economic and policy environment.

103
11. BIBLIOGRAPHY AEO. (2012) Annual Energy Outlook 2012 – Energy Prices by Sector & Source, United
States, Reference Case. Energy Information Administration. Available at
http://www.eia.gov/forecasts/archive/aeo12/data.cfm#enprisec
AEO. (2013). Annual Energy Outlook 2013 Early Release – Table 8.2 Cost and
Performance Characteristics of New Central Station Electricity Generating
Technologies. Energy Information Administration. Available at
http://www.eia.gov/forecasts/aeo/assumptions/pdf/table8_2_er.pdf
Alabama Media Group. (2010). Southern Company pulls out of carbon capture project
at Barry Steam plant. Available at
http://blog.al.com/live/2010/02/southern_company_pulls_out_of.html
Allison, Graham. (1969). Conceptual Models and the Cuban Missile Crisis. American
Political Science Review, V 63, N 3.
Arnold & Porter LLP. (2010). In the Chancery Court of Harrison County, Mississippi –
Sierra Club V. Mississippi Public Service Commission and Mississippi Power
Company, Inc. Available at
http://www.arnoldporter.com/resources/documents/Sierra%20Club%20v.%20Mis
sissippi%20Public%20Service%20Comm.pdf
Ashworth, Peta, Rodriguez, Shelley and Alice Miller. (2011). Case Study of ZeroGen
Project. Commonwealth Scientific and Industrial Research Organization
(CSIRO). Available at: http://www.csiro.au/files/files/pyao.pdf
Basin Electric. (2011). Feature Article - Fresh tech, difficult decisions. Available at
http://www.basinelectric.com/Miscellaneous/pdf/FeatureArticles/Fresh_Tech,_dif
ficul.pdf
BBC. (2011, November 9). Carbon capture plan for Peterhead. Available at
http://www.bbc.co.uk/news/uk-scotland-scotland-business-15650454
BEA. (2013). National Economic Accounts – Current-dollar and “real” GDP. Bureau
of Economic Analysis. U.S. Department of Commerce. Available at
http://www.bea.gov/national/index.htm#gdp
104
Bellona. (2010, November 19). EU launches world’s largest CCS funding scheme. The
Bellona Foundation. Available at
http://www.bellona.org/news/news_2010/largest_CCS_fund_for_CCS
Bloomberg. (2011, July 21). Carbon Capture Hopes Dim as AEP Says It Got Burned at
Coal Plant. Available at http://www.bloomberg.com/news/2011-07-21/carbon-
capture-hopes-dim-as-aep-says-it-got-burned-at-coal-plant.html
BusinessWeek. (2012, March 30). PGE Says Belchatow Carbon Capture Project Needs
State Support. Bloomberg News. Available at
http://www.businessweek.com/news/2012-05-30/pge-says-belchatow-carbon-
capture-project-needs-state-support
Business Wire (2011, March 16). Denbury Enters Into Two Industrial CO2 Purchase
Contracts. A Berkshire Hathaway Company. Available at
http://www.businesswire.com/news/home/20110316005613/en/Denbury-Enters-
Industrial-CO2-Purchase-Contracts
Business Green. (2010). Updated: E.ON pulls out of UK CCS Competition. Available at
http://www.businessgreen.com/bg/news/1870013/updated-eon-pulls-uk-ccs-
competition
Carbon Capture Journal. (2007, May 24). BP scraps Peterhead carbon capture project.
Digital Energy Journal. Available at
www.carboncapturejournal.com/displaynews.php?NewsID=12
Carbon Capture Journal. (2010, November 5). Shell Barendrecht project cancelled.
Digital Energy Journal. Available at
www.carboncapturejournal.com/displaynews.php?NewsID=676
Commodities Now. (2012). Carbon Pricing Mechanism Developments. Available at
http://www.commodities-now.com/reports/environmental-markets/13392-carbon-
pricing-mechanism-developments.html
Courier Mail. (2010, December 19). State Government drops ZeroGen project after
taxpayers pump $150 million into the plan. The Sunday Mail (Queensland).
Available at http://www.couriermail.com.au/news/queensland/state-governmnet-
drops-zerogen-project-after-taxpayers-pump-150-million-into-the-plan/story-
e6freoof-1225973217568

105
Daily Mail. (2011, July 15). American Electric Power puts $668 million plan on hold.
Charleston Daily Mail. Available at
http://www.dailymail.com/Business/201107141497
DOE. (2010). Cost and Performance Baseline for Fossil Energy Plants – Volume 1:
Bituminous Coal and Natural Gas to Electricity. National Energy Technology
Laboratory. Available at http://www.netl.doe.gov/energy-
analyses/pubs/BitBase_FinRep_Rev2.pdf
DOE. (2012, May 1). Adding “Utilization” to Carbon Capture and Storage. Department
of Energy. Available at http://energy.gov/articles/adding-utilization-carbon-
capture-and-storage
E&E Publishing LLC (2010, March 1). Southern Co. pulls out of Ala. CCS Project.
E&E News. Available at www.eenews.net/public/eenewspm/2010/03/01/2
EIA. (2011). Wholesale Market Data. Sources & Uses – Electricity. Energy Information
Administration. Available at http://www.eia.gov/electricity/wholesale/index.cfm
EIA. (2011a). How much electricity does an American home use? Frequently Asked
Questions. Energy Information Administration. Available at
http://www.eia.gov/tools/faqs/faq.cfm?id=97&t=3
EIA. (2012, July 6). Monthly coal- and natural gas-fired generation equal for the first
time in April 2012. Today in Energy. Energy Information Administration.
Available at http://www.eia.gov/todayinenergy/detail.cfm?id=6990
EIA. (2012a). Receipts and Cost of Fossil Fuel. Electric Power Monthly, June 2012.
Energy Information Administration. Available at
http://www.eia.gov/electricity/monthly/pdf/chap4.pdf
EIA. (2012b). Annual Energy Review: September 2012. Total Energy. Energy
Information Administration. Available at
http://www.eia.gov/totalenergy/data/annual/showtext.cfm?t=ptb0802a
EIA. (2013). Table 5.6.A. Average Retail Price of Electricity to Ultimate Customers by
End-Use Sector. Electric Power Monthly, February 2013. Energy Information
Administration. Available at
http://www.eia.gov/electricity/monthly/epm_table_grapher.cfm?t=epmt_5_6_a

106
EPA. (2012). Inventory of U.S. Greenhouse Gas Emissions and Sinks: 1990 – 2010.
Environmental Protection Agency. Available at
http://www.epa.gov/climatechange/Downloads/ghgemissions/US-GHG-
Inventory-2012-Chapter-3-Energy.pdf
EPA. (2012a). Standards of Performance for Greenhouse Gas Emissions for New
Stationary Sources; Electric Utility Generating Units; Proposed Rule.
Environmental Protection Agency. Available at
http://www.regulations.gov/#!documentDetail;D=EPA-HQ-OAR-2011-0660-
0001
EPA. (2012b). Regulatory Impact Analysis for the Proposed Standards of Performance
for Greenhouse Gas Emissions for New Stationary Sources: Electric Utility
Generating Units. Environmental Protection Agency. Available at:
http://www.epa.gov/ttnecas1/regdata/RIAs/egughgnspsproposalria0326.pdf.
Ereira, E.C. (2010). Assessing Early Investments in Low Carbon Technologies under
Uncertainty: The Case of Carbon Capture and Storage. M.I.T. Masters Thesis.
Massachusetts Institute of Technology. Available at
http://sequestration.mit.edu/bibliography/economics.html
Esposito, Richard. (2012, December 14). Informational telephonic interview to discuss
Kemper County Project. Southern Company.
European Energy Exchange. (2013). EU Emission Allowances – Spot Prices. The
European Energy Exchange. Available at
http://www.eex.com/en/Market%20Data/Trading%20Data/Emission%20Rights/E
U%20Emission%20Allowances%20%7C%20Spot
Federal Register. (2012, September 26). South Mississippi Electric Cooperative: Plant
Radcliffe, Kemper County Integrated Gasification Combined Cycle (IGCC)
Project. A Notice by the Rural Utilities Service. Available at
https://www.federalregister.gov/articles/2012/09/26/2012-23603/south-
mississippi-electric-cooperative-plant-ratcliffe-kemper-county-integrated-
gasification
Fischedick, M., R. Schaeffer, A. Adedoyin, M. Akai, T. Bruckner, L. Clarke, V. Krey, I.
Savolainen, S. Teske, D. Ürge-Vorsatz, R. Wright. (2011). Mitigation Potential

107
and Costs. In IPCC Special Report on Renewable Energy Sources and Climate
Change Mitigation [O. Edenhofer, R. Pichs-Madruga, Y. Sokona, K. Seyboth, P.
Matschoss, S. Kadner, T. Zwickel, P. Eickemeier, G. Hansen, S. Schlömer, C. von
Stechow (eds)], Cambridge University Press, Cambridge, United Kingdom and
New York, NY, USA.
Folger, Peter. (2012, April 23). Carbon Capture and Sequestration: Research,
Development, and Demonstration at the U.S. Department of Energy.
Congressional Research Service. Available at
http://www.fas.org/sgp/crs/misc/R42496.pdf
GCCSI. (2011). Economic Assessment of Carbon Capture & Storage Projects; 2011
Update. The Global CCS Institute. Available at
http://cdn.globalccsinstitute.com/sites/default/files/publications/12786/economic-
assessment-carbon-capture-and-storage-technologies-2011-update.pdf
GCCSI. (2012). The Global Status of CCS – 2012. The Global CCS Institute. Available
at http://cdn.globalccsinstitute.com/sites/default/files/publications/47936/global-
status-ccs-2012.pdf
GHG News. (2012, June 29). At Kemper: PSC Denies Rate Increase to Cover Capital
Costs. Exchange Monitor Publications & Forums. Available at
http://ghgnews.com/index.cfm/at-the-major-ccs-projects-
kemper1/?mobileFormat=true
Garnett, A., Greig, C., & Oettinger, M. (2012). ZeroGen IGCC with CCS, A Case
History. The State of Queensland (Department of Employment, Economic
Development and Innovation).
Greig, C. (2012). Scoping & Estimation of Total Project Investment Cost Australian
Experience. EPRI CCS Cost Workshop (25 – 26 April, 2012).
Guardian. (2011, October 19). Longannet carbon capture project cancelled. The
Guardian. Available at
http://www.guardian.co.uk/environment/2011/oct/19/david-cameron-longannet-
carbon-capture
Hamilton, M. (2009). An Analytical Framework for Long Term Policy for Commercial
Deployment and Innovation in Carbon Capture and Sequestration Technology

108
in the United States. M.I.T Masters Thesis. Massachusetts Institute of
Technology. Available at http://sequestration.mit.edu/bibliography/policy.html
HighBeam Business. (2012, June 1). Kemper County: constructing the world’s first
IGCC with CCS. HighBeam Business. Available at
http://business.highbeam.com/4364/article-1G1-297718143/kemper-county-
constructing-world-first-igcc-ccs
IEA. (2011). Co-generation and Renewables – Solutions for a low-carbon energy
future. International Energy Agency. Available at
http://www.iea.org/publications/freepublications/publication/CoGeneration_Rene
wablesSolutionsforaLowCarbonEnergyFuture.pdf
IEA. (2011a). International Energy Outlook 2011. International Energy Agency.
Washington, DC. Available at
http://www.eia.gov/forecasts/ieo/pdf/0484(2011).pdf
IEA. (2012). Global carbon-dioxide emissions increase by 1.0 Gt in 2011 to record
high. Newsroom and Events. International Energy Agency. Available at
http://www.iea.org/newsroomandevents/news/2012/may/name,27216,en.html
iStockAnalyst. (2011, January 13). Tenaska Vows to Exit Taylorville IGCC Project
After Losing Illinois Senate Battle. Marketwire. Available at
http://www.istockanalyst.com/article/viewiStockNews/articleid/4807059
Kheshgi, Haroon S. Bhore, Nazeer A. Hirsch, Robert B. Parker, Michael E. Teletzke,
Gary F. Thomann, Hans. (2011). Perspectives of CCS Costs and Economics.
Exxon Mobil Corporation. Published for the SPE International Conference on
CO2 Capture, Storage, and Utilization held in New Orleans, Louisiana, USA, 10–
12 November 2010
Lupion, Monica and Herzog, Howard J. (2013). NER300: Still time to secure CCS
projects in Europe? Submitted to the International Journal of Greenhouse Gas
Control (forthcoming).
Merrow, E., Phillips, K., and Myers, C. (1981). Understanding cost growth and
performance shortfalls in pioneer process plants. RAND/R-2569-DOE, Rand
Corp., Santa Monica, CA.

109
Mississippi Business Journal. (2013, January 24). Rate case settlement lowers cost cap.
Available at http://msbusiness.com/magnoliamarketplace/2013/01/24/rate-case-
settlement-lowers-kemper-cap-institutes-clawbacks-for-cwip-funds/
MIT. (2013). CCS Project Database. The Carbon Capture and Sequestration
Technologies Program, MIT Energy Initiative. Massachusetts Institute of
Technology. Available at http://sequestration.mit.edu/
Mitchell Williams. (2012, January 25). Energy: National Environmental Policy Act
Challenge to Grant to Mississippi Power Project. Mitchell, Williams, Selig,
Gates & Woodyard, PLLC. Available at
http://www.mitchellwilliamslaw.com/energy-national-environmental-policy-act-
challenge-to-grant-to-mississippi-power-project
Morris, J., C. Marcantonini, J. Reilly, E.Ereira and S. Paltsev. (2010). Levelized Cost of
Electricity and the Emissions Prediction and Policy Analysis Model, MIT Joint
Program on the Science and Policy of Global Change, Report, Cambridge, MA
(forthcoming).
MPC. (2012). Protecting our Environment – Kemper County Energy Facility.
Mississippi Power Company. Available at
http://www.mississippipower.com/kemper/docs/KemperProtecEnviroFactSheet.p
df
MPC (2013). Quick Facts – Kemper County Energy Facility. Mississippi Power
Company. Available at
http://www.mississippipower.com/kemper/docs/KemperQuickInfoFactSheet.pdf
MPC (2013a). Overview – Kemper County Energy Facility. Mississippi Power
Company. Available at
http://www.mississippipower.com/kemper/docs/KemperGeneralFactSheets.pdf
MPC (2013b, January 25). Mississippi Power files for CWIP for Kemper facility. Recent
Updates. Mississippi Power Company. Available at
http://www.mississippipower.com/kemper/news_jan25-2013.asp
MSPSC. (2013, March 22). In Re: Notice of Intent of MPC for a change of rates to
establish a rate mitigation plan in connection with the Kemper County IGCC
Project. Mississippi Public Service Commission. Case Files – Case No. 39, 2013.

110
Available at
http://www.psc.state.ms.us/InsiteConnect/InSiteView.aspx?model=INSITE_CON
NECT&queue=CTS_ARCHIVEQ&docid=305122
NETL. (2011). 2011 NETL CO2 Capture Technology Meeting. National Energy
Technologies Laboratory. Department of Energy. Available at
http://www.netl.doe.gov/publications/proceedings/11/co2capture/presentations/4-
Thursday/25Aug11-%20Nelson-Kemper-
Capture%20at%20Kemper%20IGCC.pdf
NETL. (2013). Demonstration of a Coal-based Transport Gasifier. National Energy
Technologies Laboratory. Department of Energy. Available at
http://www.netl.doe.gov/publications/factsheets/project/NT42391.pdf
Olson, Mancur. (1984). The Rise and Decline of Nations: Economic Growth,
Stagflation, and Social Rigidities. Yale University.
Paltsev, Sergey. Reilly, John M. Jacoby, Henry D. Eckaus, Richard S. McFarland, James.
Sarofim, Marcus. Asadoorian, Malcolm. Babiker, Mustafa. (2005). The MIT
Emissions Prediction and Policy Analysis (EPPA) Model: Version 4. MIT Joint
Program on the Science and Policy of Global Change, Report 125, Cambridge,
MA August 2005.
Power. (2011, December 14). Vattenfall’s Jänschwalde Demo Is Latest in String of CCS
Projects Shelved. Official Publication of Electric Power Conference & Exhibition.
Available at http://www.powermag.com/POWERnews/4233.html
Power. (2011a, July 12). Illinois Senate Vote Jeopardizes Future of Taylorville IGCC
Carbon Capture Project. Official Publication of Electric Power Conference &
Exhibition. Available at http://www.powermag.com/POWERnews/Illinois-
Senate-Vote-Jeopardizes-Future-of-Taylorville-IGCC-Carbon-Capture-
Project_3342.html
Reuters (2012, August 1). Mississippi court denies Southern Co interim coal-unit rate
hike. Thomson Reuters. Available at
http://www.reuters.com/article/2012/08/01/utilities-southern-kemper-
idUSL2E8J19UZ20120801
Reuters. (2013, April 1). Southern Co drops federal loan request, pursues larger one.

111
Thomson Reuters. Available at
http://www.reuters.com/article/2013/04/01/utilities-southern-doe-
idUSL2N0CI1UP20130401
RWE. (2009). IGCC/CCS Power Plant. RWE Corporate Website. Available at
http://www.rwe.com/web/cms/en/2688/rwe/innovation/projects-
technologies/power-generation/fossil-fired-power-plants/igcc-ccs-power-plant/
SBC. (2012). Leading the Energy Transition: Bringing Carbon Capture & Storage to
Market. Schlumberger Business Consulting Energy Institute. Available at:
http://www.sbc.slb.com/SBCInstitute/Publications/~/media/Files/SBC%20Energy
%20Institute/SBC%20Energy%20Institute_Bringing%20CCS%20to%20Market1.
ashx
SCC. (2010, July 15). Application of Appalachian Power Company – Case No. PUE-
2009-00030. State Corporation Commission. Commonwealth of Virginia.
Available at http://www.scc.virginia.gov/newsrel/e_apcodown_10.pdf
R.E.H. Sims, R.N. Schock, A. Adegbululgbe, J. Fenhann, I. Konstantinaviciute, W.
Moomaw, H.B. Nimir, B. Schlamadinger, J. Torres-Martínez, C. Turner, Y.
Uchiyama, S.J.V. Vuori, N. Wamukonya, X. Zhang. (2007). Energy supply. In
Climate Change 2007: Mitigation. Contribution of Working Group III to the
Fourth Assessment Report of the Intergovernmental Panel on Climate
Change [B. Metz, O.R. Davidson, P.R. Bosch, R. Dave, L.A. Meyer (eds)],
Cambridge University Press, Cambridge, United Kingdom and New York, NY,
USA.
UK Government. (2013, March 20). Press release - Preferred bidders announced in
UK’s £1bn CCS Competition. Department of Energy & Climate Change.
Available at https://www.gov.uk/government/news/preferred-bidders-announced-
in-uk-s-1bn-ccs-competition
USA Today. (2013, March 10). A corporate tax cut would produce higher revenue for
Dems and lower rates for GOP. Corporate Laffer Curve: Column. Available at
http://www.usatoday.com/story/opinion/2013/03/10/arthur-laffer-john-martilla-
grant-watkinson-on-tax-compromise/1965543/
Van Voorhees, Bob. (2013, January 23). Building Out the Framework for CCS

112
Deployment – Practical Approaches for Implementing Early State CCS
Projects. 2013 Underground Injection Control Conference. Sarasota, FA.
Available at http://www.gwpc.org/sites/default/files/event-
sessions/VanVoorhees_Bob.pdf
Washington Examiner. (2012, August 7). Miss. Power fires contractors at Kemper site.
The Examiner. Available at http://washingtonexaminer.com/miss.-power-fires-
contractors-at-kemper-site/article/feed/2021441#.UH-MD2l26pQ
World Fuels. (2012, June 19). Lignite Mine for MPC’s IGCC Plant wins Environmental
Permit. Gasification News. Hart Energy. Available at
http://www.worldfuels.com/newsletters/Gasification-News/XV/13/

113
12. APPENDICES APPENDIX A: Evolution of fuel-mix in energy in various regions of the world
Figures below represent the evolving fuel-mix for electricity generation in major
regions of the world during the period 2008 – 2035 as depicted in the International
Energy Outlook (IEA, 2011a). As illustrated in Figure 32 to Figure 37 below, coal is
expected to play a diminishing role in most countries in the North & South American
continents and OECD Europe, and the Middle East. In non-OECD Asia and Africa,
however, coal-based capacity is expected to increase through 2035.
Figure 32: Electricity Generation (left, in trillion kWh) and fuel-mix (right, in %) in North
America (IEA, 2011a)
In North and South America, primarily natural gas based capacity is expected to
displace coal-based capacity, with hydro making contributions in regions with high
resource availability. Notwithstanding that natural gas has lower carbon intensity when
compared to that of coal, CCS may need to be added to gas-based systems as well to
achieve requisite emissions reduction targets.

114
Figure 33: Electricity generation (in trillion kWh) & fuel-mix in Brazil (left) and other Central
and South American countries (right) (IEA, 2011a)
Figure 34: Electricity generation (in trillion kWh) & fuel-mix in the Middle East (IEA, 2011a)
Petroleum fuel-based generation capacity is expected to supply a remainder of the
requirement not served by natural gas in the Middle East. In OECD Europe, which is the
only region that has surpassed its targets under the Kyoto Protocol, is expected to
continue relying on expanding its renewable capacity, which is expected to displace coal
in the region. Nuclear and gas-based capacity is expected to contribute nearly equally to
the region’s generation requirements.
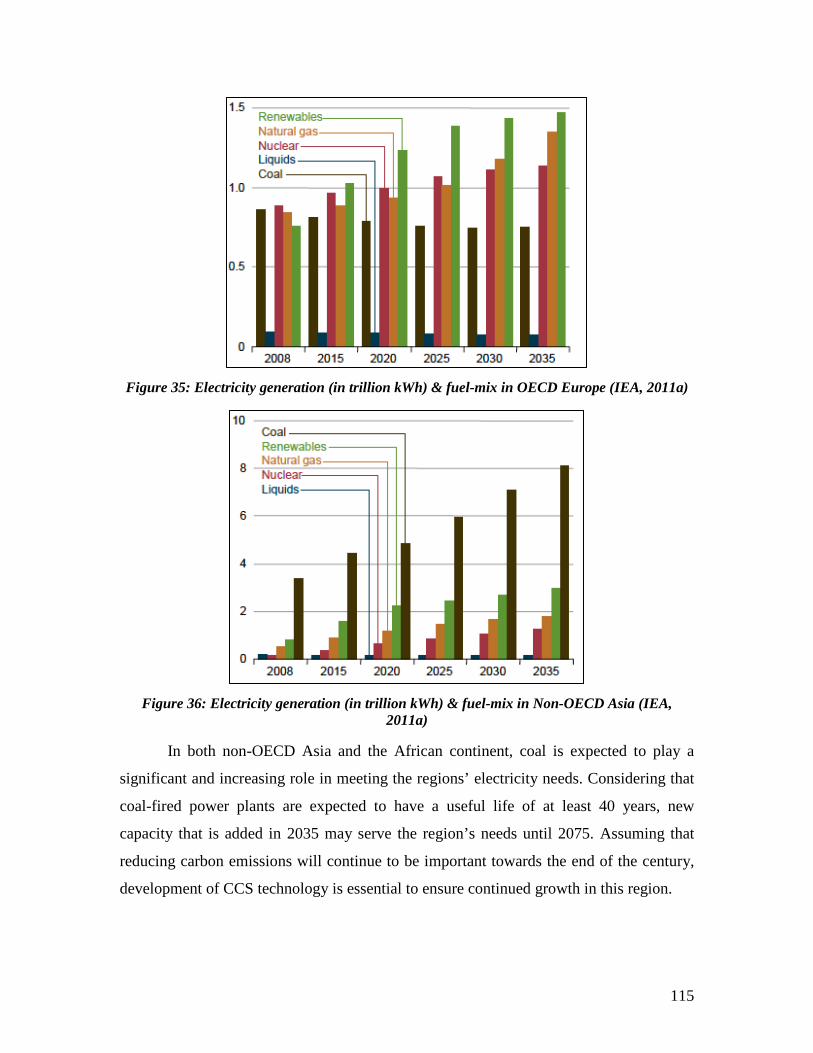
115
Figure 35: Electricity generation (in trillion kWh) & fuel-mix in OECD Europe (IEA, 2011a)
Figure 36: Electricity generation (in trillion kWh) & fuel-mix in Non-OECD Asia (IEA,
2011a)
In both non-OECD Asia and the African continent, coal is expected to play a
significant and increasing role in meeting the regions’ electricity needs. Considering that
coal-fired power plants are expected to have a useful life of at least 40 years, new
capacity that is added in 2035 may serve the region’s needs until 2075. Assuming that
reducing carbon emissions will continue to be important towards the end of the century,
development of CCS technology is essential to ensure continued growth in this region.

116
Figure 37: Electricity generation (in trillion kWh) & fuel-mix in Africa (IEA, 2011a)

117
APPENDIX B: EPPA Model – Details
Table 14: Structure of the EPPA Model (Paltsev et al., 2005)
Countries/Regions Sectors Technologies for Electric Power Sector
United States (USA) Agriculture (AGRI) Conventional Fossil European Union (EUR) Energy Intensive (EINT) Hydro Eastern Europe (EET) Transportation (TRANS) Conventional Nuclear Japan (JPN) Other Industry (OTHR) Advanced Nuclear Former Soviet Union (FSU) Services (SERV) Wind, Solar Australia & New Zealand (ANZ)
Electricity (ELEC) Biomass
Canada (CAN) Conventional Crude Oil (OIL)
NGCC
China (CHN) Oil from Shale (SOIL) NGCC with CCS (NGCap) India (IND) Liquid Fuel from Biomass
(BOIL) IGCC with CCS (IGCap)
Higher Income East Asia (ASI)
Refined Oil (ROIL)
Middle East (MES) Coal (COAL) Indonesia (IDZ) Natural Gas (GAS) Mexico (MEX) Gas from Coal (CGAS) Central & South America (LAM)
Africa (AFR) Rest of World (ROW)

118
APPENDIX C: Global Electricity Mix
Figure 38: Global Electricity Mix - No Delay - Case 2a & 2b
Figure 39: Global Electricity Mix - 10-year Delay - Case 2a
0
5
10
15
20
25
30
35
40
45
1997
2000
2005
2010
2015
2020
2025
2030
2035
2040
2045
2050
2055
2060
2065
2070
2075
2080
2085
2090
2095
2100
Gene
rati
on (i
n tr
illio
n kW
h)
Fossil
Nuclear
Hydro
Wind
NGCC
IGCap
NGCap
Bio
0
5
10
15
20
25
30
35
40
45
1997
2000
2005
2010
2015
2020
2025
2030
2035
2040
2045
2050
2055
2060
2065
2070
2075
2080
2085
2090
2095
2100
Gene
rati
on (i
n tr
illio
n kW
h)
Fossil
Nuclear
Hydro
Wind
NGCC
IGCap
NGCap
Bio

119
Figure 40: Global Electricity Mix - 10-year delay - Case 2b
Changing the markup factors Table 15: Changing markup factors Pulveri
zed Coal
NGCC NGCC with CCS
NGCC
NGCC with CCS
IGCC with CCS
Advanced
Nuclear
Wind Biomass
For case 3a
& 3b
For case 3a
& 3b
Markup Over Coal
1.00 0.84 1.33 0.71 1.18 1.42 1.78 1.28 1.47
Markup Over Coal (New)
1.00 1.01 1.42 0.91 1.28 1.52 1.77 1.10 1.50
New markup factors are similar to that in Ereira (2010), and data was sourced from AEO,
2009 to estimate these factors.
0
5
10
15
20
25
30
35
40
45
1997
2000
2005
2010
2015
2020
2025
2030
2035
2040
2045
2050
2055
2060
2065
2070
2075
2080
2085
2090
2095
2100
Gene
rati
on (i
n tr
illio
n kW
h)
Fossil
Nuclear
Hydro
Wind
NGCC
IGCap
NGCap
Bio
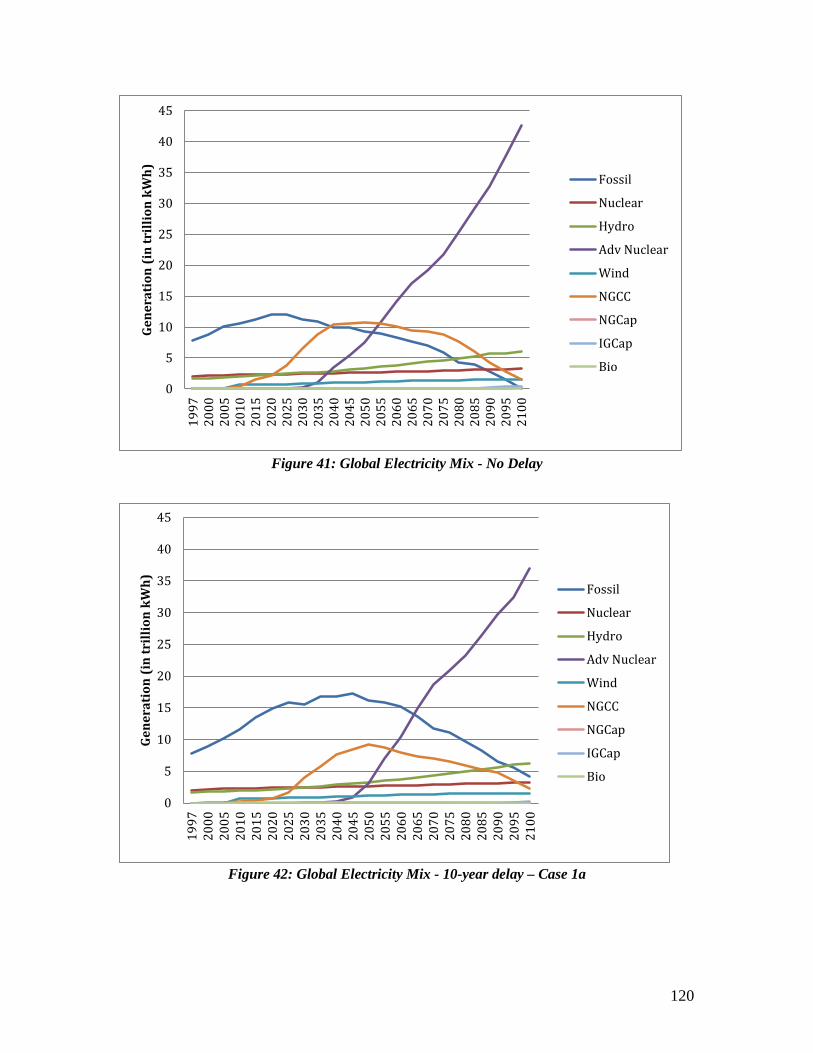
120
Figure 41: Global Electricity Mix - No Delay
Figure 42: Global Electricity Mix - 10-year delay – Case 1a
0
5
10
15
20
25
30
35
40
45
1997
2000
2005
2010
2015
2020
2025
2030
2035
2040
2045
2050
2055
2060
2065
2070
2075
2080
2085
2090
2095
2100
Gene
rati
on (i
n tr
illio
n kW
h)
Fossil
Nuclear
Hydro
Adv Nuclear
Wind
NGCC
NGCap
IGCap
Bio
0
5
10
15
20
25
30
35
40
45
1997
2000
2005
2010
2015
2020
2025
2030
2035
2040
2045
2050
2055
2060
2065
2070
2075
2080
2085
2090
2095
2100
Gene
rati
on (i
n tr
illio
n kW
h)
Fossil
Nuclear
Hydro
Adv Nuclear
Wind
NGCC
NGCap
IGCap
Bio

121
Figure 43: Global Electricity Mix - 10-year delay – Case 1b
Figure 44: Global Electricity Mix - No Delay – Case 3a & 3b
0
5
10
15
20
25
30
35
40
45
1997
2000
2005
2010
2015
2020
2025
2030
2035
2040
2045
2050
2055
2060
2065
2070
2075
2080
2085
2090
2095
2100
Gene
rati
on (i
n tr
illio
n kW
h)
Fossil
Nuclear
Hydro
Adv Nuclear
Wind
NGCC
NGCap
IGCap
Bio
0
5
10
15
20
25
30
35
40
45
1997
2000
2005
2010
2015
2020
2025
2030
2035
2040
2045
2050
2055
2060
2065
2070
2075
2080
2085
2090
2095
2100
Gene
rati
on (i
n tr
illio
n kW
h)
Fossil
Nuclear
Hydro
Wind
NGCC
NGCap
IGCap
Bio

122
Figure 45: Global Electricity Mix - 10-year delay – Case 3a
Figure 46: Global Electricity Mix - 10-year delay – Case 3b
0
5
10
15
20
25
30
35
40
45
1997
2000
2005
2010
2015
2020
2025
2030
2035
2040
2045
2050
2055
2060
2065
2070
2075
2080
2085
2090
2095
2100
Gene
rati
on (i
n tr
illio
n kW
h)
Fossil
Nuclear
Hydro
Wind
NGCC
NGCap
IGCap
Bio
0
5
10
15
20
25
30
35
40
45
1997
2000
2005
2010
2015
2020
2025
2030
2035
2040
2045
2050
2055
2060
2065
2070
2075
2080
2085
2090
2095
2100
Gene
rati
on (i
n tr
illio
n kW
h)
Fossil
Nuclear
Hydro
Wind
NGCC
NGCap
IGCap
Bio

123
APPENDIX D: Monetary & non-monetary reasons for cancellation/uncertainty
The reasons for cancellation or uncertainty associated with a sample of
demonstration projects are outlined below in the table below. Information is gathered
from news sources, databases, company websites, and similar sources.
Table 16: Reasons for cancellation/uncertainty of Demonstration Projects
Project Location Factors Details Remarks Peterhead (Power)
Scotland Lack of govt. support – funds Monetary
May 2007: BP scraps project as the UK government delays announcement of £1 billion prize. BP spends $25 million on project before scrapping it. (Carbon Capture Journal, 2007)
November 2011: Shell and Scottish & Southern Energy agree to work together to develop the project contingent on funding (BBC, 2011) Recent development: In the second round of the UK £1 billion CCS competition, this project has been named as the “Preferred Bidder” (UK Government, 2013)
Antelope Valley (Power)
USA High costs Monetary
December 2010: FEED Study coupled with assessment of necessary additions, financing, and storage costs led to an estimate of $500 million (Basin Electric, 2011)
Other factors included nascent market for EOR, uncertainty in environmental regulation, and lack of long-term energy strategy in the US.
Janschwalde (Power)
Germany Lack of govt. support – political will Non-monetary
December 2011: Vattenfall scrapped €1.5 billion project due to political opposition based on environmental concerns (Power, 2011)
Local citizens protested against the project citing that leaks could impair quality of water. The Carbon Storage Law passed by the German Federal Cabinet in April 2011 shifts decision on storage from federal to state govt.

124
Goldenbergwerk (Power)
Germany Lack of govt. support – political will Non-monetary
November 2009: Inadequate legal basis and lack of political will were cited as reasons. (RWE, 2009)
Taylorville USA Lack of govt. support – funds Monetary
January 2011: Project was cancelled after Senate 33-18 to deny authorization to build the plant. (iStockAnalyst, 2011)
Bill to procure $3.5 billion from ratepayers was rejected by the Senate. (Power, 2011a)
AEP Mountaineer
USA Lack of govt. support – funds Monetary
July 2011: Request to Virginia PUC to recover some costs through $74 million increase for ratepayers rejected (Bloomberg, 2011)
Uncertain climate policy also cited as a reason. (Daily Mail, 2011)
Sweeny Gasification
USA High costs Monetary
August 2011: Large financial commitment to be made before federal climate change regulation became certain.
In 2009, the project was selected by DOE to be awarded $3 million Cooperative Agreement to share development of cost. ConocoPhillips did not apply for Phase 2 of DOE funding. (MIT, 2013)
ZeroGen Australia Lack of govt. support – funds Monetary
December 2010: Queensland state govt scrapped project after study found it unviable.
State writes off AU$96.3 million as a loss while the remaining AU$6.3 million was received as a grant. Federal govt contribution of AU$47.5 million for feasibility study. (Courier Mail, 2010)
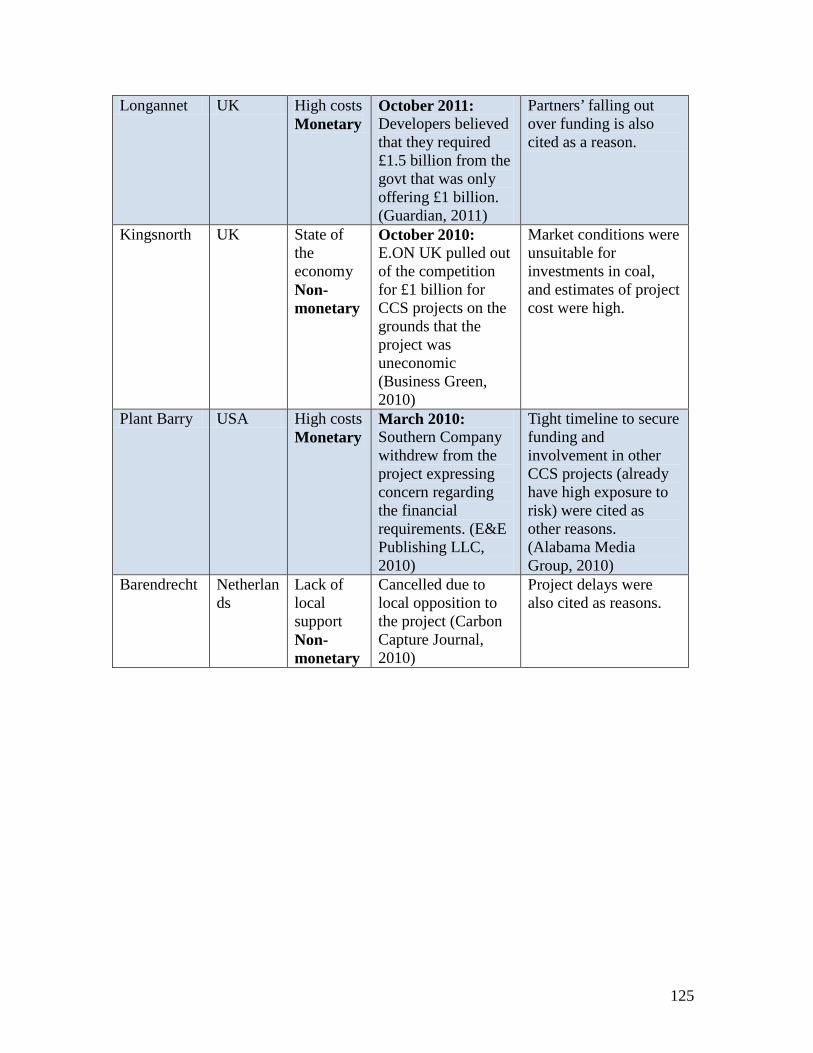
125
Longannet UK High costs Monetary
October 2011: Developers believed that they required £1.5 billion from the govt that was only offering £1 billion. (Guardian, 2011)
Partners’ falling out over funding is also cited as a reason.
Kingsnorth UK State of the economy Non-monetary
October 2010: E.ON UK pulled out of the competition for £1 billion for CCS projects on the grounds that the project was uneconomic (Business Green, 2010)
Market conditions were unsuitable for investments in coal, and estimates of project cost were high.
Plant Barry USA High costs Monetary
March 2010: Southern Company withdrew from the project expressing concern regarding the financial requirements. (E&E Publishing LLC, 2010)
Tight timeline to secure funding and involvement in other CCS projects (already have high exposure to risk) were cited as other reasons. (Alabama Media Group, 2010)
Barendrecht Netherlands
Lack of local support Non-monetary
Cancelled due to local opposition to the project (Carbon Capture Journal, 2010)
Project delays were also cited as reasons.

126
APPENDIX E: Studies on generic FOAK estimates GCCSI estimates that the capital cost of a demonstration project will fall in the
range of $5000 - $6000/kW based on their analysis of data in the Longannet FEED study.
For this analysis, it is assumed that a generic FOAK plant will cost $5500/kW.
Figure 47: Estimates of FOAK costs
COE in year 1 is calculated using the GCCSI estimates for FOAK Costs. Here, it
is important to note that the GCCSI estimates are only applicable to SCPC and IGCC
technologies. Further, an IGCC plant without CCS is considered to be an FOAK plant.
Table 17: Analysis on FOAK Costs using GCCSI Estimates
Parameter Case 11 SCPC
w/o
Case 12 SCPC
Case 5 IGCC w/o
Case 6 IGCC
FOAK – GCCSI FOAK – GCCSI NOAK Costs TOC ($/kW) 2024 3570 2716 3904 O&M (f) - $/kW pa 59 97 85 117 O&M (v) mills/kWh 5.0 8.7 7.8 9.9 CO2 TS&M mills/kWh 0 5.6 0 5.6 COE - (Model – Updated Economic Parameters)
70 123 92 134

127
Updated FOAK Costs TOC ($/kW) 2024 5500 3631 5500 O&M (f) - $/kW pa 59 149 114 165 O&M (v) mills/kWh 5.0 13.5 10.4 14.0 CO2 TS&M mills/kWh 0 8.6 0 7.9 COE (Model - FOAK added to above)
70 170 114 176
Results from the Belfer Center study: The impact of the addition of CCS is estimated at
7 – 10 c/kWh, as indicated in the table below. For the analysis in Chapter 8, an average
value or 8.5 c/kWh is used, and the capital cost that will yield an 8.5 c/kWh difference
between a system with and without CCS is estimated.
Table 18: Estimated impact of the addition of CCS on COE
Year FOAK cost premium c/kWh
FOAK $/ton
NOAK cost premium c/kWh
NOAK $/ton
2008 * End of period of sustained escalation is costs of large capital intensive projects
8 – 12 120 – 180 2 – 5 35 – 70
2005/06 **Lower than 2008 levels, but significant cost escalation from levels prior to that
6 – 9 90 – 135 1.5 – 4 25 – 50
Estimates of likely representative range ***Data chosen for financial analysis
7 – 10 100 – 150 2 – 4 30 – 50

128
APPENDIX F: Estimated Costs of Demonstration Projects Table 19: Estimated Costs for a Sample of Demonstration Projects (MIT, 2013)
PROJECT EOR MW gross
MW net
Cost $/kW
$/kW Capture
$/kW Storage
CO2 Pipeline Length (km)
Pipeline Length km/MW
Peterhead (R)
Y 350 2840 240 0.51
Antelope Valley (R)
Y 120 2392 330 2.75
Janschwalde N 250 8065 6452 1613 150 0.50
Goldenbergwerk
N 450 360 9091 7273 1818 530 1.18
Taylorville N 716 602 5814 50 0.07
AEP Mountaineer (R)
N 235 2843 20 0.08
Sweeny Gasification
N 680 6003 50 0.07
ZeroGen N 530 400 10616 220 0.42
Longannet (R)
N 363 5835 3344 2491 260 0.79
Kingsnorth N 300 8330 4165 3832 270 0.90
Plant Barry (R)
N 160 4375 16 0.10
* Pipeline lengths in italics are existing pipelines