the role of actuaries in the healthcare system november 2014 emile stipp
TRANSCRIPT

The role of actuaries in the healthcare system
November 2014Emile Stipp

Providing understanding: The drivers of healthcare inflation
The role of actuaries in different healthcare systems around the world
Developing solutions: Wellness programmes
Agenda

The role of actuaries
Our skills Who we advise
The questions we ask The IAA
Actuaries

Defi ne actuary
ac · tu ·ar ·y, nounA person who compiles and analyzes statistics and uses them to calculate insurance risks and premiums
• Pragmatic
• Numerate, including good understanding of statistics
• But we are data skeptical, and often accept that we work with imperfect data
• We have a very good understanding of how healthcare systems, or administration of healthcare arrangements, impact on costs and risks, and we incorporate this in our analysis and projections
• We have a deep understanding of demographic trends and how they impact on costs and risks
• Strong emphasis on professional standards and ethics• Avoid conflicts of interests• Balanced, objective advice • With full disclosure• Doing our work for the benefit of Society
Defining characteristics

The actuarial toolkit
Projecting mortality & morbidity & financial outcomes
Exposure
Frequency / severity analyses
Good statistical understanding
Reserving for liabilities incurred
Matching of assets and liabilities
Risk immunisation & mitigation
Optimisation
Anti-selection and its antidotes

Managed care organisations
Third party administrators
Advisory services
Public healthcare Private healthcare
Supply side organisations
InsurersHealth
indemnityCritical illness
Long term care
Disability
Policy makers
Governments
Government bodies NGOs

The role of health actuaries
Public healthcare Private healthcare
• Analysis• Capital• Disclosure• Valuation• Product design• Pricing• Risk management & managed
care• Optimisation• Projections
• Budgeting and risk adjustment• Risk equalisation• Demographic and financial
projections• Funding sustainability• Public Private Partnerships• Analysis of cost drivers

The questi ons actuaries ask• What is the current and prospective burden of healthcare in the context of GDP, household income, and other economic
indicators• What drives disability claims experience?• What drives healthcare inflation?• What is the impact of anti-selection on health insurance risks?• How can costs be managed?• Can wellness programmes make a real difference to medical inflation?
• How should products be designed to introduce the right incentives?• What premium should be charged? How to optimise it?• How do we design and select networks of providers to improve efficiencies and quality?• Can alternative reimbursement models be designed to control costs without compromising on quality?• What is the best way to detect and prevent health fraud and abuses in healthcare?• What are risk-adjusted cost differentials between different service providers?
• How can private / public partnerships be structured?• How do we insure low income individuals?• Are out-of-pocket expenses equitably distributed between different levels of income?
• What are the risk consequences of catastrophic events, such as a pandemic?• What capital is required to protect against adverse events?• How will the HIV epidemic affect insurance costs?
• How do we ensure that more people have access to health services and do not suffer financial hardship paying for them?

The 3 dimensions of Universal Coverage
Source: WHO WHR 2010.

Our contribution
– Applying the Mathematical / statistical skills of actuaries to the quantification of cashflow and capital and their associated risks
– Our role is to support policy makers and managers by quantifying expected outcomes and the risks of deviations both in terms of costs and demand on resources
– Expected outcomes are estimated by applying actuarial methodology to factual data and assumptions including the presumed impact of policy decisions
– Enabling decision makers and managers to compare ex-ante the expected impact of policy decisions or strategic interventions facilitate optimisation
– As outcomes are explicitly linked to the various drivers there is value added in the possibility of monitoring the actual outcomes against the expected to identify the causes of the deviations and apply the feed back to improve the decision making
– Our methodology helps understand how incentives of role players affect risks and outcomes
– Our modelling approach tends to be bottom-up & stochastic, rather than top-down & deterministic. We typically don’t assume equilibrium ..

The role of the IAA
Mission: To promote the profession
to the benefit of Society Promote professionalism,
develop education, encourage research
Association of worldwide actuarial professional associations, with special interest sections for individual members
Six strategic objectives: Build relationships with key
supranational organisations Expand scientific knowledge and skills
of actuaries Promote common standards of
actuarial education and professional conduct
Develop actuarial profession worldwide
Provide a forum for discussion for actuaries
Improve recognition of actuarial profession

The role of the IAA
IAA Health Section:• Individual membership• Main objectives: library of actuarial papers, research presented at conferences and
webcasts• See example papers on risk equalisation (
http://www.actuaries.org/IAAHS/Webcast/RiskAdjustment/RiskAdjustment_Slides.pdf)• And on stochastic modelling (
http://www.actuaries.org/IAAHS/Webcast/Stochastic/IAAHS_11-15-2010-wocartoons.pdf)
IAA Health Committee:• Representatives of member associations• Purpose to :
o Represent the IAA in international debates on health actuarial matterso Raise profile of health actuarieso Support actuaries working in private and public health systems

Providing understanding: The drivers of healthcare inflation
The role of actuaries in different healthcare systems around the world
Developing solutions: Wellness programmes
Agenda

Using inflation as an example....• Of how actuaries analyse problems• Insights to be gained from actuarial analysis,
and techniques used• Using South African private health for illustration,
with some references to international experience• And also offering a solution with roots in South Africa, but which has
spread across the world in different forms
14

Some preliminaries• Adjusting for exposure is crucial• Consider Simpson’s Paradox:
– In the context of a health insurer with two benefit plans / levels– Average inflation is 0%, and yet each plan’s inflation rate is 10%!
Number of members in
Year 1
Premium per member in
Year 1
Number of members in
Year 2
Premium per member in
Year 2
Increase in per member
contribution from
Year 1 to Year 2
Plan 1 100 1000 200 1100 10%
Plan 2 50 2000 54 2200 10%
Insurer 150 1333.33 254 1333.86 0%
15

Some preliminaries
• Simpson’s paradox is relevant to:– health insurers with more than one plan, – policymakers, considering health inflation across a health
insurance markets– Governments, considering health inflation in a country (e.g. public
and private spending)• It implies:
– All inflation studies should adjust for demographic movements between insurance markets / insurers / benefit packages
– And not look only at overall average– Otherwise it will understate inflation where there are downgrades
and overstate where there are upgrades

Some preliminaries• Consider frequency and severity separately
– As this could provide insight into the reasons for cost increases• Consider price and utilisation separately
– Price measures tariff increases• And how that is set by legislation / competition
– And utilisation should be broken down into• demand side factors and • supply side factors
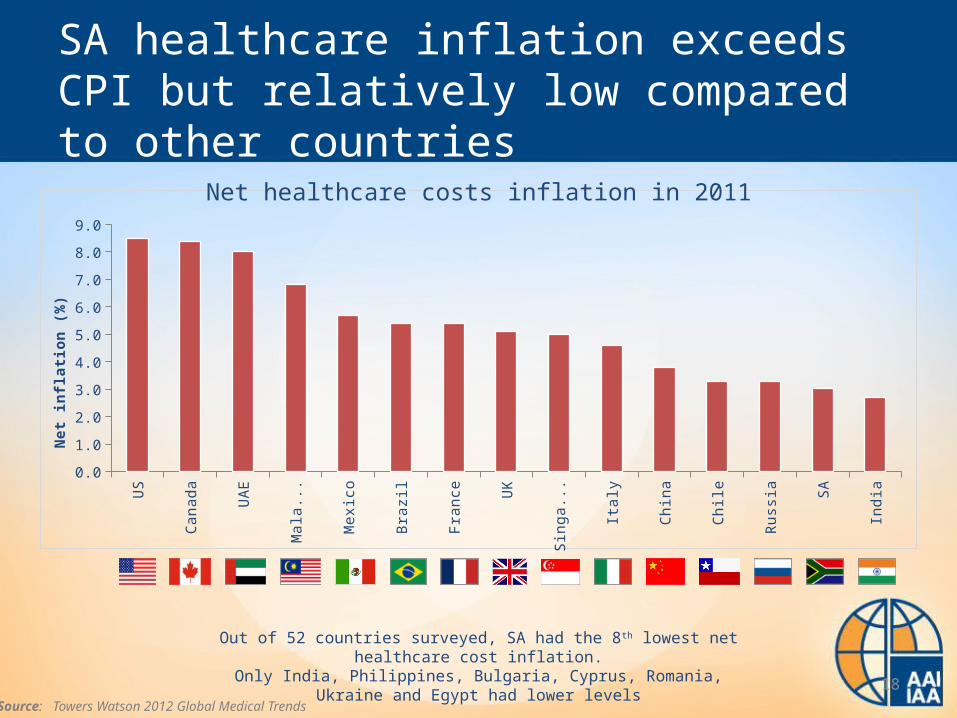
SA healthcare inflation exceeds CPI but relatively low compared to other countries
US
Cana
da
UA
E
Mal
aysi
a
Mex
ico
Braz
il
Fran
ce UK
Sing
apor
e
Ital
y
Chin
a
Chile
Russ
ia SA
Indi
a
0.0
1.0
2.0
3.0
4.0
5.0
6.0
7.0
8.0
9.0
Net
infla
tion
(%)
Out of 52 countries surveyed, SA had the 8th lowest net healthcare cost inflation.Only India, Philippines, Bulgaria, Cyprus, Romania, Ukraine and Egypt had lower levels
Source: Towers Watson 2012 Global Medical Trends
Net healthcare costs inflation in 2011
18

S o u t h A f r i c a : u ti l i s a ti o n i s ke y d r i ve r o f h e a l t h c a re i n fl a ti o n ( a ft e r p l a n m i x a d j u s t m e n t )
Inflation in South Africa: 2008 to 2013 – in Rand amounts
NHE = non-health expenses (cost of administration and managed care
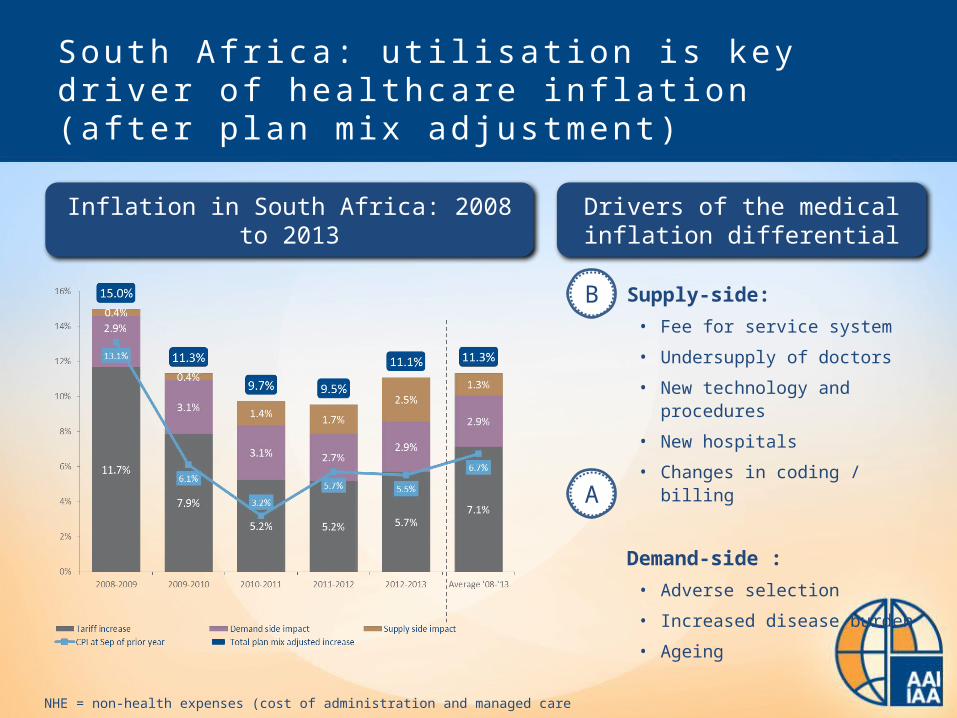
S o u t h A f r i c a : u ti l i s a ti o n i s ke y d r i ve r o f h e a l t h c a re i n fl a ti o n ( a ft e r p l a n m i x a d j u s t m e n t )
Supply-side:• Fee for service system
• Undersupply of doctors
• New technology and procedures
• New hospitals
• Changes in coding / billing
Demand-side :• Adverse selection
• Increased disease burden
• Ageing
Inflation in South Africa: 2008 to 2013 Drivers of the medical inflation differential
B
A
NHE = non-health expenses (cost of administration and managed care

Demand side: 2002 to 2012A

Demand-side: Adverse selecti on conundrum
• Young people opt out of medical schemes
• Medical schemes have higher proportions of older people
“Impact of adverse selection estimated at R13.5bn – 23% of total contributions for open medical schemes”Barry Childs, Lighthouse Actuarial Consulting
1
Adverse selection in open medical schemes
A
2
1
2

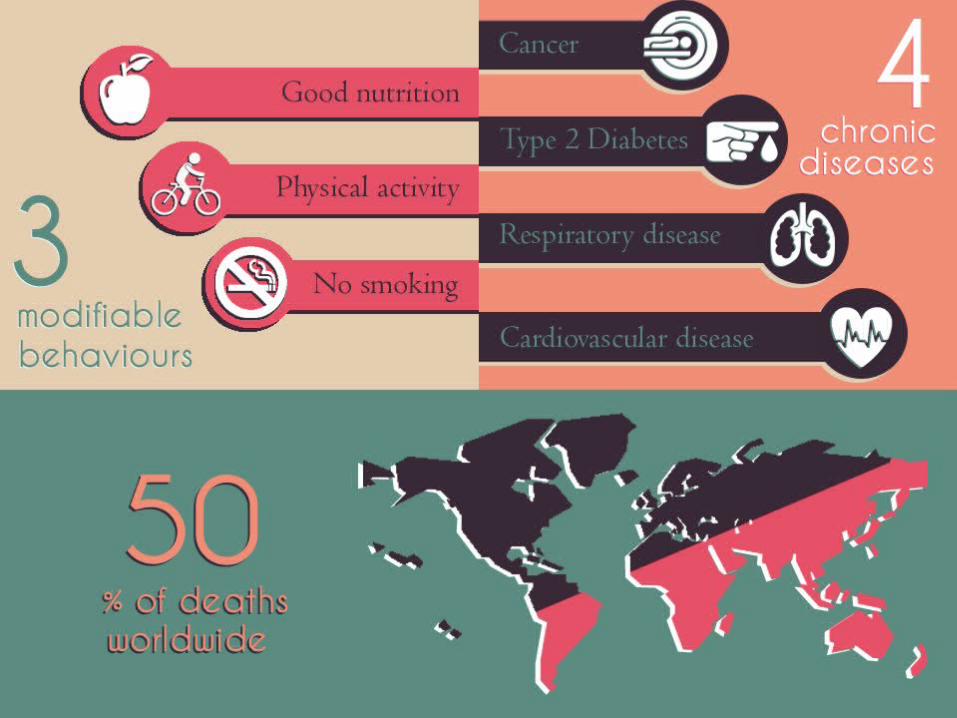
Demand side: Increasing burden of disease
3
4
50
Three controllable behaviours
Four chronic diseases of lifestyle
Fifty percent of deaths worldwide
Source: DHMS data, indexed to 2008
Epidemic of lifestyle diseases Increasing disease burden in medical schemes
A

Demand side infl ati on in South Afr ica
• Mostly attributable to:– Lack of a mandate– Open enrolment, guaranteed acceptance and
community rating– Very limited underwriting allowed– Resulting adverse selection – age and chronic
• Roughly 3% to 4% per year attributable to demand side inflation
A

Supply s ide: Shortage of doctors
25
SA Russia Brazil China India France Germany US UK AustraliaBRIC Developed economies
5.5
43
17
14
6
3735
27
21
10
• SA needs to train 2,400 doctors p.a. just to remain on par with current low figures
• Average age of specialists in SA = 55 years
• SA’s graduates have remained at 1,200 p.a. for the last 2 decades
Source: World Health Stats 2012
BRICS Developed
B
Doctors per 10,000 lives

Supply side: High cost of new medicines
26
Growth in claimants for high-cost drugs
B

Supply side: relationship between market concentration and bed supply per 1000 lives
27
In some regions: high bed supply even where low concentration
B
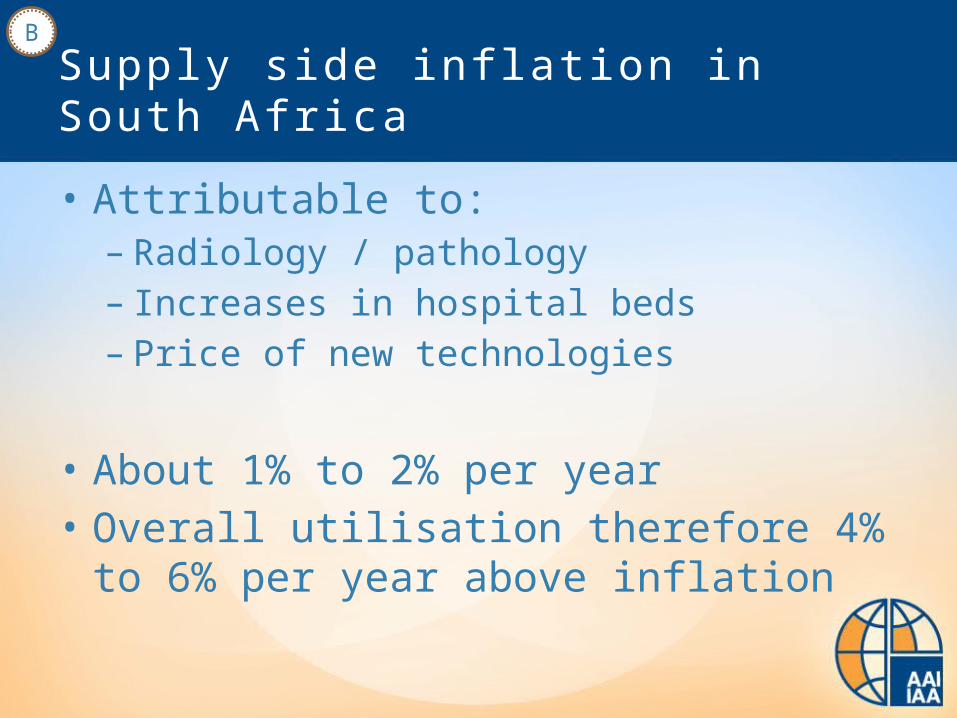
Supply s ide infl ati on in South Afr ica
• Attributable to:– Radiology / pathology– Increases in hospital beds– Price of new technologies
• About 1% to 2% per year• Overall utilisation therefore 4% to 6% per year
above inflation
B

Another v iew of healthcare infl ati on
• CPI is an average of different inflation indices• Some components of inflation are always higher
than others, e.g. healthcare vs electronic consumer goods– Especially those aspects linked to skilled services
• Wages generally keep up with inflation• Hence all that happens is that people devote a larger
proportion of their salaries to healthcare over time• “The Baumol Effect”, after William Baumol’s “The
cost disease”, 2011

But. . . .
• It may be true that healthcare inflation is and always will be higher than average inflation
• But it is not true that people will continue to spend a larger proportion of their salaries on healthcare
• In South Africa, we see that people effectively buy down their cover to maintain a roughly similar percentage of their salaries devoted to healthcare
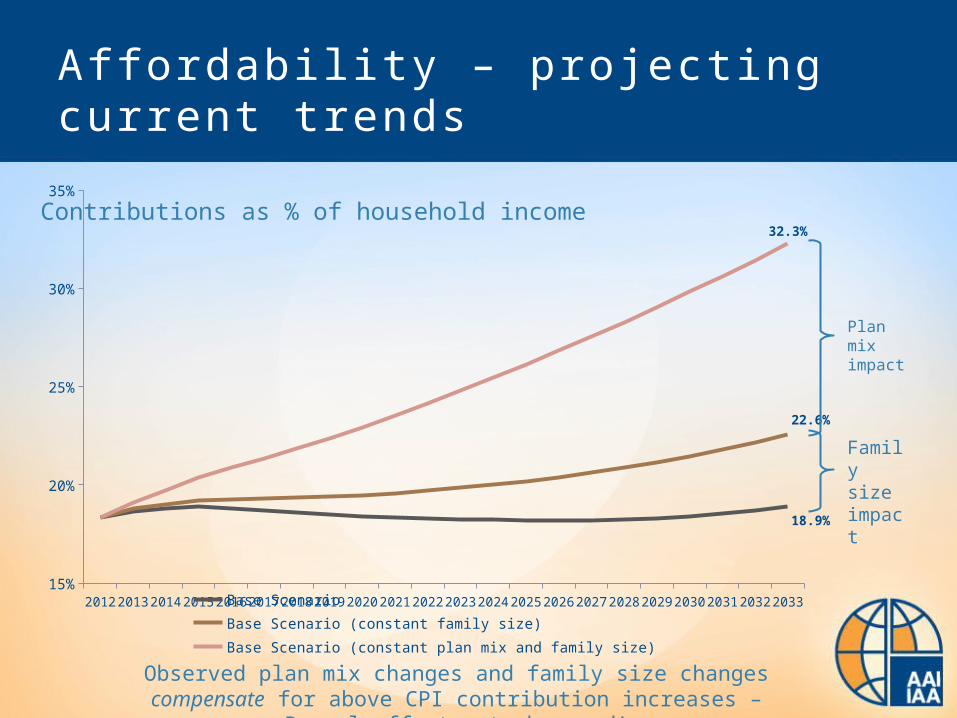
Aff ordabi l i ty – projecti ng current trends
2012 2013 2014 2015 2016 2017 2018 2019 2020 2021 2022 2023 2024 2025 2026 2027 2028 2029 2030 2031 2032 203315%
20%
25%
30%
35%
18.9%
22.6%
32.3%
Base Scenario Base Scenario (constant family size)Base Scenario (constant plan mix and family size)
Plan mix impact
Family size impact
Observed plan mix changes and family size changes compensate for above CPI contribution increases – Baumol effect not observed!
Contributions as % of household income
Providing understanding: The drivers of healthcare inflation
The role of actuaries in different healthcare systems around the world
Developing solutions: Wellness programmes
Agenda

Soluti ons?
One solution to mitigate all of these effects:
Keep people healthy!
Do we have evidence that incentive based wellness programmes work?

A case for wellness:Low-levels of wellness engagement; impact of behavioural factors
Und
er c
onsu
mpt
ion
of p
reve
ntiv
e ca
re Lack of information
Over-optimism
Hyperbolic discounting
True efficacy of different health and wellness approaches is not well understood
People tend to overestimate their abilities and health status
Future rewards of a healthy lifestyle are significantly undervalued relative to cost today
Sickness Wellness
Benefits are immediate, price is hidden
Benefits are hidden, price is immediate

A behavioural solution to the under-consumption of wellness:Member experience
Complete an HRA
Determine Vitality Age and set health goals
Earn points and achieve a Vitality status
Earn Vitality rewards
Obtain a Personal Pathway
Know your health Improve your health Enjoy the rewards1 2 3
Age

Results of the model:Vitality benefit utilisation
2006 2007 2008 2009 2010 20110
100,000
200,000
300,000
400,000
500,000
600,000
700,000
800,000
2006 2007 2008 2009 2010 2011 -
5
10
15
20
25
Gym visits (million, calendar year)
kulula.com flights (calendar year)
Feb-09
Jun-09
Oct-09
Feb-10
Jun-10
Oct-10
Feb-11
Jun-11
Oct-11
Feb-12
Jun-12 -
40
80
120
160
200
240
280
320
360
Cumulative HealthyFood cashback(R Million since inception)

Vitality clinical foundation: Published research
Name of study Journal Date published
Hypotheses/ research objective
Fitness-Related Activities and Medical Claims Related to Hospital Admissions — South Africa, 2006
Preventing Chronic Disease
October 2009 Fitness engagement and health and cost outcomes
The Association Between Medical Costs and Participation in the Vitality Health Promotion Program Among 948,974 Members of a South African Health Insurance Company
American Journal of
Health Promotion
January/ February 2010
Vitality engagement and cost outcomes
Participation in Fitness-Related Activities of an Incentive-Based Health Promotion Program and Hospital Costs: A Retrospective Longitudinal Study
American Journal of
Health Promotion
May/June 2011 Longitudinal assessment of fitness engagement and health and cost outcomes
Eating Better for Less: A National Discount Program for Healthy Food Purchases in South Africa
American Journal of
Health Behaviour
In Press To assess impact of the discount on healthy food on fruit and vegetable intake
Name of study Journal Date published
Hypotheses/ research objective

Engaged members experienced lower costs per patient compared to other groups
Note: Categorisation based on diagnosis-related groupers using ICD-10, CPT-4 and local procedural codesSource: “Participation in an Incentive-based Wellness Program and health care costs: Results of the Discovery Vitality Insured Persons Study”. Please do not quote without written permission from Discovery or PruHealth.
Canc
er
Men
tal
Kidn
ey a
nd U
TI
Endo
crin
e, n
utriti
onal
...
Resp
irato
ry
Ner
vous
and
mus
culo
s...
Dig
estiv
e
Card
iova
scul
ar
Ove
rall
0%
10%
20%
30%
40%
50%
60%
70%
80%
90%
100%
P < 0.001 for all categories (including overall result) except cancer where P < 0.01
Not engaged benchmark
30-40% 15-20% 10-15%
Risk-adjusted hospital admission costs: engaged vs. not engaged Vitality members
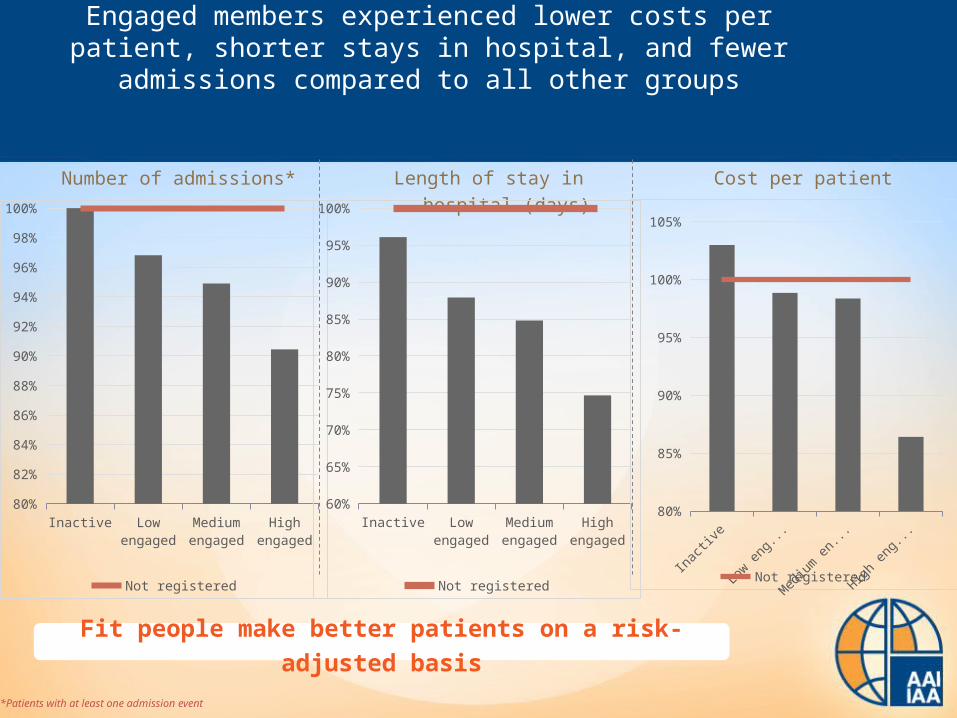
Engaged members experienced lower costs per patient, shorter stays in hospital, and fewer admissions compared to all other groups
*Patients with at least one admission event
Inac
tive
Low e
ngag
ed
Med
ium e
ngag
ed
High e
ngag
ed80%
82%
84%
86%
88%
90%
92%
94%
96%
98%
100%
Not registered
Number of admissions* Length of stay in hospital (days) Cost per patient
Inac
tive
Low e
ngag
ed
Med
ium e
ngag
ed
High e
ngag
ed60%
65%
70%
75%
80%
85%
90%
95%
100%
Not registered
Inac
tive
Low e
ngag
ed
Med
ium e
ng...
High e
ngag
ed80%
85%
90%
95%
100%
105%
Not registered
Fit people make better patients on a risk-adjusted basis

P = 0.001 for multiple metabolic conditions, all single conditions are not statistically significant
Multiple metabolic conditions
Mental illness Cancer Hypertension Dyslipidaemia0%
10%
20%
30%
40%
50%
60%
70%
80%
90%
100%
Beneficiaries with single conditions
Not engaged benchmark
20-30% 8-10%
Engaged chronic members experienced lower costs per patient compared to other groups

First model to test impact of increasing engagement
This analysis looks at all Health & Vitality members who subscribed uninterruptedly for a full three year period to both products. The VEM1 is tracked over this period and the life is categorised into a longitudinal engagement category. An outcome or target is then explored during the course of the fourth year.
The analysis explores the association between changes in engagement and morbidity measures
1 Vitality engagement metric is the before limit point summation tracking true engagement in the form of activity related events excluding carry over points, bonus points and outcome points

A longitudinal view of engagement
• Compile a three year monthly VEM per beneficiary• Regress a straight line through the data points• Use the results parameters – i.e. the intercept parameter β0 and the slope parameter β1 • The parameters are then grouped to create a progression matrix of engagement where the top right hand
corner represent the most engaged group of people– This was done for various iterations but a 6 month cumulative VEM view was chosen to be the
champion of a three year engagement view
vs
Consider
Unengaged
Engaged
Most & increasingly
engaged
Constantly unengaged
y = 71.429x + 166.67y = 30x + 570
0
10 000
20 000
6 12 18 24 30 36
Year 1 Year 2 Year 3
VEM
Agent C's points Agent D's points
3 year trend for Agent C 3 year trend for Agent D
y = 1652.9x + 2580
y = 1059.1x + 8408
0
10 000
20 000
6 12 18 24 30 36
Year 1 Year 2 Year 3
VEM
Agent A's points Agent B's points
3 year trend for Agent B 3 year trend for Agent A
Rate of changecategory
Sta
rtin
g p
oin
t ca
teg
ory

0.87 0.79
0.91
0.97
1
0.87
0.790.87
0.79
0.79
0.91
0.87 0.87
0.97 0.91
Heat map of morbidity rates with risk adjustment
Notes:1 - estimated parameter for each cellStarting level refers to the intercept of the straight lineRate of change refers to the slope of the line, where the line refers to the regression fitted on each individual’s VEM
Increased engagement
Decreased engagement
Started low
Started high

11
1.17 1.17
0.741.17
0.460.670.82
0.46
0.46
0.46
0.69
0.461.48 1.48
Heat map of relative effect on mortality
Notes:1 - estimated parameter for each cellStarting level refers to the intercept of the straight lineRate of change refers to the slope of the line, where the line refers to the regression fitted on each individual’s VEM
Increased engagement
Decreased engagement
Started low
Started high

Concluding remarks – inflation & wellness programmes
1. Both demand and supply side causes of medical inflation in South Africa
2. Incentivised wellness programme is one of the potential solutions
3. We observe the impact of both selection and behaviour change
4. Increased engagement in wellness activities is associated with significantly lower mortality and morbidity risks
5. The combined financial impact of positive risk selection / retention and health engagement generate significant financial benefits for members of medical schemes
6. But also leads to significant mortality improvements over time....
BOTTOM LINE: EVERYONE SHOULD EXERCISE!

Conclusion
• We believe actuaries have deep insight into healthcare systems that could be of value to policy makers
• Whether in the Public or Private sector
• Our insights are based on detailed but pragmatic analyses, and we are “data sceptical”
• We emphasise context: role players’ incentives, impact of administration arrangements

Conclusion
• We place strong emphasis on professionalism and ethics, and we are objective and balanced in our advice
• We focus on understanding long and short term risks and how to mitigate them
• We aim to do our work to the benefit of Society