the role and impact of low cost...
TRANSCRIPT

The Role and Impact of Low Cost CarriersThe Role and Impact of Low Cost Carriers
MIT Global Airline Industry Program
William S. SwelbarManaging Director
March 26, 2002

Introduction and Topics to be CoveredIntroduction and Topics to be Covered
! Low Fare/Niche segment is less of a topic without the deterioration of profitability that began in 1998, and the market opportunities presented after 9/11.
! Each of the network carriers placed a capacity reduction bet on 9/12: How much was too much – how little was too little?
– Either way, the low cost segment had/has a solid platform to grow from.
! The cuts in the West would appear to only make a bad situation for the network carriers grow worse.
! Low Fare/Niche carrier growth has continued to penetrate the largest U.S. markets, and no region of the U.S. is immune.
! The RJ is the low cost growth vehicle for the network carriers –Let’s just call a spade a spade.

Shar
e of
Tot
al A
SM G
row
thSh
are
of T
otal
ASM
Gro
wth
15-Year Cycles; 15-Year “Bubbles”The Low Fare/Niche-Oriented Carriers and Regional (Small) Jets Have Already Begun Redesigning theNew Competitive Landscape
15-Year Cycles; 15-Year “Bubbles”The Low Fare/Niche-Oriented Carriers and Regional (Small) Jets Have Already Begun Redesigning theNew Competitive Landscape
-15%
-10%
-5%
0%
5%
10%
15%
20%
25%
30%
1970 1972 1974 1976 1978 1980 1982 1984 1986 1988 1990 1992 1994 1996 1998 2000
% Change in Average Stage Length% Change in Average Seats % Change in Scheduled Departures
Technology-Driven Capacity Growth
Technology-Driven Capacity Growth
Competition-DrivenCapacity Growth
Competition-DrivenCapacity Growth

RecessionRecession
-10%
-5%
0%
5%
10%
15%
20%
25%
30%
1970 1972 1974 1976 1978 1980 1982 1984 1986 1988 1990 1992 1994 1996 1998 20000%
10%
20%
30%
40%
50%
60%
70%
80%
Y-O-Y Change in ASMs Y-O-Y Change in RPMs Load Factor
Where Has the Revenue Gone?Where Has the Revenue Gone?
U.S. Scheduled Airlines’ Domestic OperationsU.S. Scheduled Airlines’ Domestic Operations
Average Load Factor 63.9%
Average Load Factor 63.9%
Average Load Factor 54%
Average Load Factor 54%
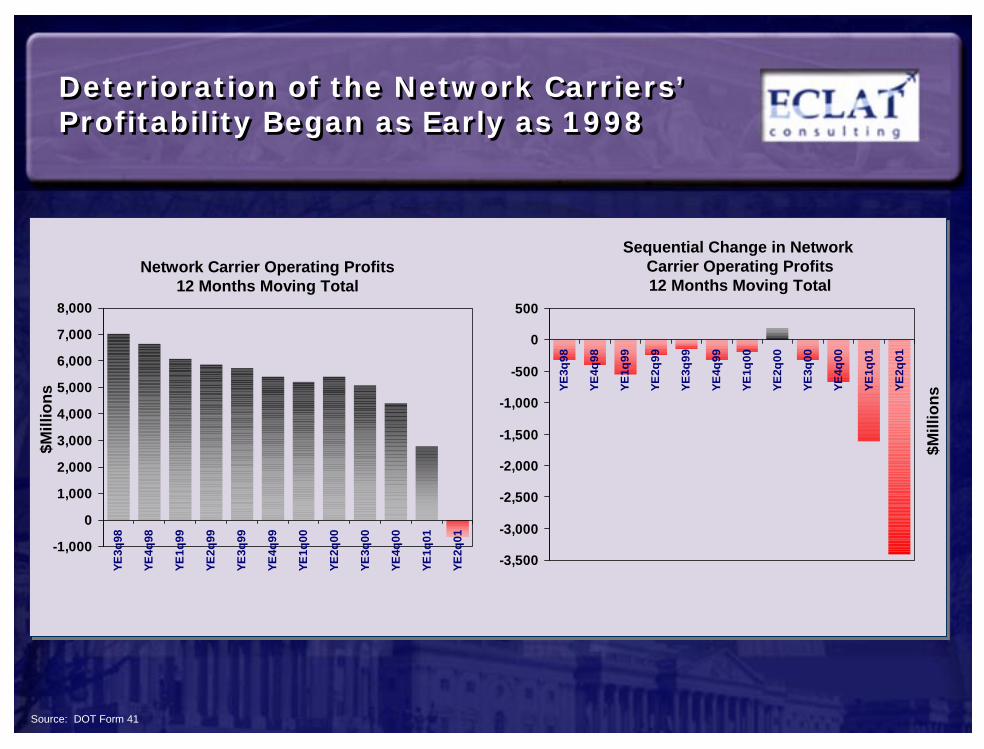
Deterioration of the Network Carriers’ Profitability Began as Early as 1998Deterioration of the Network Carriers’ Profitability Began as Early as 1998
Network Carrier Operating Profits12 Months Moving Total
-1,000
0
1,000
2,000
3,000
4,000
5,000
6,000
7,000
8,000
YE3q
98
YE4q
98
YE1q
99
YE2q
99
YE3q
99
YE4q
99
YE1q
00
YE2q
00
YE3q
00
YE4q
00
YE1q
01
YE2q
01
$Mill
ions
$Mill
ions
-3,500
-3,000
-2,500
-2,000
-1,500
-1,000
-500
0
500
YE3q
98
YE4q
98
YE1q
99
YE2q
99
YE3q
99
YE4q
99
YE1q
00
YE2q
00
YE3q
00
YE4q
00
YE1q
01
YE2q
01
Sequential Change in Network Carrier Operating Profits12 Months Moving Total
Source: DOT Form 41

The Underlying Economics Have Not Favored the Network Carrier Segment for Sometime – Overcapacity?
The Underlying Economics Have Not Favored the Network Carrier Segment for Sometime – Overcapacity?
Critical Indices Underlying the Industry’s Operating PerformanceCritical Indices Underlying the Industry’s Operating Performance
1.6%
-3.9%
8.2%
-11.8%-15.0%
-10.0%
-5.0%
0.0%
5.0%
10.0%
15.0%
ASMs Rev/ASM Cost/ASM OP. Margin(Pts. Change)
Network CarriersPercent Change
1st Half 2001 vs. 1st Half 2000
Network CarriersPercent Change
1st Half 2001 vs. 1st Half 2000
Low Fare/Niche CarriersPercent Change
1st Half 2001 vs. 1st Half 2000
Low Fare/Niche CarriersPercent Change
1st Half 2001 vs. 1st Half 2000
12.8%
0.5%
-1.3% -0.8%
-15.0%
-10.0%
-5.0%
0.0%
5.0%
10.0%
15.0%
ASMs Rev/ASM Cost/ASM OP. Margin(Pts. Change)
Network Carrier Operating Profit Change:
-$5.0B
Low Fare/Niche Carrier Operating Profit Change:
$33.7M
Note: Network carriers include American/TWA, America West, Continental, Delta, Northwest, United, and US Airways.
Note: Low Fare/ Niche carriers include Alaska, JetBlue, Frontier, AirTran, Spirit,American Trans Air, Southwest, and Midwest Express.

Assessing the Network Carrier Response: Which Hubs and Network Carriers Cut the Deepest Immediately Following 9/11?
Assessing the Network Carrier Response: Which Hubs and Network Carriers Cut the Deepest Immediately Following 9/11?
-20% 0%-18% -13% -5%-10% -9% -8%
UnitedLAX -22%SFO -22%IAD -19%DEN -17%ORD -12% Northwest
MEM -21%MSP -12%DTW -11%
American/TWA
MIA -12%ORD -12%DFW -8%STL -7%
US AirwaysPHL -11%CLT -9%PIT -7%
ContinentalEWR -17%IAH -4%CLE -1%
DeltaJFK -29%DFW -8%ATL -5%SLC +1%CVG +4%
Source: Eclat Air Service Model, November 2001 vs. September 10, 2001Note: Changes in carrier service reflect total; changes in hub service reflect nonstop only.

A Competitive Reality – The Low Fare Carriers Had Built a Strong Base of Traffic Prior to 9/11 …
A Competitive Reality – The Low Fare Carriers Had Built a Strong Base of Traffic Prior to 9/11 …
Low Fare Carriers Out-Carry Every Major Network Carrier at the Cities They Serve in Common
Low Fare Carriers Out-Carry Every Major Network Carrier at the Cities They Serve in Common
Annu
al P
asse
nger
sAn
nual
Pas
seng
ers
0
10,000,000
20,000,000
30,000,000
40,000,000
50,000,000
60,000,000
70,000,000
80,000,000
90,000,000
AA & TWA HP CO DL NW UA USHub Carrier Low Fare Carriers

The Reality – Low Fare Carrier Penetration Has Pierced Many of the Network Industry Strongholds
The Reality – Low Fare Carrier Penetration Has Pierced Many of the Network Industry Strongholds
Core 48 State Cities Served by Low Fare Carriers*Core 48 State Cities Served by Low Fare Carriers*
1997(89 Cities)
PDEWs
1997(89 Cities)
PDEWs
2001(82 Cities)
PDEWs
2001(82 Cities)
PDEWs4-Year Growth
Percent4-Year Growth
Percent
All Network Carriers Average 7,073 7,660 8.2%
Low Fare Carriers Average 1,787 2,610 46.1%
* Cities with at least 20 PDEWs for Low Fare Carriers

Low Fare Penetration inTop 10 CMSA Markets –Note the Migration from West to East
Low Fare Penetration inTop 10 CMSA Markets –Note the Migration from West to East
Total Los Angeles
35%
Total San Francisco
33%
Total Dallas/Ft. Worth
23%
Total Chicago
17%
Total Washington
18%
Total New York
8%
Total Boston
9%
Total Houston
31%
Philadelphia3%
Philadelphia3%
Atlanta 12%
Atlanta 12%
Burbank 70%
Los Angeles 25%
Long Beach 5%
Orange County 25%
Oakland69%
San Jose43%
San Francisco
4%Chicago (ORD)
0.3%
Chicago (MDW) 78%
Houston (IAH) 3%
Houston (HOU) 78%
Dallas/Ft. Worth (DFW) 2% Dallas/Ft. Worth (DAL)
94%
Washington (DCA) 3% Washington (IAD) 3%
Washington (BWI) 41%
Newark2%
New York (JFK) 24% New York (LGA) 4%
Westchester County
Islip55%
Providence 20%
Boston 3%
Manchester 20%
Large Hub
Medium Hub
Small Hub
Ontario 61%

The Low Fare/Niche Carrier Segment: They Keep Growing – Because They Can …
The Low Fare/Niche Carrier Segment: They Keep Growing – Because They Can …
-12%
+35%
+16%
+17%
+20%
+5% -21%

A Constant Reminder:IT Keeps Growing – Because IT Can …A Constant Reminder:IT Keeps Growing – Because IT Can …

Low Fare Carrier Market Penetration Has Been Greatest in the Largest U.S. Markets Since 9/11
Low Fare Carrier Market Penetration Has Been Greatest in the Largest U.S. Markets Since 9/11
Low FareCarrier Service
Low FareCarrier Service
PointsChangePoints
Change
Large Hubs -12.9% +0.7% +2.1%
Medium Hubs -10.0% +0.1% +3.3%
Small Hubs -9.7% +3.9% +2.3%
Non Hubs -12.5% -9.1% +0.7%
We estimate that the Low Fare/Niche carrier segment of the industry has captured 2.4 points of
domestic market share in the past 6 months
Total ServiceIn Markets
Total ServiceIn Markets

The Low Fare/Niche Carrier Segment of the Industry Has Increased Its Share of Service in Every U.S. Region Since 9/11
The Low Fare/Niche Carrier Segment of the Industry Has Increased Its Share of Service in Every U.S. Region Since 9/11
37.8%
32.4%
0% 6% 12% 18% 24% 30% 36% 42%
September 2001
September 2001
March 2002
March 2002
16.1%
14.3%
0% 6% 12% 18% 24% 30% 36% 42%
September 2001
September 2001
March 2002
March 2002
30.3%
28.0%
0% 6% 12% 18% 24% 30% 36% 42%
September 2001
September 2001
March 2002
March 2002
11.7%
10.9%
0% 6% 12% 18% 24% 30% 36% 42%
September 2001
September 2001
March 2002
March 2002
15.5%
13.3%
0% 6% 12% 18% 24% 30% 36% 42%
September 2001
September 2001
March 2002
March 2002
7.4%
9.6%
0% 6% 12% 18% 24% 30% 36% 42%
Sept.2001Sept.2001
March 2002
March 2002
+5.4 pts.
+2.2 pts.
+2.2 pts.

Capacity Growth by the Low Fare/ Niche Carrier Segment is Forcing the Hand of the Network Carriers
Capacity Growth by the Low Fare/ Niche Carrier Segment is Forcing the Hand of the Network Carriers
The Difference Between Capacity Reductions and Network Effect is Evident
Source: Eclat Air Service Model, March 2002 vs. September 10, 2001Note: Changes in carrier service reflect total; changes in hub service reflect nonstop only.
0%-3%-21% -14% -10% -6% +5%
UnitedLAX -32%SFO -27%IAD -25%DEN -20%ORD -9%
NorthwestMEM -23%MSP -3%DTW -2%
American/TWA
MIA -10%ORD -11%DFW -7%STL -11%
US AirwaysPHL -4%CLT -6%PIT -11%
ContinentalEWR -12%IAH -4%CLE +10%
DeltaJFK -27%DFW+20%ATL +3%SLC +2%CVG +11%

Network Carrier Exposure to Low Fare Carrier Competition Generally, and Southwest Specifically
Network Carrier Exposure to Low Fare Carrier Competition Generally, and Southwest Specifically
Increased Exposure Since 9/11
Delta
American
US Airways
Decreased Exposure Since 9/11
Continental
United
Exposure Unchanged Since 9/11
Northwest
Percent exposure to SouthwestExposure to low fare competition
USAirways
American
Delta
0 20 40 60 80 100
Northwest
United
Continental
Low Fare Index (Delta = 100 )

The Network Carriers’Low Cost Competitive Weapon
The Network Carriers’Low Cost Competitive Weapon

How the Network Carriers Utilize Their Respective Regional Jet FleetsHow the Network Carriers Utilize Their Respective Regional Jet Fleets
1st Quarter 2002 vs. 2nd Quarter 19961st Quarter 2002 vs. 2nd Quarter 1996
0%
10%20%
30%40%
50%60%
70%80%
90%
AA CO DL NW UA US
NewNew Replace JetReplace Jet
0%
5%10%
15%20%
25%30%
35%40%
45%
AA CO DL NW UA US
0%
2%
4%
6%
8%
10%
12%
14%
16%
AA CO DL NW UA US0%
10%
20%
30%
40%
50%
60%
70%
80%
AA CO DL NW UA US
Replace TurboReplace Turbo Supplement JetSupplement Jet
Average 21.3%Average 21.3%
Average 23.6%Average 23.6%
Average 9.0%Average 9.0%
Average 43.0%Average 43.0%
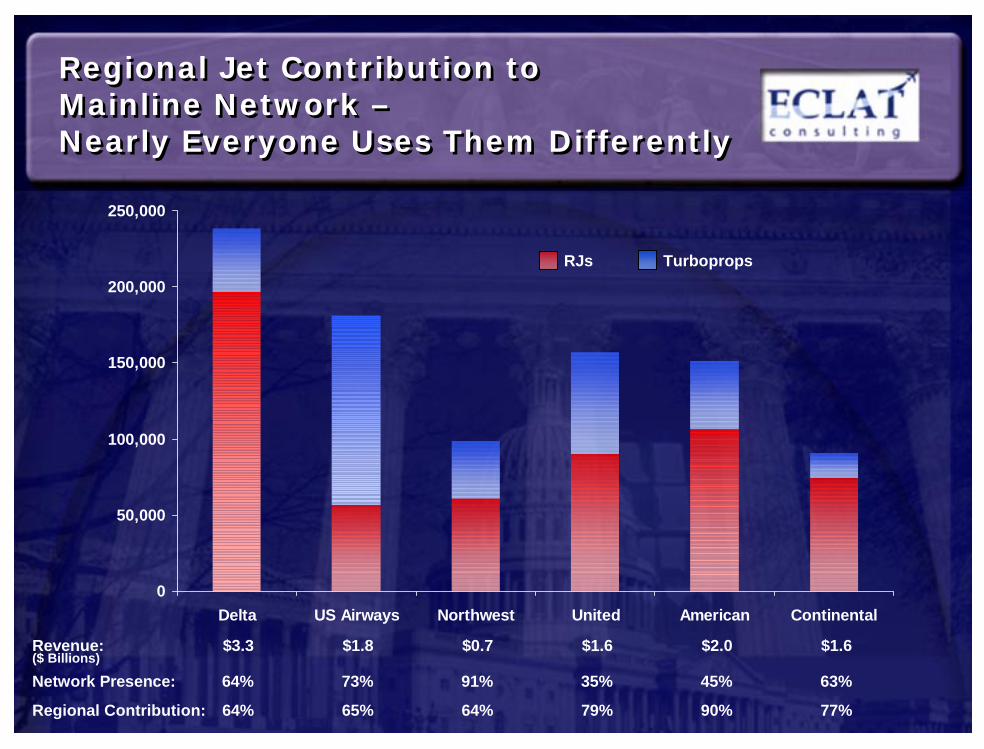
Regional Jet Contribution to Mainline Network –Nearly Everyone Uses Them Differently
Regional Jet Contribution to Mainline Network –Nearly Everyone Uses Them Differently
0
50,000
100,000
150,000
200,000
250,000
Delta US Airways Northwest United American Continental
TurbopropsRJs
Revenue: $3.3 $1.8 $0.7 $1.6 $2.0 $1.6($ Billions)
Network Presence: 64% 73% 91% 35% 45% 63%
Regional Contribution: 64% 65% 64% 79% 90% 77%

American’s Non-Hub Flying With RJs –Non-Mainline Markets With Strategic Value to the Overall Network
American’s Non-Hub Flying With RJs –Non-Mainline Markets With Strategic Value to the Overall Network
Raleigh/Durham
New York-LGA
Nashville
BaltimoreColumbus
Washington-DCA
New York-JFKNewark
Norfolk
Philadelphia
Richmond
Cleveland
Detroit
Ft. Lauderdale
Washington-IAD
Pittsburgh
Phoenix
Los Angeles
Oakland
Albuquerque
-15% or More-10% to -14%-5% to -9%0% to -4%
Fayetteville
Hartford
Boston
Bangor
Westchester Co.
Providence
Portland
Post-9/11 CapacityReductions by Region

Deployment of RJ CapacitySince 9/11 – Is This US Airways’ Network or Delta’s?
Deployment of RJ CapacitySince 9/11 – Is This US Airways’ Network or Delta’s?
Bangor
New York-LGA
Baltimore
Newark
PensacolaMobile
Oklahoma City
Orlando
TallahasseeAlbany
Dothan
Indianapolis
Grand Rapids
Augusta
HarrisburgChicago
Kansas City
Jacksonville
Monroe
Atlanta
Toronto
Halifax
Boston
Portland
PhiladelphiaAllentown
South Bend
Montreal
Charlottesville
Texarkana
Wilkes Barre
Pittsburgh
Cincinnati
Detroit
Toledo
Albany
Houston-HobbyHouston-IAH
Corpus Christi
San Antonio
Baton Rouge
Evansville CharlestonNewport News
Huntington
AshevilleTri-CitiesNashville Raleigh/DurhamMemphis
FlorenceHuntsville
Dallas/Ft. WorthBrunswick
-15% or More-10% to -14%-5% to -9%0% to -4%
Post-9/11 CapacityReductions by Region

Conclusions/QuestionsConclusions/Questions
! Over the most recent past, the Low Cost/Niche carriers have measurably increased their share of the domestic market. In justthe past six months, they have potentially increased their share2.5 points.
! The network carriers’ fear of significant encroachment is underscored by the capacity expansions announced by the largest carriers.
! The influence of the low cost carriers in the West was significant,and further inroads have been made since 9/11.
! Likewise, the low fare segment has increased its presence significantly along the East Coast over the past six months –a trend that will continue.
! Also, the growth of the mid-continent hubs by the low fare segment should be a concern, as pricing discipline will only increase. This growth will undermine pricing in the transcon market, which will bean important footnote in a bankruptcy filing or a loan guaranteeapplication.

Eclat Consulting, Inc.1555 Wilson Boulevard, Suite 602
Arlington, VA 22209 USAwww.eclatconsulting.com
Telephone 703.294.5880 Facsimile 703.294.5899