the roadmap to energy excellence - ca-nv awwa · eastern municipal water district the roadmap to...
TRANSCRIPT

EASTERN MUNICIPAL WATER DISTRICT
The Roadmap to Energy Excellence
Greg Kowalski, P.E.
Senior Civil Engineer
October 21, 2014
www.emwd.org 1
Co-authors:
Alan Zelenka, Kennedy/Jenks
Ryan Huston, P.E., Kennedy/Jenks
Luke Werner, P.E., Kennedy/Jenks
Joe Mouawad, P.E., EMWD

Agenda
• EMWD Background
• EMWD Products and Services
• Purpose of Energy Management Plan (EMP)
• Findings
• Recommendations
• Path Forward
www.emwd.org 2

• Established in 1950
• One of 26 MWD member agencies
• Unique agency, serving:
• Potable Water
• Wastewater
• Recycled Water
• Wholesale and retailwww.emwd.org 3

Service Area
www.emwd.org 4
• 542 square mile service area
• 768,000 service population
• Moreno Valley to Temecula
• Seven cities and unincorporated areas
• $225 Mil Annual Operating Budget
• 5-Member Board of Directors

Products and Services
• Potable Water: ~137,000 accounts
90,000 AF of fresh water sales per year
o Perris/Hemet Water Filtration Plant
o Menifee/Perris I Desalter
o Perris II Desalter (design)
o Groundwater Wells/Imported Water
• Wastewater: ~200,000 accounts
4 wastewater treatment plants
o Capacity: 56 MGD
o Currently treating: 46 MGD
• Recycled Water: 4th largest in California!
o EMWD treats 100% of wastewater generated
o 67% of effluent is sold for RW application
www.emwd.org 5
Hemet Water Filtration Plant
Perris I Desalter

Annual Energy Use and Cost
www.emwd.org 6
Electricity$13.0M78%
Natural Gas $2.6M16%
Fleet Fuel$1.1M
6%
Total $16.7M2014

Annual Electricity Use and Cost
www.emwd.org 7
Water$6,288,216
48%
Recycled Water$905,302
7%
Wastewater$5,407,328
42%
Raw Water $236,644 2%
Administration$143,404
1% Total $13.0M2014

Annual GHG Emissions by Category
www.emwd.org 8
Water17,713 MT
29%Recycled Water
2,816 MT4%
Wastewater35,522 MT
57%
Raw Water508 MT
1%
Administration5,304 MT
9%
Annual Greenhouse Gas Emissions by Category - 2011/2012 (MT CO2e)

Annual GHG Forecast
www.emwd.org 9
0
20,000,000
40,000,000
60,000,000
80,000,000
100,000,000
120,000,000
140,000,000
160,000,000
180,000,000
Bas
elin
e
20
13
20
14
20
15
20
16
20
17
20
18
20
19
20
20
20
21
20
22
20
23
20
24
20
25
20
26
20
27
20
28
20
29
20
30
20
31
20
32
GH
G (
MT
CO
2e
/Ye
ar)
Water Wastewater Recycled Water Raw Water Administration
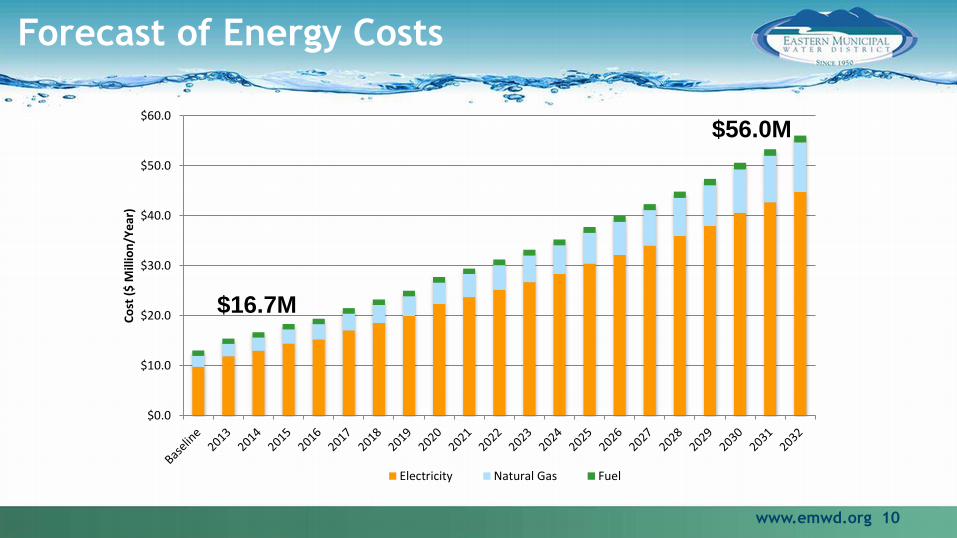
Forecast of Energy Costs
www.emwd.org 10
$0.0
$10.0
$20.0
$30.0
$40.0
$50.0
$60.0C
ost
($
Mill
ion
/Ye
ar)
Electricity Natural Gas Fuel
$16.7M
$56.0M

Forecast of Energy Costs
www.emwd.org 11
$0.0
$10.0
$20.0
$30.0
$40.0
$50.0
$60.0
Co
st (
$ M
illio
n/Y
ear
)Total Energy Cost per Year
$16.7M
$56.0M

Purpose of an Energy Management Plan
• Strategic and comprehensive look at energy use and cost, as well as Green House Gas (GHG) emissions.
• Identify portfolio of potential projects to reduce the District’s existing and future energy use and costs; and thereby reduce GHG emissions and improve air emissions compliance.
• Advance the District’s strategic plan goal of net energy independence.
www.emwd.org 12

The Road Map
www.emwd.org 13
Project Management
1 Energy Baseline and Forecast
2Operational Audits• Derceto Analysis• PVRWRF Audits & Surplus Capacity• Perris WFP Audit• IC Engines (Assessment & Strategy)
3Project Reviews• Microturbines• Fuel Cells• Solar Facilities• FWTE • Biodiesel• Biosolids Dryer• Small Hydro 4 Evaluation & Prioritization
Energy Management
Plan
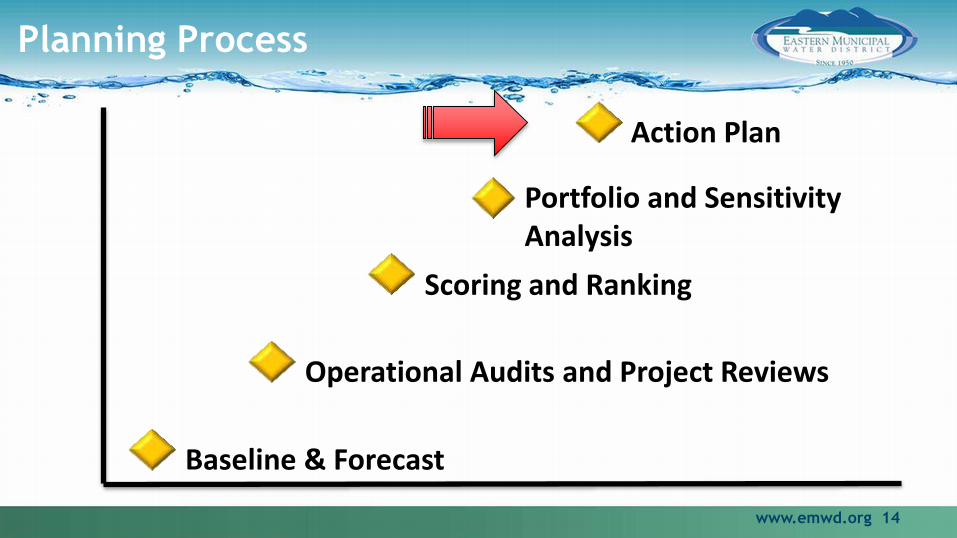
Planning Process
www.emwd.org 14
Baseline & Forecast
Operational Audits and Project Reviews
Scoring and Ranking
Portfolio and Sensitivity Analysis
Action Plan

Operational Audits and Project Reviews
Operational Audits:
A – Derceto System Audit
B.1 – PVRWRF Energy Audit
B.4 – Surplus Capacity Strategy
C – Perris WFP Energy Audit
D – IC Engines vs Electric Motors
www.emwd.org 15
Project Reviews:
A – Microturbines
B – Fuel Cells
C – Solar Facilities
D – Food Waste To Energy
E – Biodiesel
F – Biosolids Dryer
G – Small Hydro
30 Complete and Independent Projects Analyzed

Evaluation Criteria and Weighting
Weight
40
20
15
15
10
www.emwd.org 16
Criteria
1. Cost/Cost-Effectiveness
2. Alignment with Strategic Goals
3. Operational Impacts
4. Risk and Uncertainty
5. Environmental and Regulatory
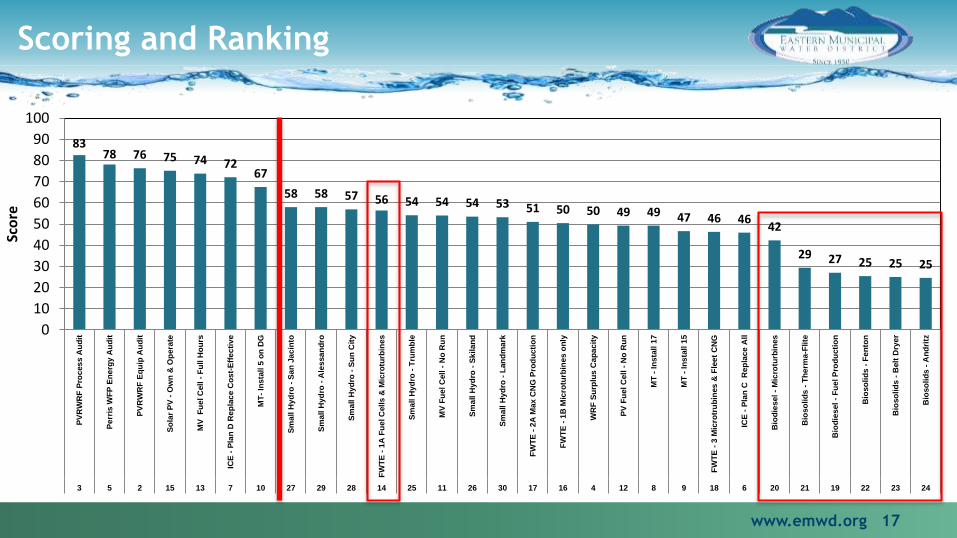
Scoring and Ranking
www.emwd.org 17
8378 76 75 74 72
67
58 58 57 56 54 54 54 53 51 50 50 49 49 47 46 4642
29 27 25 25 25
0
10
20
30
40
50
60
70
80
90
100
PV
RW
RF
Pro
ces
s A
ud
it
Pe
rris
WF
P E
ne
rgy
Au
dit
PV
RW
RF
Eq
uip
Au
dit
So
lar
PV
- O
wn
& O
pera
te
MV
F
ue
l C
ell
- F
ull H
ou
rs
ICE
- P
lan
D R
ep
lac
e C
os
t-E
ffe
cti
ve
MT
- In
sta
ll 5
on
DG
Sm
all H
yd
ro -
Sa
n J
ac
into
Sm
all H
yd
ro -
Ale
ssa
nd
ro
Sm
all H
yd
ro -
Su
n C
ity
FW
TE
- 1
A F
ue
l C
ell
s &
Mic
rotu
rbin
es
Sm
all H
yd
ro -
Tru
mb
le
MV
Fu
el
Cell
- N
o R
un
Sm
all H
yd
ro -
Sk
ila
nd
Sm
all H
yd
ro -
Lan
dm
ark
FW
TE
- 2
A M
ax
CN
G P
rod
uc
tio
n
FW
TE
- 1
B M
icro
turb
ine
s o
nly
WR
F S
urp
lus
Ca
pa
cit
y
PV
Fu
el
Cell
- N
o R
un
MT
- I
ns
tall
17
MT
- I
ns
tall
15
FW
TE
- 3
Mic
rotr
ub
ines
& F
lee
t C
NG
ICE
- P
lan
C
Rep
lac
e A
ll
Bio
die
sel
- M
icro
turb
ines
Bio
so
lid
s -
Th
erm
a-F
lite
Bio
die
sel
- F
ue
l P
rod
ucti
on
Bio
so
lid
s -
Fe
nto
n
Bio
so
lid
s -
Belt
Dry
er
Bio
so
lid
s -
An
dri
tz
3 5 2 15 13 7 10 27 29 28 14 25 11 26 30 17 16 4 12 8 9 18 6 20 21 19 22 23 24
Sco
re

Short-List of Projects
www.emwd.org 18
Includes continuing to use Derceto and continue to operate existing Fuel Cells.
# Project Name Score Rank
3 PVRWRF Process Audit 83 1
5 Perris WFP Equipment and Process Audit 78 2
2 PVRWRF Equipment Audit 76 3
15 RWRFs Solar PV - Own and Operate (5 MW) 75 4
13 MV Fuel Cell - Optimization Project 74 5
7 IC Engines - Convert Only Cost-Effective 72 6
10 PVRWRF Microturbines (5) on Digester Gas 67 7

Portfolios
• Mix and Match Short-Listed Projects and Other Projects to Develop Portfolios
• Portfolios Represent Different Themes or Mixes of Projects
• Portfolio Comparison Matrix
• NPV of Cumulative Net Savings
• Average Annual Net Savings
• Capital Cost
• Electricity Generated or Saved
• Natural Gas Saved
• GHG Reductions
www.emwd.org 19

Preferred Portfolio
• Which Portfolio makes the most sense?
• Portfolio #7 because:
1. Highest NPV and Avg Annual Savings
2. Moderate Capital Costs
3. High Electricity Generated/Saved
4. Relatively High Natural Gas Savings
5. High GHG Reductions
www.emwd.org 20

Preferred Portfolio Projects
• IC Engine Conversion
• PVRWRF Equipment and Process Audit
• PWFP Equipment and Process Audit
• PVRWRF Microturbines (5 on Digester Gas)
• MVRWRF Fuel Cell – Improve Capacity Factor
• RWRFs - Solar PV: 5 MW Own and Operate
www.emwd.org 21
Includes continuing to use Derceto and continue to operate existing Fuel Cells.

IC Engine Conversion
• 59 Total Engines Running on Natural Gas
• 18 Decommissioned or in CIP to Convert
to Electric Motors (31%)
• 16 Cost-Effective to Convert (29%)
• 25 Not Cost-Effective to Convert (45%)
www.emwd.org 22
• Capital Cost = $3,293,000
• Incentive = $0
• Net Cost = $3,293,000
• Annual Electric Savings = -4,219,300 kWh
• Average Annual Net Savings = $308,700
• NPV of Cumulative Savings = $4,356,000

Overall IC Engine Conversion Benefits
• Improved reliability
• Standardized equipment
• Reduction in O&M costs
• More favorable cost competition
for capital equipment
• Reduction of GHG emissions
• Reduction of Air Quality
restrictions
• Safety
www.emwd.org 23

PVRWRF Process Audit
www.emwd.org 24
Recommended EEMs for Immediate Implementation
Priority EEM # Category Title
Avg Annual Net
Savings ($/Yr)
1 14 Digested and Solids Storage Digester Off-Line $67,730
2 17 Chlorination Chlorine Basin Cover $50,072
3 12 Secondary Clarifiers Remove Clarifier $37,026
4 16 Digested and Solids Storage Change Mixing Strategy - Dewatering $28,221
5 15 Digested and Solids Storage Change Mixing Strategy - Digester $22,577
6 11 Secondary Clarifiers Reduce RAS Rate $18,061
7 2 Raw Pumping Wet Well Level $7,526
11 other recommended EEMs
• Capital Cost = $10,500
• Incentive = $0
• Net Cost = $10,500
• Annual Electric Savings = 1,582,200 kWh
• Average Annual Net Savings = $268,700
• NPV of Cumulative Savings = $2,260,600

PVRWRF Equipment Audit
www.emwd.org 25
• Capital Cost = $1,965,000
• Incentive = $205,000
• Net Cost = $1,760,000
• Annual Electric Savings = 1,741,200 kWh
• Average Annual Net Savings = $142,300
• NPV of Cumulative Savings = $2,140,000
Recommended EEMs
EEM # Category Description
Avg Annual
Net Savings
($/Yr)
1 Lighting Install lighting controls in all unoccupied spaces. Best Practice
2a Lighting Replace Interior Lighting with higher efficiency lighting systems $2,465
2b Lighting Replace Exterior Lighting with higher efficiency lighting systems $10,087
3 HVAC Lock temperature range of HVAC systems TBD
4 HVAC Provide an alternative HVAC system for main control room instead of heat pump TBD
7 Plug Load Remove all portable space heaters Best Practice
8 Plug Load Replace microwave above sink made in 1992 with a microwave/convection system Best Practice
9 Process Replace computers and monitors with Energy Star equipment at end of life Best Practice
10 Operational Reduce ramp response of Turblex blowers during blowdown cycles. TBD
11 Operational Replace Turblex blower with Neuros blower $45,511
12 Operational Route aeration system blowdown to the blower building exterior TBD
15 Operational Enroll in SCE pump optimization program $122,792

PWFP Equipment and Process Audit
www.emwd.org 26
• Capital Cost = $462,000
• Incentive = $42,000
• Net Cost = $420,000
• Annual Electric Savings = 458,400 kWh
• Average Annual Net Savings = $63,700
• NPV of Cumulative Savings = $930,000
List of Recommended EEMsEEM
#
Category Title Avg Annual Net
Savings ($/Yr)
1 Lighting Lighting – Interior $8,546
2 Lighting Occupancy Sensor - Bathrooms & Kitchen Best Practice
3b Lighting Occupancy Sensor - Finish Water Building Best Practice
4 Lighting Lighting - Exterior LED $11,787
5 Lighting Lighting - Delamp Control Room (per fixture) Best Practice
7 Plug Load New Appliances (Refrigerator) Best Practice
10 Process Pump Efficiency $42,782
16 Process TOU Analysis TBD
17 Process Managing Overproduction Ops Change
18 Process Off-Spec Water Ops Change
19 Process Wet Well Level $12,528

Solar PV – Own and Operate
• Up to five 1 MW Solar PV Projects (5 MW)
• EMWD Own and Operate
• Offset Load at RWRFs
• CSI Reservation Obtained
www.emwd.org 27
• Capital Cost = $25,091,000
• Incentive = $5,051,000
• Net Cost = $20,040,000
• Annual Electric Savings = 8,537,000 kWh
• Average Annual Net Savings = $179,500
• NPV of Cumulative Savings = $2,829,000

Summary Results
www.emwd.org 28
Average Annual Net Savings $1.2 Million/Year
Net Present Value (NPV) of Average Annual Net Savings $17.9 Million
Cumulative Total Net Savings by 2033 $24.2 Million
Average Annual Electricity Generation/Savings 10.2 Million kWh/Year
Total Electricity Generation/Savings by 2033 203.1 Million kWh
Annual Reduction in GHG Emissions 4,940 MT CO2/Year
Total Reductions in GHG Emissions by 2033 97,990 MT CO2
~1,000
Cars
~1,500
Homes

Sensitivity Analysis
• Provides guidance in responding to future changes in
regulatory, political or economic environment
• Scenarios/Sensitivities:
1. Electric Cost
2. Natural Gas Cost
3. GHG Fee
4. Discount Rate
5. Bond Interest Rate
www.emwd.org 29

Sensitivity - Electric Rates
$0.0
$4.0
$8.0
$12.0
$16.0
$20.0
$24.0
Preferred PortfolioEscalator = 4%
Lower Electricity PriceEscalator = 2%
Higher Electricity PriceEscalator = 6%
$17.9
$14.2
$22.6
NP
V o
f A
nn
ual
Net
Sav
ings
(M
illio
ns
$)
www.emwd.org 30

Sensitivity Analysis - Conclusions
• Some scenarios reduce the Preferred Portfolio’s savings
• In all scenarios the Preferred Portfolio remains cost-effective
• Robust Plan under these future scenarios
www.emwd.org 31

Implementation Plan
www.emwd.org 32
Project Status
PVRWRF Process OptimizationInitiated and Partially
Implemented
IC Engines – Convert Cost-Effective Only Initiated (Phase 1)
PWFP Equipment and Process OptimizationInitiated and Partially
Implemented
PVRWRF Microturbines (5) Initiated
PVRWRF Equipment OptimizationInitiated and Partially
Implemented
Solar PV – Own & Operate (5MW) Initiated
MV Fuel Cell Optimization Initiated

Thank you for your time!
Questions?
www.emwd.org 33

Contact Information
EASTERN MUNICIPAL WATER DISTRICT
Greg Kowalski, P.E.
Senior Civil Engineer
Eastern Municipal Water District
951.928.3777 ext. 4466
www.emwd.org 34
Alan Zelenka
Energy Services Practice Leader
Kennedy/Jenks Consultants
(541) 844-7812