the road to driver safety - eiseverywhere.com€¦ · the road to driver safety ... slips/trips...
TRANSCRIPT

1
THE ROAD TO DRIVER SAFETY
Alan Hunter – Global Director Industrial Projects Mike Watson – Global Road Safety Manager, Shell Jay Zinser – VP Operations, Chemical & Energy
Global Energy Conference | Houston | 7 October 2014
2 Global Energy Conference | Houston | 7 October 2014
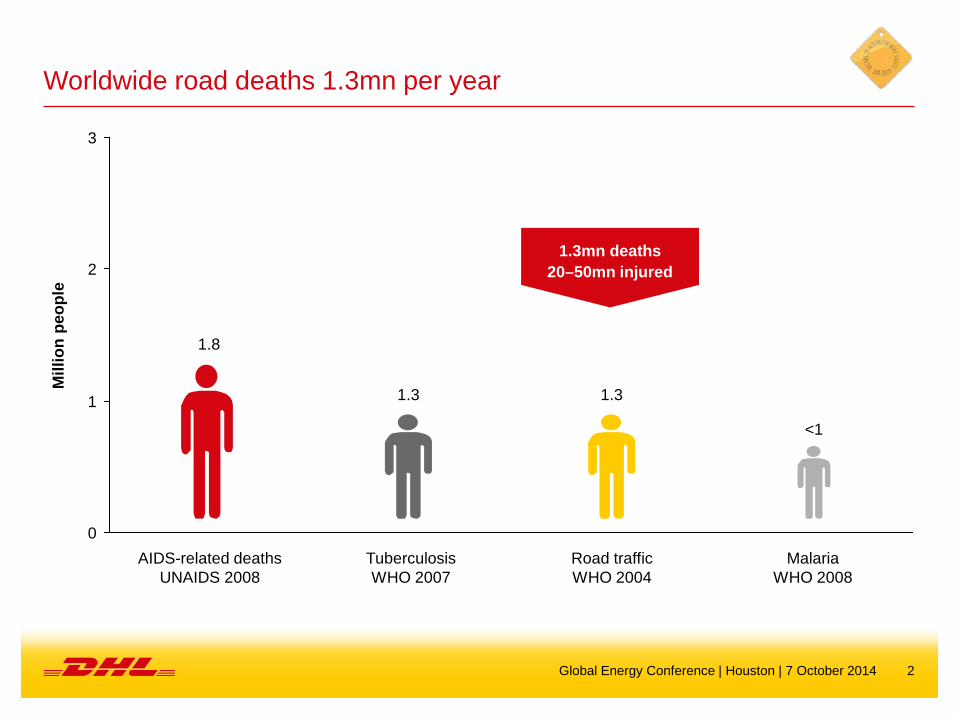
Worldwide road deaths 1.3mn per year
0
1
2
3
Malaria WHO 2008
Road traffic WHO 2004
Tuberculosis WHO 2007
AIDS-related deaths UNAIDS 2008
1.3mn deaths 20–50mn injured
<1
1.8
1.3 1.3
Mill
ion
peop
le

3 Global Energy Conference | Houston | 7 October 2014
A growing problem – Predictions of global mortality
Source: WHO Global Burden of Disease 2008
0,0
0,5
1,0
1,5
2,0
2,5
2015 2008 2030
Road traffic injuries Tuberculosis HIV/AIDS Malaria
Dea
ths
(mn)

4 Global Energy Conference | Houston | 7 October 2014
G20 countries – Road traffic death rates – A concern for everyone
16,8
10,3
7,5
12,8
19,521,5
5,05,4
6,0
7,88,8
9,6
13,413,713,9
16,216,5
18,320,7
25,229,0
33,2
0 5 10 15 20 25 30 35
Middle-income countries High-income countries
Low-income countries
United States Indonesia
China India
Brazil Mexico Russia
Saudi Arabia South Africa
United Kingdom Germany
France
South Korea Turkey
Argentina
Australia Canada
Italy
Japan
Deaths per 100,000 population
Source: WHO Global Status Report, 2009

5 Global Energy Conference | Houston | 7 October 2014
Annual global road accident statistics (WHO)
Key facts from World Health Organisation (March 2013)
• RTA’s - leading cause of death among young people, aged 15–29 years
• 91% of RTA fatalities occur in low and middle-income countries
• Half the fatalities are “vulnerable road users”: pedestrians, cyclists, motorcyclists
• Without action forecast is fatality rise from 1.3M to 1.9M by 2020
• Only 28 countries have adequate laws that address all five risk factors (speed, drink-driving, helmets, seat-belts and child restraints)

6 Global Energy Conference | Houston | 7 October 2014
U.S. Oil and gas industry – MV deaths
• Motor vehicle death rate in O&G workers is 8.5x that of all workers
– 7.6 deaths per 100,000 workers
• Highest risk
– Small establishments <20 workers
– Young employees <35 years
– New employees < 1 year
• Crash characteristics
– Single vehicle/non-collision
– Lack of seat belt use
– Pickup trucks
– Fatigue
Source: Retzer, Hill, Pratt (2013). Motor vehicle fatalities among oil and gas extraction workers. Accident Analysis and Prevention. 51:168–74.
These risks are likely magnified for workers in low and middle income countries

7 Global Energy Conference | Houston | 7 October 2014
Global burden of road traffic injuries

8 Global Energy Conference | Houston | 7 October 2014
Economic cost of motor vehicle crashes
USD 518bn dollars annually worldwide
U.S. Oil and Gas Industry cost: USD 500k/death and USD 74k/injury

9 Global Energy Conference | Houston | 7 October 2014
Vehicle growth to 2020
Total vehicles in use
72%50% 40%
20%42%
50%
8% 8% 10%
2008 2013 2018
1.1bn 672mn
Lower-growth economies Rapidly emerging economies Mature economies
1.5bn
Source: Booz & Company
10
THE ROLE OF LEADERSHIP IN ACHIEVING ‘STEP-CHANGE’ PERFORMANCE IMPROVEMENT IN ROAD SAFETY
Global Energy Conference | Houston | 7 October 2014
Mike Watson - Shell Global Road Safety Manager
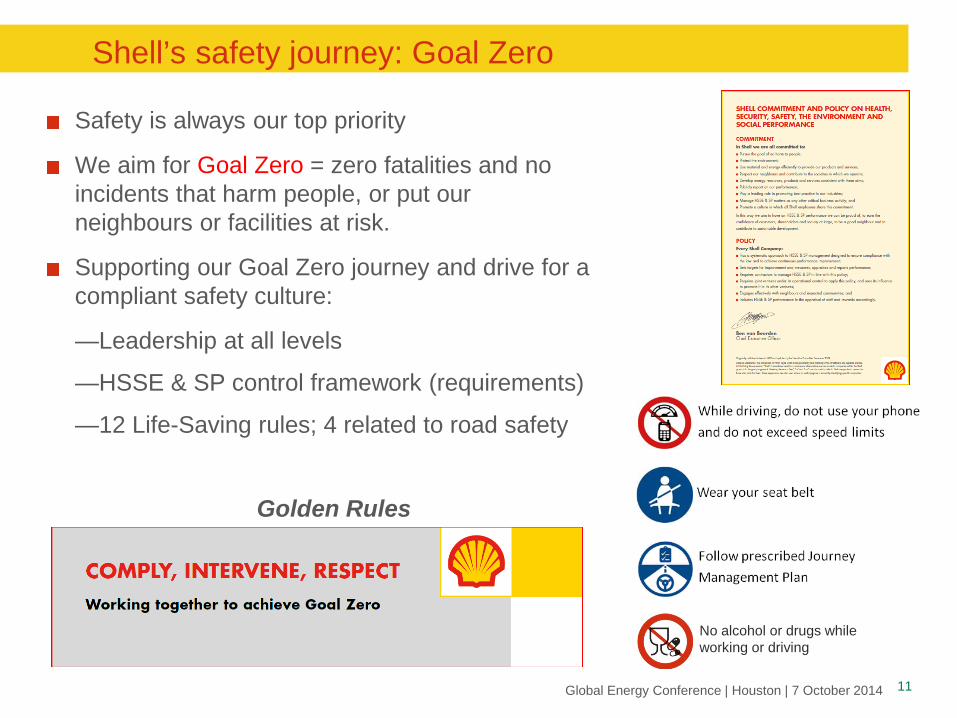
Shell’s safety journey: Goal Zero
Safety is always our top priority
We aim for Goal Zero = zero fatalities and no incidents that harm people, or put our neighbours or facilities at risk.
Supporting our Goal Zero journey and drive for a compliant safety culture:
—Leadership at all levels
—HSSE & SP control framework (requirements)
—12 Life-Saving rules; 4 related to road safety
Golden Rules
11
No alcohol or drugs while working or driving
Global Energy Conference | Houston | 7 October 2014

Safety leadership
Leaders face choices /dilemmas e.g. safety vs. costs vs. schedule
Leaders are role models – whether they choose to be or not.
A leader’s behaviour impact those around them and creates the culture of the organisation.
Leaders are judged by the things they do & say – not by their intent.
Good safety means good focus, good discipline, shared vision and the professionalism of our teams and our qualities as leaders
Intent vs behaviour You measure yourself versus your intent; others measure you against your behaviour Leaders of an organisation are role models. They have no choice - their behaviours are observed and copied by others However, they can choose which behaviours they model
“Safety is not only our number one priority and value, it is a fundamental reflection of our performance”
“Poor safety is nothing more than a lack of leadership.”
12 Global Energy Conference | Houston | 7 October 2014
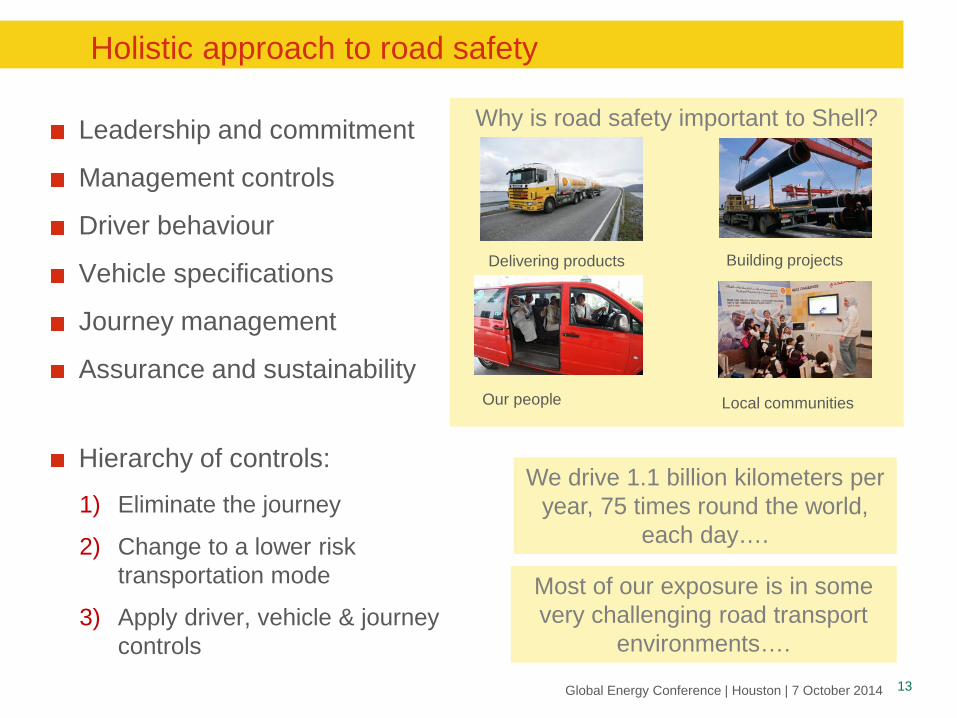
Holistic approach to road safety
Leadership and commitment
Management controls
Driver behaviour
Vehicle specifications
Journey management
Assurance and sustainability
Hierarchy of controls:
1) Eliminate the journey
2) Change to a lower risk transportation mode
3) Apply driver, vehicle & journey controls
We drive 1.1 billion kilometers per year, 75 times round the world,
each day….
Most of our exposure is in some very challenging road transport
environments….
Why is road safety important to Shell?
Delivering products Building projects
Our people Local communities
13 Global Energy Conference | Houston | 7 October 2014
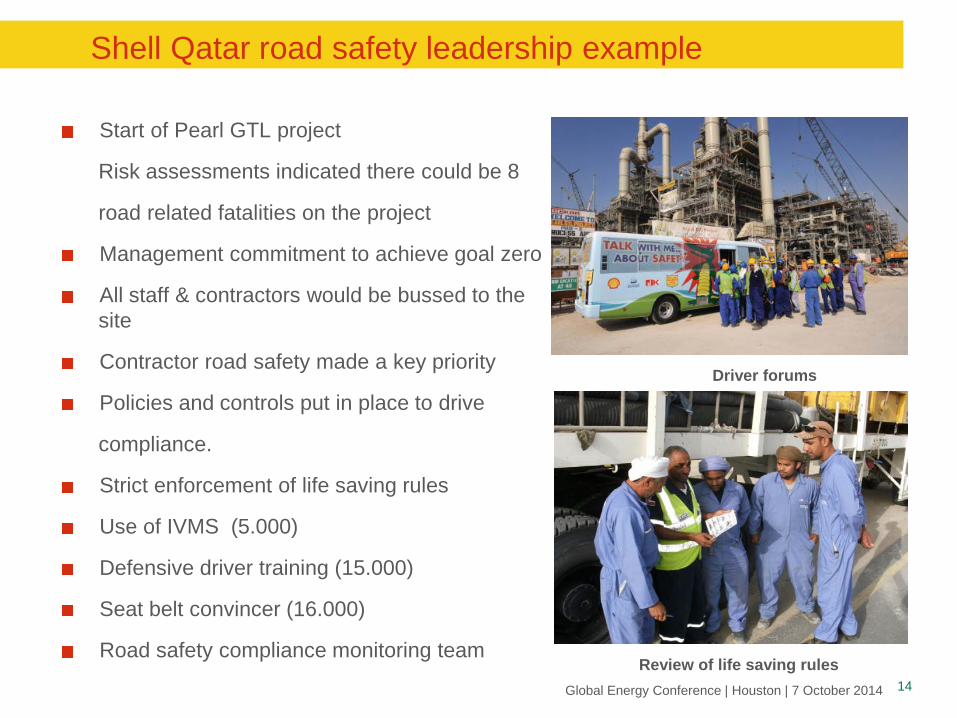
Shell Qatar road safety leadership example
Start of Pearl GTL project
Risk assessments indicated there could be 8
road related fatalities on the project
Management commitment to achieve goal zero
All staff & contractors would be bussed to the site
Contractor road safety made a key priority
Policies and controls put in place to drive
compliance.
Strict enforcement of life saving rules
Use of IVMS (5.000)
Defensive driver training (15.000)
Seat belt convincer (16.000)
Road safety compliance monitoring team
Driver forums
Review of life saving rules 14 Global Energy Conference | Houston | 7 October 2014
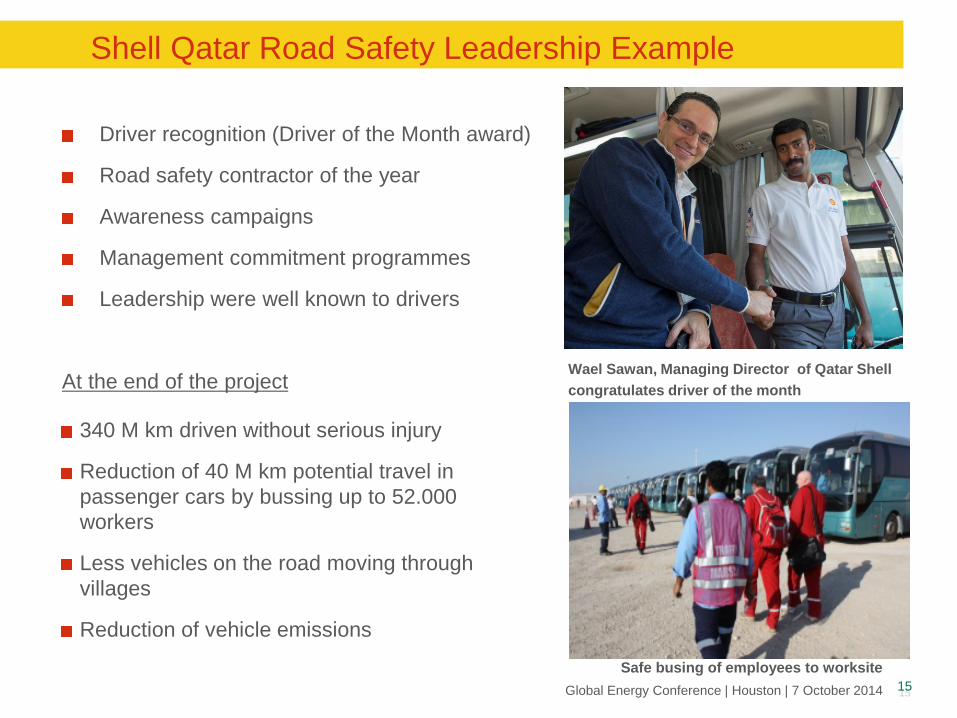
Shell Qatar Road Safety Leadership Example
Driver recognition (Driver of the Month award)
Road safety contractor of the year
Awareness campaigns
Management commitment programmes
Leadership were well known to drivers
At the end of the project
Wael Sawan, Managing Director of Qatar Shell congratulates driver of the month
15
340 M km driven without serious injury
Reduction of 40 M km potential travel in passenger cars by bussing up to 52.000 workers
Less vehicles on the road moving through villages
Reduction of vehicle emissions
Safe busing of employees to worksite 15 Global Energy Conference | Houston | 7 October 2014
16
ROAD SAFETY FOCUS DHL CASE STUDY
Global Energy Conference | Houston | 7 October 2014
Jay Zinser – VP Operations, Chemical & Energy

17
DHL/Exel current areas of safety focus
Transport Safety
Cuts Prevention
Slips/Trips Prevention
Manual Handling
MHE Control
HSE Management system in new
operations
Global standards
Reporting & investigation system
Distribution Centre Safety BBS
We are currently focusing upon the following aspects for improving our safety performance
Compliance assurance
Global Energy Conference | Houston | 7 October 2014
18 Global Energy Conference | Houston | 7 October 2014
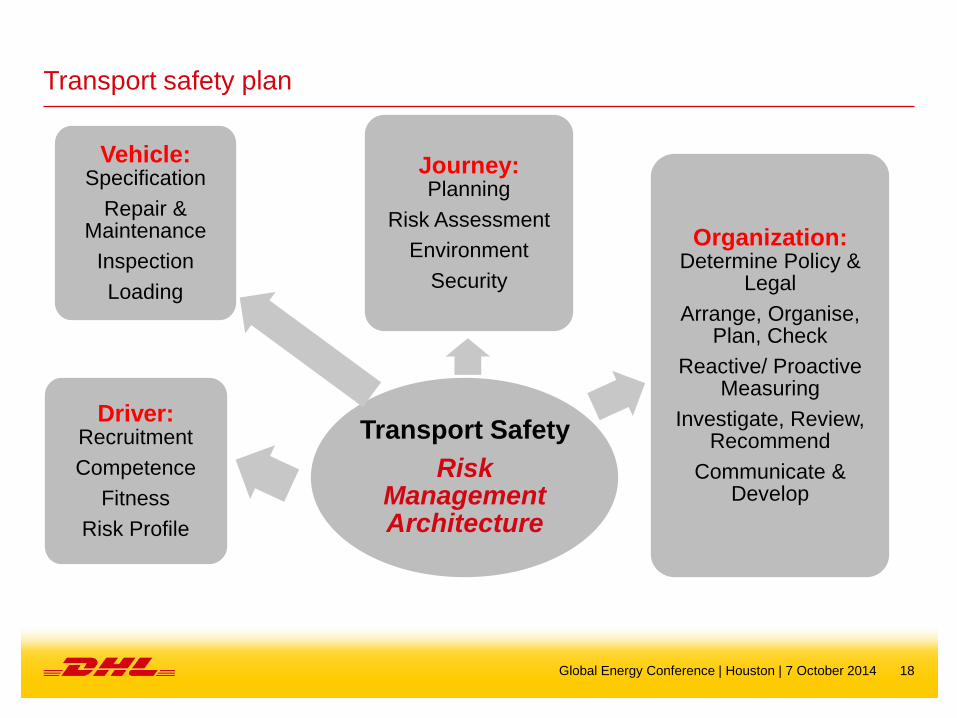
Transport safety plan
Transport Safety Risk
Management Architecture
Driver: Recruitment Competence
Fitness Risk Profile
Vehicle: Specification
Repair & Maintenance
Inspection Loading
Journey: Planning
Risk Assessment Environment
Security
Organization: Determine Policy &
Legal Arrange, Organise,
Plan, Check Reactive/ Proactive
Measuring Investigate, Review,
Recommend Communicate &
Develop

19
DHL/Exel transportation safety strategic objectives
• Identify, develop, implement a driver resource strategy to minimize driver shortage risk and leverage existing labor force.
Enhance Driver Resource Strategy
• Implement a developed new driver on-boarding program that provides and evaluates critical job performance knowledge and skills of new hires
Implement and Continuously Improve On-boarding program
• Implement a developed program to analysis key driver safety performance metrics and prioritize driver’s risk profiles for appropriate safety intervention
Improve identification and intervention of At-risk drivers
• Increase site management demonstrated safety leadership through associate focused safety surveys and roundtable discussions
Enhance the role of site leadership in promoting a culture of safety
• Implement and continuously improve driver BBS program; identify opportunities to leverage cross-sector support with local geographic overlap presence
Improving Driver BBS Program
Global Energy Conference | Houston | 7 October 2014

20
Exel case study- Tactics utilized
• Cultural assessment of all drivers • Implemented “fit for purpose” driver physicals • Increased BBS observations and ride alongs • JHA’s at delivery points • Driver safety committee participation • Specific driver safety training sessions conducted • Vehicle safety modifications
Global Energy Conference | Houston | 7 October 2014
21
LET’S DISCUSS…
Global Energy Conference | Houston | 7 October 2014
How can we as employers in the Energy industry promote transport safety more broadly?