the road from surviving to thriving: strategies for building internal capacity over the long term...
TRANSCRIPT
The Road from Surviving to Thriving: Strategies for Building Internal Capacity over
the Long Term
By: Wendy Gradison, President and CEO of PRS, Inc

“Some critics will write ‘Maya Angelou is a natural writer’ – which is right after being a natural heart surgeon.”
- Maya Angelou

Key factors:
1) Having the right people working with me.
2) Having the right processes in place
and being followed.


People do what you
inspect. Not what
you expect.

PROFESSIONAL INTELLIGENCE:
The ability to take ownership and responsibility for one’s workplace behaviors and to modulate them to work effectively with others. (Employee’s demonstrated ability to be open to candid feedback, new perspectives, and self-development; the demonstrated ability to stay composed, positive, and unflappable even in trying moments; the demonstrated ability to admit his/her own mistakes and move forward in a positive manner; demonstrated ability to meet commitments and hold him/herself accountable for meeting performance objectives.)

“The single biggest problem with communication is the illusion that it has taken place.”
- George Bernard Shaw
Communicate before we activate.

“Not everything that can be counted counts, and not everything that counts can be counted.”
- Albert Einstein

You cannot improve what you cannot measure.
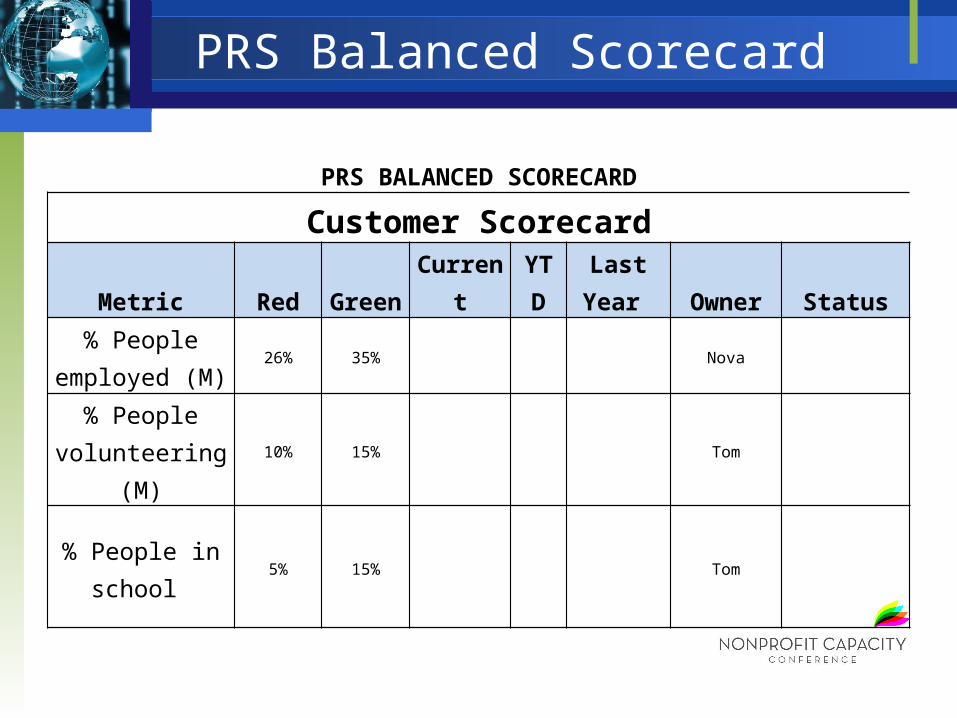
PRS Balanced Scorecard
PRS BALANCED SCORECARDCustomer Scorecard
Metric Red Green Current YTD Last Year Owner Status
% People employed (M)
26% 35%
Nova
% People volunteering (M)
10% 15%
Tom
% People in school
5% 15%
Tom

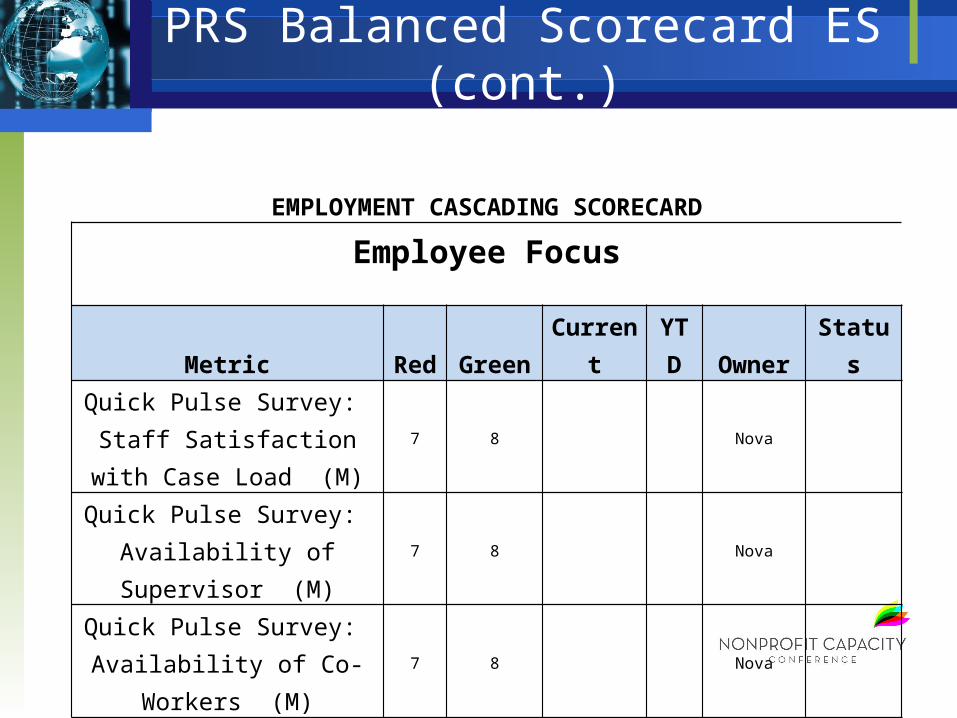
PRS Balanced Scorecard ES
EMPLOYMENT CASCADING SCORECARD
Customer FocusMetric Red Green Current YTD Owner Status
Median hourly wage (M) $7.25 $8.20 Nova
Median time between job development & start date of job (Q)
6 mo. 3 mo. Nova
Employed Clients through Arlington Co Contract
30% 45% Nova
Employed Clients through Fairfax Co Contract
30% 45% Nova
Employed Clients through Non County Contracts
45% 60% Nova
DRS Rehab Rate (90 days post LTESS/#Job Development Clients) (Q)
57% 60% Nova

PRS Balanced Scorecard
PRS BALANCED SCORECARDEmployee Scorecard
Metric Red Green Current YTD Last Year Owner Status
Total Turnover >16% <12% Virginia
Turnover Voluntary (Q)
>10% <7%
Virginia
Turnover Involuntary (Q)
>10% <8%
Virginia
Performance Review Ratings (Q)
<3 rating >4+ rating
Virginia
Employee Tenure (Median) (Q)
2 5+
Virginia
PRS Balanced Scorecard ES (cont.)
EMPLOYMENT CASCADING SCORECARD
Employee Focus
Metric Red Green Current YTD Owner StatusQuick Pulse Survey: Staff
Satisfaction with Case Load (M)
7 8 Nova
Quick Pulse Survey: Availability of Supervisor (M)
7 8 Nova
Quick Pulse Survey: Availability of Co-Workers (M)
7 8 Nova

PRS Balanced Scorecard (cont.)PRS BALANCED SCORECARD
Financial Scorecard
Metric Red Green Current YTDLast Year Owner Status
Revenue over Cost (net of investments) (M) <2.5% >4% Joe
Overhead Rate (M) >25% or <15%
>15% and <22% Joe
Diversification of Funding /Concentration of Risk (net of investments)(M)
Single source >44%
No single source >42%
Joe
Total revenue growth (net of investments) (M) <0.5% >1% Joe
Number of Donors: All Sources (Q)
Q1 – 8 Q2 - 235
Q3 - 275
Q4 - 400
Q1 – 10 Q2 - 250 Q3 - 300 Q4 - 432
Meredith
Revenue from Fundraising (net of investments) (Q)
Q1-3.27% Q2-10.15% Q3-7.62% Q4-7.37%
Q1-3.92% Q2-12.1% Q3-9.22% Q4-9.02%
Meredith
DRS Authorized Hour Utilization <80% >85% Nova
Operating Reserves (M) 25% Cur (-)
50% Cur (+) Joe

PRS Balanced Scorecard RA (cont.)
Financial ImpactMetric Red Green Current YTD Owner Status
# Medicaid units met (M) - VA (target 1376
for each site)
2751 / 16503
3095 / 18570 Tom
# Billable units (includes Medicaid, MCO, Local) met (M) - DC
203 / 406 600 / 1200 Tom
Number of clients served by Recovery Academy will increase by 15% from 374 to 430 in FY14 (56 Clients, net inc 4.67 per mo)
4 / 24 5 / 30 Tom
RECOVERY ACADEMY SERVICES CASCADING SCORECARD

PRS Balanced Scorecard (cont.)
PRS BALANCED SCORECARDInfrastructure Scorecard
Metric Red Green Current YTD FY12 Owner Status
Timely Completion of Performance
Evaluations (M)
>50% are over 30 days from due date
>85% within 30 days from due date
Virginia

PRS Balanced Scorecard RA (cont.)
RECOVERY ACADEMY SERVICES CASCADING SCORECARD
Infrastructure
Metric RedGree
n Current YTD Owner StatusAverage Monthly Attendance (units) per client
(Units / Active clients) (M) - MV<19.7 >19.7 Tom
Average Monthly Attendance (units) per client (Units / Active clients) (M) - TY
<19.7 >19.7
Successful course completion (using the Post Test and 70% group attendance) (Q)
50% 80% Tom
% Staff Successfully Meeting Targets (Face -to-face meeting at least every two week per client with at
least 85% of clients)90% 95% Tom
Audit / Timely & Accurate completion of records (Q) 90% 95% Tom
Time (days) between referrals / contact from previous month (separate by site)
5 3 Tom

PRS Leadership Team

Questions? Comments?
Wendy Gradison, LCSWPresident & Chief Executive
Officer