the rivalry matrix:: understanding rivalry and competitive dynamics
TRANSCRIPT
European Management Journal Vol. 18, No. 6, pp. 619–637, 2000 2000 Elsevier Science Ltd. All rights reservedPergamon
Printed in Great Britain0263-2373/00 $20.00PII: S0263-2373(00)00054-2
The Rivalry Matrix:Understanding Rivalryand CompetitiveDynamicsOLIVIER FURRER, University of Birmingham Business SchoolHOWARD THOMAS, University of Illinois at Urbana-Champaign
In this paper we present a framework, the rivalrymatrix, outlining a range of viable approacheswhich businessmen, modelers, and consultants canuse to frame problems and issues in competitiverivalry. We then discuss the rationale of each of themain modeling approaches contained in the matrix.We follow this discussion with case examples,which illustrate the processes involved in modelingcompetitive dynamics within each of the four cellsof the rivalry matrix. We conclude with the descrip-tion of a practical process for analyzing competitivedynamics. 2000 Elsevier Science Ltd. All rightsreserved
Keywords: Competitive strategy, Competitivedynamics, Rivalry matrix
Introduction
In a recent article, Thomas and Pollock (1999) pro-vided an extensive and thoughtful review of theliterature on Competitive Strategy. In particular, theynote that while approaches such as Porter’s five-forces analysis have been widely adopted in businesspractice and industry analysis, there is far less guid-ance and advice about how to model the dynamicsof competition and rivalry in complex industries.
We present a framework, the rivalry matrix, whichoutlines a range of viable approaches which busi-nessmen, modelers, and consultants can use to framethe problems and issues in competitive rivalry. Wethen discuss the rationale of each of the main mode-ling approaches contained in the matrix. We follow
European Management Journal Vol 18 No 6 December 2000 619
this discussion with a number of case examples,which illustrate the processes involved in modelingcompetitive dynamics within each of the four cells ofthe rivalry matrix. We conclude with a set of practicalguidelines for analyzing competitive dynamics.
A Review of Analytical Models andFrameworks
The strategy literature provides a range of differenttools to analyze rivalry and competitive dynamics.Among these tools, game theoretic models (Camerer,1991; Dixit and Nalebuff, 1991), scenario analyses(Wack, 1985a, b; Schoemaker, 1991, 1993, 1995),simulation models, systems dynamics models(Morecroft, 1984; Warren, 1995, 1999), ‘warfare’ mod-els (von Clausewitz, 1911; Sun-Tzu, 1963, 1993; Kar-nani and Wernerfelt, 1985; D’Aveni, 1994; Chen,1996), and framework approaches (Porter, 1980;Hertz and Thomas, 1982; Thomas, 1984) are the mostdiscussed and used. A problem with these tools isthat they have usually been developed to answer cer-tain specific competition questions or to analyzesome specific rivalry situations. For example, game-theoretic models are rather specific: the behavior thatemerges in equilibrium depends on the precise stateof the environment that obtains (Camerer, 1991). So,their usefulness is often limited to the contexts forwhich they have been designed (Porter, 1991). There-fore, it is suggested that each of these different mode-ling tools, including game theory, should be matchedto the particular competitive situation under studyusing the rivalry matrix approach.
THE RIVALRY MATRIX: UNDERSTANDING RIVALRY AND COMPETITIVE DYNAMICS
The Rivalry Matrix
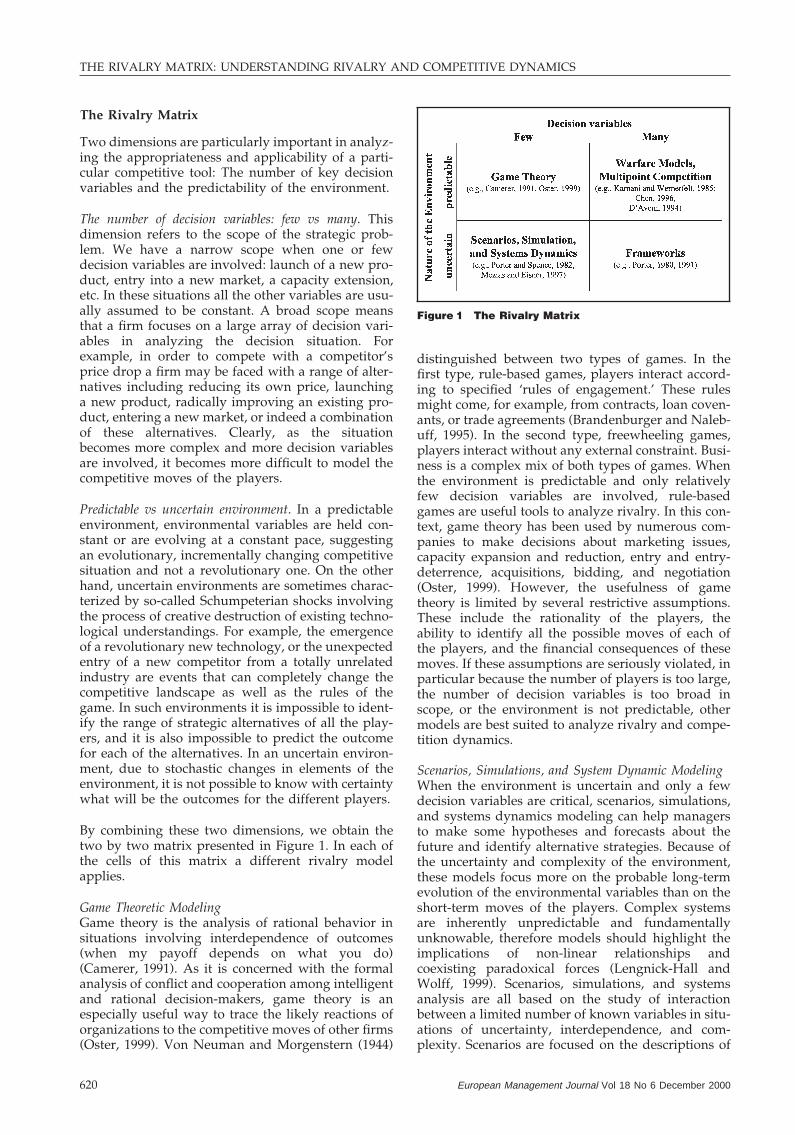
Two dimensions are particularly important in analyz-ing the appropriateness and applicability of a parti-cular competitive tool: The number of key decisionvariables and the predictability of the environment.
The number of decision variables: few vs many. Thisdimension refers to the scope of the strategic prob-lem. We have a narrow scope when one or fewdecision variables are involved: launch of a new pro-duct, entry into a new market, a capacity extension,etc. In these situations all the other variables are usu-ally assumed to be constant. A broad scope meansthat a firm focuses on a large array of decision vari-ables in analyzing the decision situation. Forexample, in order to compete with a competitor’sprice drop a firm may be faced with a range of alter-natives including reducing its own price, launchinga new product, radically improving an existing pro-duct, entering a new market, or indeed a combinationof these alternatives. Clearly, as the situationbecomes more complex and more decision variablesare involved, it becomes more difficult to model thecompetitive moves of the players.
Predictable vs uncertain environment. In a predictableenvironment, environmental variables are held con-stant or are evolving at a constant pace, suggestingan evolutionary, incrementally changing competitivesituation and not a revolutionary one. On the otherhand, uncertain environments are sometimes charac-terized by so-called Schumpeterian shocks involvingthe process of creative destruction of existing techno-logical understandings. For example, the emergenceof a revolutionary new technology, or the unexpectedentry of a new competitor from a totally unrelatedindustry are events that can completely change thecompetitive landscape as well as the rules of thegame. In such environments it is impossible to ident-ify the range of strategic alternatives of all the play-ers, and it is also impossible to predict the outcomefor each of the alternatives. In an uncertain environ-ment, due to stochastic changes in elements of theenvironment, it is not possible to know with certaintywhat will be the outcomes for the different players.
By combining these two dimensions, we obtain thetwo by two matrix presented in Figure 1. In each ofthe cells of this matrix a different rivalry modelapplies.
Game Theoretic ModelingGame theory is the analysis of rational behavior insituations involving interdependence of outcomes(when my payoff depends on what you do)(Camerer, 1991). As it is concerned with the formalanalysis of conflict and cooperation among intelligentand rational decision-makers, game theory is anespecially useful way to trace the likely reactions oforganizations to the competitive moves of other firms(Oster, 1999). Von Neuman and Morgenstern (1944)
European Management Journal Vol 18 No 6 December 2000620
Figure 1 The Rivalry Matrix
distinguished between two types of games. In thefirst type, rule-based games, players interact accord-ing to specified ‘rules of engagement.’ These rulesmight come, for example, from contracts, loan coven-ants, or trade agreements (Brandenburger and Naleb-uff, 1995). In the second type, freewheeling games,players interact without any external constraint. Busi-ness is a complex mix of both types of games. Whenthe environment is predictable and only relativelyfew decision variables are involved, rule-basedgames are useful tools to analyze rivalry. In this con-text, game theory has been used by numerous com-panies to make decisions about marketing issues,capacity expansion and reduction, entry and entry-deterrence, acquisitions, bidding, and negotiation(Oster, 1999). However, the usefulness of gametheory is limited by several restrictive assumptions.These include the rationality of the players, theability to identify all the possible moves of each ofthe players, and the financial consequences of thesemoves. If these assumptions are seriously violated, inparticular because the number of players is too large,the number of decision variables is too broad inscope, or the environment is not predictable, othermodels are best suited to analyze rivalry and compe-tition dynamics.
Scenarios, Simulations, and System Dynamic ModelingWhen the environment is uncertain and only a fewdecision variables are critical, scenarios, simulations,and systems dynamics modeling can help managersto make some hypotheses and forecasts about thefuture and identify alternative strategies. Because ofthe uncertainty and complexity of the environment,these models focus more on the probable long-termevolution of the environmental variables than on theshort-term moves of the players. Complex systemsare inherently unpredictable and fundamentallyunknowable, therefore models should highlight theimplications of non-linear relationships andcoexisting paradoxical forces (Lengnick-Hall andWolff, 1999). Scenarios, simulations, and systemsanalysis are all based on the study of interactionbetween a limited number of known variables in situ-ations of uncertainty, interdependence, and com-plexity. Scenarios are focused on the descriptions of
THE RIVALRY MATRIX: UNDERSTANDING RIVALRY AND COMPETITIVE DYNAMICS
fundamentally different futures presented in coher-ent script-like or narrative fashion (Schoemaker,1993), simulations are focused on the consequences ofdifferent alternative strategies, and systems models(Warren, 1995) use feedback loops and networks ofcause–effect relationships between factors to analyzethe interaction between the variables under study. Toanalyze rivalry and competitive dynamics, thesethree different models may evaluate the influence ofenvironmental variables on competitors’ moves aswell as the influence of competitors’ moves on thefirm’s strategy.
WarfareWhen the number of strategic decision variablesbecomes too large, but the environment is predictable(stable), warfare models are best suited to analyzerivalry and competition dynamics. Warfare or guer-rilla logics (Kotler and Achrol, 1984; Lengnick-Halland Wolff, 1999; Ries and Trout, 1986) are built onthe analogy between business and military strategiesand draw upon the work of military strategists likeSun-Tzu (1963, 1993) or von Clausewitz (1911). Thelogic behind these models is that one firm will out-perform another if it is more adept at rapidly andrepeatedly disrupting the current situation to createan unprecedented and unconventional basis for com-peting (Lengnick-Hall and Wolff, 1999).
In competitive strategy, models like those of Karnaniand Wernerfelt (1985), Chen and his colleagues(Chen, 1996; Chen and MacMillan, 1992; Smith et al.,1991), or D’Aveni (1994) may help to attribute someprobabilities to the different possible moves of thecompetitors. With an environment that is held con-stant, these models, therefore, focus on the moves ofthe players.
Karnani and Wernerfelt’s model of multipoint com-petition describes a situation where firms competeagainst each other simultaneously in several markets(Karnani and Wernerfelt, 1985). Their model dis-cusses conditions which (1) motivate a firm to enter,or attack, another firm’s market; (2) motivate parti-cular responses from the attacked firm: and (3) pro-duce a new market equilibrium as a result of eachfirm’s responses. It is clear that competing in multipleindustries or markets gives firms more competitiveoptions (Smith and Wilson, 1995). And, in such situ-ations, resource allocations can reconfigure the com-petitive context (McGrath et al., 1998) and modify thecompetitive structure that influences firms’ actions(Baum and Korn, 1996).
Chen and his colleagues (Chen, 1996; Chen and Mac-Millan, 1992; Smith et al., 1991) attempt to model theprobability of a response by a competitor to a com-petitive action. The probability is based on the extentto which the competitor is dependent on the parti-cular market in which the action was taken. Inaddition, this probability is based on the type ofaction, the reputation of the firm taking the strategic
European Management Journal Vol 18 No 6 December 2000 621
action (the expectation of success), and the resourcesavailable to the competitor contemplating a response.
D’Aveni’s (1994) model, on the other hand, charts theevolution of industries through a series of competi-tive moves and countermoves that he labels ‘dynamicstrategic interactions.’ His model examines thesedynamic strategic interactions in four arenas of com-petition, each based on a different competitiveadvantage: (1) cost and quality competition, (2) tim-ing and know-how competition, (3) competition forthe creation and destruction of strongholds, and (4)competition for the accumulation and neutralizationof ‘deep pockets’. As firms have made moves andcountermoves in each arena, they have sought todestroy, neutralize, or render obsolete their rivals’competitive advantages. This model may, therefore,be used to clarify a firm’s next move or to anticipatethe next moves of competitors (D’Aveni, 1994).
FrameworksEach of the models presented above abstracts thecomplexity of competition to isolate a few key vari-ables whose interactions are examined in depth. Thenormative significance of each model depends on thefit between its assumptions and reality. No onemodel embodies or even approaches embodying allthe variables of interest, and hence the applicabilityof any model’s findings are almost inevitably restric-ted to a small subgroup of firms or industries whosecharacteristics fit the model’s assumptions (Porter,1991).
In an uncertain environment where many decisionvariables are involved, there is too much complexityto rigorously model competition. In this situation, itis better to focus on the variables and to use a frame-work to identify the more critical ones and theirinteractions (Porter, 1980; Thomas, 1984). A frame-work encompasses many variables and seeks to cap-ture much of the complexity of actual competition.The logic embodied in frameworks is contained inthe choice of included variables, the way variablesare organized, the interactions among the variables,and the way in which alternative patterns of vari-ables and company choices affect outcomes (Porter,1991). In such ill-structured decision problems, theuse of a framework which emphasizes the dialoguebetween different points of view can help managersto structure and solve the problem (Thomas, 1984).
One of the most used frameworks in the strategyfield is Porter’s five-forces framework. The five forcesframework suggests that an industry’s potentialprofitability is a function of interactions among fiveforces: suppliers, buyers, competitive rivalry amongfirms currently in the industry, product substitutes,and potential entrants to the industry (Porter, 1980).Using this framework, a firm is challenged to under-stand an industry’s profit potential and the strategythat should be implemented to establish a defensiblecompetitive position, given the industry’s structural

THE RIVALRY MATRIX: UNDERSTANDING RIVALRY AND COMPETITIVE DYNAMICS
characteristics. Typically, this framework suggeststhat firms may obtain a competitive advantagethrough such generic strategies as manufacturingstandardized products at costs below those of com-petitors, through product differentiation, or carefulfocus on narrow industry segments.
Thomas (1984) also proposed an alternative decisionanalysis framework that can help to develop anunderstanding of complex problems. This frameworkviews decision analysis as a vehicle for generatingdialogue about problem assumptions, formulation,and available options, rather than as a means for thedetermination of an optimal competitive strategy.Thomas’ (1984) framework focuses attention on (1)the recognition of the existence of a problem or a setof interrelated problems important enough to requiresome form of analysis; (2) the definition of the prob-lem area in such a way that the systems modelincludes all problem elements necessary to obtain ameaningful grasp of the situation; (3) the awarenessof the hierarchy of multiple goals and objectives, andthe need to specify value trade-offs; (4) the creativeprocess of generation of alternative courses of action;and (5) the identification of the complex, feedbackinterrelationships among problem elements.
Use of the Rivalry Matrix: Some CaseExamples
In this section, we present a set of case examplesillustrating each of the four cells of the rivalry matrix.In these case examples, we focus on the descriptionof the competitive situation and on how the specifictools are used to handle the particular problemdescribed.
Game Theoretic Models
When the environment is predictable and only a fewdecision variables are involved, all the assumptionsof game theory are validated. In particular, it is poss-ible to identify all the possible moves of each of theplayers and to identify the financial consequences ofthese moves. Therefore, in this situation game theor-etic thinking allows decision-makers to identify theoptimal strategic move(s) for each of the players. Weillustrate this approach using examples from IntelCorp., the rivalry between Polaroid and Kodak, andfrom the ready-to-eat breakfast cereal industry.
Intel’s Dilemma: A Prisoner’s Dilemma GameIn a recent article (Business Week, 1999b), thedescription of the rivalry between Intel andAdvanced Micro Devices Inc. (AMD) has some simi-larities with the classic game of prisoner’s dilemma(Luce and Raiffa, 1957; Rapoport and Chammah,1965). It is fruitful to first briefly examine the struc-
European Management Journal Vol 18 No 6 December 2000622
ture of the prisoner’s dilemma and then to highlightthe similarities.
In this game, two players are suspected of a hypotheticalmajor crime, such as murder. They are imprisoned andheld incommunicado, so each must decide whether tocooperate or to defect, without knowing what the otherwill do. The authorities possess evidence to secure convic-tion on only a minor charge, such as illegal possession ofweapons. If neither prisoner squeals, both will draw a lightsentence on the minor charge , this state is called a mutualcooperation (MC) payoff. If one prisoner squeals and theother stonewalls, the squealer will go free (unilateral defec-tion, UD), and the stonewaller, or ‘sucker,’ will draw a veryheavy sentence (unilateral cooperation, UC). If both squeal,both will draw a moderate sentence (mutual defection,MD).
Each prisoner’s preference ordering is UD > MC > MD >UC. Each prisoner will be better off squealing than stone-walling, no matter what his partner chooses to do, becauseUD > MC (the temptation of cheating) and MD > UC (thefear of being cheated upon). But if both defect, both doworse than if both had cooperated (MC > MD). Hence thedilemma. (Parkhe, 1993, pp. 796–797)
Figure 2 shows the pay-off matrix of the prisoner’sdilemma.
The following quote describes Intel’s situation.
Intel’s aggressive marketing and price cuts have deliveredbig share gains, but the impact on its rivals has been sosevere that some are now struggling to survive. For anti-trust enforcers who continue to watch over Intel’s practicessince it settled a Federal Trade Commission (FTC) suit inMarch 1999, the failure of one its competitors would set offbells. At the end of 1998, Intel had 75 per cent of the PCprocessor market, down from 86 per cent the year before,as a result of gains by rivals Advanced Micro Devices Inc.(AMD) and National Semiconductor Corp. (National),whose low-cost knockoffs of Intel’s Pentium chip were get-ting a huge chunk of the hot sub-$1000 PC business.Although Intel still dominated the chip market and had alock on the upper-end of the business, that wasn’t enough.[…] Intel responded by cutting the price of its low-endCeleron chips in half and courting PC makers with dis-counted packages of PC parts. Since February 1999, USretail sales of sub-$1000 Celeron PCs have surged 50 percent. Rivals, meanwhile, are reeling. On May 5, Nationaldropped out of the PC processor business, saying itcouldn’t make a profit in it. AMD has lost 10 points of mar-ket share in cheap PCs. Intel can be superaggressive on
Figure 2 Pay-Off Matrix for the Prisoner’s Dilemma

THE RIVALRY MATRIX: UNDERSTANDING RIVALRY AND COMPETITIVE DYNAMICS
price in Celerons because it generates big profits on otherlines. Nearly all of Intel’s expected $7.7 billion profit thisyear will come from processors used in computers costing$1200 or more. What Intel is doing is perfectly legal. Butantitrust experts say Intel could run afoul of regulators ifthey found that its actions were meant to protect a mon-opoly through predatory pricing. If for no other reasonthan to keep the FTC at bay, Intel needs AMD and otherrivals to stick around. If AMD collapsed, the FTC wouldsurely react (Source: Business Week, 1999b).
For Intel, the dilemma is the following, it can pursueits aggressive marketing and price cuts to gain mar-ket share (that is a UD situation), but if AMD leavesthe market, the FTC will punish Intel for antitrustpractices (a MD situation). Therefore, Intel would bebetter to try to keep AMD in the market even if itsmarket share would suffer (an MC situation). Figure3 shows the pay-off matrix for Intel and AMD.
Polaroid-KodakAnother example of the prisoner’s dilemma is thecompetition between Polaroid and Eastman Kodak ininstant photography in 1976 and 1977. Prior to 1976Polaroid had faced no serious competition in instantphotography. In 1974 Kodak for the first timerevealed that it was working on its own system ofinstant film and cameras. On April 20, 1976, Kodakannounced that it would challenge Polaroid’s 28-yearmonopoly of the instant photographic field (HBSCase 376-266, 1984; Bettis and Weeks, 1987). At thattime, the competitive environment was characterizedby a limited number of competitors and innovationwas incremental and regular in nature thus makingthe environment quite predictable. The number ofdecision variables was also limited: Kodak couldeither enter the instant camera market (fight) or not(detente). Then, Polaroid could either cut its prices(fight) or not (detente) and Kodak could either chooseto follow Polaroid (fight) or not (detente). This isclearly a situation where game theoretic modelsapply. The decision tree presented in Figure 4 showsthe different alternatives for Kodak and Polaroid.
In this situation, a sequential model with repeatedmoves could have helped Kodak to anticipate whatPolaroid would do and then based on this infor-mation determine an optimal decision path. Themain rule of competitive strategy in a situation ofsequential moves has been described by Dixit and
Figure 3 Pay-Off Matrix for Intel and AMD
European Management Journal Vol 18 No 6 December 2000 623
Figure 4 Decision Tree for Kodak’s Entry into theInstant Camera Market
Nalebuff (1991) and can be summarized as follows:look ahead and reason back. For Kodak, that meansit must think about the possible reactions of Polaroidto its entry into the instant camera market and howto react to those possible moves by Polaroid. By ana-lyzing the situation in this manner, Kodak could havepredicted the fact that Polaroid would cut its pricesto maintain its market share and highlight the necess-ity of Kodak’s own subsequent price cuts. It wasanother example of a prisoner’s dilemma (the pay-off matrix adapted from Bettis and Weeks (1987) ispresented in Figure 5). All the elements of a pricewar existed. At that time, Kodak clearly dominatedthe US conventional photographic market with mar-ket shares of 90 per cent for film and 85 per cent forcameras. Protected by its patents, Polaroid earnedmonopoly profits in the instant camera market. ByApril 1976, the Colorpack system contributed at least95 per cent to Polaroid’s earnings, therefore Kodak’sentry into the instant camera market was clearly athreat for Polaroid’s market share and profitability.Therefore, it was predictable that Polaroid wouldreact aggressively to protect its market share.
Figure 5 Pay-Off Matrix for Polaroid and Kodak

THE RIVALRY MATRIX: UNDERSTANDING RIVALRY AND COMPETITIVE DYNAMICS
If Kodak had used a game theoretic model to analyzethe situation, it is likely that it would not haveentered the instant camera market and the sub-sequent price war would have been avoided. The fol-lowing quote presents Polaroid and Kodak’s movesafter Kodak’s entry.
‘On April 20, 1976, Eastman Kodak Company announcedthat it would challenge Polaroid Corporation’s 28-yearmonopoly of the instant photographic field.’ (HBS Case376-266, 1984). The entry of Kodak into the instant cameramarket starts a ten-year price war. ‘For ten years, between1976 and 1986, Kodak and Polaroid battled in the instantcamera market essentially by price-cutting. Polaroid’s no-frills Pronto, for example, was priced at $79.95 in July 1976.The price fell to $59 in February 1977 and $39.95 by April1977. While there were modest product changes along theway, it is fair to say that most of the price reductionsappeared to be an aggressive response by Polaroid to theKodak entry. Kodak was similarly aggressive in its prices.Its instant camera price fell by over $20 during this turbu-lent early year of rivalry, so that it too offered a $39.95instant camera. Rebates to dealers by Kodak reduced theprice of the camera even further to a point at which out-siders speculated that the firm might be losing money inthis market.’ (Oster, 1999, p. 282)
Entry Deterrence in the Ready-to-Eat Breakfast CerealIndustryEntry deterrence is another situation where a sequen-tial-game framework may be used to analyze productstrategy in a competitive marketplace. The case of theready-to-eat (RTE) breakfast cereal industry(Schmalensee, 1978; HBS Case 9-795-191, 1997; HBSCase 9-796-122, 1997) is a good example of such agame, because the environment is quite predictableand the number of decision variables is limited.
In this situation, entry into a market normally occursnot all at once, but one or two firms at a time. As anew firm enters, it will position itself by looking atits costs, at consumer preferences, and at the positionof other firms already in the market. It may also beimportant for firms to take into account the likelyfuture product behavior of current and potential riv-als in market. Firms will wish to pursue product pos-itions that are least destabilizing to the existingindustry and most defensible against entry threats inthe future by filling the gaps in the product space(Schmalensee, 1978; Gruca and Sudharshan, 1995). Insum, a firm will take into consideration what itbelieves will be the final shape of the market in mak-ing its own product-line choices.
In the RTE breakfast cereal industry, between 1950and 1972, the six leading producers introduced over80 brands (Schmalensee, 1978). During the same per-iod of time, there was no significant firm entry intothe market. The product strategy of the leading pro-ducers in the RTE breakfast cereal industry may bedescribed by a competitive game in which each firmpositions its brands in market space so that newlaunches by insiders cannot erode its profits, and
European Management Journal Vol 18 No 6 December 2000624
therefore, entry by price-matching outsiders isdeterred. More formally, the game may be describedas follows: RTE cereals provide different attributesrelevant to consumers (sweetness, protein content,shape, grain base, vitamin content, fiber content, andcrunchiness, for instance). These different attributesdefine a multi-dimensional space in which cerealbrands are positioned. The strategy of the existingfirms in the RTE cereal industry is to continuallylaunch new brands to occupy all the cells of thespace. There are only two rules for the choice of theposition of a new brand: (i) The new brand shouldbe positioned as far away as possible from the pos-ition of any other existing brands to avoid price com-petition and cannibalization of the existing brands ofthe firm. (ii) The new brand should also be positionedto maximize the space occupied by the brands of thesame firm. The brand launches stop when all the cellsare occupied by one and only one brand. For simpli-fication, the product map of Figure 6, only shows twodimensions: Sweetness and Fiber content. Figure 6(a)shows an example of the possible first few launchesfor two competitive firms A and B.
Moreover, a pattern of rivalry focusing solely onadvertising, launching new brands and avoidingprice competition seems likely to be self-reinforcingonce established. The logic of the pattern follows. Themore effectively the established brands are differen-tiated, the less incentive any seller would have toengage in price competition. The less the price com-petition among established sellers, the greater thetypical price—cost margin, and the greater the incen-tive to advertise. To the extent that advertising out-lays resemble fixed costs, increased advertising inten-sity increases the asymmetry between the positionsof potential entrants and established sellers. The lat-ter’s brands will be kept on the market as long asvariable costs are covered, while an entrant will onlylaunch if it can expect to cover total costs. The greaterthe difference between variable and total cost, then,the less attractive aggressive price-cutting entryappears to the new firm (Schmalensee, 1978).
This game was profitable for the players, as long asall followed the same rules. However, in April 1994after a drop in its stock price, General Mills decidedto change the rules of the game and announced itplanned to cut $175 million out of its trade pro-motions and couponing budget, and simultaneouslyto reduce price. This creates a new game similar tothe one between Polaroid and Kodak in which thedecisions of the other players are to follow GeneralMills strategy and reduce prices to maintain marketshare or to continue with the old strategy of brandproliferation. If they decide to cut prices a destructiveprice competition may develop like that describedearlier in the instant camera industry [cf. Figure6(b)] — (and ‘private-label’ producers may be forcedto exit the industry).
The previous examples show that game theoretic

THE RIVALRY MATRIX: UNDERSTANDING RIVALRY AND COMPETITIVE DYNAMICS
Figure 6 (a) Product Map for Ready-to-Eat Cereals; (b)Decision Tree for the Ready-to-Eat Cereal
modeling may be applied to various competitive situ-ations, such as market entry, product positioning,and pricing strategy. However, such models are lim-ited to situations where the environment is predict-able — due for example to a limited number of com-petitors — and where the number of decisionvariables is also limited. When the environmentbecomes less predictable, other models such as simul-ation, scenarios, or systems are more appropriate. Wepresent examples of the use of such models in thenext section.
Simulation, Scenarios, and System DynamicsModels
When the environment is uncertain and only a fewdecision variables are considered to be critical
European Management Journal Vol 18 No 6 December 2000 625
elements, scenario models, simulation models, andsystem dynamics modeling can help managers tomake some hypotheses and forecasts about the futureand identify alternative strategies. These models aremore focused on the probable long-term evolution ofthe environment and the long-term interactionsbetween strategies and environment than on theshort-term moves of the players.
The Capacity Expansion Process in the Corn WetMilling IndustryThe case of the corn wet milling industry presentedby Porter and Spence (1982), is a good example of anindustry with a few key decision variables and anunpredictable environment. Therefore, since it is dif-ficult to predict the evolution of the environment,Porter and Spence simulated different alternativefuture scenarios and then tested for the coherence ofthese scenarios. The following quote describes thecompetitive situation in the corn wet milling indus-try.
The corn wet milling industry had been a stable industryfor decades, dominated by Corn Products Company andconsisting of approximately a dozen firms. Competition inthe industry historically could be described as ‘gentle-manly’. [...] In 1972, however, this old industry was con-fronted by a potentially revolutionary development — thecommercialization of high fructose corn syrup (HFCS).HFCS, a commodity product, is a corn syrup very high infructose, or sweetness. [...] HFCS is a substitute for sugarand is intrinsically somewhat cheaper to produce thansugar. If HFCS were to replace a significant proportion ofsugar, this new product would approximately double thesize of the corn wet milling industry. Thus, the exogenousshock of HFCS’s commercialization in 1972, [...] confrontedevery firm in the industry with an important decisionabout capacity to produce the new product. [...] Thecapacity decision not only involves high stakes, but is alsofraught with subtleties. In the presence of lead times andlumpiness, it requires expectations about future demand.It also involves the oligopolistic interdependence problem,since the capacity decisions of competitors over the plan-ning horizon will determine the profitability of decisionsby a single firm. (Source: Porter and Spence, 1982)
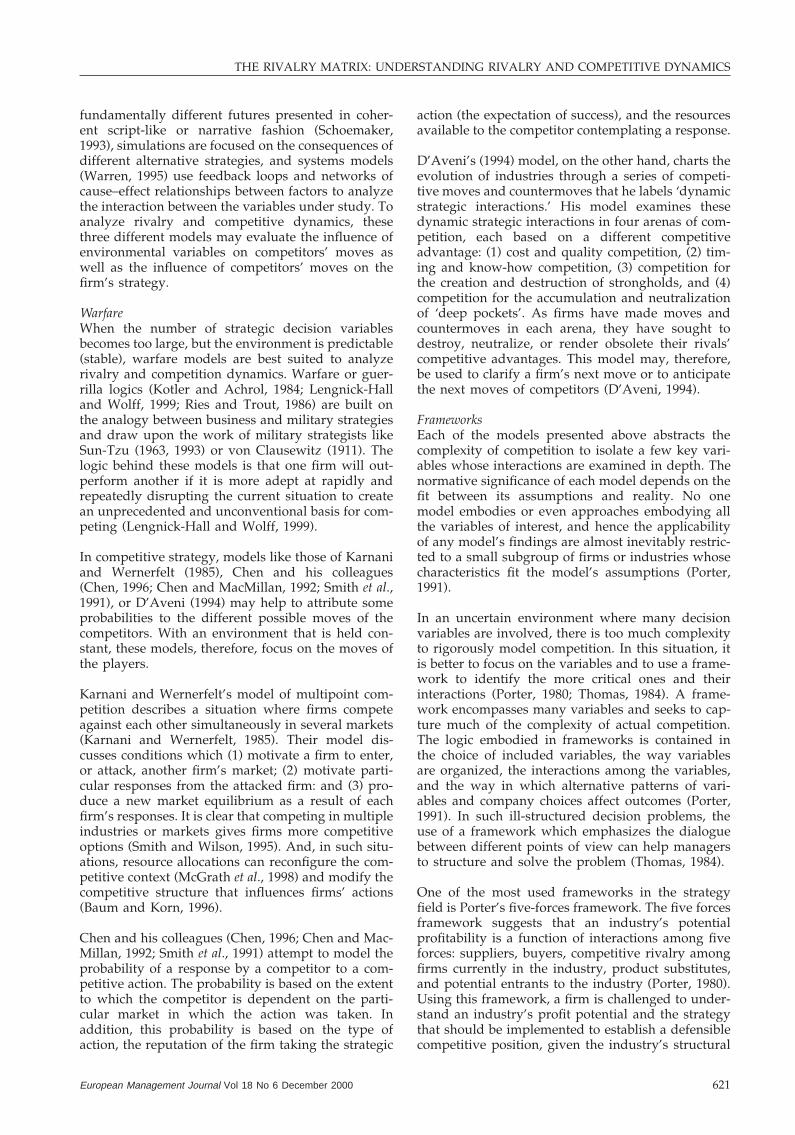
Porter and Spence’s (1982) simulation model is basedon the following broad structure. For the individualfirm, the profitability of its operations and its HFCScapacity decisions are determined by two sets of fac-tors: (a) the evolution of demand and sugar prices,the latter being a predominant influence on HFCSprices, and (b) the capacity expansion decisions of itscompetitors. The demand-related factors are subjectto uncertainty and are not independent of capacityexpansion decisions. The decisions of competitorsand the implications of those decisions for industrycapacity are to be predicted. The ingredients in themodel can be read as presented in Figure 7.
According to Porter (1980), the steps in Figure 7 mustbe analyzed in an interactive fashion. The first stepis to determine the realistic options available to thefirm in adding capacity. Having developed theoptions, the firm then must make predictions about
THE RIVALRY MATRIX: UNDERSTANDING RIVALRY AND COMPETITIVE DYNAMICS
Figure 7 Element of the Capacity Expansion Decision. Source: Adapted from Porter (1980)
future demand, input costs, and technology. The firmmust next forecast how and when each and every oneof its competitors will add capacity. The next stepin the analysis is adding competitors’ and the firm’sbehavior to yield aggregate industry capacity andindividual market shares, which can be balancedagainst expected demand. The whole process mustbe scrutinized for inconsistencies. If the result of thepredictions is that one competitor fares poorly by notadding capacity, for example, the analysis may haveto be adjusted to allow that competitor to see theerror of its ways and add capacity late (Porter, 1980).
The degree of uncertainty about the future is one ofthe central determinants, and drivers of the way theprocess proceeds. The degree of uncertainty aboutthe future is also the characteristic, which distingu-ishes this simulation model from a classical gametheoretical model. The value of the simulation modelin this instance is to describe and evaluate a range ofalternative options about capacity in the context ofa somewhat uncertain environment with competitivecountermoves not always easy to predict.
Scenarios for Apple ComputerIn uncertain situations, to generate a firm’s strategicvision, managers must understand a highly complexset of interacting factors, including the industry’s his-tory and structure, the firm’s and its competition’sresources and core capabilities, and the various stra-tegic segments in which the firm competes. Scenarioplanning is a tool that may help managers in thistask. The basic idea in scenario construction is toidentify existing trends and key uncertainties andcombine them into a few future worlds that areinternally consistent and within the realm of thepossible. The purpose of these scenarios is not tocover all eventualities but to discover the boundariesof future outcomes (Schoemaker, 1991).
In uncertain situations where there is only a limited
European Management Journal Vol 18 No 6 December 2000626
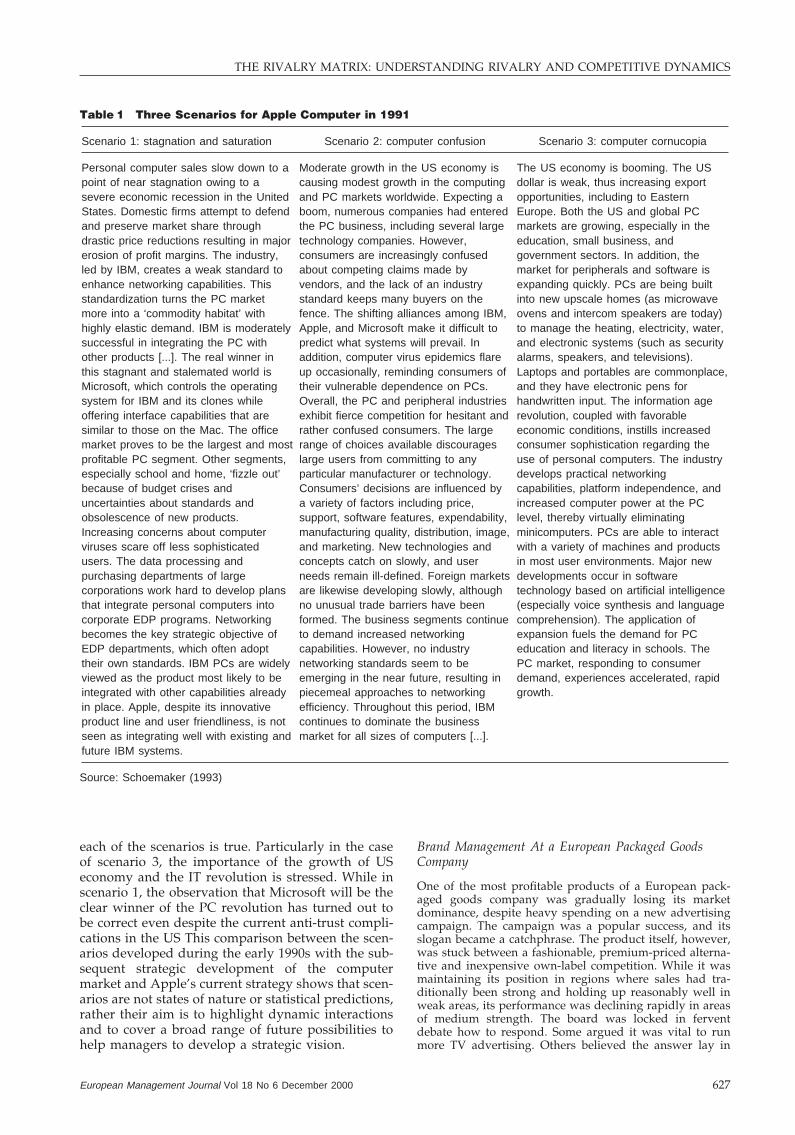
set of decision variables, scenario planning method-ologies improve the decision-making process againsta background of possible future environments. Thefollowing example presents scenarios developed byPaul Schoemaker (1993) in relation to Apple Com-puter. The first step in developing scenarios is todefine the general scope, time-frame and key issues.In the case of Apple Computer, the outlook was fiveyears, and the scope international. Key issuesincluded minicomputers and PCs as well as hard-ware and software. Following that analysis, futuretrends and uncertainties in the marketplace wereidentified and their interactions studied. Then, thetrends and uncertainties were combined into intern-ally consistent, coherent, and wide-ranging scenarios.Table 1 presents three different scenarios for AppleComputer in 1991.
Based on these scenarios a competitive analysis of theindustry can be conducted, and the core capabilitiesof the firm and of its competitors may be analyzed.Then, strategic options may be identified. In the caseof Apple, Schoemaker (1993) identified four strategicvisions: (1) remaining a leading-edge hardwaremanufacturer, (2) creating integrated hardware–software products, (3) attacking IBM head on in thebusiness market; and (4) becoming a consumer elec-tronic company. While this vision may seem quitegeneral, it was significantly different from the visionof Apple’s major competitors and links directly withApple’s core capabilities. Contrast these threevisions: Apple focuses on innovative electronic con-sumer products using computers. IBM emphasizesdistribution and service for business using net-worked computers. Clones stress quick imitation,high quality, and low prices (but not innovation)(Schoemaker, 1993).
It is also informative to compare the current state ofthe PC market and Apple’s market positioning withSchoemaker’s scenarios. What is clear is that part of
THE RIVALRY MATRIX: UNDERSTANDING RIVALRY AND COMPETITIVE DYNAMICS
Table 1 Three Scenarios for Apple Computer in 1991
Scenario 1: stagnation and saturation Scenario 2: computer confusion Scenario 3: computer cornucopia
Personal computer sales slow down to a Moderate growth in the US economy is The US economy is booming. The USpoint of near stagnation owing to a causing modest growth in the computing dollar is weak, thus increasing exportsevere economic recession in the United and PC markets worldwide. Expecting a opportunities, including to EasternStates. Domestic firms attempt to defend boom, numerous companies had entered Europe. Both the US and global PCand preserve market share through the PC business, including several large markets are growing, especially in thedrastic price reductions resulting in major technology companies. However, education, small business, anderosion of profit margins. The industry, consumers are increasingly confused government sectors. In addition, theled by IBM, creates a weak standard to about competing claims made by market for peripherals and software isenhance networking capabilities. This vendors, and the lack of an industry expanding quickly. PCs are being builtstandardization turns the PC market standard keeps many buyers on the into new upscale homes (as microwavemore into a ‘commodity habitat’ with fence. The shifting alliances among IBM, ovens and intercom speakers are today)highly elastic demand. IBM is moderately Apple, and Microsoft make it difficult to to manage the heating, electricity, water,successful in integrating the PC with predict what systems will prevail. In and electronic systems (such as securityother products [...]. The real winner in addition, computer virus epidemics flare alarms, speakers, and televisions).this stagnant and stalemated world is up occasionally, reminding consumers of Laptops and portables are commonplace,Microsoft, which controls the operating their vulnerable dependence on PCs. and they have electronic pens forsystem for IBM and its clones while Overall, the PC and peripheral industries handwritten input. The information ageoffering interface capabilities that are exhibit fierce competition for hesitant and revolution, coupled with favorablesimilar to those on the Mac. The office rather confused consumers. The large economic conditions, instills increasedmarket proves to be the largest and most range of choices available discourages consumer sophistication regarding theprofitable PC segment. Other segments, large users from committing to any use of personal computers. The industryespecially school and home, ‘fizzle out’ particular manufacturer or technology. develops practical networkingbecause of budget crises and Consumers’ decisions are influenced by capabilities, platform independence, anduncertainties about standards and a variety of factors including price, increased computer power at the PCobsolescence of new products. support, software features, expendability, level, thereby virtually eliminatingIncreasing concerns about computer manufacturing quality, distribution, image, minicomputers. PCs are able to interactviruses scare off less sophisticated and marketing. New technologies and with a variety of machines and productsusers. The data processing and concepts catch on slowly, and user in most user environments. Major newpurchasing departments of large needs remain ill-defined. Foreign markets developments occur in softwarecorporations work hard to develop plans are likewise developing slowly, although technology based on artificial intelligencethat integrate personal computers into no unusual trade barriers have been (especially voice synthesis and languagecorporate EDP programs. Networking formed. The business segments continue comprehension). The application ofbecomes the key strategic objective of to demand increased networking expansion fuels the demand for PCEDP departments, which often adopt capabilities. However, no industry education and literacy in schools. Thetheir own standards. IBM PCs are widely networking standards seem to be PC market, responding to consumerviewed as the product most likely to be emerging in the near future, resulting in demand, experiences accelerated, rapidintegrated with other capabilities already piecemeal approaches to networking growth.in place. Apple, despite its innovative efficiency. Throughout this period, IBMproduct line and user friendliness, is not continues to dominate the businessseen as integrating well with existing and market for all sizes of computers [...].future IBM systems.
Source: Schoemaker (1993)
each of the scenarios is true. Particularly in the caseof scenario 3, the importance of the growth of USeconomy and the IT revolution is stressed. While inscenario 1, the observation that Microsoft will be theclear winner of the PC revolution has turned out tobe correct even despite the current anti-trust compli-cations in the US This comparison between the scen-arios developed during the early 1990s with the sub-sequent strategic development of the computermarket and Apple’s current strategy shows that scen-arios are not states of nature or statistical predictions,rather their aim is to highlight dynamic interactionsand to cover a broad range of future possibilities tohelp managers to develop a strategic vision.
European Management Journal Vol 18 No 6 December 2000 627
Brand Management At a European Packaged GoodsCompany
One of the most profitable products of a European pack-aged goods company was gradually losing its marketdominance, despite heavy spending on a new advertisingcampaign. The campaign was a popular success, and itsslogan became a catchphrase. The product itself, however,was stuck between a fashionable, premium-priced alterna-tive and inexpensive own-label competition. While it wasmaintaining its position in regions where sales had tra-ditionally been strong and holding up reasonably well inweak areas, its performance was declining rapidly in areasof medium strength. The board was locked in ferventdebate how to respond. Some argued it was vital to runmore TV advertising. Others believed the answer lay in
THE RIVALRY MATRIX: UNDERSTANDING RIVALRY AND COMPETITIVE DYNAMICS
promotional activity. A third group maintained that thebest strategy was to cut back on investment and either milkthe brand for cash or sell it off. (Desmet et al., 1998, p. 108).
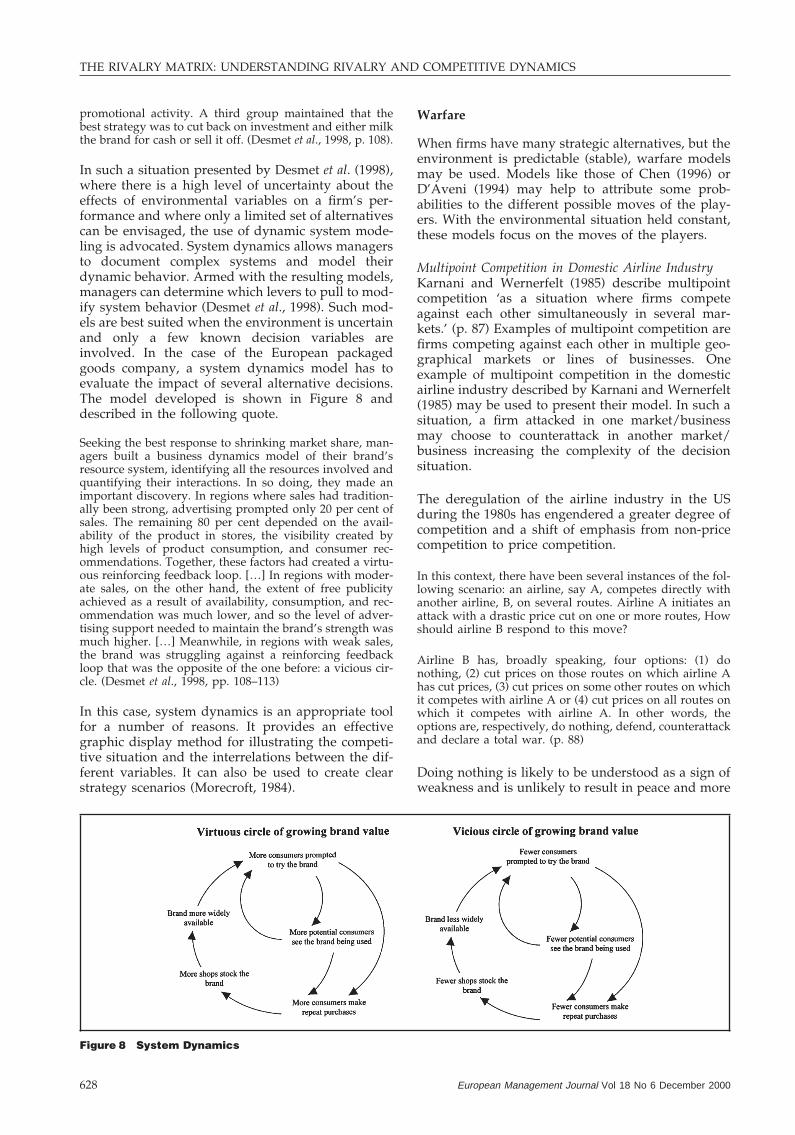
In such a situation presented by Desmet et al. (1998),where there is a high level of uncertainty about theeffects of environmental variables on a firm’s per-formance and where only a limited set of alternativescan be envisaged, the use of dynamic system mode-ling is advocated. System dynamics allows managersto document complex systems and model theirdynamic behavior. Armed with the resulting models,managers can determine which levers to pull to mod-ify system behavior (Desmet et al., 1998). Such mod-els are best suited when the environment is uncertainand only a few known decision variables areinvolved. In the case of the European packagedgoods company, a system dynamics model has toevaluate the impact of several alternative decisions.The model developed is shown in Figure 8 anddescribed in the following quote.
Seeking the best response to shrinking market share, man-agers built a business dynamics model of their brand’sresource system, identifying all the resources involved andquantifying their interactions. In so doing, they made animportant discovery. In regions where sales had tradition-ally been strong, advertising prompted only 20 per cent ofsales. The remaining 80 per cent depended on the avail-ability of the product in stores, the visibility created byhigh levels of product consumption, and consumer rec-ommendations. Together, these factors had created a virtu-ous reinforcing feedback loop. […] In regions with moder-ate sales, on the other hand, the extent of free publicityachieved as a result of availability, consumption, and rec-ommendation was much lower, and so the level of adver-tising support needed to maintain the brand’s strength wasmuch higher. […] Meanwhile, in regions with weak sales,the brand was struggling against a reinforcing feedbackloop that was the opposite of the one before: a vicious cir-cle. (Desmet et al., 1998, pp. 108–113)
In this case, system dynamics is an appropriate toolfor a number of reasons. It provides an effectivegraphic display method for illustrating the competi-tive situation and the interrelations between the dif-ferent variables. It can also be used to create clearstrategy scenarios (Morecroft, 1984).
Figure 8 System Dynamics
European Management Journal Vol 18 No 6 December 2000628
Warfare
When firms have many strategic alternatives, but theenvironment is predictable (stable), warfare modelsmay be used. Models like those of Chen (1996) orD’Aveni (1994) may help to attribute some prob-abilities to the different possible moves of the play-ers. With the environmental situation held constant,these models focus on the moves of the players.
Multipoint Competition in Domestic Airline IndustryKarnani and Wernerfelt (1985) describe multipointcompetition ‘as a situation where firms competeagainst each other simultaneously in several mar-kets.’ (p. 87) Examples of multipoint competition arefirms competing against each other in multiple geo-graphical markets or lines of businesses. Oneexample of multipoint competition in the domesticairline industry described by Karnani and Wernerfelt(1985) may be used to present their model. In such asituation, a firm attacked in one market/businessmay choose to counterattack in another market/business increasing the complexity of the decisionsituation.
The deregulation of the airline industry in the USduring the 1980s has engendered a greater degree ofcompetition and a shift of emphasis from non-pricecompetition to price competition.
In this context, there have been several instances of the fol-lowing scenario: an airline, say A, competes directly withanother airline, B, on several routes. Airline A initiates anattack with a drastic price cut on one or more routes, Howshould airline B respond to this move?
Airline B has, broadly speaking, four options: (1) donothing, (2) cut prices on those routes on which airline Ahas cut prices, (3) cut prices on some other routes on whichit competes with airline A or (4) cut prices on all routes onwhich it competes with airline A. In other words, theoptions are, respectively, do nothing, defend, counterattackand declare a total war. (p. 88)
Doing nothing is likely to be understood as a sign ofweakness and is unlikely to result in peace and more

THE RIVALRY MATRIX: UNDERSTANDING RIVALRY AND COMPETITIVE DYNAMICS
likely to result in a loss of competitive position forairline B. Declaring a total war can be dangerous andvery costly to both airlines, leaving them vulnerableto attacks from other firms. An airline’s profitabilitydepends more on its market share of the routes itcompetes on than on its market share of the airlineindustry as a whole (Fruhan, 1972). This implies thata price cut which is not directly countered is likelyto lead to a loss. Thus, the best option for airline Bis probably to defend directly its competitive positionon the routes attacked by airline A. Such option islikely to stabilize in what Karnani and Wernerfelt(1985) call a ‘limited war’ equilibrium in which thefighting in ‘contained within small isolated regions.’Another solution for airline B is to counterattack bycutting prices on some other routes on which it com-petes with airline A. With this option airline B signalsto airline A that it is ready for a total war if airline Adoes not adopt a less aggressive posture. This wouldresult in what Karnani and Wernerfelt call a ‘mutualfoothold’ equilibrium in which each firm maintainsa foothold in the other firm’s market and thus has a‘stick’ with which to discipline the other firm. Thesedifferent options and their respective equilibria arepresented in Table 2.
Karnani and Wernerfelt (1985) argue that when thedefender has reasonable alternatives, a mutual foot-hold equilibrium is a likely to occur as the result of anattack by a competitor, because doing nothing wouldrepresent a sign of weakness and encourage theattacker to increase the competitive pressure. A totalwar is unlikely to occur because of the threat of mut-ual destruction. Also if an attack strategy offers bigfirst mover advantages, a mutual foothold, ratherthan total peace, is effectively a stable equilibrium.
Coke–Pepsi RivalryThe soft drink industry is a good example of a situ-ation with a stable environment (mature industry,oligopolistic competition) where many decision vari-ables need to be integrated. In this industry the longlasting war between Coke and Pepsi described byFoley (HBS Case 9-794-055, 1995) and D’Aveni (1994)may be used as an example of warfare competitionor hypercompetition. According to D’Aveni (1994),hypercompetition results from the dynamics of stra-tegic manoeuvering among global and innovative
Table 2 Overview of Response in Karnani and Wernerfelt Model
Response Illustrative type of action Expected equilibrium Expected stability
Do nothing No price change Implicit UnstableDefend Match entrant’s price, Limited war Stable
respondent’s marketCounterattack Match entrant’s price in one of Mutual foothold Stable
entrant’s marketsTotal war Underprice entrant in more Victory or mutual destruction Unstable
than one market
Adapted from Karnani and Wernerfelt (1985) by Smith and Wilson (1995)
European Management Journal Vol 18 No 6 December 2000 629
combatants. It is a condition of rapidly escalatingcompetition based on price–quality positioning, com-petition to create new know-how and establish first-mover advantages, competition to protect or invadeestablished products or geographic markets, andcompetition based on deep pockets and the creationof even deeper pocketed alliances. This model can beused to describe the rivalry between Coke and Pepsiand their different strategic moves.
Coke and Pepsi have been competitors for nearly a century.But it has only been in recent decades that the competitionhas escalated to what journalists and authors have labeled‘the cola wars.’ In the first seventy years of the industry,aggressive dynamic strategic interactions were infrequent.Perhaps the most aggressive move was Pepsi’s halving theprice of its twelve-ounce bottle in 1933 to offer twice asmuch soda as Coke for the same price. Even so, it tookCoke more than twenty years to introduce a twelve-ouncebottle. Competition was much less intense. But the 1960sushered in a new wave of aggressive product proliferationand price competition. After sticking to Coke and Pepsi forvirtually all of their history, suddenly the two soft drinkgiants began a series of new product introductions, withcompetition focused on the timing of the introductions andthe know-how associated with developing new tastes.Coke and Pepsi entered the lemon-lime market in the 1960swith Coke’s Sprite (1961) and Pepsi’s Mountain Dew. RoyalCrown’s development of diet cola in 1962 launched the dietwar, stimulating the introduction of Tab (1963), Diet Pepsi(1964), and Diet Coke (1983). During the 1970s and 1980sthis process had accelerated to the point where Coke andPepsi alone introduced more than thirty-four new pro-ducts. If Seven-Up, Dr Pepper, and Royal Crown areincluded in the count, the major soft drink makerslaunched nearly one hundred new products in those twodecades. Advertising spending has soared in the 1980s and1990s. At the same time, competition has driven pricelower and lower. As an indication of the intensity of thiscompetition, the inflation-adjusted price of a case of sodahas dropped from $6.19 in 1965 to $3.99 in 1988. (D’Aveni,1994, pp. 186–187)
In this competitive landscape where the pace ofchange is relentless and increasing and where thenumber of strategic alternatives is almost unlimited,the use of the ‘escalation ladders’ in the four arenasof competition of D’Aveni’s is particularly wellsuited to analyze Coke and Pepsi’s rivalry because itallows us to understand the moves and coun-termoves of each of the two competitors. However,the rivalry between Coke and Pepsi may also be
THE RIVALRY MATRIX: UNDERSTANDING RIVALRY AND COMPETITIVE DYNAMICS
modeled in simple terms as a two-player game usinga decision tree where one player takes the lead(usually Coke) and the other one has to choosebetween following the leader or not. Note that thedifference between this situation and those presentedin the discussion of game theory is in the number ofpotential decision variables. In the Coke and Pepsicase, the competitors may decide to launch a newproduct, change the price, change the size of thebottles, increase or decrease their advertising budget,and so on. Such a range of possible competitive coun-termoves makes the game theory model a somewhatless rich description of the situation.
Amazon.comThe incredible possibilities of the Internet create newbusiness models opening a vast quantity of strategicalternatives and decision variables. In such an indus-try, it is impossible to predict all the possible movesof the players. A warfare model of competition isthen best suited to analyze the competition in thisindustry.
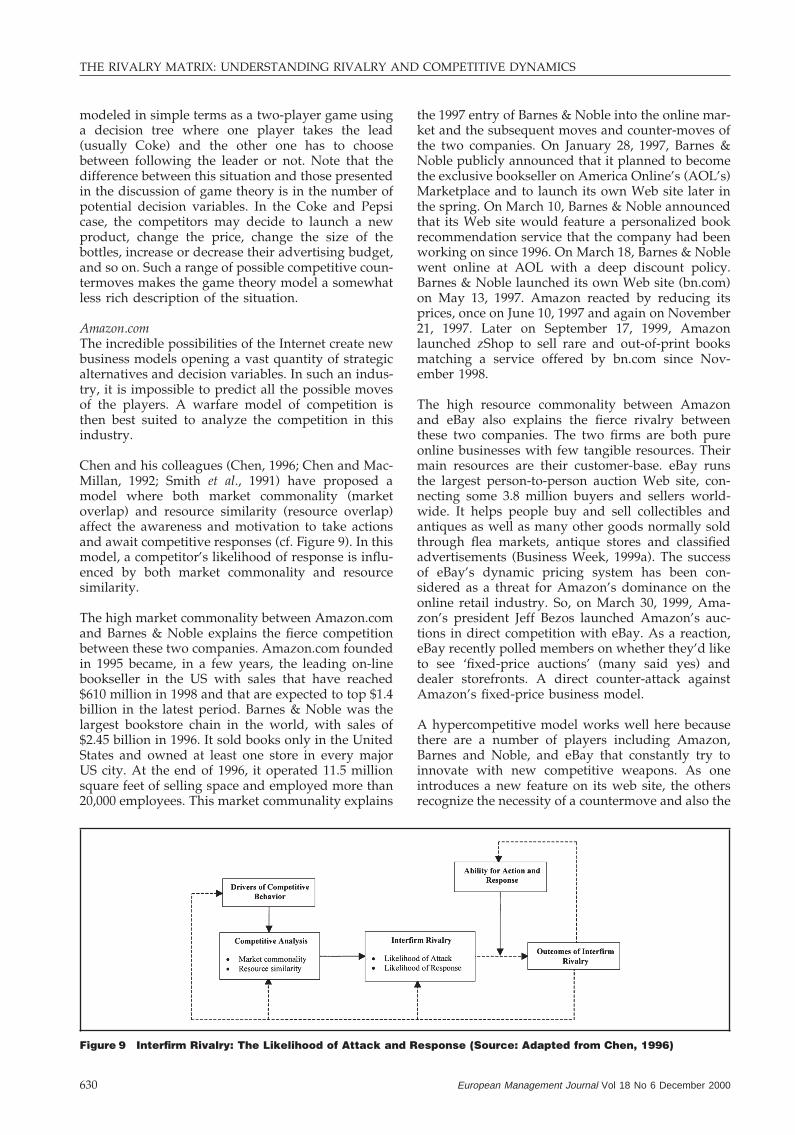
Chen and his colleagues (Chen, 1996; Chen and Mac-Millan, 1992; Smith et al., 1991) have proposed amodel where both market commonality (marketoverlap) and resource similarity (resource overlap)affect the awareness and motivation to take actionsand await competitive responses (cf. Figure 9). In thismodel, a competitor’s likelihood of response is influ-enced by both market commonality and resourcesimilarity.
The high market commonality between Amazon.comand Barnes & Noble explains the fierce competitionbetween these two companies. Amazon.com foundedin 1995 became, in a few years, the leading on-linebookseller in the US with sales that have reached$610 million in 1998 and that are expected to top $1.4billion in the latest period. Barnes & Noble was thelargest bookstore chain in the world, with sales of$2.45 billion in 1996. It sold books only in the UnitedStates and owned at least one store in every majorUS city. At the end of 1996, it operated 11.5 millionsquare feet of selling space and employed more than20,000 employees. This market communality explains
Figure 9 Interfirm Rivalry: The Likelihood of Attack and Response (Source: Adapted from Chen, 1996)
European Management Journal Vol 18 No 6 December 2000630
the 1997 entry of Barnes & Noble into the online mar-ket and the subsequent moves and counter-moves ofthe two companies. On January 28, 1997, Barnes &Noble publicly announced that it planned to becomethe exclusive bookseller on America Online’s (AOL’s)Marketplace and to launch its own Web site later inthe spring. On March 10, Barnes & Noble announcedthat its Web site would feature a personalized bookrecommendation service that the company had beenworking on since 1996. On March 18, Barnes & Noblewent online at AOL with a deep discount policy.Barnes & Noble launched its own Web site (bn.com)on May 13, 1997. Amazon reacted by reducing itsprices, once on June 10, 1997 and again on November21, 1997. Later on September 17, 1999, Amazonlaunched zShop to sell rare and out-of-print booksmatching a service offered by bn.com since Nov-ember 1998.
The high resource commonality between Amazonand eBay also explains the fierce rivalry betweenthese two companies. The two firms are both pureonline businesses with few tangible resources. Theirmain resources are their customer-base. eBay runsthe largest person-to-person auction Web site, con-necting some 3.8 million buyers and sellers world-wide. It helps people buy and sell collectibles andantiques as well as many other goods normally soldthrough flea markets, antique stores and classifiedadvertisements (Business Week, 1999a). The successof eBay’s dynamic pricing system has been con-sidered as a threat for Amazon’s dominance on theonline retail industry. So, on March 30, 1999, Ama-zon’s president Jeff Bezos launched Amazon’s auc-tions in direct competition with eBay. As a reaction,eBay recently polled members on whether they’d liketo see ‘fixed-price auctions’ (many said yes) anddealer storefronts. A direct counter-attack againstAmazon’s fixed-price business model.
A hypercompetitive model works well here becausethere are a number of players including Amazon,Barnes and Noble, and eBay that constantly try toinnovate with new competitive weapons. As oneintroduces a new feature on its web site, the othersrecognize the necessity of a countermove and also the

THE RIVALRY MATRIX: UNDERSTANDING RIVALRY AND COMPETITIVE DYNAMICS
necessity of a further escalation of the set of competi-tive moves.
Frameworks
In an uncertain environment and when manydecision variables are involved, there is too muchcomplexity to rigorously model competition. In sucha situation where the focus of the analysis is onachieving a better understanding of the strategic vari-ables and their interaction, a framework approach tomodeling is more appropriate.
Crown Cork & SealThe metal container industry presented in the Harv-ard Case (HBS Case 9-793-035, 1998) is a complexindustry with many key decision variables involved(e.g. pricing, customer relationships, distribution,manufacturing, supplier relationships) and an unpre-dictable environment characterized by industrydiversification and consolidation, technologicaluncertainty, and consistent competition. To effec-tively compete in such an industry, a companyshould understand the structure of the industry aswell as the strategies of its competitors. To reducethe complexity of such a situation, Porter’s (1980)five-forces framework may be used. This frameworksuggests that an industry’s potential profitability is afunction of the interactions among these five forces:suppliers, buyers, competitive rivalry among firmscurrently in the industry, product substitutes, andpotential entrants to the industry (Porter, 1980) (cf.Figure 10). Using this framework, a firm is chal-lenged to understand an industry’s profit potential,its competitive dynamics, and the strategies that
Figure 10 Forces Driving Industry Competition. Source: Adapted from Porter (1980)
European Management Journal Vol 18 No 6 December 2000 631
could be implemented to establish a defensible com-petitive position, given the industry’s structuralcharacteristics.
The situation in the metal container industry isdescribed by Cavanaugh (HBS Case 9-793-035, 1998)as follows:
The metal container industry had changed considerablysince 1957. American National had just been acquired byFrance’s State-owned Pechiney International, making it theworld’s largest beverage can producer. Continental Can,another long-standing rival, was now owned by Peter Kie-wit Sons, a privately held construction firm. In 1989, all, orpart of Continental’s can-making operations, appeared tobe for sale. Reynolds Metal, a traditional supplier of alumi-num to can makers, was now also a formidable competitorin cans. The moves by both suppliers and customers of canmakers to integrate into can manufacturing themselves hadprofoundly redefined the metal can industry.
Using a five-forces framework, Shank and Govinda-rajan (1989) have extensively analyzed the profitabil-ity of the metal container industry in the followingmanner.
Bargaining Power of Suppliers: (1) Aluminum Compa-nies: There are only four suppliers of aluminum andthese companies are much more concentrated thanthe metal container industry. These firms have vastresources and pose a credible threat in terms of for-ward integration. (2) Steel Companies: There are fewsuppliers of tin plated steel and they also pose a cred-ible threat in terms of forward integration. Alumi-num and Steel companies can also exert a good dealof bargaining power over metal can manufacturers.
Bargaining Power of Buyers: Buyers of cans are very

THE RIVALRY MATRIX: UNDERSTANDING RIVALRY AND COMPETITIVE DYNAMICS
large and powerful. The cost of can is a significantfraction of their costs. Cans are a commodity productbought in large quantities. There is low customer loy-alty. Buyers pose a credible threat in terms of back-ward integration and can exert a great deal of powerover metal can producers.
Threat from Substitute Products: (1) Aluminum: Itslighter weight could help in transportation costs.Aluminum is easier to lithograph, producing a betterreproduction at lower cost. Aluminum is also favoredover steel as a recycling material. (2) Plastics are gen-erally lighter and resistant to breakage. (3) Fiber-foilis 20 per cent lighter and 15 per cent cheaper than asteel can. These substitutes pose a significant threatto tin-plated steel.
Threat of Entry: Economies of scale in this industryare quite low and as such cannot be used as an entrybarrier. Capital investments are certainly not an entrybarrier. Technology is not an entry barrier. Brand loy-alty is absent and, therefore is not an entry barrier.The metal container industry has then very low bar-riers to entry but is not an attractive (high-margin)industry.
Intensity of Rivalry among Existing Competitors: This isa slow growth, mature industry. A metal containeris largely an undifferentiated product, forcing thecustomers to choose on the basis of price. The pres-ence of close substitutes and low entry barriers keepsa lid on prices. And, the existence of very powerfulbuyers and very powerful suppliers keeps containerprices down. Therefore, price competition is quiteintense.
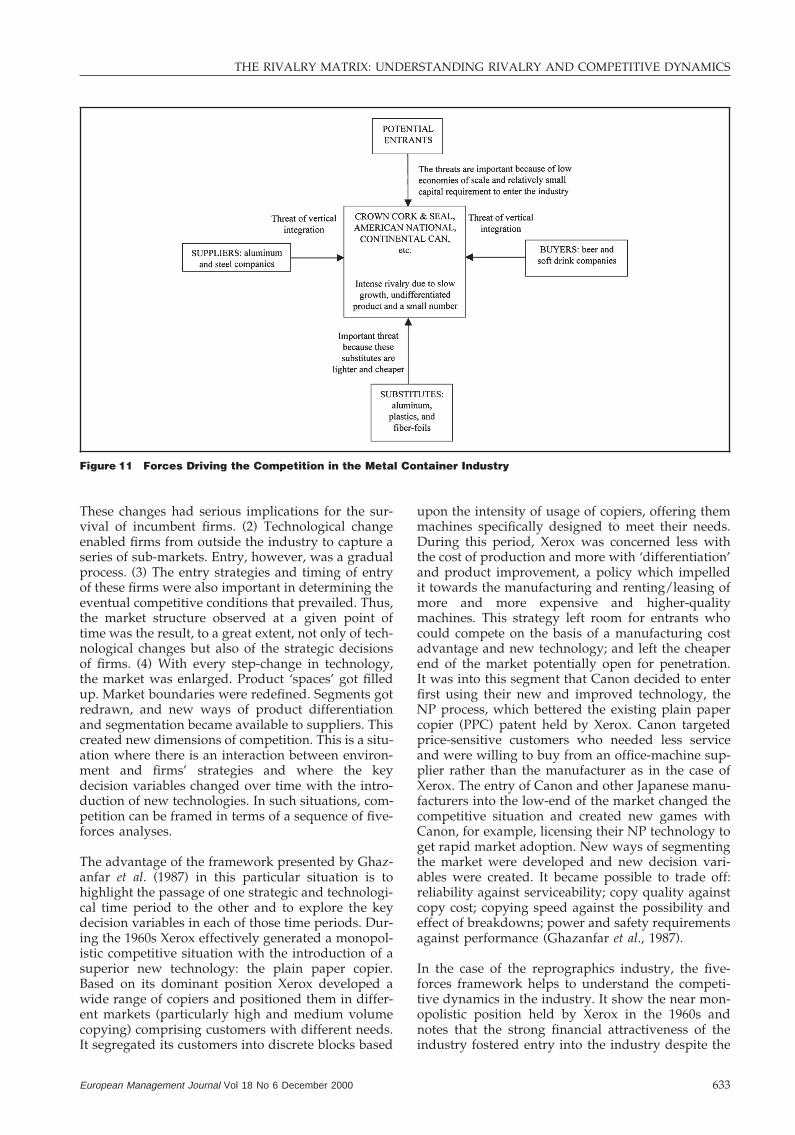
In summary, the major trends characterizing themetal container industry during the 1980s are: (1) thecontinuing threat of in-house manufacture; (2) theemergence of plastics as a viable packaging material;(3) steady competition from glass as a substitute foraluminum in the beer market; (4) the emergence ofthe soft drink industry as the largest end-user ofpackaging, with aluminum as the primary benefici-ary; and (5) the diversification of, and consolidationamong, packaging producers. Given these factors, theprofit potential in the metal container industry isexpected to be low (cf. Figure 11).
Based on this analysis, to make profits in such amature industry, Crown Cork & Seal should focus onthree dimensions of strategy: (1) Cautious diversifi-cation by concentrating on the core business (e.g.packaging) and gradually introducing substitute pro-ducts (e.g. aluminum cans and then plasticcontainers); (2) Focusing on customer service to buildlong-term relationships with customers that providea reputation for a consistent customer packaging ser-vice and allow higher margins; (3) Managing econ-omies of scale and scope to balance production costsand customer service and allow the subsequent take-over of competitors (e. g. CarnaudMetalbox in 1995).
European Management Journal Vol 18 No 6 December 2000632
A number of descriptions of Crown Cork & Seal’slater and successful strategy as one of the leaders ofthe packaging industry have been made available inmedia sources such as the Financial Times and theWall Street Journal.
In an uncertain environment, such as the one of themetal container industry, where many key decisionvariables are involved, the complexity is too high torigorously model competition. Porter’s frameworkframes the key variables and their interactions andenables a viable competitive strategy to bedeveloped.
The Case of the Reprographics IndustryThe reprographics industry in the United Kingdomis characterized by strong competition, technologicalchange, and firms with declining market share.Numerous technological changes in this industryhave modified the structure of the industry as wellas the key decision variables of the players. Ghazan-far et al. (1987) studied the impact of technologicalchange on this industry using a framework approachcorresponding to a succession of several five-forceanalyses. After each introduction of a new tech-nology, the balance between suppliers, buyers, com-petitive rivalry among firms currently in the indus-try, product substitutes, and potential entrants intothe industry has changed leading to new rules ofengagement.
The framework used by Ghazanfar et al. (1987) toanalyze this industry shows that technology canchange market structure by changing the conditionson the demand side and/or by causing adjustmentson the supply side. Thus, the nature of competitionchanges and the nature and level of entry barrierscan alter, sometimes dramatically. A second elementof the framework shows how a firm can take advan-tage of technological change by changing its assetbase and thus increase the number of decision vari-ables. The key issue for a firm concerns its ability toinvest in assets that are, relative to competitors, suf-ficiently distinct so that it can compete in the marketin ways that cannot be imitated. The distinctivenessof the assets relates to the ‘uncertain imitability’(Lippman and Rumelt, 1982) of those assets by com-petitors and thus constitutes the basis for economicrents. The ability of the firm to create distinctivenessfor itself by investing in R&D is a prime source ofcompetitive power and, taken far enough, is suf-ficient to change market structure.
The history of the office reprographics industry maybe described as a succession of changes in the struc-ture of the industry and the strategies of the competi-tors, which can be summarized as follows: (1) Step-changes in technology led to changes in market struc-ture and competitive conditions, and to the formationof new sets of competitors. The height of entry bar-riers changed, cost conditions changed, and so didthe extent and nature of product differentiation.
THE RIVALRY MATRIX: UNDERSTANDING RIVALRY AND COMPETITIVE DYNAMICS
Figure 11 Forces Driving the Competition in the Metal Container Industry
These changes had serious implications for the sur-vival of incumbent firms. (2) Technological changeenabled firms from outside the industry to capture aseries of sub-markets. Entry, however, was a gradualprocess. (3) The entry strategies and timing of entryof these firms were also important in determining theeventual competitive conditions that prevailed. Thus,the market structure observed at a given point oftime was the result, to a great extent, not only of tech-nological changes but also of the strategic decisionsof firms. (4) With every step-change in technology,the market was enlarged. Product ‘spaces’ got filledup. Market boundaries were redefined. Segments gotredrawn, and new ways of product differentiationand segmentation became available to suppliers. Thiscreated new dimensions of competition. This is a situ-ation where there is an interaction between environ-ment and firms’ strategies and where the keydecision variables changed over time with the intro-duction of new technologies. In such situations, com-petition can be framed in terms of a sequence of five-forces analyses.
The advantage of the framework presented by Ghaz-anfar et al. (1987) in this particular situation is tohighlight the passage of one strategic and technologi-cal time period to the other and to explore the keydecision variables in each of those time periods. Dur-ing the 1960s Xerox effectively generated a monopol-istic competitive situation with the introduction of asuperior new technology: the plain paper copier.Based on its dominant position Xerox developed awide range of copiers and positioned them in differ-ent markets (particularly high and medium volumecopying) comprising customers with different needs.It segregated its customers into discrete blocks based
European Management Journal Vol 18 No 6 December 2000 633
upon the intensity of usage of copiers, offering themmachines specifically designed to meet their needs.During this period, Xerox was concerned less withthe cost of production and more with ‘differentiation’and product improvement, a policy which impelledit towards the manufacturing and renting/leasing ofmore and more expensive and higher-qualitymachines. This strategy left room for entrants whocould compete on the basis of a manufacturing costadvantage and new technology; and left the cheaperend of the market potentially open for penetration.It was into this segment that Canon decided to enterfirst using their new and improved technology, theNP process, which bettered the existing plain papercopier (PPC) patent held by Xerox. Canon targetedprice-sensitive customers who needed less serviceand were willing to buy from an office-machine sup-plier rather than the manufacturer as in the case ofXerox. The entry of Canon and other Japanese manu-facturers into the low-end of the market changed thecompetitive situation and created new games withCanon, for example, licensing their NP technology toget rapid market adoption. New ways of segmentingthe market were developed and new decision vari-ables were created. It became possible to trade off:reliability against serviceability; copy quality againstcopy cost; copying speed against the possibility andeffect of breakdowns; power and safety requirementsagainst performance (Ghazanfar et al., 1987).
In the case of the reprographics industry, the five-forces framework helps to understand the competi-tive dynamics in the industry. It show the near mon-opolistic position held by Xerox in the 1960s andnotes that the strong financial attractiveness of theindustry fostered entry into the industry despite the
THE RIVALRY MATRIX: UNDERSTANDING RIVALRY AND COMPETITIVE DYNAMICS
high market share of Xerox and the equally high pat-ent capital and other entry barriers present at thattime. In the 1970s, Canon, and the Federal Com-mission who unbundled Xerox’s PPC patents,changed the technological balance of the industryand attracted new entrants such as Canon (imaging),Toshiba (microelectronics), IBM, and Kodak who, inturn, segmented the industry. By the 1980s the five-forces model shows an industry divided at least intoa high-end, technologically complex office auto-mation marketplace and a low-end, highly global andcommodity office photocopying machine segment.
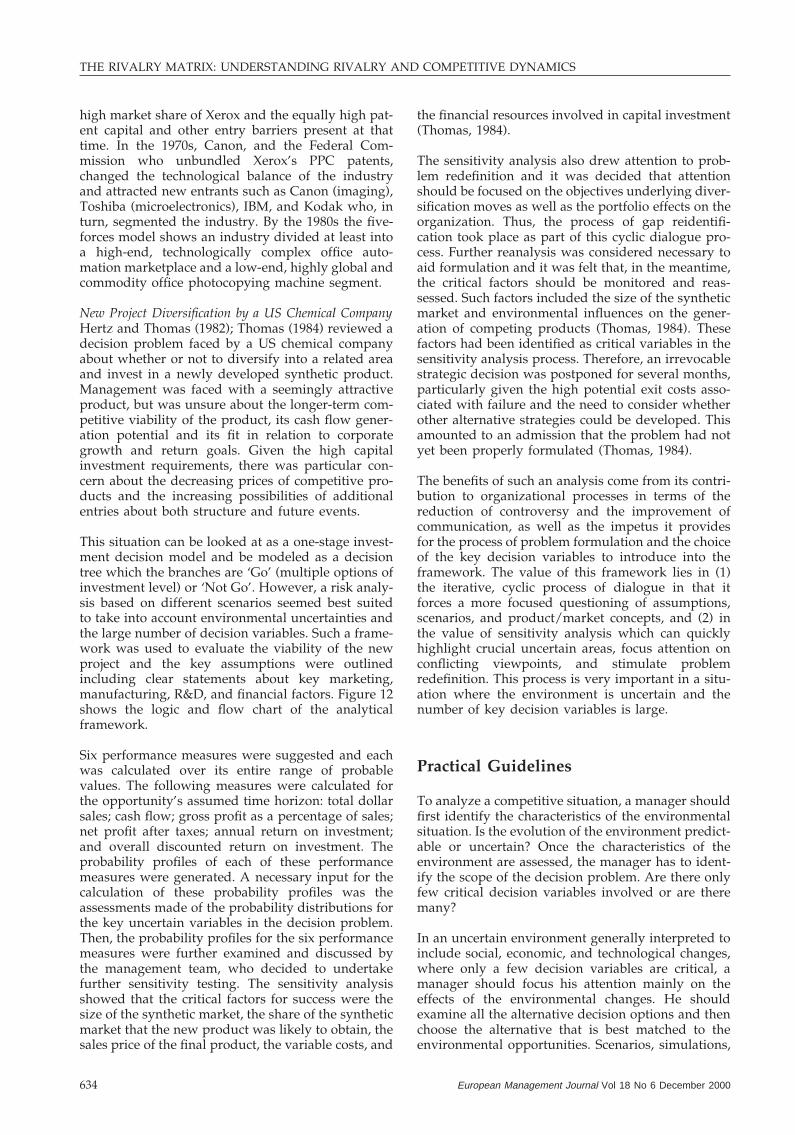
New Project Diversification by a US Chemical CompanyHertz and Thomas (1982); Thomas (1984) reviewed adecision problem faced by a US chemical companyabout whether or not to diversify into a related areaand invest in a newly developed synthetic product.Management was faced with a seemingly attractiveproduct, but was unsure about the longer-term com-petitive viability of the product, its cash flow gener-ation potential and its fit in relation to corporategrowth and return goals. Given the high capitalinvestment requirements, there was particular con-cern about the decreasing prices of competitive pro-ducts and the increasing possibilities of additionalentries about both structure and future events.
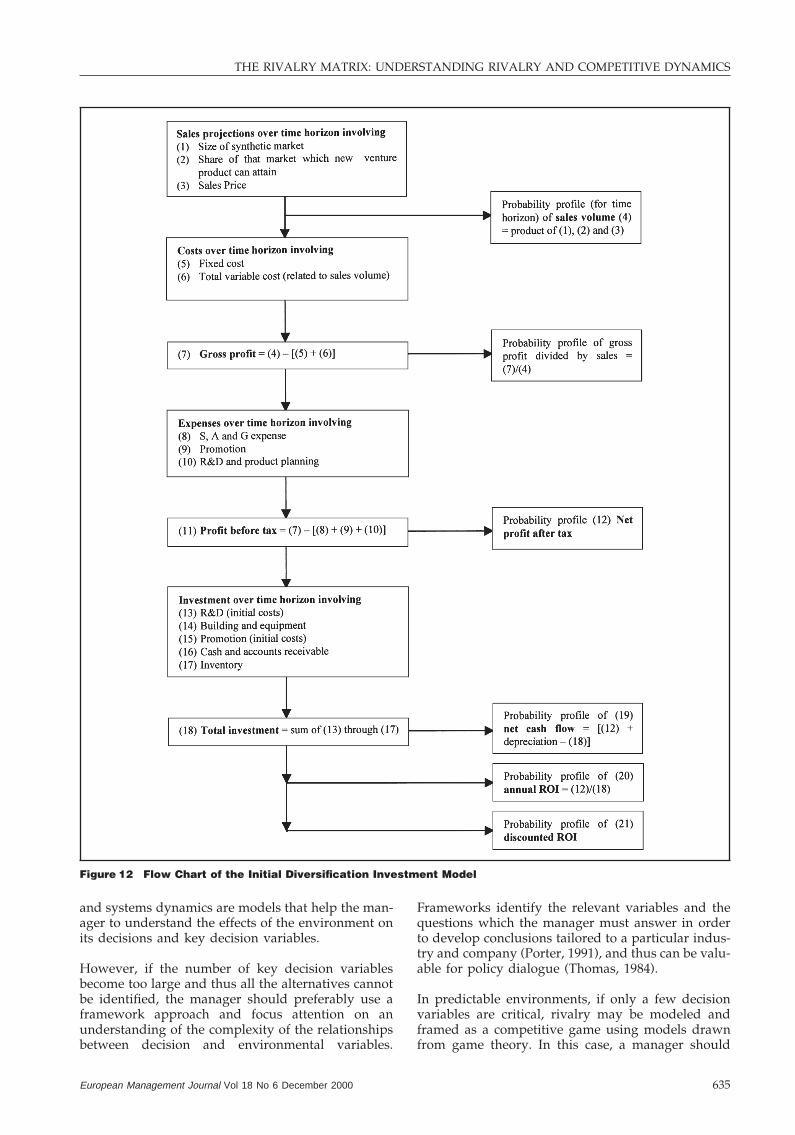
This situation can be looked at as a one-stage invest-ment decision model and be modeled as a decisiontree which the branches are ‘Go’ (multiple options ofinvestment level) or ‘Not Go’. However, a risk analy-sis based on different scenarios seemed best suitedto take into account environmental uncertainties andthe large number of decision variables. Such a frame-work was used to evaluate the viability of the newproject and the key assumptions were outlinedincluding clear statements about key marketing,manufacturing, R&D, and financial factors. Figure 12shows the logic and flow chart of the analyticalframework.
Six performance measures were suggested and eachwas calculated over its entire range of probablevalues. The following measures were calculated forthe opportunity’s assumed time horizon: total dollarsales; cash flow; gross profit as a percentage of sales;net profit after taxes; annual return on investment;and overall discounted return on investment. Theprobability profiles of each of these performancemeasures were generated. A necessary input for thecalculation of these probability profiles was theassessments made of the probability distributions forthe key uncertain variables in the decision problem.Then, the probability profiles for the six performancemeasures were further examined and discussed bythe management team, who decided to undertakefurther sensitivity testing. The sensitivity analysisshowed that the critical factors for success were thesize of the synthetic market, the share of the syntheticmarket that the new product was likely to obtain, thesales price of the final product, the variable costs, and
European Management Journal Vol 18 No 6 December 2000634
the financial resources involved in capital investment(Thomas, 1984).
The sensitivity analysis also drew attention to prob-lem redefinition and it was decided that attentionshould be focused on the objectives underlying diver-sification moves as well as the portfolio effects on theorganization. Thus, the process of gap reidentifi-cation took place as part of this cyclic dialogue pro-cess. Further reanalysis was considered necessary toaid formulation and it was felt that, in the meantime,the critical factors should be monitored and reas-sessed. Such factors included the size of the syntheticmarket and environmental influences on the gener-ation of competing products (Thomas, 1984). Thesefactors had been identified as critical variables in thesensitivity analysis process. Therefore, an irrevocablestrategic decision was postponed for several months,particularly given the high potential exit costs asso-ciated with failure and the need to consider whetherother alternative strategies could be developed. Thisamounted to an admission that the problem had notyet been properly formulated (Thomas, 1984).
The benefits of such an analysis come from its contri-bution to organizational processes in terms of thereduction of controversy and the improvement ofcommunication, as well as the impetus it providesfor the process of problem formulation and the choiceof the key decision variables to introduce into theframework. The value of this framework lies in (1)the iterative, cyclic process of dialogue in that itforces a more focused questioning of assumptions,scenarios, and product/market concepts, and (2) inthe value of sensitivity analysis which can quicklyhighlight crucial uncertain areas, focus attention onconflicting viewpoints, and stimulate problemredefinition. This process is very important in a situ-ation where the environment is uncertain and thenumber of key decision variables is large.
Practical Guidelines
To analyze a competitive situation, a manager shouldfirst identify the characteristics of the environmentalsituation. Is the evolution of the environment predict-able or uncertain? Once the characteristics of theenvironment are assessed, the manager has to ident-ify the scope of the decision problem. Are there onlyfew critical decision variables involved or are theremany?
In an uncertain environment generally interpreted toinclude social, economic, and technological changes,where only a few decision variables are critical, amanager should focus his attention mainly on theeffects of the environmental changes. He shouldexamine all the alternative decision options and thenchoose the alternative that is best matched to theenvironmental opportunities. Scenarios, simulations,
THE RIVALRY MATRIX: UNDERSTANDING RIVALRY AND COMPETITIVE DYNAMICS
Figure 12 Flow Chart of the Initial Diversification Investment Model
and systems dynamics are models that help the man-ager to understand the effects of the environment onits decisions and key decision variables.
However, if the number of key decision variablesbecome too large and thus all the alternatives cannotbe identified, the manager should preferably use aframework approach and focus attention on anunderstanding of the complexity of the relationshipsbetween decision and environmental variables.
European Management Journal Vol 18 No 6 December 2000 635
Frameworks identify the relevant variables and thequestions which the manager must answer in orderto develop conclusions tailored to a particular indus-try and company (Porter, 1991), and thus can be valu-able for policy dialogue (Thomas, 1984).
In predictable environments, if only a few decisionvariables are critical, rivalry may be modeled andframed as a competitive game using models drawnfrom game theory. In this case, a manager should

THE RIVALRY MATRIX: UNDERSTANDING RIVALRY AND COMPETITIVE DYNAMICS
first understand the nature of the game. Is it asequential game or a simultaneous game? In sequen-tial games, the manager should anticipate its rival’sresponse by looking ahead and reasoning back (Dixitand Nalebuff, 1991). If it is a simultaneous game, themanager should try to see through its rival’s strategyby identifying dominant strategies and potentialequilibrium positions (Dixit and Nalebuff, 1991).However, game theory modeling of this type is onlypossible when the number of players is limited andwhen the number of alternative moves available foreach player is also limited. Yet such models can pro-vide very useful guidelines in decision-making evenwhen more players and moves are present, e.g. mul-tiple party negotiation situations.
Otherwise, the analysis of competition may be bettermodeled by warfare models where the rules of thegame change over time and where there is continuingchange in the marketplace. In such situations, a man-ager should understand the probability and thestrength of the reactions of its rival(s), as well aschanges in the rules of engagement.
Conclusion
In this paper, the rivalry matrix is developed as aframework to help managers to identify and selectappropriate approaches in modeling competitivedynamics. In this framework, two dimensions areimportant in analyzing the applicability of alternativecompetitive models: the number of decision variablesand the predictability of the environment. The use ofthe rivalry matrix is then demonstrated in a numberof case situations to give insight into how such riv-alry models can be applied by senior managers inanalyzing their own competitive strategies.
References
Baum, J.A.C. and Korn, H.J. (1996) Competitive dynamics ofinterfirm rivalry. Academy of Management Journal 39(2),255–291.
Bettis, R.A. and Weeks, D. (1987) Financial returns and stra-tegic interaction: the case of instant photography. Stra-tegic Management Journal 8(6), 549–563.
Brandenburger, A.M. and Nalebuff, B.J. (1995) The rightgame: use game theory to shape strategy. Harvard Busi-ness Review 73(4), 57–71.
Business Week (1999a) In the ring eBay vs. Amazon.com: thefight you never thought you’d see, May 31, pp. 128–140.
Business Week (1999b) Intel is taking no prisoners: it’s slashingprices to gain share and blitzkrieg the competition, June12, p. 38.
Camerer, C.F. (1991) Does strategy research need gametheory? Strategic Management Journal 12(Winter SpecialIssue), 137–152.
Chen, M.-J. (1996) Competitor analysis and interfirm rivalry:toward a theoretical integration. Academy of ManagementReview 21(1), 100–134.
Chen, M.-J. and MacMillan, I.C. (1992) Nonresponse anddelayed response to competitive moves: the roles of com-
European Management Journal Vol 18 No 6 December 2000636
petitor dependence and action irreversibility. Academy ofManagement Journal 35(3), 539–570.
D’Aveni, R.A. (1994) Hyper-Competition: Managing the Dynam-ics of Strategic Manoeuvering. The Free Press, New York.
Desmet, D., Finskud, L., Glucksman, M., Marshall, N.H.,Reyner, M.J. and Warren, K. (1998) The end of voodoobrand management. The McKinsey Quarterly 2, 106–117.
Dixit, A.K. and Nalebuff, B.J. (1991) Thinking Strategically: TheCompetitive Edge in Business, Politics, and Everyday Life.W.W. Norton and Company, New York.
Fruhan, W.I., Jr. (1972) The Fight for Competitive Advantage.Division of Research, Graduate School of BusinessAdministration, Harvard University, Boston.
Ghazanfar, A., McGee, J. and Thomas, H. (1987) The impact oftechnological change on industry structure and corporatestrategy: the case of the reprographics industry in theUnited Kingdom. In The Management of Strategic Change,ed. Andrew M. Pettigrew, pp. 166–191. Basil Blackwell,Oxford.
Gruca, T.S. and Sudharshan, D. (1995) A framework for entrydeterrence strategy: the competitive environment,choices, and consequences. Journal of Marketing 59(3),44–55.
HBS Case 376-266 (1984) Polaroid–Kodak. Glenn W. Merry,1976, Rev. March 1.
HBS Case 9-793-035 (1998) Crown Cork & Seal in 1989. SheilaM. Cavanaugh, 1993, Rev. May 29.
HBS Case 9-794-055 (1995) Cola Wars Continue: Coke vs. Pepsiin the 1990s. Sharon Foley, 1994, Rev. April 10.
HBS Case 9-795-191 (1997) The Ready-to-Eat Breakfast CerealIndustry in 1994 (A). Kenneth S. Corts, 1995, Rev. Febru-ary 14.
HBS Case 9-796-122 (1997) The Ready-to-Eat Breakfast CerealIndustry in 1994 (B). Kenneth S. Corts, 1996, Rev. Febru-ary 14.
HBS Case 9-798-063 (1998) Leadership Online: Barnes & Noblevs. Amazon.com (A). Pankaij Ghemawat and Bret Baird,1998, Rev. December 4.
Hertz, D.B. and Thomas, H. (1982) Evaluating the risk inacquisition. Long Range Planning 15(6), 38–44.
Karnani, A. and Wernerfelt, B. (1985) Multiple point compe-tition. Strategic Management Journal 6(1), 87–96.
Kotler, P. and Achrol, R.S. (1984) Marketing strategy and thescience of warfare. In Competitive Strategic Management,ed. Robert Boyden Lamb, pp. 94–133. Prentice-Hall,Englewood Cliffs, NJ.
Lengnick-Hall, C.A. and Wolff, J.A. (1999) Similarities andcontradictions in the core logic of three strategy researchstreams. Strategic Management Journal 20(12), 1109–1132.
Lippman, S. and Rumelt, R.P. (1982) Uncertain imitability: ananalysis of interfirm differences in efficiency and compe-tition. The Bell Journal of Economics and Human Science13(2), 418–438.
Luce, R.D. and Raiffa, H. (1957) Games and Decisions. Wiley,New York.
McGrath, R.G., Chen, M.-J. and MacMillan, I.C. (1998) Multi-market manoeuvring in uncertain spheres of influence:resource diversion strategies. Academy of ManagementReview 23(4), 724–740.
Morecroft, J.D.W. (1984) Strategy support models. StrategicManagement Journal 5(3), 215–229.
Oster, S.M. (1999) Modern Competitive Analysis, 3rd edn.Oxford University Press, New York.
Parkhe, A. (1993) Strategic alliance structuring: a game theor-etic and transaction cost examination of interfirmcooperation. Academy of Management Journal 36(4), 794–829.
Porter, M.E. (1980) Competitive Strategy: Techniques for Analyz-ing Industries and Competitors. The Free Press, New York.
Porter, M.E. (1991) Toward a dynamic theory of strategy. Stra-tegic Management Journal 12(Winter Special Issue), 95–117.
Porter, M.E. and Spence, M. (1982) The capacity expansionprocess in a growing oligopoly: the case of corn wet mill-ing. In The Economics of Information and Uncertainty, ed.John J. McCall. The University of Chicago Press, Chicago.
THE RIVALRY MATRIX: UNDERSTANDING RIVALRY AND COMPETITIVE DYNAMICS
Rapoport, A. and Chammah, A.M. (1965) Prisoner’s Dilemma:A Study in Conflict and Cooperation. University of Michi-gan Press, Ann Arbor, MI.
Ries, A. and Trout, J. (1986) Marketing Warfare. Plume, NewYork.
Schmalensee, R. (1978) Entry deterrence in the ready-to-eatbreakfast industry. Bell Journal of Economics 9(2), 305–327.
Schoemaker, P.J.H. (1991) When and how to use scenarioplanning: a heuristic approach with illustration. Journalof Forecasting 10(6), 549–564.
Schoemaker, P.J.H. (1993) Multiple scenario development: itsconceptual and behavioral foundation. Strategic Manage-ment Journal 14(3), 193–213.
Schoemaker, P.J.H. (1995) Scenario planning: a tool for stra-tegic thinking. Sloan Management Review 36(2), 25–40.
Shank, J.K. and Govindarajan, V. (1989) Strategic Cost Analysis:The Evolution from Managerial to Strategic Accounting.Irwin, Homewood, IL.
Smith, F.L. and Wilson, R.L. (1995) The predictive validity ofthe Karnani and Wernerfelt model of multipoint compe-tition. Strategic Management Journal 16(2), 143–160.
Smith, K.G., Grimm, C.M., Gannon, M.J. and Chen, M.-J.(1991) Organizational information processing, competi-tive responses, and performance in the U.S. domestic air-line industry. Academy of Management Journal 34(1), 60–85.
OLIVIER FURRER, The HOWARD THOMAS,University of Birmingham, College of Commerce andthe Birmingham Business Business Administration,School, Ashley Building, University of Illinois atEdgbaston, Birmingham, Urbana-Champaign, 1206B15 2TT, UK. E-mail: o.fur- South Sixth Street, [email protected] Commerce West, Cham-
paign, Illinois 61820, USA.Dr. Olivier Furrer is Lec- E-mail: [email protected] in Marketing andInternational Business at Howard Thomas is Deanthe Birmingham Business and James F. Towey Dis-
School. Previously, he taught business strategy at the tinguished Professor of Strategic Management at theUniversity of Illinois at Urbana-Champaign. His major University of Illinois at Urbana-Champaign. He isresearch interests are in the areas of dynamics of riv- author or co-author of The Anatomy of Decisions,alry, international and service marketing, and the stra- Risk Analysis, Managing Ambiguity and Change,tegic role of intangible assets. He has authored many and Entrepreneurship: Perspectives on Theory-journal articles and a book: Services autour des Pro- Building. In 2000, he took up a new post as Dean,duits: Enjeux et Strategies (Economica, Paris 1999). University of Warwick Business School.
European Management Journal Vol 18 No 6 December 2000 637
Sun-Tzu (1963) The Art of War. Oxford University Press,Oxford.
Sun-Tzu (1993) The Art of Warfare. Ballantine Books, NewYork.
Thomas, H. (1984) Strategic decision analysis: applieddecision analysis and its role in the strategic manage-ment process. Strategic Management Journal 5(2), 139–156.
Thomas, H. and Pollock, T. (1999) From I–O economics S–C–P paradigm through strategic groups to competence-based competition: reflections on the puzzle of competi-tive strategy. British Journal of Management 10, 127–140.
von Clausewitz, C. (1911) On War, new and revised edition.Kegan Paul, Trench, Truber and Co, London.
Von Neuman, J. and Morgenstern, O. (1944) The Theory ofGames and Economic Behavior. Wiley, New York.
Wack, P. (1985a) Scenarios: uncharted waters ahead. HarvardBusiness Review 63(5), 73–89.
Wack, P. (1985b) Scenarios: shooting the rapids. Harvard Busi-ness Review 63(6), 139–150.
Warren, K. (1995) Exploring competitive futures using cogni-tive mapping. Long Range Planning 28.
Warren, K. (1999) The dynamics of strategy. Business StrategyReview 10(3), 1–16.