the rising price of a college education sandy baum michael mcpherson skidmore college & the...
TRANSCRIPT

The Rising Price of The Rising Price of a College a College EducationEducation
Sandy Baum Michael Sandy Baum Michael McPhersonMcPherson
Skidmore College & The Spencer Skidmore College & The Spencer FoundationFoundation
The College BoardThe College Board
College Savings FoundationCollege Savings Foundation
May 2008May 2008

Rising college Rising college prices:prices:
Not a new storyNot a new story

Average Published Average Published Charges for Charges for
Undergraduates, 2007-08 Undergraduates, 2007-08 (Enrollment-Weighted)(Enrollment-Weighted)
Source: The College Board, Trends in College Pricing 2007

Average Published Average Published Tuition and Fees, Five-Tuition and Fees, Five-
Year Intervals,Year Intervals, 1977-78 to 2007-08 (Enrollment-Weighted)1977-78 to 2007-08 (Enrollment-Weighted)
Source: The College Board, Trends in College Pricing 2007

Variation in PricesVariation in Prices

Distribution of Full-Time Distribution of Full-Time Undergraduates at Public & Undergraduates at Public &
Private Four-Year Institutions by Private Four-Year Institutions by Published Tuition & Fees, 2007-08Published Tuition & Fees, 2007-08
Source: The College Board, Trends in College Pricing 2007
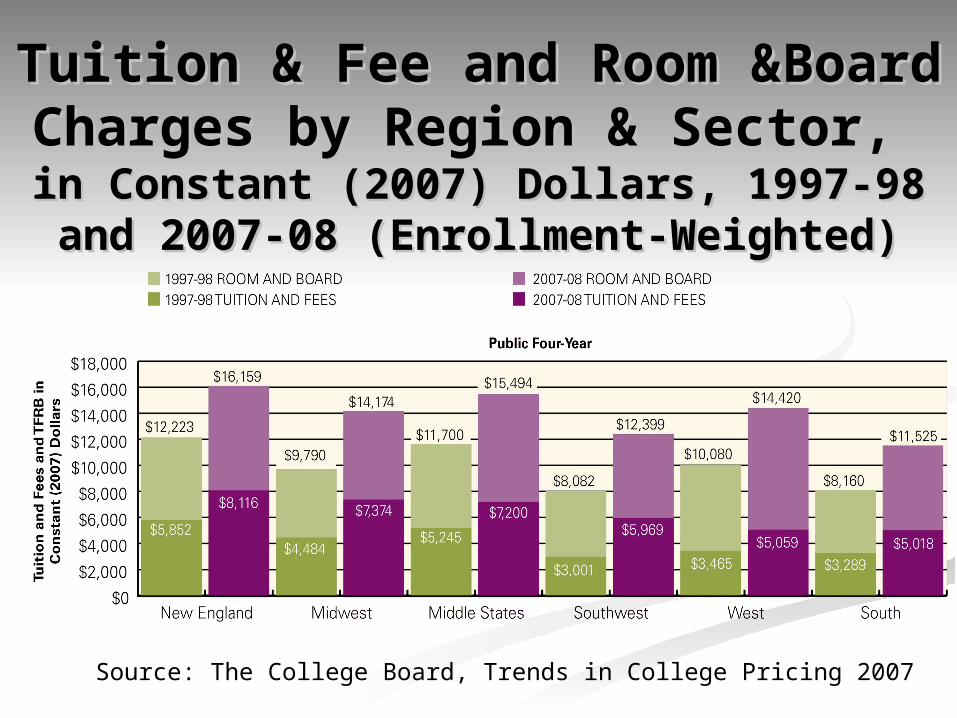
Tuition & Fee and Room Tuition & Fee and Room &Board Charges by Region & &Board Charges by Region &
Sector, Sector, in Constant (2007) Dollars, 1997-98 in Constant (2007) Dollars, 1997-98 and 2007-08 (Enrollment-Weighted)and 2007-08 (Enrollment-Weighted)
Source: The College Board, Trends in College Pricing 2007

Tuition and fees don’t Tuition and fees don’t tell the whole story.tell the whole story.

Average Estimated Average Estimated Undergraduate Budgets, Undergraduate Budgets,
2007-082007-08 (Enrollment-Weighted)(Enrollment-Weighted)
Source: The College Board, Trends in College Pricing 2007

The net price to students The net price to students after considering grant after considering grant aid and tax benefits, is a aid and tax benefits, is a
better indicator of better indicator of affordability than the affordability than the
published price.published price.
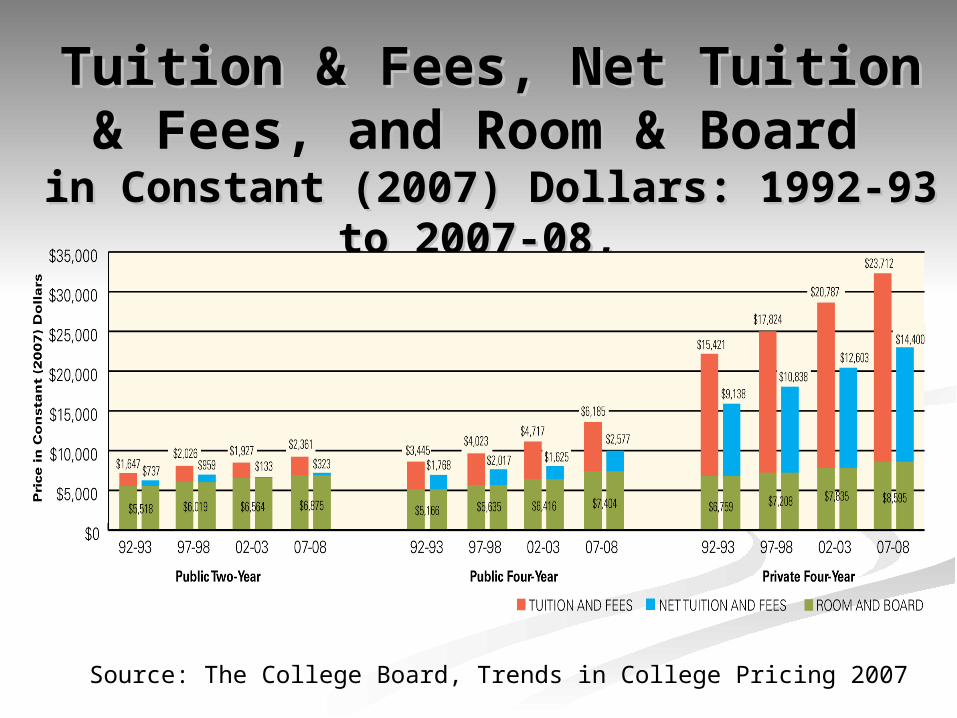
Tuition & Fees, Net Tuition & Tuition & Fees, Net Tuition & Fees, and Room & Board Fees, and Room & Board
in Constant (2007) Dollars: 1992-93 in Constant (2007) Dollars: 1992-93 to 2007-08, to 2007-08,
Source: The College Board, Trends in College Pricing 2007
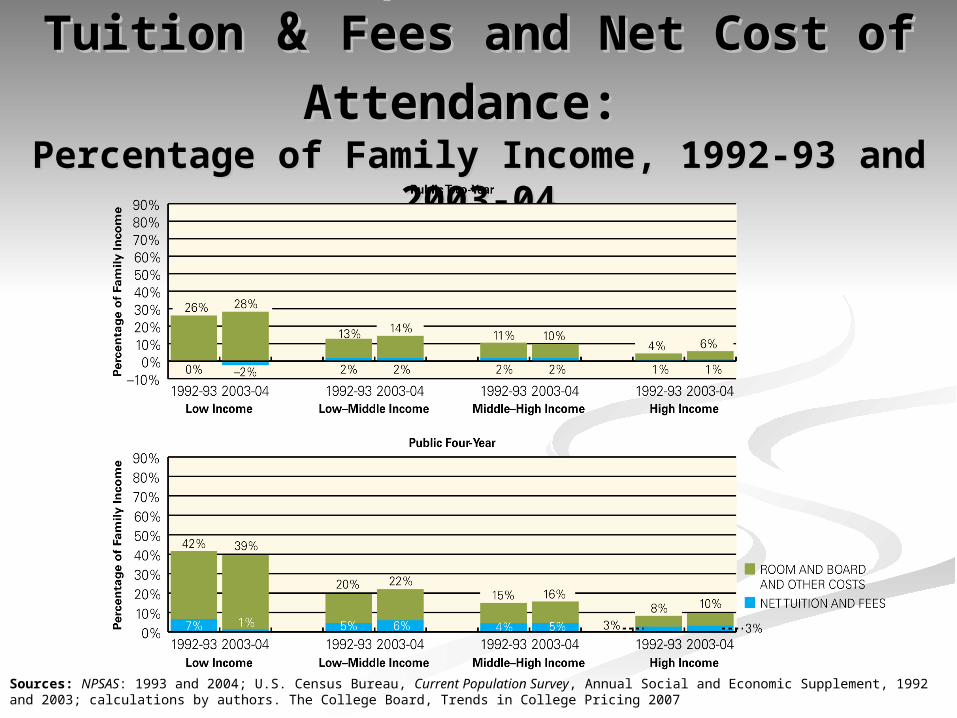
Full-Time Dependent Student Net Full-Time Dependent Student Net TuitionTuition & & Fees and Net Cost of Fees and Net Cost of
Attendance:Attendance: Percentage of Family Income, 1992-93 and Percentage of Family Income, 1992-93 and
2003-042003-04
Sources: NPSAS: 1993 and 2004; U.S. Census Bureau, Current Population Survey, Annual Social and Economic Supplement, 1992 and 2003; calculations by authors. The College Board, Trends in College Pricing 2007

Full-Time Dependent Student Net Full-Time Dependent Student Net Tuition & Fees and Net Cost of Tuition & Fees and Net Cost of
Attendance: Attendance: Percentage of Family Income, 1992-93 and Percentage of Family Income, 1992-93 and
2003-042003-04
Sources: NPSAS: 1993 and 2004; U.S. Census Bureau, Current Population Survey, Annual Social and Economic Supplement, 1992 and 2003; calculations by authors. The College Board, Trends in College Pricing 2007
What is driving the price What is driving the price of college?of college?

Annual Percentage Changes in Annual Percentage Changes in Educational Appropriations per Public Educational Appropriations per Public FTE Student and in Tuition & Fees at FTE Student and in Tuition & Fees at
Public Four-Year Institutions Public Four-Year Institutions in Constant (2007) Dollars, 1980-81 to in Constant (2007) Dollars, 1980-81 to
2005-062005-06
Source: SHEEO data, The College Board, Trends in College Pricing 2007

1616
Average Annual Percent Change in Median Spending Average Annual Percent Change in Median Spending per FTE Student per FTE Student –– Publics Publics
Public ResearchPublic Research Public MastersPublic Masters Public AssociatesPublic Associates
1987-19961987-1996 1998-20051998-2005 1987-19961987-1996 1998-20051998-2005 1987-19961987-1996 1998-20051998-2005
InstructionInstruction 0.5%0.5% 0.4%0.4% 0.6%0.6% 0.4%0.4% 1.0%1.0% -0.2%-0.2%
ResearchResearch 3.9%3.9% 3.2%3.2% 4.3%4.3% 3.2%3.2% -3.7%-3.7% 1.0%1.0%
Public ServicePublic Service 5.0%5.0% 7.2%7.2% 5.4%5.4% 3.7%3.7% 2.1%2.1% 0.0%0.0%
Academic SupportAcademic Support 2.3%2.3% 0.1%0.1% 2.0%2.0% 0.6%0.6% 1.0%1.0% 0.2%0.2%
Student ServicesStudent Services 2.4%2.4% 0.9%0.9% 1.3%1.3% 0.4%0.4% 2.0%2.0% 0.3%0.3%
Institutional Institutional SupportSupport 0.6%0.6% 0.9%0.9% 1.8%1.8% 1.2%1.2% 1.3%1.3% 0.5%0.5%
Operations and Operations and MaintenanceMaintenance -0.4%-0.4% 2.0%2.0% -0.6%-0.6% 1.8%1.8% -0.3%-0.3% 0.9%0.9%
Institutional GrantsInstitutional Grants 9.5%9.5% 7.5%7.5% 7.6%7.6% 6.4%6.4% 6.1%6.1% 4.6%4.6%
+Source: The Delta Cost Project, 2008

1717
Average Annual Percent Change in Median Spending Average Annual Percent Change in Median Spending per FTE Student per FTE Student –– Private Institutions Private Institutions
Private ResearchPrivate Research Private MastersPrivate Masters Private BaccalaureatePrivate Baccalaureate
1987-19961987-1996 1998-20051998-2005 1987-19961987-1996 1998-20051998-2005 1987-19961987-1996 1998-20051998-2005
InstructionInstruction 2.2%2.2% 1.0%1.0% 1.8%1.8% 1.3%1.3% 1.0%1.0% 0.8%0.8%
ResearchResearch 1.9%1.9% 7.3%7.3% 2.2%2.2% 4.9%4.9% 4.7%4.7% 7.0%7.0%
Public ServicePublic Service 3.7%3.7% 0.4%0.4% 4.5%4.5% -2.0%-2.0% -2.8%-2.8% 4.5%4.5%
Academic SupportAcademic Support 2.8%2.8% 2.4%2.4% 2.1%2.1% 2.1%2.1% 1.8%1.8% 2.3%2.3%
Student ServicesStudent Services 3.5%3.5% 1.9%1.9% 3.1%3.1% 1.8%1.8% 3.0%3.0% 2.8%2.8%
Institutional Institutional SupportSupport 2.4%2.4% 1.6%1.6% 1.2%1.2% 1.9%1.9% 1.3%1.3% 1.1%1.1%
Operations and Operations and MaintenanceMaintenance 2.3%2.3% 0.9%0.9% 0.1%0.1% 0.2%0.2% 0.4%0.4% 0.9%0.9%
Institutional GrantsInstitutional Grants 6.5%6.5% 4.4%4.4% 8.6%8.6% 4.3%4.3% 8.7%8.7% 3.1%3.1%
+Source: The Delta Cost Project, 2008

Prices, Revenue, Spending: % Change Prices, Revenue, Spending: % Change 1998-99 to 2004-05, in 2005 CPI Adjusted $1998-99 to 2004-05, in 2005 CPI Adjusted $
Sector TypeSector Type
In-State In-State Undergraduate Undergraduate "Sticker" Price"Sticker" Price
Net Tuition Net Tuition Revenue per Revenue per
FTEFTE
Direct Direct Instructional Instructional Spending per Spending per
FTEFTE
Full Full Educational Educational
Spending per Spending per FTEFTE
Total E&G Total E&G Spending Spending per FTEper FTE
Public Public ResearchResearch 45.6%45.6% 34.6%34.6% 3.2%3.2% 0.2%0.2% 7.9%7.9%
Public MastersPublic Masters 42.3%42.3% 36.6%36.6% 2.7%2.7% 3.4%3.4% -3.0%-3.0%
Public Public AssociatesAssociates 28.5%28.5% 34.1%34.1% -1.3%-1.3% 0.3%0.3% -3.4%-3.4%
Private Private ResearchResearch 24.0%24.0% 16.7%16.7% 6.9%6.9% 4.5%4.5% 17.8%17.8%
Private MastersPrivate Masters 23.5%23.5% 19.0%19.0% 9.6%9.6% 10.9%10.9% 5.6%5.6%
Private Private BachelorsBachelors 22.6%22.6% 16.5%16.5% 5.9%5.9% 6.1%6.1% 4.6%4.6%
Measures of median spending per FTE student; Delta 19-year matched set.
Source: The Delta Cost Project, 2008

1919
All measures are mean $/FTE, data source Delta database 19-year matched
National Average Full Educational Cost per FTE at Public Institutions, 1998 and 2005
Source: The Delta Cost Project, 2008

All measures are mean $/FTE, data source Delta database 19-year matched
National Average Full Educational Cost per FTE at Private Institutions, 1998 and 2005
Source: The Delta Cost Project, 2008
How are students How are students paying?paying?

Ten-Year Trend in Funds Used to Ten-Year Trend in Funds Used to Finance Postsecondary Education Finance Postsecondary Education
ExpensesExpenses in Constant (2006) Dollars (in Billions), 1996-97 to in Constant (2006) Dollars (in Billions), 1996-97 to
2006-072006-07
Source: The College Board, Trends in Student Aid 2007

Growth of Federal, Growth of Federal, Institutional, and State Grant Institutional, and State Grant
Dollars Dollars in Constant (2006) Dollars (in in Constant (2006) Dollars (in Billions),1996-97 to 2006-07Billions),1996-97 to 2006-07
Source: The College Board, Trends in Student Aid, 2007

Growth of Stafford, PLUS, and Growth of Stafford, PLUS, and Nonfederal Loan DollarsNonfederal Loan Dollars
in Constant (2006) Dollars (in Billions), in Constant (2006) Dollars (in Billions), 1996-97 to 2006-071996-97 to 2006-07
Source: The College Board, Trends in Student Aid, 2007

Average Amount Borrowed (& Percent Average Amount Borrowed (& Percent Borrowing) from Federal and Private Borrowing) from Federal and Private
Sources, Full-Time Dependent Sources, Full-Time Dependent Undergraduates by Family IncomeUndergraduates by Family Income
in Constant (2006) Dollars, 1992-93 to 2003-04in Constant (2006) Dollars, 1992-93 to 2003-04
Sources: NPSAS: 1993, 1996, 2000, and 2004; calculations by authors. U.S. Census Bureau, Current Population Survey, Annual Social and Economic Supplement, 1992, 1995, 1999, and 2003. The College Board, Trends in Student Aid, 2007

Is it worth it?Is it worth it?

Notes: Taxes paid include federal income, Social Security, and Medicare taxes, and state and local income, sales, and property taxes.
Sources: U.S. Census Bureau, 2006, PINC-03; Internal Revenue Service, 2006; McIntyre et al., 2003; calculations by the authors. The College Board, Education Pays 2007
Median Earnings and Tax Payments of Full-Time Median Earnings and Tax Payments of Full-Time Year-Round Workers Ages 25 and Older, Year-Round Workers Ages 25 and Older,
by Education Level, 2005by Education Level, 2005

Estimated Cumulative Earnings Estimated Cumulative Earnings Net of Loan Repayment for Net of Loan Repayment for
Tuition and Fees, by Education Tuition and Fees, by Education LevelLevel
Note: Based on median 2005 earnings for each education level at each age and discounted using a 3 percent annual rate. Earnings for bachelor’s degree recipients include only those with no advanced degree. Assumes tuition and fees are financed with borrowing, and loan payments are made for 10 years after graduation.Sources: U.S. Census Bureau, 2006, PINC-03, PINC-04; The College Board, 2005; calculations by the authors. The College Board, Education Pays 2007.

What will the future What will the future bring?bring?
Key Variables: Ability to Key Variables: Ability to PayPay
Economic growth
Income distribution
Demographics

Key Variables: Cost and Key Variables: Cost and PricePrice
Innovations in instruction
Technical change
University governance
Government subsidies (state and federal)

The Role of SavingThe Role of Saving
Who can save?
New saving vs. asset allocation
Distribution of tax subsidies (deductions vs. credits)

The Role of Loans
Continued reliance
Flexible repayment options
Higher loan limits