the result analysis of the sound intensity level generated ... · the result analysis of the sound...
TRANSCRIPT
ICSV14 Cairns • Australia 9-12 July, 2007
1
THE RESULT ANALYSIS OF THE SOUND INTENSITY LEVEL GENERATED BY A HIGH POWER TRANSFORMER
Tomasz Boczar1, Marcin Lorenc1 and Dariusz Zmarzły1
1Opole University of Technology, Faculty of Electrical Engineering Automatic Control and Computer Science, Opole, Mikołajczyka 5, 45-271, Poland
[email protected] Abstract The paper presents the measurement results of the noise level of a power transformer. The noise sources occurring in the transformer are presented, and the method applied and the measuring tools used are characterized. The measurements were taken in 29 points located around the transformer. The evaluation of noise was carried out based on the revised coefficient of the acoustic pressure level. The research work results presented enable the evaluation of the influence of the noise of the unit under study on its environment and make it easier to diagnose the degrees of wear of the fans installed in transformer coolers.
1. INTRODUCTION
The operation of a power transformer is connected with the emission of noise into the environment, the sources of which are: cooler fans, magnetostriction vibrations of the core, pump operation etc. A transformer installed in a power station should be selected in such a way as the noise coming from its operation would not exceed allowable values defined in environmental standards. These standards define allowable levels of acoustic pressure that can occur in a transformer surrounding, depending on the place of its installation. Complying with the environmental standards referring to the allowable acoustic pressure level occurring around a transformer causes a lot of problems to technical service responsible for the operation of a given unit as well as to people responsible for observing environmental standards in power enterprises. Due to the wear processes of the particular transformer elements during its operation, the acoustic pressure level may gradually increase. Therefore it is advisable to take the measurements of the acoustic pressure level during a periodic inspection of the power transformer technical condition. Such examinations are required not only due to environmental reasons but they can also constitute additional criteria during the technical condition inspection of the cooling system elements.
The paper presents the comparison of the measurement results of the acoustic pressure levels occurring around two 240 MV·A power transformers. The research tests were carried out using an integrating meter of the sound level SVAN – 945A by the firm SVANTEK.
ICSV14 • 9-12 July 2007 • Cairns • Australia
2
2. MEASUREMENT TAKING METHODOLOGY
Transformer units under study were equipped with four coolers, three of which had fans forcing the flow of cooling air. In both transformers one of the coolers did not have fans installed.
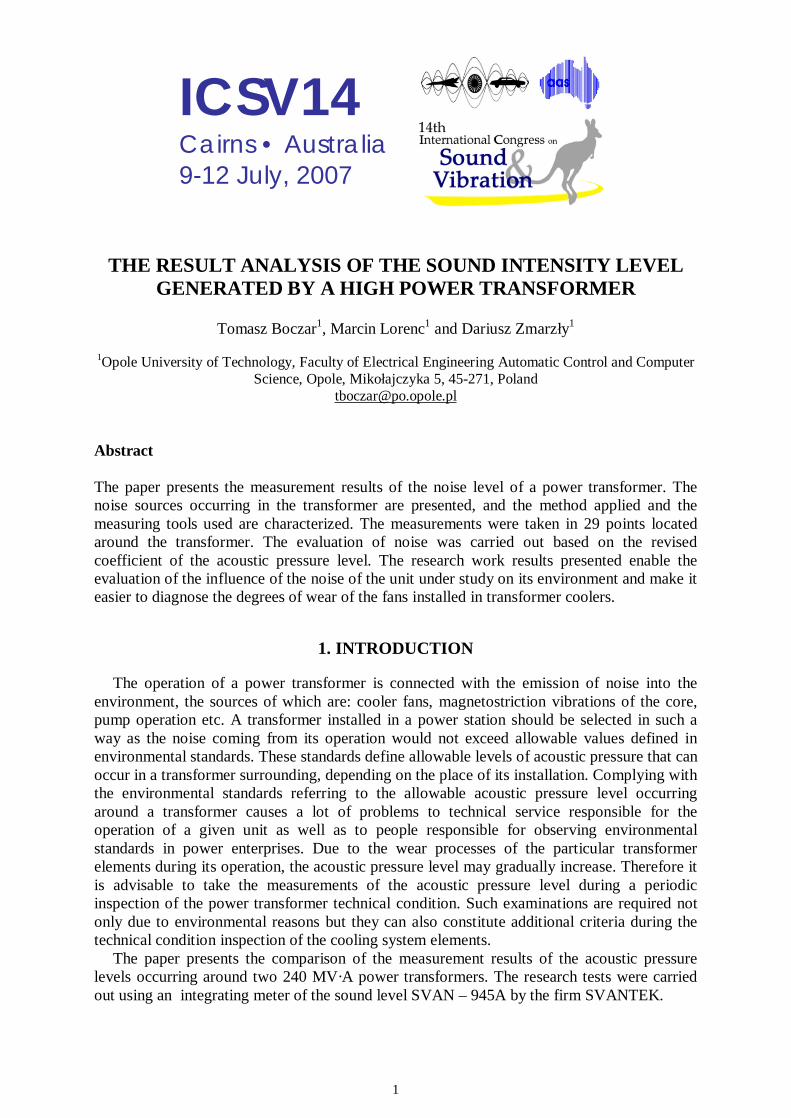
The overall view of the transformer under study is shown in Fig. 1.
Figure 1. Overall view of the transformer under study.
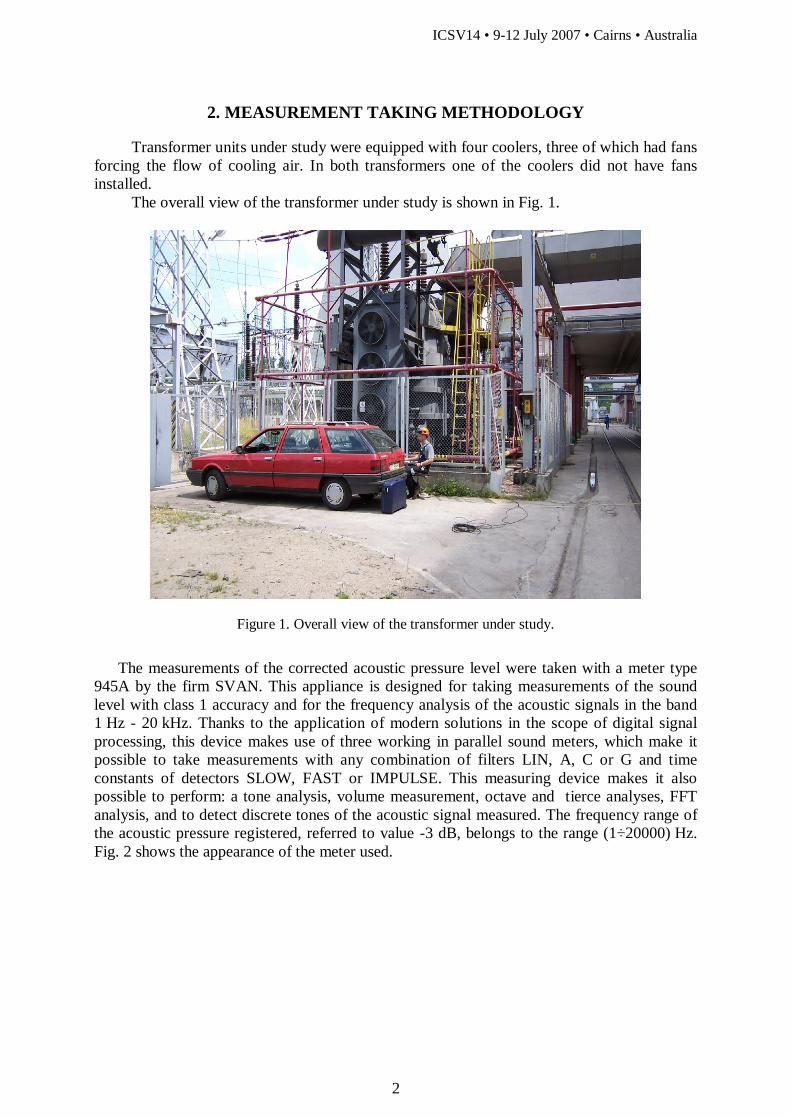
The measurements of the corrected acoustic pressure level were taken with a meter type 945A by the firm SVAN. This appliance is designed for taking measurements of the sound level with class 1 accuracy and for the frequency analysis of the acoustic signals in the band 1 Hz - 20 kHz. Thanks to the application of modern solutions in the scope of digital signal processing, this device makes use of three working in parallel sound meters, which make it possible to take measurements with any combination of filters LIN, A, C or G and time constants of detectors SLOW, FAST or IMPULSE. This measuring device makes it also possible to perform: a tone analysis, volume measurement, octave and tierce analyses, FFT analysis, and to detect discrete tones of the acoustic signal measured. The frequency range of the acoustic pressure registered, referred to value -3 dB, belongs to the range (1÷20000) Hz. Fig. 2 shows the appearance of the meter used.
ICSV14 • 9-12 July 2007 • Cairns • Australia
3
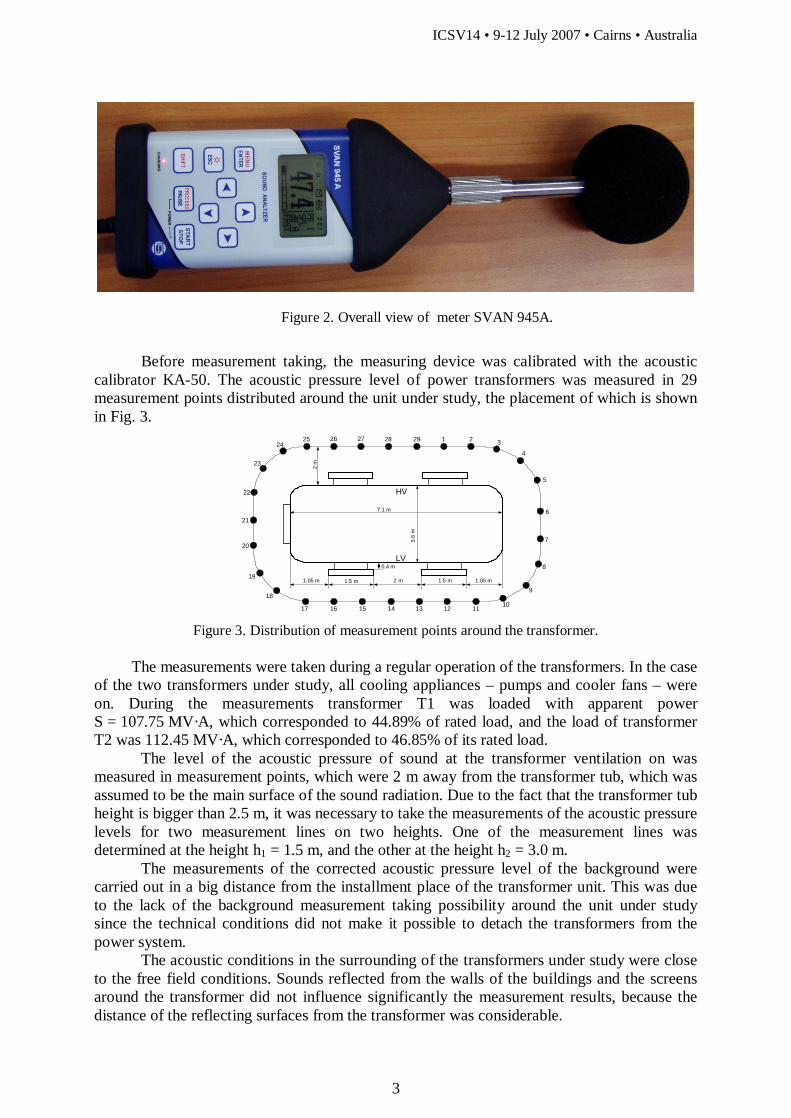
Figure 2. Overall view of meter SVAN 945A. Before measurement taking, the measuring device was calibrated with the acoustic
calibrator KA-50. The acoustic pressure level of power transformers was measured in 29 measurement points distributed around the unit under study, the placement of which is shown in Fig. 3.
3.6
m
7.1 m
HV
LV
1.05 m 1.05 m1.5 m 2 m 1.5 m
0,4 m
v
1 2 3
4
5
6
7
8
9
1011121314151617
18
19
20
21
22
23
2425 26 27 28 29
2 m
Figure 3. Distribution of measurement points around the transformer. The measurements were taken during a regular operation of the transformers. In the case of the two transformers under study, all cooling appliances – pumps and cooler fans – were on. During the measurements transformer T1 was loaded with apparent power S = 107.75 MV·A, which corresponded to 44.89% of rated load, and the load of transformer T2 was 112.45 MV·A, which corresponded to 46.85% of its rated load.
The level of the acoustic pressure of sound at the transformer ventilation on was measured in measurement points, which were 2 m away from the transformer tub, which was assumed to be the main surface of the sound radiation. Due to the fact that the transformer tub height is bigger than 2.5 m, it was necessary to take the measurements of the acoustic pressure levels for two measurement lines on two heights. One of the measurement lines was determined at the height h1 = 1.5 m, and the other at the height h2 = 3.0 m.
The measurements of the corrected acoustic pressure level of the background were carried out in a big distance from the installment place of the transformer unit. This was due to the lack of the background measurement taking possibility around the unit under study since the technical conditions did not make it possible to detach the transformers from the power system.
The acoustic conditions in the surrounding of the transformers under study were close to the free field conditions. Sounds reflected from the walls of the buildings and the screens around the transformer did not influence significantly the measurement results, because the distance of the reflecting surfaces from the transformer was considerable.
ICSV14 • 9-12 July 2007 • Cairns • Australia
4
Figure 4. View of the measuring device during the measurement at the power station.
3. MEASUREMENT RESULTS
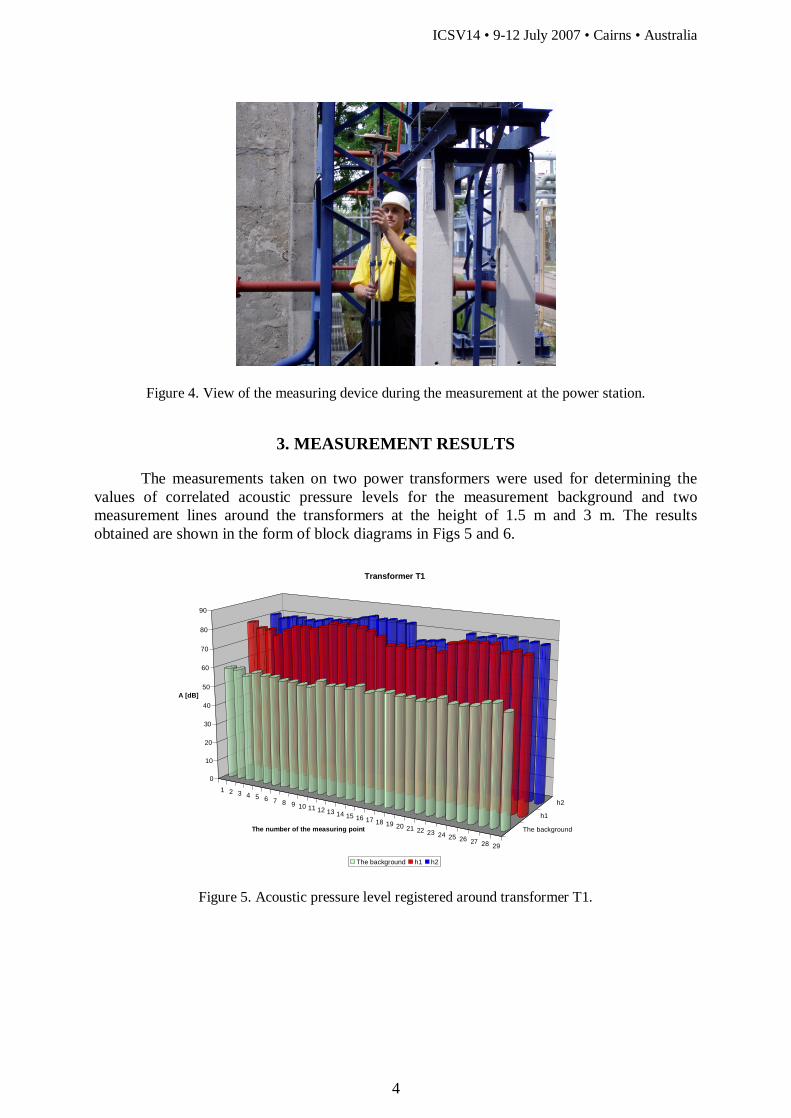
The measurements taken on two power transformers were used for determining the values of correlated acoustic pressure levels for the measurement background and two measurement lines around the transformers at the height of 1.5 m and 3 m. The results obtained are shown in the form of block diagrams in Figs 5 and 6.
1 2 3 4 5 6 7 8 9 10 11 12 13 14 15 16 17 18 19 20 21 22 23 24 25 26 27 28 29
The background
h1
h2
0
10
20
30
40
50
60
70
80
90
A [dB]
The number of the measuring point
Transformer T1
The background h1 h2
Figure 5. Acoustic pressure level registered around transformer T1.
ICSV14 • 9-12 July 2007 • Cairns • Australia
5
1 2 3 4 5 6 7 8 9 10 11 12 13 14 15 16 17 18 19 20 21 22 23 24 25 26 27 28 29
The background
h1
h2
0
10
20
30
40
50
60
70
80
90
A [db]
The number of the measuring point
Transformer T2
The background h1 h2
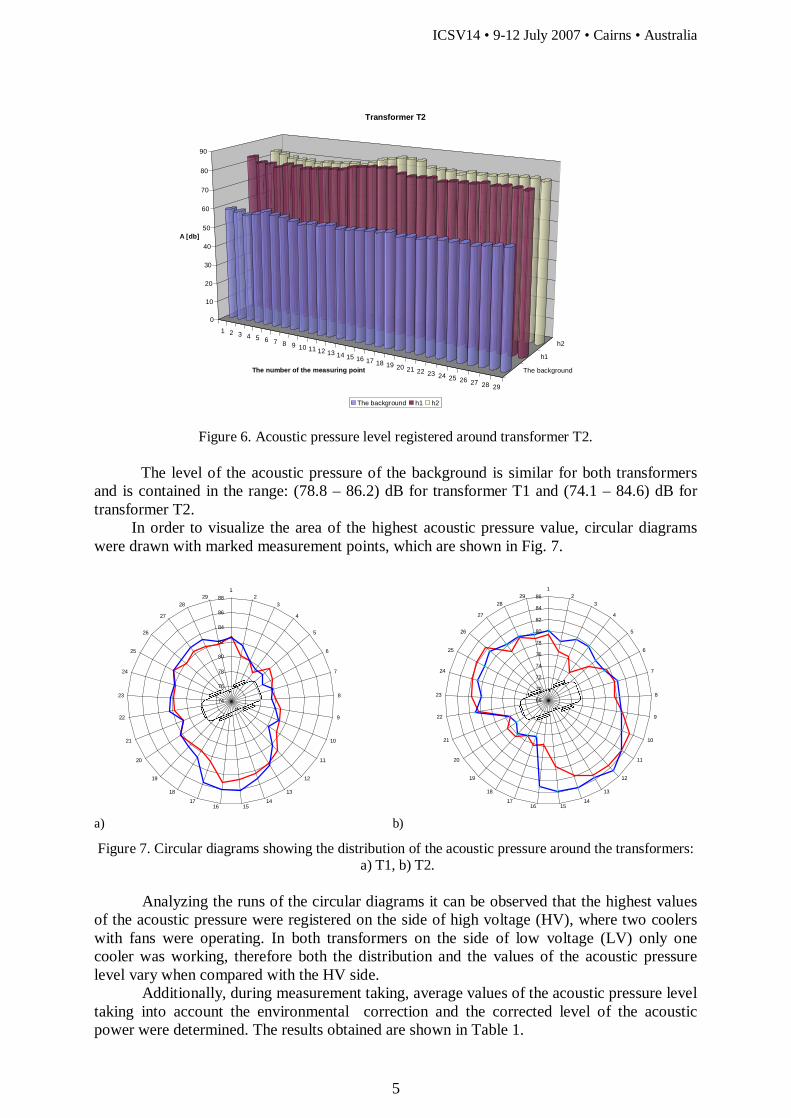
Figure 6. Acoustic pressure level registered around transformer T2.
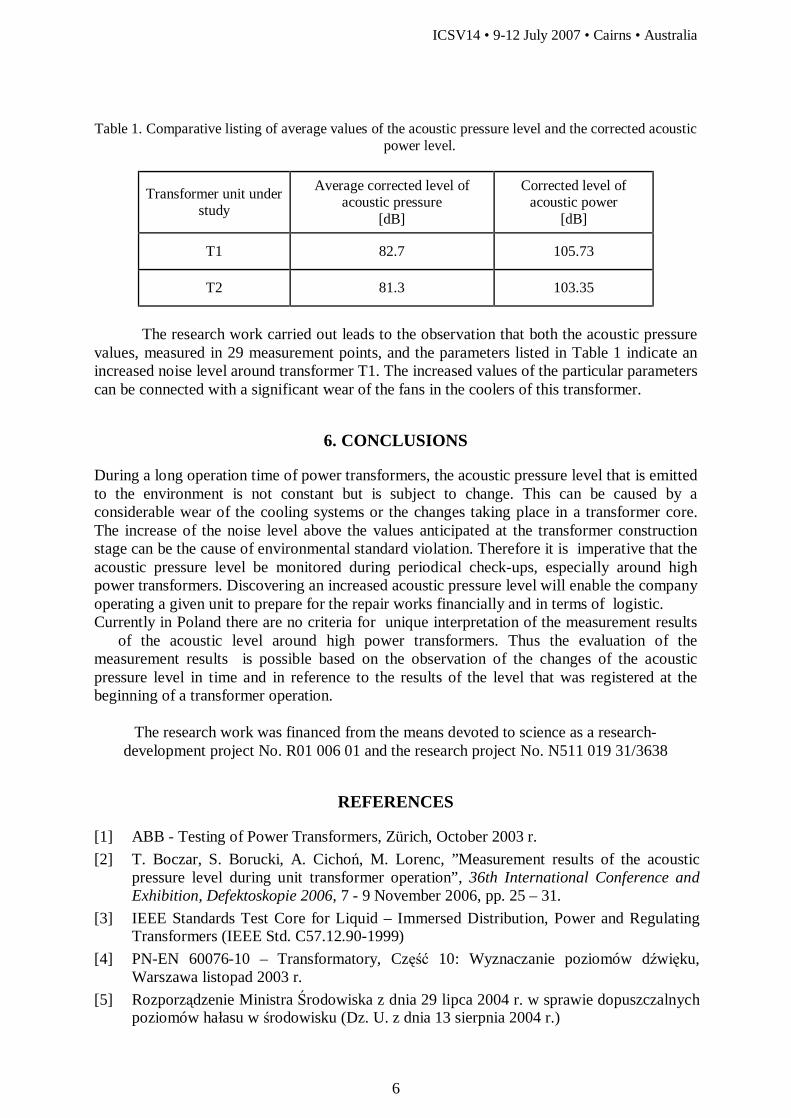
The level of the acoustic pressure of the background is similar for both transformers and is contained in the range: (78.8 – 86.2) dB for transformer T1 and (74.1 – 84.6) dB for transformer T2. In order to visualize the area of the highest acoustic pressure value, circular diagrams were drawn with marked measurement points, which are shown in Fig. 7.
a) b)
Figure 7. Circular diagrams showing the distribution of the acoustic pressure around the transformers: a) T1, b) T2.
Analyzing the runs of the circular diagrams it can be observed that the highest values
of the acoustic pressure were registered on the side of high voltage (HV), where two coolers with fans were operating. In both transformers on the side of low voltage (LV) only one cooler was working, therefore both the distribution and the values of the acoustic pressure level vary when compared with the HV side.
Additionally, during measurement taking, average values of the acoustic pressure level taking into account the environmental correction and the corrected level of the acoustic power were determined. The results obtained are shown in Table 1.
68 70 72 74 76 78 80 82 84 86 1
2 3
4 5
6 7
8 9
10 11
12 13
14 15 16 17 18
19 20
21 22 23
24 25
26 27
28 29
74 76 78 80 82 84 86 88 1
2 3
4 5
6 7
8 9
10 11
12 13
14 15 16 17 18
19 20
21 22 23
24 25
26 27
28
29
ICSV14 • 9-12 July 2007 • Cairns • Australia
6
Table 1. Comparative listing of average values of the acoustic pressure level and the corrected acoustic
power level.
Transformer unit under study
Average corrected level of acoustic pressure
[dB]
Corrected level of acoustic power
[dB]
T1 82.7 105.73
T2 81.3 103.35
The research work carried out leads to the observation that both the acoustic pressure
values, measured in 29 measurement points, and the parameters listed in Table 1 indicate an increased noise level around transformer T1. The increased values of the particular parameters can be connected with a significant wear of the fans in the coolers of this transformer.
6. CONCLUSIONS
During a long operation time of power transformers, the acoustic pressure level that is emitted to the environment is not constant but is subject to change. This can be caused by a considerable wear of the cooling systems or the changes taking place in a transformer core. The increase of the noise level above the values anticipated at the transformer construction stage can be the cause of environmental standard violation. Therefore it is imperative that the acoustic pressure level be monitored during periodical check-ups, especially around high power transformers. Discovering an increased acoustic pressure level will enable the company operating a given unit to prepare for the repair works financially and in terms of logistic. Currently in Poland there are no criteria for unique interpretation of the measurement results of the acoustic level around high power transformers. Thus the evaluation of the measurement results is possible based on the observation of the changes of the acoustic pressure level in time and in reference to the results of the level that was registered at the beginning of a transformer operation.
The research work was financed from the means devoted to science as a research-development project No. R01 006 01 and the research project No. N511 019 31/3638
REFERENCES
[1] ABB - Testing of Power Transformers, Zürich, October 2003 r. [2] T. Boczar, S. Borucki, A. Cichoń, M. Lorenc, ”Measurement results of the acoustic
pressure level during unit transformer operation”, 36th International Conference and Exhibition, Defektoskopie 2006, 7 - 9 November 2006, pp. 25 – 31.
[3] IEEE Standards Test Core for Liquid – Immersed Distribution, Power and Regulating Transformers (IEEE Std. C57.12.90-1999)
[4] PN-EN 60076-10 – Transformatory, Część 10: Wyznaczanie poziomów dźwięku, Warszawa listopad 2003 r.
[5] Rozporządzenie Ministra Środowiska z dnia 29 lipca 2004 r. w sprawie dopuszczalnych poziomów hałasu w środowisku (Dz. U. z dnia 13 sierpnia 2004 r.)
ICSV14 • 9-12 July 2007 • Cairns • Australia
7
[6] IEEE Standards Test Core for Liquid – Immersed Distribution, Power and Regulating Transformers (IEEE Std. C57.12.90-1999)