the response of lower atmospheric ozone to enso in aura ... · the response of lower atmospheric...
TRANSCRIPT

The Response of Lower Atmospheric Ozone to ENSO in Aura Measurements and a Chemistry-Climate Simulation
L. D. Oman1, A. R. Douglass1, J. R. Ziemke1,2, J. M. Rodriguez1 , D. W. Waugh3, J. E. Nielsen1,4
1NASA Goddard Space Flight Center, Greenbelt, MD, USA; 2Morgan State University, Baltimore, MD, USA; 3Johns Hopkins University, Baltimore, MD, USA; 4Science Systems and Applications Inc., Lanham, MD, USA
Aura Science Team Meeting, October 1-3, 2012, Pasadena, California Abstract: The El Nino-Southern Oscillation (ENSO) is the dominant mode of tropical variability on interannual time scales. ENSO appears to extend its influence into the chemical composition of the tropical troposphere. Recent work has revealed an ENSO-induced wave-1 anomaly in observed tropical tropospheric column ozone. This results in a dipole over the western and eastern tropical Pacific, whereby differencing the two regions produces an ozone anomaly with an extremely high correlation to the Nino 3.4 Index. We have successfully reproduced this feature using the Goddard Earth Observing System Version 5 (GEOS-5) general circulation model coupled to a comprehensive stratospheric and tropospheric chemical mechanism forced with observed sea surface temperatures over the past 25 years. An examination of the modeled ozone field reveals the vertical contributions of tropospheric ozone to the column over the western and eastern Pacific region. We will show composition sensitivity in observations from NASA’s Aura satellite Microwave Limb Sounder (MLS) and the Tropospheric Emissions Spectrometer (TES) and a simulation to provide insight into the vertical structure of these ENSO-induced ozone changes. The ozone changes due to the Quasi-Biennial Oscillation (QBO) in the extra-polar upper troposphere and lower stratosphere in MLS measurements will also be discussed.
https://ntrs.nasa.gov/search.jsp?R=20120016385 2018-07-14T00:06:04+00:00Z

The Response of Lower Atmospheric Ozone to ENSO in Aura Measurements and a
Chemistry-Climate Simulation
Luke Oman1, Anne Douglass1, Jerry Ziemke1, Jose Rodriguez1, Darryn Waugh2,
and J. Eric Nielsen1
1 NASA/GSFC 2 Johns Hopkins University
1
EOS Aura Science Team Meeting 10/3/12
• The El Niño Southern Oscillation is the dominant mode of tropical variability on interannual timescales (Philander, 1989).
• ENSO has been long known to cause significant perturbations to the coupled oceanic and atmospheric circulations (Bjerknes, 1969; Enfield, 1989).
• Changes in SST in the Pacific Ocean impact the Walker Circulation.
• ENSO is known to cause significant thermal and dynamical perturbations to the atmosphere and also influences the constituent distributions.
• To the extent that we believe climate change might impact the frequency or magnitudes of future ENSOs modeling its impact on trace gases becomes increasingly important.
2
El Niño Southern Oscillation

3
Simulation Description and Measurements Goddard Earth Observing System (GEOS) Chemistry-Climate Model (CCM)
• Using the combined GMI troposphere-stratosphere chemical mechanism
• 2 x 2.5 horizontal resolution with 72 vertical layers
• Time Slice 2005 simulation forced with observed sea surface temperatures from 1984-2009 but fixed in time natural and anthropogenic emission sources (2005)
Aura Satellite measurements: Microwave Limb Sounder (MLS) Level 2 Version 3.3 Aug. 2004 – Mar. 2012 Tropospheric Emission Spectrometer (TES) L3 V2 Sept. 2004 – Dec. 2009
Correlation of Tropospheric Column Ozone (TCO) and Nino3.4 Two Key Regions
Bryan Duncan’s Talk Wed. at 9:15 will discuss our work on the OEI and TCO

(Multiple) Linear Regression Analysis
are the different quantities that could influence ozone [e.g. for model just Niño 3.4 Index, for observations Niño 3.4 Index, QBO EOF1, and QBO EOF2]
are the sensitivities of ozone to the quantity
is the residual in the fit
are the changes in the different quantities
4

5
Example of the Time Series and Regression Analysis
Equatorial Central and Eastern Pacific at 100 hPa for MLS deseasonalized ozone measurements
Using ENSO and the first 2 EOF of the QBO the regression analysis reproduces much of the lower frequency variability but does not reproduce the higher frequency variability.
The bottom panel shows the individual contributions (sensitivity x predictor variable).

6
How does ozone and circulation respond to ENSO related variability?
The ozone field was deseasonalized and linearly regressed against Niño 3.4 Index
Overlaid is the streamfunction resulting from regressing zonal and vertical wind components against Niño 3.4 Index
Positive ozone sensitivity over Indonesia and Indian Ocean region. Negative ozone sensitivity over central and eastern Pacific that is largest in the upper troposphere.
Color contours show the CCMs ozone sensitivity to ENSO (ppbv/K)

7
MLS/TES and GEOS CCM ozone sensitivity averaged over the tropics
Negative ozone sensitivities are seen over the eastern and central tropical Pacific and throughout the lower stratosphere. Positive ozone sensitivities over Indonesia and the Indian Ocean.
Colored contours significant at 1 SD

8
MLS/TES and GEOS CCM ozone sensitivity to ENSO averaged over Eastern and Central Pacific Region
Ozone decreases near the equator with larger values in the UT/LS.
In the midlatitudes increases in ozone occur in the UT/LS which continue into the troposphere in the subtropics.
GEOS CCM shows the same general response although differences can be seen in the LS extratropics

9
MLS/TES and GEOS CCM ozone sensitivity to ENSO averaged over Indonesia and Indian Ocean Region
Ozone generally increases near the equator in troposphere but decreases in the LS.
In the midlatitudes differences in ozone response occur in the LS of the respective hemispheres.
GEOS CCM shows the same general response as the observation.
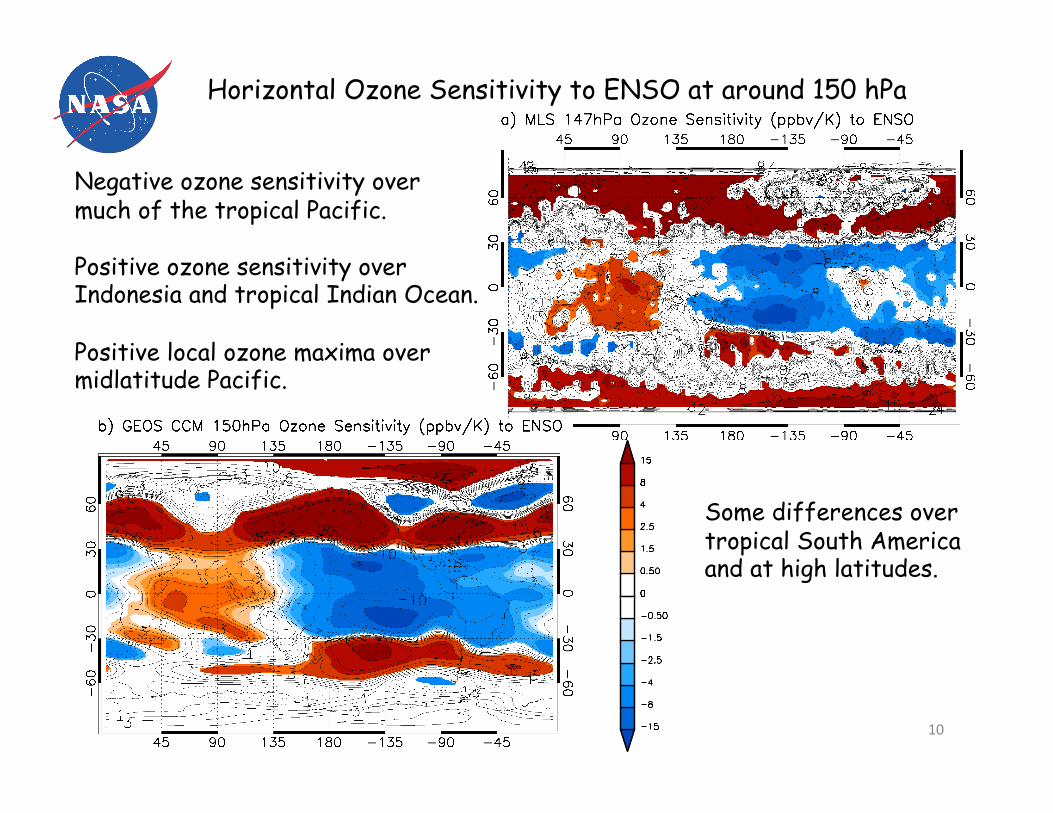
Horizontal Ozone Sensitivity to ENSO at around 150 hPa
10
Negative ozone sensitivity over much of the tropical Pacific.
Positive ozone sensitivity over Indonesia and tropical Indian Ocean.
Positive local ozone maxima over midlatitude Pacific.
Some differences over tropical South America and at high latitudes.

11
MLS/TES QBO Sensitivities
This preliminary work shows the ozone response to the first 2 EOFs of the QBO.
EOF1 is highly corr. 15 – 70 hPa winds.
QBO EOF2 is highly correlated with winds at 40 hPa so during westerly phase increased ozone in the tropical UT/LS with decreased ozone over midlatitude regions.
We have not yet explored the model response to the QBO but plan to soon.

Conclusions
• ENSO variations are an important driver of tropical tropospheric ozone variability.
• This ozone variability can be derived from MLS and TES measurements and appear to have very good continuity at 261 hPa.
• GEOS CCM can well represent this variability forced with observed SSTs.
• The ozone sensitivities to ENSO should be able to be reproduced by CCMs and is potentially useful in future CCM assessments.
12
Reference
Oman, L. D., J. R. Ziemke, A. R. Douglass, D. W. Waugh, C. Lang, J. M. Rodriguez, J. E. Nielsen, 2011: The Response of Tropical Tropospheric Ozone to ENSO, Geophys. Res. Lett. 38, L13706, doi:10.1029/2011GL047865.
Oman, L. D., A. R. Douglass, J. R. Ziemke, J. M. Rodriguez, D. W. Waugh, and J. E. Nielsen, 2012: The ozone response to ENSO in Aura satellite measurements and a chemistry climate model, submitted to J. Geophys Res.