the republic of korea: pim reform - the world...
TRANSCRIPT

0
Transforming Resources into Assets for Growth
C O U N T R Y C A S E S T U D Y
Jay Hyung-Kim
THE POWER OF PUBLIC INVESTMENT MANAGEMENT
2 0 1 2
The Republic of Korea PIM Reform after the Financial Crisis
Pub
lic D
iscl
osur
e A
utho
rized
Pub
lic D
iscl
osur
e A
utho
rized
Pub
lic D
iscl
osur
e A
utho
rized
Pub
lic D
iscl
osur
e A
utho
rized
Pub
lic D
iscl
osur
e A
utho
rized
Pub
lic D
iscl
osur
e A
utho
rized
Pub
lic D
iscl
osur
e A
utho
rized
Pub
lic D
iscl
osur
e A
utho
rized
PAGE 2
K O R E A
P I M R E F O R M A F T E R T H E F I N A N C I A L C R I S I S C O U N T R Y C A S E S T U D Y K O R E A
PIM Reform after the Financial Crisis
2 0 1 2
T H E P O W E R O F P U B L I C I N V E S T M E N T M A N A G E M E N T
Jay-Hyung Kim Senior Fellow Korea Development Institute
Adviser World Bank
THE AUTHOR
This case study is one of a number of country cases in the Public Investment Management Series The country case studies accompany the
volume ldquoThe Power of Public Investment Management Transforming Resources into Assets for Growthrdquo World Bank (2014) and apply a
common methodology to assess PIM systems globally
PAGE 3
K O R E A
P I M R E F O R M A F T E R T H E F I N A N C I A L C R I S I S C O U N T R Y C A S E S T U D Y K O R E A
PIM Reform after the Financial Crisis
2 0 1 2
T H E P O W E R O F P U B L I C I N V E S T M E N T M A N A G E M E N T
KOREA The financial crisis that hit the Republic of Korea in the second half of 1997 had a devastating impact on its economy causing the worst recession since the Korean War era To address the fundamental causes of the crisis and revitalize the economy the Korean Government took bold decisive steps to initiate comprehensive structural reforms The major focus of reform in the fiscal and public sector was to adopt a series of initiatives for strengthening public investment management The Government endeavored to instill a performance-oriented approach in the system which implies management of public expenditure based on the principle of value for money This chapter explains the institutional setting for public investment management (PIM) and the Korean Governmentrsquos efforts to develop and manage a comprehensive PIM reform to further improve value for the money invested The Ministry of Strategy and Finance played a leading role by implementing an effective appraisal and evaluation system to tighten the expenditure monitoring of total project cost and introducing a new budgeting system called the Medium Term Expenditure Framework An initiative of the preliminary feasibility study (PFS) introduced in 1999 and conducted mainly by the Public and Private Infrastructure Investment Management Center has been successful in handling the pass-or-fail bottleneck of the whole project selection process The total project cost management system (TPCM) strengthened after the crisis is working satisfactorily by discouraging the request frequency and the amount of TPC increases in line ministries A reassessment study of feasibility is an innovative tool to control and keep the total project cost limit in the middle of TPCM However the performance monitoring and evaluation system on PIM still has room for improvement in Korea A greater emphasis on program evaluation is being called for with the Government currently establishing a performance-orientation a greater use of performance contracts can be encouraged
PAGE 4
K O R E A
P I M R E F O R M A F T E R T H E F I N A N C I A L C R I S I S C O U N T R Y C A S E S T U D Y K O R E A
PIM Reform after the Financial Crisis
2 0 1 2
T H E P O W E R O F P U B L I C I N V E S T M E N T M A N A G E M E N T
Contents Trends in Public Investment Expenditure 1
Institutional Framework for PIM 7
Recent Change from Bottom-Up to Top-Down Budgeting 8 New Initiatives in Public Investment Management 9
Project Appraisal by Preliminary Feasibility Study 12
Initiative for a Preliminary Feasibility Study 12 Contents of PFS 14 PFS Evaluation Guidelines 17 Performance of PFS 17
Procurement and Capital Budget Implementation 20
TPCM Manages PIP Construction Budgets 20 TPCM by Project Phase 21 Reassessment Study of Feasibility and Reassessment of Demand Forecast 22 Performance of TPCM RSF and RDF 23
Performance Management and Evaluation of Completed Projects 26
Performance Monitoring System 27 Program Review System Self-Assessment of Budgetary Programs 28 Program Evaluation System In-Depth Evaluation Program 30
Lessons Learned and Challenges Ahead 31
References 32
Bibliography 34
Endnotes Error Bookmark not defined
Figures
Figure x1 General and Central Government Spending 1980ndash2008 2 Figure x2 General Government Spending by Function 1980ndash2008 2 Figure x3 Capital Formation Trends by Sector 1980ndash2008 of GNI 6 Figure x4 Size of Government Fiscal Lending (as of balance) 1990ndash2008 of GDP 6 Figure x5 Chronology of New Initiatives in Korearsquos PIM System 10 Figure x6 Implementation Process of Public Investment Management 12 Figure x7 Preliminary Feasibility Study Procedures 14 Figure x8 Outline of PFS Procedures and Contents 15 Figure x9 Structure of AHP in PFS 16 Figure x10 Result of Self-Assessment of Budgetary Programs 2005ndash07 of total ratings 29
PAGE 5
K O R E A
P I M R E F O R M A F T E R T H E F I N A N C I A L C R I S I S C O U N T R Y C A S E S T U D Y K O R E A
PIM Reform after the Financial Crisis
2 0 1 2
T H E P O W E R O F P U B L I C I N V E S T M E N T M A N A G E M E N T
Tables Table x1 Consolidated Fiscal Expenditure and Net Lending by Central Government by Function 3 ( of total) 3 Table x2 Trend of Facility Stock by Transport Sector 4 Table x3 Major Players in Korearsquos Budget Process 8 Table x4 Number of PFS Submitted by Sector 1999ndash2009 18 Table x5 Proportion of Feasible Projects by Sector 1999ndash2009 18 Table x6 Feasiblenon-feasible Projects according to BC Ratios (1999ndash2002) 19 Table x7 Feasiblenon-feasible Projects according to BC Ratios and AHP Scores (2003ndash2009) 20 Table x8 Number of Projects with Substantial Change in TPC 24 Table x9 Sources of in Total Project Cost Adjustment 24 Table x10 Trend of Requests for TPC Increase 25 Table x11 Number of RSF by Sector 2003ndash09 25 Table x12 Results of RSF (change in total project costs KRW billions) 25 Table x13 Systems of Performance Management and Evaluation 27 Table x14 Contents of Checklist for the SABP 28 Table x15 Linkage between SABP results and Budget Allocation 2007 KRW millions 30
PAGE 1
K O R E A
P I M R E F O R M A F T E R T H E F I N A N C I A L C R I S I S C O U N T R Y C A S E S T U D Y K O R E A
PIM Reform after the Financial Crisis
2 0 1 2
T H E P O W E R O F P U B L I C I N V E S T M E N T M A N A G E M E N T
The financial crisis that hit the Republic of Korea (ldquoKoreardquo) in the second half of 1997 had a devastating impact on its economy causing the worst recession since the Korean War era To address the fundamental causes of the crisis and revitalize the economy the Korean Government took bold decisive steps to initiate comprehensive structural reforms The major focus of reform in the fiscal and public sector was to adopt a market-oriented focus and managerial strategies to increase efficiency and transparency The Government endeavored to instill a performance-oriented approach in the system which implies management of public expenditure based on the principle of value for money
In the last decade the Korean Government adopted a series of integrated (ex ante intermediate and ex post) quality control efforts for efficient management of its public investment program The budget ministry established a strong and effective project appraisal scheme to provide oversight of the line ministriesrsquo project selection process The reforms include a formal review process to ensure that funds are continually subjected to monitoring and evaluation In addition budgeting for public investment was simplified by reducing the number of special accounts and government funds The Government in 2004 introduced the Medium Term Expenditure Framework (MTEF) with top-down budgeting for fiscal year 2005 The MTEF pointed to a need to enhance the capacity for planning and prioritizing public investment management (PIM) programs in the line ministries It also emphasized the need to change the role of the budget ministry as well
This chapter explains the institutional setting for PIM and the reform efforts of the Korean Government to develop and manage a comprehensive PIM program to further improve value for money invested The first section provides a brief summary of public investment expenditure trends in Korea followed by an outline of an institutional framework for public investment management The major players in the budget process are described and the reform efforts to pass the MTEF as well as recent PIM initiatives are examined Then an in-depth description focuses on how the public investment projects (PIPs) are selected prioritized and managed in the budget process beginning with a description of how the project appraisal is carried out up to the preliminary feasibility study Next the design of the total project cost management system from procurement implementation to performance management and the evaluation system are discussed Finally a summary presents challenges and recommendations for improving public investment selection prioritization management and budgeting procedures
Trends in Public Investment Expenditure The Korean Government increased public investment expenditure rapidly in response to
the growing demand for public services along with rapid economic development As a result general government (local and central) spending rose from 18 percent of GDP in 1987 to 30 percent in 2009 (figure x1) Central Government expenditure and net lending showed similar growth
PAGE 2
K O R E A
P I M R E F O R M A F T E R T H E F I N A N C I A L C R I S I S C O U N T R Y C A S E S T U D Y K O R E A
PIM Reform after the Financial Crisis
2 0 1 2
T H E P O W E R O F P U B L I C I N V E S T M E N T M A N A G E M E N T
Figure x1 General and Central Government Spending 1980ndash2008
Source System of National Accounts Bank of Korea (httpecosbokorkr) Government Finance Statistics Ministry of Finance and Strategy (httpwwwmosfgokr)
Figure x2 depicts the general growth rate of public expenditure by sector it shows a notable increase in welfare expenditure and a continuous decrease in defense expenditure The state welfare expenditure increased with the 1977 introduction of National Health Insurance (NHI) for firms with 500 or more employees After a series of expansions the NHI came to cover the entire population in 1989 and government expenditures increased accordingly1
Figure x2 General Government Spending by Function 1980ndash2008
Source Bank of Korea (httpecosbokorkr)
Note Welfare spending includes social protection health and housing and community services
PAGE 3
K O R E A
P I M R E F O R M A F T E R T H E F I N A N C I A L C R I S I S C O U N T R Y C A S E S T U D Y K O R E A
PIM Reform after the Financial Crisis
2 0 1 2
T H E P O W E R O F P U B L I C I N V E S T M E N T M A N A G E M E N T
In addition to the increase in welfare spending spending on economic affairs grew rapidly in the early 1990s with the launch of infrastructure improvements construction of roads subways dams and water supplies2 Traditionally economic affairs and education accounted for about 40 percent of total government spending the former being a slightly larger share Spending on economic affairs contributed to the fast expansion of economic infrastructure while spending on education supported the rise in enrollment rates which are currently close to 100 percent for primary and secondary education private as well as public schools depend heavily on Central Government funding (Colleges and universities are funded mainly by tuition)Table x1 distinguishes consolidated fiscal expenditure and net lending of the Central Government which provides detailed information on expenditure of economic affairs Spending on the transportation and communication sectors accounts for the largest part of expenditures on economic affairs while agriculture forestry fishing and hunting and mining manufacturing and construction hold the second and the third rank respectively Judging whether such fiscal allocation is reasonable and whether the expenditure size is feasible are both difficult tasks
Table x1 Consolidated Fiscal Expenditure and Net Lending by Central Government by Function ( of total)
Government Function Central Government Expenditure
1980 1990 2000 2008
General public services Defense
Public order and safety Education
Health Social protection
Housing construction and community amenities Recreation culture and religion
Economic affairs Fuel and energy
Agriculture forestry fishing and hunting Mining manufacturing and construction
Transportation and communication Other economic affairs Other expenditures
40 306 46
146 10 57 25 07
260 21 59 74 67 39
104
42 200 43
170 17 81
101 05
204 06
102 20 61 14
137
52 114 46
153 07
153 53 08
252 07 62 26 99 58
162
69 149 64
212 13
282 84 13
260 33 68 16
106 37
221
Total 1000 1000 1000 1000
Source MOSF (each year) Note Redemption of public funds (KRW 12 trillion) for year 2004 excluded
PAGE 4
K O R E A
P I M R E F O R M A F T E R T H E F I N A N C I A L C R I S I S C O U N T R Y C A S E S T U D Y K O R E A
PIM Reform after the Financial Crisis
2 0 1 2
T H E P O W E R O F P U B L I C I N V E S T M E N T M A N A G E M E N T
Examination of the transport sectormdashthe largest part of spending in economic affairsmdashshows a constant increase in facility stock (table x2) Road length has more than doubled from 1980 to 2008 Considering that these data do not reflect the increase in number of lanes road facilities in reality have expanded even further Indices for port loadunload capacity and capacity for airport facilities show rapid increases as well Transport facilities therefore do not appear to be a serious economic problem in Korea except for discussions on the need to increase investment in the railway sector
Table x2 Trend of Facility Stock by Transport Sector
Year
Road length Expressway length
Railway length Port loadunload capacity
Capacity for airport facility
(km) relative
indexa
(km) relative index
(km) relative index
(million ton)
relative index
(thousands of flights)
relative index
1980
1990
2000
2008
46951
56715
88775
104236
100
121
189
222
1225
1551
2131
3447
100
127
174
281
3135
3091
3123
3381
100
099
100
108
823
2243
4304
7586
100
273
523
922
1006
1331
2025
2222
100
132
201
221
Source Korea Development Institute 2004 Ministry of Land Transport and Maritime Affairs Statistics on Land Transport and Maritime Affairs
Note a Relative index according to 1980 stock level
Figure x3 shows that public investment expenditure by the Government in areas such as transport has taken an important role in total domestic investment Since 1970 the gross domestic investment ratio (which equals national total capital formationgross national disposable income) has been maintained at around 30 percent and the general government investment ratio (the general government capital formationgross national disposable income) at around 5 percent with the general government taking up about 15 percent of total investment General government public investment has increased since 2000 when the gross domestic investment ratio saw a slight decrease If public enterprises are included in the figure representation of investment by the public sector would far outweigh that of the general government
The Government has not focused only on infrastructure facility expansion in the process of economic development It has also more directly intervened in the market in order to resolve market failure especially failure of the financial markets One method used was fiscal lending Figure x4 examines the size of fiscal lending using two indices lending by the general government as indicated in Flow of Funds from the Bank of Korea (Bank of Korea var years) and loan
PAGE 5
K O R E A
P I M R E F O R M A F T E R T H E F I N A N C I A L C R I S I S C O U N T R Y C A S E S T U D Y K O R E A
PIM Reform after the Financial Crisis
2 0 1 2
T H E P O W E R O F P U B L I C I N V E S T M E N T M A N A G E M E N T
repayment by the Central Government as indicated in National Statement for Current Bonds (MOSF var years) announced by the financial authority Fiscal lending has reached a sizable amount the housing sector takes the biggest part and the small- and medium-sized enterprise (SME) sector and agricultural sector follow respectively
PAGE 6
K O R E A
P I M R E F O R M A F T E R T H E F I N A N C I A L C R I S I S C O U N T R Y C A S E S T U D Y K O R E A
PIM Reform after the Financial Crisis
2 0 1 2
T H E P O W E R O F P U B L I C I N V E S T M E N T M A N A G E M E N T
Figure x3 Capital Formation Trends by Sector 1980ndash2008 of GNI
Source MOSF internal data Bank of Korea Economic Statistics System (httpecosbokorkr)
Note Capital formation and investment to foreign country as ratio to gross national disposable income
Figure x4 Size of Government Fiscal Lending (as of balance) 1990ndash2008 of GDP
Source MOSF internal data Bank of Korea Economic Statistics System (httpecosbokorkr)
Note Government lending and loans as of 1968 System of National Accounts (SNA) before 2001 and as of 1993 SNA after 2002
PAGE 7
K O R E A
P I M R E F O R M A F T E R T H E F I N A N C I A L C R I S I S C O U N T R Y C A S E S T U D Y K O R E A
PIM Reform after the Financial Crisis
2 0 1 2
T H E P O W E R O F P U B L I C I N V E S T M E N T M A N A G E M E N T
Institutional Framework for PIM Major players in the budget process include the Ministry of Strategy and Finance (MOSF)
and the Board of Audit and Inspection (BAI) (see table x3) The MOSF is responsible for preparing the draft budget based on revenue forecasts of the Tax and Customs Office in the MOSF When the budget is authorized by the National Assembly the MOSF prepares the quarterly budget implementation plan usually within a month and allocates funds to line ministries The Treasury Bureau of the MOSF then prepares the monthly cash plan and releases cash to line ministries The Treasury Bureau keeps track of cash flows into and from the treasury single account held in the Bank of Korea It is also responsible for issuing government bonds and managing government assets and liabilities
An important issue concerning the interplay among various players is fiscal discipline The budget process has generally taken a highly centralized strategic dominance-based approach to maintaining fiscal discipline3 The MOSF plays a central role in budgeting as well as in preparing and implementing public investment programs Often the main budgeting decisions are made in bilateral negotiations between the budget authority and the spending ministry
The MOSF exercises tight control on public expenditures in the implementation stage Ministries are required to spend within the limits set in the quarterly budget implementation plan When deemed necessary the MOSF can postpone or block part of the expenditures All limits on expenditures are imposed in cash terms Transfers across appropriation accounts are prohibited unless authorized by the National Assembly or by the MOSF
The Treasury Bureau of the MOSF also has a tight grip on cash outflow All cash disbursements are made strictly within the limits set in the monthly cash plans Before the 1997 crisis it was not uncommon for the Treasury Bureau to delay disbursements to line ministries when there was not enough money left in the treasury account due to the seasonality of tax collection This was the case despite the fact that they could issue short-term debt instruments within the limit set by the National Assembly to bridge the gap between tax collection and cash needs In addition the revenue forecasts prepared by the Tax and Customs Office were often very conservative with the actual tax collection overshooting the forecast by substantial margins
PAGE 8
K O R E A
P I M R E F O R M A F T E R T H E F I N A N C I A L C R I S I S C O U N T R Y C A S E S T U D Y K O R E A
PIM Reform after the Financial Crisis
2 0 1 2
T H E P O W E R O F P U B L I C I N V E S T M E N T M A N A G E M E N T
Table x3 Major Players in Korearsquos Budget Process
Players Roles
Ministry of Strategy and Finance (MOSF)
x Compiles budget bids and prepares the draft budget x Allocates funds to spending ministries (apportionment) x Approves the transfers of funds between line items (virements)
Treasury Bureau of the MOSF
x Releases cash to spending ministries x Manages the treasury single account held in the Bank of Korea x Issues treasury bonds and manages assets and liabilities x Collects ministerial financial reports prepares the whole-of-
government financial reports and sends them to the BAI x Produces the government financial statistics
Tax and Customs Office of the MOSF
x In charge of tax policy x Prepares revenue forecasts x Oversees the National Tax Service and the Customs Service
Line ministries Execute the budget and prepare financial reports
Board of Audit and Inspection (BAI)
x The supreme audit institution in Korea whose head is nominated by and reports to the President The National Assembly can also request audits on specific issues to the BAI
x Checks the regularity of ministerial activities x Prepares and tables the financial report to the National
Assembly
National Assembly x Deliberates and votes on the budget x Approves the transfers of funds between programs x Reviews and approves audit reports
Some changes were observed in cash management and revenue forecast practices after the
1997 financial crisis Pressured to stimulate the economy and in particular to back up the front-loading4 of annual spending that has been popular since 1999 the MOSF resorted more and more to short-term debt instruments to bridge the gap between tax collection and cash needs The downward bias in revenue forecasts was also reduced In 2004 there had actually been a large shortfall in tax collection which was partly blamed on an overly optimistic assumption on the economic growth which was in turn claimed by some to have been politically motivated Now the democratization of Korean politics and the devolution of budgetary power to line ministries became an unavoidable trend
Recent Change from Bottom-Up to Top-Down Budgeting
The Korean Governmentrsquos budget process has undergone a significant change beginning when the Government introduced the Medium Term Expenditure Framework (MTEF) together with top-down budgeting in 2004 for fiscal year 20055 The reform was intended to address several defects found in the previous budgeting practice Prior to the introduction of the MTEF budgeting
PAGE 9
K O R E A
P I M R E F O R M A F T E R T H E F I N A N C I A L C R I S I S C O U N T R Y C A S E S T U D Y K O R E A
PIM Reform after the Financial Crisis
2 0 1 2
T H E P O W E R O F P U B L I C I N V E S T M E N T M A N A G E M E N T
was centered on the next single budget year and lacked a medium-term perspective The MOSF and the National Assembly gave little consideration to the out-years beyond the budget year Line ministries had little information on the extent of the resources that would be available to them in the future and their medium- to long-term planning function was severely limited It was also difficult for the MOSF to identify and cope with the trend towards increased public expenditure Without a long-term view on the appropriate level of the tax burden the MOSF would simply allow ever-increasing public spending to accommodate rising demands from various sectors
Before the introduction of the top-down process budgeting relied exclusively on a bottom-up approach At the initial stage of budget preparation the MOSF made rough estimates of the total size and the sectoral allocation of the next yearrsquos budget But the estimates were not transmitted to line ministries and therefore could not guide them in preparing their budget requests When reviewing the ministriesrsquo budget requests the MOSF focused on the microscopic spending control of individual public investment programs The sectoral allocation and the total size of the budget were determined at the last stage of budget preparation by aggregating the expenditures on individual programs As a result control of inputs assumed major significance in budget discussions and little attention was paid to outputs or outcomes The accountability and autonomy of line ministries in preparing and managing their budget was also severely limited Line ministries usually requested an unrealistically large amount of the budget and massive cuts were inevitable
With the introduction of the MTEF and top-down budgeting the process changed Now the annual budgeting exercise starts with a discussion on fiscal management over the next five years including the current year the budget year and three out-years Following this discussion the MOSF transmits spending ceilings for sectors and programs to line ministries6 These ceilings encompass the general and special accounts and funds Line ministries are now asked to prepare their budget requests within these ceilings When reviewing the ministerial budget requests the MOSF places less emphasis on the microscopic control of line items and more on the strategic alignment of budget requests with overall policy directions
New Initiatives in Public Investment Management
In order to enhance the efficiency of PIM the Korean Government in 1999 organized a cross-ministerial task force to develop an action plan The task force was jointly headed by Ministry of Planning and Budget7 (now MOSF) and the Ministry of Construction and Transportation (MOCT) (now Ministry of Land Transport and Maritime Affairs MLTMA) The MOCT issued ldquoA Comprehensive Plan to Enhance Efficiency of Public Investmentrdquo in July 1999 (MOCT 1999) Various policy measures were introduced to tackle the weaknesses of the existing public investment management system
One of the features of the new PIM system was to intensify the monitoring system of the project implementation process by the budgeting agency For example the MOSF now takes charge of the Preliminary Feasibility Studies (PFS) the results of which are reflected in the budget appropriation This arrangement represents a compromise between the MOSF which tried to take over the feasibility study function from the line ministries and the line ministries especially the
PAGE 10
K O R E A
P I M R E F O R M A F T E R T H E F I N A N C I A L C R I S I S C O U N T R Y C A S E S T U D Y K O R E A
PIM Reform after the Financial Crisis
2 0 1 2
T H E P O W E R O F P U B L I C I N V E S T M E N T M A N A G E M E N T
MLTMA which were resistant to the idea of transferring ownership of the feasibility study to the MPB Thus the PFS was ldquoinventedrdquo as a settlement to relieve the resistance from the line ministries
The Total Project Cost Management System (TPCM) in which the budget ministry checks the cost increase from the baseline throughout the project life was also strengthened Introduced in 1994 the TPCM was established as an effective measure of government expenditure management after the financial crisis Under the TPCM System the Reassessment Study of Feasibility (RSF) and Reassessment of Demand Forecast (RDF) were introduced in 1999 and 2006 respectively RSF and RDF reformulate feasibility studies and demand forecasts on projects under design development or construction and decide whether the project may continue The RSF guidelines and RDF system were developed and introduced after the PFS system was established The guidelines of RSF and RDF adopt the same analytical methodology as that of the PFS Figure x5 shows a brief chronology of PIM system evolution
Figure X5 Chronology of New Initiatives in Korearsquos PIM System
For line ministries the Government introduced the ex-post performance evaluation system in 1999 According to the MOCT Comprehensive Plan the line ministries were supposed to evaluate the performance of the project within three years after construction work is completed In 2000 the MOCT amended the Enforcement Decree of the Construction Technology Management Act to incorporate the initiatives included in the Comprehensive Plan The legal ground of PFS and TCPM resides in several laws their enforcement decrees and administrative guidelines such as the Budgeting and Accounting Act and the Fund Management Act In 2006 the National Finance Act combining several fiscal-related acts was legislated to stipulate diverse policy measures of PIM
With the establishment of a legal framework for public investment the PIM project was to be implemented in accordance with the process shown in figure x5 Throughout the process the MOSF produces information necessary for decision-making on budgeting through PFS FSF RDF
RSF guidelines
strengthened PE introduced
RSF guidelines developed
RDF introduced
The National Finance Act legislated
1994 1999 2005 2006
PFS introduced TPCM introduced
RSF introduced
9 TPCM (Total Project Cost Management) 9 PFS (Preliminary Feasibility Study)
9 RSF (Reassessment Study of Feasibility) 9 RDF (Reassessment of Demand Forecast) 9 PE (Performance Evaluation)
PAGE 11
K O R E A
P I M R E F O R M A F T E R T H E F I N A N C I A L C R I S I S C O U N T R Y C A S E S T U D Y K O R E A
PIM Reform after the Financial Crisis
2 0 1 2
T H E P O W E R O F P U B L I C I N V E S T M E N T M A N A G E M E N T
and in-depth program evaluation In the past line ministries provided selective information to procure more of the budget leading the MOSF to cut project budgets but not always on a reasonable basis New devices investigating the projects in detail made it possible for the MOSF to manage public investment more effectively
PAGE 12
K O R E A
P I M R E F O R M A F T E R T H E F I N A N C I A L C R I S I S C O U N T R Y C A S E S T U D Y K O R E A
PIM Reform after the Financial Crisis
2 0 1 2
T H E P O W E R O F P U B L I C I N V E S T M E N T M A N A G E M E N T
Figure X6 Implementation Process of Public Investment Management
Ex-Ante Intermediate Ex-Post
x TPCM(RSF amp RDF) x Performance Evaluation
x In-depth Program Evaluation
Note The bulleted items are under the aegis of MOSF
Project Appraisal by Preliminary Feasibility Study Improvement of a project appraisal system at the ex ante level is very important for
ensuring sound public expenditure As discussed the Ministry of Strategy and Finance introduced the preliminary feasibility study (PFS) to enhance efficiency in the early decision-making process of major infrastructure investment projects Throughout the project cyclemdashsuch as the stages of identification preparation implementation evaluation and so onmdashthe MOSF is interested in improving the methods of ex-ante appraisal at the preparation stage
Initiative for a Preliminary Feasibility Study
The PFS is a brief evaluation of a project to produce information for a budgetary decision A critical change is that the PFS is owned by the Ministry of Strategy and Finance (MOSF) Under the new procedure the MOSF established the Public Investment Management Center (PIMA) within the
Blueprint Design
Land Acquisition Construction
Draft Design Operation Maintenance
PFS
Feasibility Study
Strategic Planning
PAGE 13
K O R E A
P I M R E F O R M A F T E R T H E F I N A N C I A L C R I S I S C O U N T R Y C A S E S T U D Y K O R E A
PIM Reform after the Financial Crisis
2 0 1 2
T H E P O W E R O F P U B L I C I N V E S T M E N T M A N A G E M E N T
Korea Development Institute (KDI) with the mandate to conduct research and take an operational managing role in implementing the PFS procedures8
The PFS is conducted by a multi-disciplinary research team organized by PIMA (now PIMAC Public and Private Infrastructure Investment Management Center) typically consisting of economists transportation researchers and civil engineers The mix of specialists from different backgrounds and organizations helps to provide diverse ideas for the appraisal and improve the transparency and objectivity of the decision-making process The PFS Review Committee is organized by the MOSF with members of staff from the budget and line ministries PIMAC and field specialists Open discussions are held regularly on the PFS mid-term and final reports
The PFS process aims to enhance fiscal productivity by launching large-scale public investment projects based on transparent and objective ex-ante project evaluations The meaning of ldquopreliminaryrdquo is twofold first it means ldquoprovisionalrdquo evaluation a short and brief examination second it is an evaluation that precedes a (detailed) feasibility study The National Finance Act of 2006 provides the legal framework of PFS9 Before that legislation PFS was based on the Enforcement Decrees of the Budgeting and Accounting Act and the Fund Management Act these two laws were merged into the National Finance Act in 2006
The coverage of PFS is so extensive that it has made notable changes to the PIM system since its inception All new large-scale projects with a total cost of KRW50 billion (about US$50 million) or more are subject to the PFS With the National Finance Act the scope of the PFS was expanded to non-infrastructure projects (for example RampD) Local governments and PPI (private participation in infrastructure) projects are also subject to the PFS if the Central Government subsidy exceeds KRW30 billion
The following types of projects are exempted from the PFS typical building projects such as government offices and correctional institutions legally required facilities such as sewage and waste treatment facilities rehabilitating projects and restoration works from natural disasters projects implemented by international accords and by a SouthndashNorth Korea exchange and cooperation program and military facilities and projects related to national security
In every budget cycle of public infrastructure projects the PFS procedure is conducted as follows At the first stage a concerned line ministry submits a list of PFS candidate projects to the MOSF and the MOSF selects the PFS projects and requests PFS to PIMAC at KDI PIMAC organizes the research team conducts the PFS and submits the final PFS reports to the MOSF (figure x7) In the middle of conducting the PFS and making a final decision the PFS Review Committee takes charge of the whole review process
PAGE 14
K O R E A
P I M R E F O R M A F T E R T H E F I N A N C I A L C R I S I S C O U N T R Y C A S E S T U D Y K O R E A
PIM Reform after the Financial Crisis
2 0 1 2
T H E P O W E R O F P U B L I C I N V E S T M E N T M A N A G E M E N T
Figure x7 Preliminary Feasibility Study Procedures
Contents of PFS
The PFS is conducted in three phases background study main analyses and synthesis The background study reviews the statement of purpose and collects background data on socio-economic geographic and technical aspect of the project In addition key agendas for the main analyses are discussed in the background study through brainstorming
Line Ministry
Ministry of Strategy amp Finance
Korea Development Institute (Public and Private Infrastructure Investment Management Center)
Submit PFS projects candidate
Feasibility Study or Stop
Select PFS Projects
Request PFS
Make investment Decision
Announcement
Submit PFS Report
Organize Teams Conduct PFS
PAGE 15
K O R E A
P I M R E F O R M A F T E R T H E F I N A N C I A L C R I S I S C O U N T R Y C A S E S T U D Y K O R E A
PIM Reform after the Financial Crisis
2 0 1 2
T H E P O W E R O F P U B L I C I N V E S T M E N T M A N A G E M E N T
Figure x8 Outline of PFS Procedures and Contents
The main analyses in the PFS process are economic analysis policy analysis and balanced regional development analysis The backbone of the economic analysis is the cost-benefit analysis The economic benefit and economic cost of a project are estimated based on the forecasted demand The criteria of cost-benefit ratio NPV (net present value) and IRR (internal rate of return) are calculated based on the stream of annual benefit and cost As of 2007 a social discount rate of 55 percent in real terms is applied to the analysis based on the trend of risk free interstate rate in Korea
Policy analysis examines the potential effects of the projects in qualitative and quantitative terms including consistency with higher level policy possible project risk and other project-specific considerations In the consistency category the attitudes of the project owner and local residents toward the project and the level of preparedness of the project proposers are examined In the project risk category the risk of funding availability and the environmental risk of the project are evaluated
Balanced regional development analysis is an evaluation of the project from a regional perspective The regional backwardness index a composite index of eight characteristics for local entities was developed by the PFS guidelines The regional economic impact analysis is also conducted through the MRIO (Multi-Regional Input-Output) model
To synthesize the results of these economic policy and balanced regional development analyses the AHP (Analytic Hierarchy Process) technique is applied in the PFS AHP is a multi-
Project Proposal
Background Study
bull Review of Statement of purposebull Collect socio-economic
geographic and a technical data
bull Brainstorming (Other Alternatives)
bull PFS issues raised
Policy Analysis
bull Consistency with higher-level plan and policy directions
bull Project risk (financing and environmental impact)
bull Project-specific evaluation item
Balanced Regional Development Analysis
bull Regional backwardness index analysis
bull Regional Economic impact
Economic Analysis
bull Demand analysisbull Cost estimationbull Benefit estimationbull Cost-benefit analysisbull Sensitivity analysisbull Financial analysis
Analytic Hierarchy Process
bull Overall feasibilitybull Prioritizationbull Financing and policy
suggestion
Project ProposalProject Proposal
Background StudyBackground Study
bull Review of Statement of purposebull Collect socio-economic
geographic and a technical data
bull Brainstorming (Other Alternatives)
bull PFS issues raised
Policy AnalysisPolicy Analysis
bull Consistency with higher-level plan and policy directions
bull Project risk (financing and environmental impact)
bull Project-specific evaluation item
Balanced Regional Development Analysis
Balanced Regional Development Analysis
bull Regional backwardness index analysis
bull Regional Economic impact
Economic AnalysisEconomic Analysis
bull Demand analysisbull Cost estimationbull Benefit estimationbull Cost-benefit analysisbull Sensitivity analysisbull Financial analysis
Analytic Hierarchy ProcessAnalytic Hierarchy Process
bull Overall feasibilitybull Prioritizationbull Financing and policy
suggestion
PAGE 16
K O R E A
P I M R E F O R M A F T E R T H E F I N A N C I A L C R I S I S C O U N T R Y C A S E S T U D Y K O R E A
PIM Reform after the Financial Crisis
2 0 1 2
T H E P O W E R O F P U B L I C I N V E S T M E N T M A N A G E M E N T
criteria decision-making approach that enables user to combine quantitative and qualitative analyses into a decision through a hierarchical structure AHP is unique in providing a hierarchical framework to a complex problem by establishing majorminor factors and examining the importance of each factor through pair-wise comparison AHP enhances objectivity of decision-making by analyzing and managing the entire process of decision-making in steps and it ensures the consistency of weights derived from pair-wise comparison guaranteeing the robustness of decision-making
As a group decision support system AHP also enables the user to synthesize decisions of multiple decision makers Thus PFS team members comprising seven or eight experts from different organizations with different specialties rate the feasibility of a project through the AHP technique Diverse views on the level of feasibility are synthesized into a single score which results in a final decision on feasibility of a project
Figure x9 shows how AHP guides the synthesis of the analytical results of a project The PFS team sets the weight of each criterion through pair-wise comparison of each criterion against the others At the bottom level of the hierarchy are the two alternative judgments ldquoProject Implementationrdquo or ldquoStatus Quordquo (which means ldquoNot-Implementing the Projectrdquo) The score of the two alternatives are scaled to be summed up to 1 Hence if the Project Implementation alternative gets a score above 05 the project is evaluated as feasible
Figure X9 Structure of AHP in PFS
Overall FeasibilityOverall FeasibilityOverall FeasibilityOverall Feasibility
Economic AnalysisEconomic AnalysisBalanced Regional
Development AnalysisBalanced Regional
Development AnalysisPolicy AnalysisPolicy Analysis
Consistency with higher level planConsistency with higher level plan
Project riskProject riskProject-specific
factorProject-specific
factor
Attitu
de to
ward
the p
roje
ct
Attitu
de to
ward
the p
roje
ct
Consis
tency w
ith h
igher le
vel p
lan
Consis
tency w
ith h
igher le
vel p
lan
Pre
pare
dness
Pre
pare
dness
Pro
ject-
specific
item
(optio
nal)
Pro
ject-
specific
item
(optio
nal)
Fin
ancia
l feasib
ilityFin
ancia
l feasib
ility
Enviro
nm
enta
l impact a
ssessm
ent
Enviro
nm
enta
l impact a
ssessm
ent
Pro
ject-
specific
item
(optio
nal)
Pro
ject-
specific
item
(optio
nal)
Pro
ject-
specific
item
2
(optio
nal)
Pro
ject-
specific
item
2
(optio
nal)
Pro
ject-
specific
item
1
(optio
nal)
Pro
ject-
specific
item
1
(optio
nal)
Pro
ject-
specific
item
(optio
nal)
Pro
ject-
specific
item
(optio
nal)
Regio
nal e
conom
ic im
pacts
Regio
nal e
conom
ic im
pacts
Regio
nal b
ackw
ard
ness a
naly
sis
Regio
nal b
ackw
ard
ness a
naly
sis
Project ImplementationProject ImplementationProject Implementation Status QuoStatus QuoStatus QuoAlternativesAlternativesAlternatives
Level 1
Level 2
Level 3
PAGE 17
K O R E A
P I M R E F O R M A F T E R T H E F I N A N C I A L C R I S I S C O U N T R Y C A S E S T U D Y K O R E A
PIM Reform after the Financial Crisis
2 0 1 2
T H E P O W E R O F P U B L I C I N V E S T M E N T M A N A G E M E N T
PFS Evaluation Guidelines
PFS is based on three pillars of quality objectivity consistency and transparency In order to improve the objectivity of the evaluation and secure consistency among projects PIMAC developed evaluation guidelines PFS guidelines are detailed descriptions of methodology and procedures of PFS implementation PFS guidelines cover the following sectors roads railways ports airports dams and cultural facilities The guidelines stipulate that the same methodology is applied and the same or a similar dataset is used for different projects in the same sector For example the KT_DB (Korea Transport Database) should be used for all the road and railroad projects for consistency in evaluation results These guidelines are continuously revised through academic research The PFS guidelines for road and railroad projects in its fifth edition in 2009 provide specific procedures for assessing road projects (see box x1)
Box x1 How a Road Project Is Assessed in PFS Methodology cost-benefit analysis
x Criteria BC NPV (Net Present Value) IRR (Internal Rate of Return) x Social Discount Rate 55 percent (real term) x Duration Roads railways and seaports (30 yr) dams and water supply facilities (50 yr) x Tax is excluded but salvage value is included
Benefit of road project x Valuation of changes in route and travel speeds due to the project x Savings in travel time vehicle operation costs traffic accidents and environmental costs (air and noise
pollution) A multi-criteria decision-making approach by AHP (Analytical Hierarchy Process)
x Combines quantitative and qualitative criteria for decisions under a hierarchical structure x A group decision support system x Hierarchical structuring x Pair-wise comparison
Performance of PFS
Based on the PFS results only a project that has been assessed and meets the investment criteria can be approved and implemented Table x4 shows the number of PFS conducted from 1999 to 2009 A total of 437 projects were evaluated among which road (188 projects) and railway projects (79 projects) were dominant totals included 27 seaport projects 32 culture and tourism projects 34 water supply projects and 77 other projects Other projects included construction projects for welfare facilities airports and industrial complexs among others
PAGE 18
K O R E A
P I M R E F O R M A F T E R T H E F I N A N C I A L C R I S I S C O U N T R Y C A S E S T U D Y K O R E A
PIM Reform after the Financial Crisis
2 0 1 2
T H E P O W E R O F P U B L I C I N V E S T M E N T M A N A G E M E N T
Table x4 Number of PFS Submitted by Sector 1999ndash2009
Sector 1999 2000 2001 2002 2003 2004 2005 2006 2007 2008 2009 Sum Road 11 11 20 9 11 24 11 27 30 12 22 188
Railway 2 7 14 8 7 13 6 10 5 2 5 79
Seaport 1 5 1 2 3 1 2 5 1 4 2 27
Culture and Tourism
3 2 5 2 5 2 1 5 2 3 2 32
Water Resources
1 1 0 5 5 3 3 1 1 2 12 34
Others 1 4 1 4 2 12 7 4 7 15 20 77
Sum 19 30 41 30 33 55 30 52 46 38 63 437
Source Internal data (1999ndash2009) from PIMAC KDI
Table x5 shows the proportions of feasible projects 256 projects or 586 percent of 437 projects were evaluated as feasible The proportion of feasible projects for the road sector is 564 percent The highest rate of feasibility was for seaport projects at 778 percent and the projects in the culture and tourism sector had the lowest feasibility rate at 435 percent
Table x5 Proportion of Feasible Projects by Sector 1999ndash2009
of Submitted Projects Rated Feasible
Project Sector 1999 2000 2001 2002 2003 2004 2005 2006 2007 2008 2009 Total Projects (A)
Total Feasible Projects (B)
(B)(A) ()
Road 455 273 300 333 727 875 364 630 633 750 500 188 106 564
Railway 500 571 357 750 714 538 833 400 250 1000 800 79 44 557
Seaport 1000 800 1000 500 1000 1000 1000 400 1000 1000 500 27 21 778
Culture and tourism 1000 - 400 - - 1000 1000 400 500 1000 - 32 14 438
Water resources 1000 1000 - - 600 667 667 1000 1000 500 917 34 23 676
Others 1000 750 - 750 500 667 714 500 429 467 789 77 48 623
Average 632 500 341 433 606 745 633 538 565 684 677 437 256 586
Source Internal data (1999ndash2009) from PIMAC KDI Note mdash not applicable
Tables x6 and x7 show the results of PFS in terms of BC ratio and AHP score Until 2002 no technique was employed to combine BC ratio and the results of policy analyses Thus the overall PFS result was that a proposed project was announced as feasible or non-feasible along with the BC ratio During 1999ndash2002 nine projects were evaluated as non-feasible despite the fact that their BC ratios were greater than 1 The reasons were mostly their potential negative environmental impacts and difficulties in funding availability for local government projects On the
PAGE 19
K O R E A
P I M R E F O R M A F T E R T H E F I N A N C I A L C R I S I S C O U N T R Y C A S E S T U D Y K O R E A
PIM Reform after the Financial Crisis
2 0 1 2
T H E P O W E R O F P U B L I C I N V E S T M E N T M A N A G E M E N T
other hand 10 projects were evaluated as feasible with BC less than 1 The most important reason was a consideration of balanced regional development
Table x6 Feasiblenon-feasible Projects according to BC Ratios (1999ndash2002) Project numbers rated feasible or non-feasible
Year BC ge 1 BC lt 1
Total (A)
Feasible Non- feasible Feasible Non-
Feasible Feasible (B)
(B)(A) ()
1999 8 1 5 6 20 13 650
2000 14 3 1 12 30 15 500
2001 12 2 2 25 41 14 341
2002 11 3 2 14 30 13 433
Total ()
45 (372)
9 (74)
10 (83)
57 (471)
121 (1000) 55 455
Source Internal data (1999-2009) from PIMAC KDI
Table x7 shows the PFS results during 2003ndash09 In 2003 the AHP technique was officially employed to synthesize the economic and policy analyses From then on the PFS results were announced in terms of BC and AHP score Over that period 202 projects or 639 percent of 316 projects were evaluated and rated as feasible Five projects with BC greater than 1 received AHP scores of less than 05 and eventually were deemed non-feasible On the other hand 61 projects with BC less than 1 received AHP scores greater than 05
The PFS has contributed to enhance the fiscal efficiency of the PIM project selection process by preventing non-feasible projects from being launched During 1999ndash2009 a total of 437 PFS evaluations were conducted and the projects deemed non-feasible saved taxpayers funds that could be allocated to other uses
PAGE 20
K O R E A
P I M R E F O R M A F T E R T H E F I N A N C I A L C R I S I S C O U N T R Y C A S E S T U D Y K O R E A
PIM Reform after the Financial Crisis
2 0 1 2
T H E P O W E R O F P U B L I C I N V E S T M E N T M A N A G E M E N T
Table x7 Feasiblenon-feasible Projects according to BC Ratios and AHP Scores (2003ndash2009)
Project numbers rated feasible or non-feasible
Year BC ge 1 BC lt 1
Total (A)
AHPge 05
AHPlt 05
AHPge 05
AHPlt 05
Feasible (B)
(B)(A) ()
2003 18 0 2 13 33 20 606 2004 27 1 14 13 55 41 745 2005 15 1 4 10 30 19 633 2006 21 2 7 22 52 28 538 2007 19 0 7 20 46 26 565 2008 16 0 10 12 38 26 684 2009 25 1 17 19 62 42 677 Total ()
141 (446)
5 (16)
61 (193)
109 (345)
316 (1000) 202 639
Source Internal data (1999-2009) from PIMAC KDI
Procurement and Capital Budget Implementation Procurement and capital budget implementation on public investment programs and
projects has been managed mostly by a budget management system called the Total Project Cost Management System (TPCM) in the Ministry of Strategy and Finance TPCM aims to enhance fiscal productivity and to ensure a high quality of public construction work by properly adjusting and managing total project costs (TPC) throughout the implementation stages of a project The MOSF established the TPCM in 1994 and revises the ldquoGuidelines for Total Project Cost Managementrdquo on an annual basis
TPCM Manages PIP Construction Budgets
According to the National Finance Act the following types of construction projects are subject to the TPCM system
x Projects implemented by the Central Government or its agents or by local governments or private institutions relying on Central Government funding
x Projects with a construction period exceeding two years and
x Civil engineering projects whose TPC exceeds KRW 30 billion (USD 30 million) or architectural projects whose TPC exceeds KRW 10 billion (USD 10 million)
The TPC includes all cost items accrued throughout the life of the project including design land acquisition and construction costs regardless of whether the source of funding is the Central Government local governments or private institutions
Project costs should be managed by construction phase and by construction unit in reference to total construction cost The construction costs are not arbitrarily interchangeable between project
PAGE 21
K O R E A
P I M R E F O R M A F T E R T H E F I N A N C I A L C R I S I S C O U N T R Y C A S E S T U D Y K O R E A
PIM Reform after the Financial Crisis
2 0 1 2
T H E P O W E R O F P U B L I C I N V E S T M E N T M A N A G E M E N T
phases or between construction units When increases in construction size or costs are expected and even inevitable the minister in charge of the project must consult with the MOSF about adjusting the TPC
TPCM by Project Phase
The TPCM guidelines of the MOSF describe in detail how the rules and regulations of project management are carried out by project phase
Project conception phase The minister in charge of the project should make an appropriate estimate of the total cost and duration of the project and ask the MOSF for a PFS if the estimated total cost in the project conception phase is KRW 50 billion or more For local government projects the minister in charge should ask MOSF for a PFS if the funding of the project relies on a Central Government subsidy of KRW 30 billion or more
Phases of PFS and a (detailed) feasibility study The minister in charge should report on the project size TPC and project duration to MOSF for all the projects that have been evaluated as feasible by PFS and should ensure that the budget is drawn up by the end of January Detailed feasibility studies should cover the life cycle cost of the projects resulting from all technological environmental social and financial aspects as well as from land acquisition
Draft design phase The project management should ensure that enough money and time is spent on the draft design to prevent significant and frequent design modifications in the following construction phases The design team should collect various opinions from target citizens interests groups and related government authorities in order to minimize public discontent expected in the construction phase The minister in charge should consult value-engineering (VE) experts at least once before the end of this phase to prevent overestimation of costs and excessive construction
Blueprint design phase Size of the construction should not be modified significantly in this phase When it appears that a design modification or change in construction size is inevitable the minister in charge should discuss the matter with the MOSF The minister should also consult value-engineering experts at least once before the end of this phase to prevent overestimation of costs and excessive construction
Contracting phase MOSF informs the Administer of the Office of Supply Administration of the total construction cost after discussing it with the minister in charge When the contract cost exceeds the informed cost the Administer of the Office of Supply Administration should discuss the matter with the Minister of Strategy and Finance
Construction phase The minister in charge should try to minimize cost increases except when new construction techniques or new equipments are to be introduced to enhance the quality of the product substantially When an increase in costs change in construction size or change in construction duration are inevitable the minister in charge should submit a written explanation and discuss it with the Minister of Strategy and Finance
PAGE 22
K O R E A
P I M R E F O R M A F T E R T H E F I N A N C I A L C R I S I S C O U N T R Y C A S E S T U D Y K O R E A
PIM Reform after the Financial Crisis
2 0 1 2
T H E P O W E R O F P U B L I C I N V E S T M E N T M A N A G E M E N T
The line ministry is allowed to set construction contingencies for up to 8 percent of the contract price of a project to cope with inevitable design modification and amendment of the law and so on The line ministry can use its own discretion to change the TPC within the limit of these contingencies Contingencies apply only to the construction phase of a project
In general an increase in construction size through design modification is not allowed except for inevitable cases The base cost for a TPCM system is the contract cost determined by bidding not the cost estimate at design phase ldquoThe indicator adjustment formulardquo set by the Office of Supply Administration is applied to recalculate project costs incorporating inflationary effects
When a project under implementation violates the TPCM guidelines the Minister of Strategy and Finance can cut off or withhold budget allocation for the project The minister in charge can impose sanctions prohibiting invitation to tendering of construction projects on design teams when their work has resulted in a substantial cost increase due to unsatisfactory performance or when they intentionally or unintentionally fail to estimate the appropriate construction costs or sizes The minister in charge can petition the Minister of Strategy and Finance for changes in costs and project duration at any time through the Budget Information Management System when necessary
Reassessment Study of Feasibility and Reassessment of Demand Forecast
The Reassessment Study of Feasibility (RSF) aims to check unnecessary cost increases by re-affirming the feasibility of projects under implementation and scrutinizing the adequacy of the cost increase The MOSF conducts the RSF on a project if the PFS has not been conducted although it falls under the PFS coverage or if the TPC has increased by more than 20 percent (excluding inflationary effects and increase in land acquisition cost) of the cost confirmed by the Minister of Strategy and Finance at the previous phase of the project Also according to the amendment of the National Finance Act in 2009 the Board of Audit and Inspection is entitled to request that the MOSF conduct an RSF if there is a need
The line ministries conduct the RSF on a project with miscellaneous changes in construction costs and report it to the Minister of Strategy and Finance The RSF guidelines suggest that the RSF should include but should not be limited to the following components
x Outline of a project
x Analysis of background data and project issue raised
x Analysis on adequacy of the plan including size of the project
x Economic analysis including cost-benefit analysis
x Policy analysis
x Overall assessment including judgment on whether or not to continue a project and if the TPC increase is adequate
Based on these analyses the RSF team makes an overall assessment including a judgment as to whether or not to continue a project and if the TPC increase is adequate While the PFS focuses
PAGE 23
K O R E A
P I M R E F O R M A F T E R T H E F I N A N C I A L C R I S I S C O U N T R Y C A S E S T U D Y K O R E A
PIM Reform after the Financial Crisis
2 0 1 2
T H E P O W E R O F P U B L I C I N V E S T M E N T M A N A G E M E N T
on evaluating the feasibility of a project RSF puts relatively more emphasis on finding alternatives to cut down the size and cost of a project The MOSF reflects the RSF results in adjusting the TPC When the RSF results show that a project has turned out to be unfeasible the RSF team works on curtailing project size with the intent of improvinh its feasibility When no alternative way to secure the feasibility of the project is found the MOSF decides whether to stop implementing the project
Reassessment of demand forecast (RDF) is a device that verifies the adequacy of the demand forecast for a public investment project conducted in the past with the latest information By minimizing inevitable forecasting error RDF aims to improve the efficiency of expenditure and to prevent squandering of financial resources by managing demand fluctuation of large-scale long-term infrastructure projects throughout the phases of a project
The transportation facilities including roads rail airports and ports that are subject to TPCM are also subject to RDF if required The RDF is to be conducted during any of the following phases when the requirements for the reassessment are met (1) before or during completion of the basic plan or feasibility study (2) before or during completion of draft design (3) before or during completion of detailed design (4) during the construction period andor (5) when it is deemed necessary by the Minister of Strategy and Finance or the head of Central Government agency either of whom may request a RDF before or during a feasibility study or design development
The RDF shall be conducted when there are substantial changes in demand forecasts as stipulated in the following (1) when the RDF is deemed necessary because a significant decrease of demand is anticipated due to material changes in the premises on which previous demand forecasts had been made or errors had been made during implementing the methodology for demand forecasts (2) when the RDF is deemed necessary because a project has been converted to a PPP project from a conventional government procured project (3) when more than five years have passed since the latest demand forecast had been conducted andor (4) when it is deemed necessary by the Minister of Strategy and Finance or the head of line ministry
The RDF virtually belongs to the MOSF In order to ensure objectivity and transparency during the RDF process the Minister of MOSF or the minister of the line ministry responsible for the RDF may contract a specialized institution(s) to conduct the RDF When the RDF is completed the Minister of MOSF notifies the minister of line ministries of the results When it is identified that the demand forecast for a project has decreased by 30 percent or more however the MOSF begins RSF and notifies the minister of line ministries in accordance with RSF guidelines
Performance of TPCM RSF and RDF
Table x8 shows the total number of Total Project Cost Management System (TPCM) projects and the projects in which the total project costs (TPC) were adjusted during 1994ndash2005 The total number of TPCM projects increased sharply in 1999 when the PIM system was established in a rigorous way The proportion of projects for which TPC were required shows an increase from 540 percent in 2002 to 718 percent in 2005 However the percentage of projects for
PAGE 24
K O R E A
P I M R E F O R M A F T E R T H E F I N A N C I A L C R I S I S C O U N T R Y C A S E S T U D Y K O R E A
PIM Reform after the Financial Crisis
2 0 1 2
T H E P O W E R O F P U B L I C I N V E S T M E N T M A N A G E M E N T
which the TPC rose by more than substantially decreased from 119 percent in 1996 to 37 percent in 2004
Table x8 Number of Projects with Substantial Change in TPC
Year No Projects under PCM (A)
No Projects that TPC adjusted (B)
BA() No Showing Increase in TPC by over 20 (C)
(C)(A) ()
1994 218 - -
1995 207 19 92
1996 159 19 119
1997 189 20 106
1998 183 17 93
1999 459 15 33
2000 483 24 50
2001 602 26 43
2002 602 325 540 10 17
2003 667 392 587 15 22
2004 698 493 706 26 37
2005 760 546 718
Source Internal data from the Ministry of Strategy and Finance
Table x9 shows that line ministries in charge of the projects requested an increase of KRW 196 trillion and about half (495 percent) of the requested amount (KRW 097 trillion) was adjusted into the TPC While 957 percent of requests for TPC increase due to miscellaneous design change were accepted by the MOSF only 432 percent of requests due to substantial design change were adjusted into the TPC
Table x9 Sources of in Total Project Cost Adjustment
Value of miscellaneous design changes KRW billions
Value of substantial design changes KRW billions Sum KRW billions
Request for TPC increase (A) 2331 17320 19651 Projects that TPC adjusted (B) 2253 7480 9733 (B)(A) () 967 432 495 Source Internal data from the Ministry of Strategy and Finance
Note Miscellaneous design changes include changes due to factors of traffic safety and unexpected ground conditions substantial design changes include changes in route change in type of bridges and tunnels and an increase in quantity to incorporate request by local government or local citizens
PAGE 25
K O R E A
P I M R E F O R M A F T E R T H E F I N A N C I A L C R I S I S C O U N T R Y C A S E S T U D Y K O R E A
PIM Reform after the Financial Crisis
2 0 1 2
T H E P O W E R O F P U B L I C I N V E S T M E N T M A N A G E M E N T
Table x10 shows the trend of requests for TPC increase in terms of percentage of TPC During 1996ndash99 the line ministries requested an increase of 264 percent of TPC and 421 percent of the requested amount was adjusted into the TPC During 2000ndash03 however the requests dropped to as low as 44 percent of TPC and the acceptance rate also decreased to 227 percent
Table x10 Trend of Requests for TPC Increase
TPC Increase requested
1996ndash99 2000ndash03
Request for TPC increase (A) 264 44
TPC adjusted (B) 111 10
(B)(A) () 421 227
Source Internal data from the Ministry of Strategy and Finance
Table x11 shows the number of RSF studies conducted by sector during 2003ndash09 Road projects take up the largest share in the sectoral distribution of RSF The RSFs on buildings (museums and tourism) takes up 177 percent in terms of the total number of RSFs conducted
Table x11 Number of RSF by Sector 2003ndash09
2003 2004 2005 2006 2007 2008 2009 Sum
Road 2 2 6 10(2) 9(1) 9(3) 28(7) 66
Railway 0 1(1) 0 0 2(1) 2 1 6
Port 0 0 0 0 3 2 3 8 Buildings (museums and tourism) 2 3 3 4 1 6(2) 1 20
Water resources (dam) 0 0 0 5 0 1 2 8
ITRampD 0 0 0 0 0 0 1(1) 1
Others 0 0 0 1 3 0 0 4
Total 4 6(1) 9 20(2) 18(2) 20(5) 36(8) 113(18)
Source Internal data from the Ministry of Strategy and Finance
Out of 113 projects 18 were suspended as a result of RSF evaluations The results show higher percentages of feasible projects relative to PFS because while PFS focuses on evaluating the feasibility of a project RSF puts relatively more emphasis on finding alternatives to cut down the size or cost of a project
Table x12 shows the change in TPC by RSF The sum of initial TPC for projects conducted in 2003ndash09 was KRW 273 trillion and the line ministries requested a total of KRW 424 trillion So the RSF results suggested adjusting the total TPC to 347 trillion implying that KRW 77 trillion or 181 of TPC requested were cut through the RSF
PAGE 26
K O R E A
P I M R E F O R M A F T E R T H E F I N A N C I A L C R I S I S C O U N T R Y C A S E S T U D Y K O R E A
PIM Reform after the Financial Crisis
2 0 1 2
T H E P O W E R O F P U B L I C I N V E S T M E N T M A N A G E M E N T
Table x12 Results of RSF (change in total project costs KRW billions)
Initial TPC (A) TPC requested (B)
TPC by RSF (C)
(D) =(C)-(B)
(D)(B) ()
2003 1587 6137 5491 ndash646 ndash105
2004 291 711 613 ndash97 ndash136
2005 842 1511 1039 ndash472 ndash313
2006 3954 6826 3788 ndash3039 ndash445
2007 4141 4801 4040 ndash761 ndash159
2008 10569 13579 11998 ndash1581 ndash116
2009 5936 8859 7762 ndash1097 ndash124
Total 27320 42424 34731 ndash7693 ndash181
Source Internal data from the Ministry of Strategy and Finance
Until 2009 only two RDFs have been conducted since the RDF was introduced in 2006 the fourth section of the Hamyang-Ulsan Expressway and Kyungin Cannel project Based on the results of RDFs the MOSF decided to reduce the total cost limits on both projects
Performance Management and Evaluation of Completed Projects Three-tier systems of performance management and evaluation of completed projects were
simultaneously introduced within the Ministry of Strategy and Finance (1) Performance Monitoring System (2) S elf-Assessment System and (3) In-Depth Evaluation System Table x13 explains the main features of these systems
PAGE 27
K O R E A
P I M R E F O R M A F T E R T H E F I N A N C I A L C R I S I S C O U N T R Y C A S E S T U D Y K O R E A
PIM Reform after the Financial Crisis
2 0 1 2
T H E P O W E R O F P U B L I C I N V E S T M E N T M A N A G E M E N T
Table x13 Systems of Performance Management and Evaluation
Performance Monitoring Self-Assessment In-Depth Evaluation
Method
Establish objectives and indicators and use the results in government budget operation (Prepare performance report)
Provide a check list of projects for review and keep track of which projects are operated properly and which are making progress and so on
Apply scientific evaluation methods to each project to analyze spot problems and provide an alternative (Prepare evaluation report)
Main responsible body
Each ministry (Budget Division) Each Ministry (Budget division) and budget authority
Each Ministry (Project Management Division)
Applicable project
All policies and programs 20ndash30 of all Individual programs and projects
Merits
An overall progress report can be completed but not enough information can be given on individual project basis
Trade-off between Performance Monitoring and Program Evaluation
Detailed information can be given on an individual project basis but due to excessive time and costs this method is not suitable for all projects
Application
Used in management of performance of an organiza-tion as reference material for setting budget and in preparation of performance budget report
Used in improvement of project operating method and as (deliberation) reference for setting budget
Used in improvement of project operating method
Source Ministry of Strategy and Finance
Performance Monitoring System
The Performance Monitoring System (PMS) which started in the spring of 2003 requires line ministries to set up performance goals and indicators prepare annual performance plans and performance reports and submit them to the MOSF at the start of the annual budget cycle The MOSF is in charge of ensuring the system is in place by examining the status of PMS in line ministries coordinating the implementation and feeding the results back to resource allocation
PMS covers only part of the ministriesrsquo investment programs as those activities not involving large sums of expenditure (such as pure policy-making) are excluded from performance monitoring In addition activities for which the benefits of performance monitoring are expected to be small (such as wages and salaries ldquobasic programrdquo expenditures10 and general administrative expenses) are excluded as well
A performance report describes in a systematic way the degree to which program goals have been met It should list performance goals and indicators as originally set out in the performance plan describe the level of performance in terms of these goals and indicators explain the reasons for any poor performance summarize the assessment and describe future plans Optionally it can include audit results by the Board of Audit and Inspection and summarize findings of program evaluations
PAGE 28
K O R E A
P I M R E F O R M A F T E R T H E F I N A N C I A L C R I S I S C O U N T R Y C A S E S T U D Y K O R E A
PIM Reform after the Financial Crisis
2 0 1 2
T H E P O W E R O F P U B L I C I N V E S T M E N T M A N A G E M E N T
PMS will provide one source of information for budget allocation across sectors and programs Line ministries should present performance information when requesting budgets and the MOSF will utilize it when preparing the medium term National Fiscal Management Plan and drafting the budget
The PMS like its pilot project has not been very successful so far It received only lukewarm support from the top management in the MOSF Line ministries also showed little enthusiasm for the PMS In most cases performance indicators prepared by line ministries were not derived from ministerial missions in a systematic fashion Most importantly performance reports were not open to the public giving little incentive for line ministries to think seriously about the exercise
Program Review System Self-Assessment of Budgetary Programs
The Program Review System for Self-Assessment of Budgetary Programs (SABP) was introduced in 2005 by the MOSF to enhance links between performance evaluation and budget allocation It was designed after the Program Assessment Rating Tool (PART) of the US Government This program requires line ministries to assess their own programs with spending levels above a certain threshold The assessment was intended to cover all ministerial programs in a cycle of three years The assessment is based on 14 questions common to all types of programs and a few additional questions specific to different types of programs11 Table x14 shows the contents of checklist for the SABP
Table x14 Contents of Checklist for the SABP
Classification ( points weight of rating) Checklists
Design and planning (30)
y Program purpose y Rationale for government spending y Duplication with other programs y Efficiency of program design y Relevance of performance objectives and indicators y Relevance of performance targets
Management (20)
y Monitoring efforts y Obstacles of program implementation y Implementation as planned y Efficiency improvement or budget saving
Results and accountability (50)
y Independent program evaluation y Results y Satisfaction of citizens y Utilization of evaluation results
Source Park (2008)
A pilot SABP for government-financed projects was introduced in 2005 with input from various ministries and experts and a guideline for SABP was then distributed to each ministry Each ministry was to execute a self-evaluation and submit the results to the MOSF within two
PAGE 29
K O R E A
P I M R E F O R M A F T E R T H E F I N A N C I A L C R I S I S C O U N T R Y C A S E S T U D Y K O R E A
PIM Reform after the Financial Crisis
2 0 1 2
T H E P O W E R O F P U B L I C I N V E S T M E N T M A N A G E M E N T
months The evaluation took place within 40 departments of the relevant ministries for 555 projects budgeted at a total of KRW 35 trillion in project costs While the MOSF reviewed the results the relevant ministries were allowed to submit any questions or objections at two different intervals and these were reviewed again
The results of the SABP for 2005ndash07 are shown in figure x10 During the period a total of 1716 sub-programs were assessed for performance in fiscal years 2004 2005 and 2006 The figure shows the distribution of the total scores across the programs In 2005 the proportion of sub-programs in different departments in the ministries that were rated as ineffective was 157 percent and 52 percent of the programs were rated as effective The distribution of sub-program ratings did not change much between 2005 and 2006 but it improved in 2007 The proportion of ineffective programs dropped to 5 percent and that of effective sub-programs doubled This change in sub-program ratings in 2007 is attributed to the improvement of sub-program performance and agencies learning from a couple of yearsrsquo experience with SABP
Figure x10 Result of Self-Assessment of Budgetary Programs 2005ndash07 of total ratings
Source Park (2008)
Table x15 explains the linkage between SABP results and budget allocation in 2007 The programs rated as ineffective went through a 53 percent budget cut compared to the 2006 budget The main reason for this linkage between SABP results and budget allocation is that MOSF encouraged ministries to make use of assessment results in their budget requests announcing that a 10 percent of budget cut would be imposed on the programs rated as ineffective
PAGE 30
K O R E A
P I M R E F O R M A F T E R T H E F I N A N C I A L C R I S I S C O U N T R Y C A S E S T U D Y K O R E A
PIM Reform after the Financial Crisis
2 0 1 2
T H E P O W E R O F P U B L I C I N V E S T M E N T M A N A G E M E N T
Table x15 Linkage between SABP results and Budget Allocation 2007 KRW millions
2006 Budget
(A)
2007 Budget
(B) (B)-(A)
(B-A)(A)
()
Effective 889 887 -2 ndash02
Moderately Effective 3316 3565 249 75
Adequate 29718 28997 -721 ndash24
Ineffective 1143 538 ndash605 ndash529
Total 35066 33987
Source Park (2008)
Program Evaluation System In-Depth Evaluation Program
Under the current legal and administrative framework two methods of performance evaluation of public infrastructure investment are available One is performance evaluation as stipulated by the Enforcement Decree of Construction Technology Management Act The other one is In-depth Evaluation of Budgetary Programs (IEBP) under the Performance Management System12 IEBP analyzes the different factors that at different stages contribute to the performance of a government program by using scientific and systematic techniques The IEBP results are applied to improve and reform the system of operating programs
The Enforcement Decree of the Act requires the spending agency to file a performance evaluation report for construction projects whose total costs are KRW 50 billion or more In accordance with the Act MLTM established ldquoGuidelines for Performance Evaluations of Construction Projectsrdquo effective as of 2001 The guidelines outline the necessary details including the timing and methodologies for conducting performance evaluations required by government agencies These guidelines suggest that the performance evaluations be based on the Design and Implementation Evaluation Report and the Project Completion Report while comprehensively referring to all related materials including the (Pre-feasibility) Feasibility Study results
Despite the stipulation of the Enforcement Decree of the Construction Technology Management Act that requires the spending agency to file a performance evaluation report within three years of completion only a small number of performance evaluations were conducted until 2009 One reason is that there was no sanction against violation of the decrees thus the spending agencies have no incentive to implement these self-evaluations To draw lessons learned through the evaluation it is necessary to find some problems during the implementation process of the project The line ministry which is supposed to coordinate the evaluation did not take an active interest in this new system The other reason for slow progress in performance evaluation is that no clear framework for evaluation had been established A performance evaluation tracks whether a project or program achieves its objectives and secures the expected outcome The basic questions to be determined are what and how to evaluate However many projects have no clear concept of performance to be achieved by public investment For example many road construction projects under the national highway system have been regarded as just ldquonaturalrdquo It is not rare to find a statement of purpose for a road construction project that requires more than hundreds of billions
PAGE 31
K O R E A
P I M R E F O R M A F T E R T H E F I N A N C I A L C R I S I S C O U N T R Y C A S E S T U D Y K O R E A
PIM Reform after the Financial Crisis
2 0 1 2
T H E P O W E R O F P U B L I C I N V E S T M E N T M A N A G E M E N T
of KWS written in a single line ldquoTo relieve traffic congestionrdquo Since the basic concept of performance evaluations is to assess whether a project or a program achieves its objectives unless there is a clear target for a project or a program any assessment is going to be difficult
Under IEBP from 2005 to 2009 a total of 45 programs were evaluated initiated and controlled by the MOSF team With a wide coverage of areas for IEBP programs the MOSF seemingly tended to distribute the programs relatively evenly across line ministries Budgetary size was not considered as an essential criterion since half of the selected programs had an annual budget of less than KRW 100 billion The period of program implementation varies from program to program half of the programs had been in operation from four to ten years before being evaluated Although in principle IEBP was established for a single program eight programs containing three or more unit programs had been evaluated
IEBP still has a lot of trouble with implementing and feeding back results Since the availability of its database was strictly limited only 20 percent of the evaluation studies were subject to empirical analysis Data for evaluation analysis often does not exist and even when it does government officials in line ministries and agencies have given little attention to it The selection process for each IEBP has sometimes proved to be a tricky process since different purposes and approaches were taken by the MOSF and line ministries
Lessons Learned and Challenges Ahead The period after the economic crisis in 1997 witnessed many reform efforts intended to
enhance efficiency and transparency in developing and managing public infrastructure investment programs in Korea The MOSF has played a leading role in implementing an effective appraisal and evaluation system tightening the expenditure monitoring of total project cost and introducing a new budgeting system called the Medium Term Expenditure Framework (MTEF) In the past line ministries had ownership of the feasibility study process while the finance ministry used it to cut project budgets although not always on a reasonable basis With the reforms MOSF now makes the final decision on the project appraisal and determines the budget for it while the line ministries are responsible for identifying designing prioritizing and forecasting the effects of the project MOSF established a separate PIM Department responsible for the PIM reforms of PFS TPCM and RSF and these systems now mitigate information asymmetry between the finance ministry and line ministries and lead to better decision-making
The preliminary feasibility study (PFS) begun in 1999 and independently conducted mainly by the PIMAC at KDI seems to have been successful in handling the pass-or-fail hurdle of the project selection process An independent review of PFS by PIMAC used some help from policy analysts to make judgments on project desirability and their judgments were respected in most Government decision-making If policy analysis played merely a symbolic role and politicians and bureaucrats had disincentives to use this policy analysis such an independent judgment could not be made
PAGE 32
K O R E A
P I M R E F O R M A F T E R T H E F I N A N C I A L C R I S I S C O U N T R Y C A S E S T U D Y K O R E A
PIM Reform after the Financial Crisis
2 0 1 2
T H E P O W E R O F P U B L I C I N V E S T M E N T M A N A G E M E N T
The total project cost management system (TPCM) strengthened after the crisis appears to be working satisfactorily by limiting the frequency and amount of TPC increases in line ministries A reassessment study of feasibility (RSF) has been introduced as an innovative tool to control the total project cost limit in the middle of TPCM although there have been a few projects cancelled by RSF However the introduction of the performance monitoring and evaluation system is still lagging behind in Korea A greater emphasis on program evaluation is needed Once the Government adopts a performance orientation it can then encourage a greater use of performance contracts
Initiation of PFS in 1999 was a first step in the reform of PIM system in Korea which gave the Government the impetus to produce an effective sequencing of reforms in parallel with the project cycles with RSF and RDF coming later and then implementing performance evaluation last In order to improve the objectivity of the evaluation and secure consistency among projects standard evaluation and decision-making guidelines and manuals have been developed and published by the MOSF and PIMAC Sector guidelines and manuals in line ministries apply the same methodology and use the same or similar datasets for different projects in the same sector
The new PIM process and its capital budgeting has rooms for improvement The capacity for planning and prioritizing public investment programs in line ministries should be enhanced The planning and budget divisions of individual line ministries should play a greater role in the coordination of ministerial policies and budget requests unlike in previous years when they would simply compile budget requests from program divisions and send them to the MOSF with little modification The role of the MOSF should be changed as well As a central coordinator of government policies the MOSF should strengthen its capacity for policy analysis and long-term forecasts It should put less stress on input control and pay more attention to outputs and outcomes
PAGE 33
K O R E A
P I M R E F O R M A F T E R T H E F I N A N C I A L C R I S I S C O U N T R Y C A S E S T U D Y K O R E A
PIM Reform after the Financial Crisis
2 0 1 2
T H E P O W E R O F P U B L I C I N V E S T M E N T M A N A G E M E N T
Notes 1 Other social insurance programsmdashIndustrial Accident Insurance (1964) National Pension
(1988) and Employment Insurance (1995)mdashwere introduced and expanded in a similar fashion but their impact on total spending has been rather limited until recently
2 1 Examples include the West Coast Expressway Seoul-Busan High-speed Railroad and Incheon International Airport Even though such infrastructure investment takes the lionrsquos share of the spending on economic affairs it should be noted that the latter also includes subsidies to producers (farmers small and medium-sized enterprises and so on) and other possibly unproductive spending
3 1 von Hagen and Harden (1996) described two approaches to budgeting Under a target-based approach the Government collectively negotiates a set of binding numerical targets for the budget The budget process starts with negotiations among concerned parties over binding limits on the spending total or budget deficits Once these limits have been agreed upon they must be observed during the remainder of the budget process On the other hand under a strategic dominance-based approach the budget process vests the budget authorities with special strategic powers
4 1 In front-loading exercises the MOSF would allocate more funds than usual to the first half of the year and urge line ministries to spend the allocated funds as early as possible When necessary that is when growth is slower than expected despite front-loading the MOSF would consider introducing supplementary funds in the latter half of the year
5 5Potter and Diamond (1999) Schiavo-Campo and Tommasi (1999) and World Bank (1998) provide a useful guide on the reform in this direction
6 1 Ceilings are set for 14 spending areas such as social infrastructure agriculture education and environment then disaggregated into 56 programs for example social infrastructure has seven programs including roads railways subways ports airports housing and water resources Separate ceilings are also set within each program for the general account and various special accounts and funds
7 The former body of MPB was the Board of Planning and Budget which merged with the Office of National Budget to create MPB in May 1999 Subsequently merging with the Ministry of Finance and Economy the MPB became the MOSF in 2008
8 In January 2005 the Government of Korea passed an amendment to the 1999 Act on Private Participation in Infrastructure establishing the Public and Private Infrastructure Investment Management Center (PIMAC) as a new unit PIMAC is a merger between Private Infrastructure Investment Center of Korea (PICKO) of Korea Research Institute for Human Settlements established in 1999 and PIMA of KDI
9 The hierarchy of the legal framework in Korea is as follows ConstitutionndashActndashEnforcement DecreesndashMinisterial Ordinance
10 In Korea programs with small and recurrent costs are designated as ldquobasic programsrdquo after negotiation between line ministries and the MOSF Others are designated as ldquomajor programsrdquo
11 Types of programs are infrastructure investment procurement of large-scale facilities and equipment provision of direct services capital injection subsidies to private entities grants to local governments and RampD
PAGE 34
K O R E A
P I M R E F O R M A F T E R T H E F I N A N C I A L C R I S I S C O U N T R Y C A S E S T U D Y K O R E A
PIM Reform after the Financial Crisis
2 0 1 2
T H E P O W E R O F P U B L I C I N V E S T M E N T M A N A G E M E N T
12 As was pointed out Korea introduced the three-tier system for performance management and evaluation of budgetary programs performance monitoring program review and program evaluation IEBP is a core part of program evaluation
Bibliography Bank of Korea (var years) ldquoDatabase on Flow of Funds Accountsrdquo Bank of Korea Seoul
Kim Jay-Hyung 2003 Developing a Performance Evaluation System in Korea Edited by Chae-hyong
Kim Jay-Hyung 2012 ldquoPublic Investment Management Reform in Korea Efforts for Enhancing Efficiency and Sustainability of Public Expenditurerdquo Korea Development Institute
Kim and Hanguk Kaebal Yonguwon Seoul Korea Korea Development Institute
Koh Youngsun 2005 ldquoReforming the Fiscal Management System in Koreardquo Working paper Korea Development Institute Seoul Korea
Korea Development Institute 2004 The Standard Guideline for Preliminary Feasibility Studies on Road and Railway Projects 4th ed (in Korean) Seoul Korea Korea Development Institute
Ministry of Planning and Budget Korea 2007a ldquoGuidelines for Preliminary Feasibility Study Systemrdquo (in Korean) MOPB Government of Korea Seoul
Ministry of Planning and Budget Korea 2007b ldquoGuidelines for Total Project Cost Management Systemrdquo (in Korean) MOPB Government of Korea Seoul
MOCT (Ministry of Construction and Transportation Korea 1999 ldquoComprehensive Plan for Public Investment Budget Savingsrdquo(in Korean) MOCT Government of Korea Seoul
MOSF (Korea Ministry of Strategy and Finance) Government Finance Statistics in Korea various issues MOSF Government of Korea Seoul
MOSF (Korea Ministry of Strategy and Finance) various years National Statement for Current Bonds respective year MOSF Government of Korea Seoul
mdashmdashmdash various years National Statement for Current Bonds respective year MOSF Government of Korea Seoul
National Assembly Budget Office Korea 2004 ldquoSome Points at Issue in Preliminary Feasibility Study and Its Future Directionrdquo (in Korean) [[]] Government of Korea Seoul
OECD (Organisation for Economic Co-operation and Development) Various years Economic Surveys Korea Paris OECD
Perrin Burt 2002 ldquoImplementing the Vision Addressing Challenges to Results-focused Management and Budgetingrdquo Paris OECD
PAGE 35
K O R E A
P I M R E F O R M A F T E R T H E F I N A N C I A L C R I S I S C O U N T R Y C A S E S T U D Y K O R E A
PIM Reform after the Financial Crisis
2 0 1 2
T H E P O W E R O F P U B L I C I N V E S T M E N T M A N A G E M E N T
Park Nowook 2008 ldquoPerformance-oriented Budgeting in Korea Evidence and Lessonsrdquo Korea Institute of Public Finance Seoul
Potter Barry H and Jack Diamond 1999 Guidelines for Public Expenditure Management Washington DC International Monetary Fund
Schiavo-Campo Salvatore and Daniel Tommasi 1999 Managing Government Expenditure Manila Asia Development Bank
von Hagen Jurgen and Ian Harden 1996 ldquoBudget Processes and Commitment to Fiscal Disciplinerdquo IMF Working Paper WP9678 International Monetary Fund Washington DC
World Bank 1998 Public Expenditure Management Handbook Washington DC World Bank
2004 The General Guideline for Preliminary Feasibility Studies 4th ed (in Korean) Seoul Korea Korea Development Institute
mdashmdashmdash various years Korea Consolidated Fiscal Balance MOSF Government of Korea Seoul
mdashmdashmdash 2005a Annex to Summary of 2005 Budget MOSF Government of Korea Seoul
mdashmdashmdash 2005b Performance Management Handbook MOSF Government of Korea Seoul
World Bank 2003 ldquoWorld Development Indicatorsrdquo World Bank Washington DC
1 Other social insurance programsmdashIndustrial Accident Insurance (1964) National Pension (1988) and Employment Insurance (1995)mdashwere introduced and expanded in a similar fashion but their impact on total spending has been rather limited until recently
2 Examples include the West Coast Expressway Seoul-Busan High-speed Railroad and Incheon International Airport Even though such infrastructure investment takes the lionrsquos share of the spending on economic affairs it should be noted that the latter also includes subsidies to producers (farmers small and medium-sized enterprises and so on) and other possibly unproductive spending
3 von Hagen and Harden (1996) described two approaches to budgeting Under a target-based approach the Government collectively negotiates a set of binding numerical targets for the budget The budget process starts with negotiations among concerned parties over binding limits on the spending total or budget deficits Once these limits have been agreed upon they must be observed during the remainder of the budget process On the other hand under a strategic dominance-based approach the budget process vests the budget authorities with special strategic powers
4 In front-loading exercises the MOSF would allocate more funds than usual to the first half of the year and urge line ministries to spend the allocated funds as early as possible When necessary that is when growth is slower than expected despite front-loading the MOSF would consider introducing supplementary funds in the latter half of the year
5Potter and Diamond (1999) Schiavo-Campo and Tommasi (1999) and World Bank (1998) provide a useful guide on the reform in this direction
6 Ceilings are set for 14 spending areas such as social infrastructure agriculture education and environment then disaggregated into 56 programs for example social infrastructure has seven programs including roads railways subways ports airports housing and water resources Separate ceilings are also set within each program for the general account and various special accounts and funds
7 The former body of MPB was the Board of Planning and Budget which merged with the Office of National Budget to create MPB in May 1999 Subsequently merging with the Ministry of Finance and Economy the MPB became the MOSF in 2008
8 In January 2005 the Government of Korea passed an amendment to the 1999 Act on Private Participation in Infrastructure establishing the Public and Private Infrastructure Investment Management Center (PIMAC) as a new unit PIMAC is a merger between Private Infrastructure Investment Center of Korea (PICKO) of Korea Research Institute for Human Settlements established in 1999 and PIMA of KDI
9The hierarchy of the legal framework in Korea is as follows ConstitutionndashActndashEnforcement DecreesndashMinisterial Ordinance
10 In Korea programs with small and recurrent costs are designated as ldquobasic programsrdquo after negotiation between line ministries and the MOSF Others are designated as ldquomajor programsrdquo
PAGE 36
K O R E A
P I M R E F O R M A F T E R T H E F I N A N C I A L C R I S I S C O U N T R Y C A S E S T U D Y K O R E A
PIM Reform after the Financial Crisis
2 0 1 2
T H E P O W E R O F P U B L I C I N V E S T M E N T M A N A G E M E N T
11 Types of programs are infrastructure investment procurement of large-scale facilities and equipment provision of direct services capital injection subsidies to private entities grants to local governments and RampD
12 As was pointed out Korea introduced the three-tier system for performance management and evaluation of budgetary programs performance monitoring program review and program evaluation IEBP is a core part of program evaluation

PAGE 2
K O R E A
P I M R E F O R M A F T E R T H E F I N A N C I A L C R I S I S C O U N T R Y C A S E S T U D Y K O R E A
PIM Reform after the Financial Crisis
2 0 1 2
T H E P O W E R O F P U B L I C I N V E S T M E N T M A N A G E M E N T
Jay-Hyung Kim Senior Fellow Korea Development Institute
Adviser World Bank
THE AUTHOR
This case study is one of a number of country cases in the Public Investment Management Series The country case studies accompany the
volume ldquoThe Power of Public Investment Management Transforming Resources into Assets for Growthrdquo World Bank (2014) and apply a
common methodology to assess PIM systems globally
PAGE 3
K O R E A
P I M R E F O R M A F T E R T H E F I N A N C I A L C R I S I S C O U N T R Y C A S E S T U D Y K O R E A
PIM Reform after the Financial Crisis
2 0 1 2
T H E P O W E R O F P U B L I C I N V E S T M E N T M A N A G E M E N T
KOREA The financial crisis that hit the Republic of Korea in the second half of 1997 had a devastating impact on its economy causing the worst recession since the Korean War era To address the fundamental causes of the crisis and revitalize the economy the Korean Government took bold decisive steps to initiate comprehensive structural reforms The major focus of reform in the fiscal and public sector was to adopt a series of initiatives for strengthening public investment management The Government endeavored to instill a performance-oriented approach in the system which implies management of public expenditure based on the principle of value for money This chapter explains the institutional setting for public investment management (PIM) and the Korean Governmentrsquos efforts to develop and manage a comprehensive PIM reform to further improve value for the money invested The Ministry of Strategy and Finance played a leading role by implementing an effective appraisal and evaluation system to tighten the expenditure monitoring of total project cost and introducing a new budgeting system called the Medium Term Expenditure Framework An initiative of the preliminary feasibility study (PFS) introduced in 1999 and conducted mainly by the Public and Private Infrastructure Investment Management Center has been successful in handling the pass-or-fail bottleneck of the whole project selection process The total project cost management system (TPCM) strengthened after the crisis is working satisfactorily by discouraging the request frequency and the amount of TPC increases in line ministries A reassessment study of feasibility is an innovative tool to control and keep the total project cost limit in the middle of TPCM However the performance monitoring and evaluation system on PIM still has room for improvement in Korea A greater emphasis on program evaluation is being called for with the Government currently establishing a performance-orientation a greater use of performance contracts can be encouraged
PAGE 4
K O R E A
P I M R E F O R M A F T E R T H E F I N A N C I A L C R I S I S C O U N T R Y C A S E S T U D Y K O R E A
PIM Reform after the Financial Crisis
2 0 1 2
T H E P O W E R O F P U B L I C I N V E S T M E N T M A N A G E M E N T
Contents Trends in Public Investment Expenditure 1
Institutional Framework for PIM 7
Recent Change from Bottom-Up to Top-Down Budgeting 8 New Initiatives in Public Investment Management 9
Project Appraisal by Preliminary Feasibility Study 12
Initiative for a Preliminary Feasibility Study 12 Contents of PFS 14 PFS Evaluation Guidelines 17 Performance of PFS 17
Procurement and Capital Budget Implementation 20
TPCM Manages PIP Construction Budgets 20 TPCM by Project Phase 21 Reassessment Study of Feasibility and Reassessment of Demand Forecast 22 Performance of TPCM RSF and RDF 23
Performance Management and Evaluation of Completed Projects 26
Performance Monitoring System 27 Program Review System Self-Assessment of Budgetary Programs 28 Program Evaluation System In-Depth Evaluation Program 30
Lessons Learned and Challenges Ahead 31
References 32
Bibliography 34
Endnotes Error Bookmark not defined
Figures
Figure x1 General and Central Government Spending 1980ndash2008 2 Figure x2 General Government Spending by Function 1980ndash2008 2 Figure x3 Capital Formation Trends by Sector 1980ndash2008 of GNI 6 Figure x4 Size of Government Fiscal Lending (as of balance) 1990ndash2008 of GDP 6 Figure x5 Chronology of New Initiatives in Korearsquos PIM System 10 Figure x6 Implementation Process of Public Investment Management 12 Figure x7 Preliminary Feasibility Study Procedures 14 Figure x8 Outline of PFS Procedures and Contents 15 Figure x9 Structure of AHP in PFS 16 Figure x10 Result of Self-Assessment of Budgetary Programs 2005ndash07 of total ratings 29
PAGE 5
K O R E A
P I M R E F O R M A F T E R T H E F I N A N C I A L C R I S I S C O U N T R Y C A S E S T U D Y K O R E A
PIM Reform after the Financial Crisis
2 0 1 2
T H E P O W E R O F P U B L I C I N V E S T M E N T M A N A G E M E N T
Tables Table x1 Consolidated Fiscal Expenditure and Net Lending by Central Government by Function 3 ( of total) 3 Table x2 Trend of Facility Stock by Transport Sector 4 Table x3 Major Players in Korearsquos Budget Process 8 Table x4 Number of PFS Submitted by Sector 1999ndash2009 18 Table x5 Proportion of Feasible Projects by Sector 1999ndash2009 18 Table x6 Feasiblenon-feasible Projects according to BC Ratios (1999ndash2002) 19 Table x7 Feasiblenon-feasible Projects according to BC Ratios and AHP Scores (2003ndash2009) 20 Table x8 Number of Projects with Substantial Change in TPC 24 Table x9 Sources of in Total Project Cost Adjustment 24 Table x10 Trend of Requests for TPC Increase 25 Table x11 Number of RSF by Sector 2003ndash09 25 Table x12 Results of RSF (change in total project costs KRW billions) 25 Table x13 Systems of Performance Management and Evaluation 27 Table x14 Contents of Checklist for the SABP 28 Table x15 Linkage between SABP results and Budget Allocation 2007 KRW millions 30
PAGE 1
K O R E A
P I M R E F O R M A F T E R T H E F I N A N C I A L C R I S I S C O U N T R Y C A S E S T U D Y K O R E A
PIM Reform after the Financial Crisis
2 0 1 2
T H E P O W E R O F P U B L I C I N V E S T M E N T M A N A G E M E N T
The financial crisis that hit the Republic of Korea (ldquoKoreardquo) in the second half of 1997 had a devastating impact on its economy causing the worst recession since the Korean War era To address the fundamental causes of the crisis and revitalize the economy the Korean Government took bold decisive steps to initiate comprehensive structural reforms The major focus of reform in the fiscal and public sector was to adopt a market-oriented focus and managerial strategies to increase efficiency and transparency The Government endeavored to instill a performance-oriented approach in the system which implies management of public expenditure based on the principle of value for money
In the last decade the Korean Government adopted a series of integrated (ex ante intermediate and ex post) quality control efforts for efficient management of its public investment program The budget ministry established a strong and effective project appraisal scheme to provide oversight of the line ministriesrsquo project selection process The reforms include a formal review process to ensure that funds are continually subjected to monitoring and evaluation In addition budgeting for public investment was simplified by reducing the number of special accounts and government funds The Government in 2004 introduced the Medium Term Expenditure Framework (MTEF) with top-down budgeting for fiscal year 2005 The MTEF pointed to a need to enhance the capacity for planning and prioritizing public investment management (PIM) programs in the line ministries It also emphasized the need to change the role of the budget ministry as well
This chapter explains the institutional setting for PIM and the reform efforts of the Korean Government to develop and manage a comprehensive PIM program to further improve value for money invested The first section provides a brief summary of public investment expenditure trends in Korea followed by an outline of an institutional framework for public investment management The major players in the budget process are described and the reform efforts to pass the MTEF as well as recent PIM initiatives are examined Then an in-depth description focuses on how the public investment projects (PIPs) are selected prioritized and managed in the budget process beginning with a description of how the project appraisal is carried out up to the preliminary feasibility study Next the design of the total project cost management system from procurement implementation to performance management and the evaluation system are discussed Finally a summary presents challenges and recommendations for improving public investment selection prioritization management and budgeting procedures
Trends in Public Investment Expenditure The Korean Government increased public investment expenditure rapidly in response to
the growing demand for public services along with rapid economic development As a result general government (local and central) spending rose from 18 percent of GDP in 1987 to 30 percent in 2009 (figure x1) Central Government expenditure and net lending showed similar growth
PAGE 2
K O R E A
P I M R E F O R M A F T E R T H E F I N A N C I A L C R I S I S C O U N T R Y C A S E S T U D Y K O R E A
PIM Reform after the Financial Crisis
2 0 1 2
T H E P O W E R O F P U B L I C I N V E S T M E N T M A N A G E M E N T
Figure x1 General and Central Government Spending 1980ndash2008
Source System of National Accounts Bank of Korea (httpecosbokorkr) Government Finance Statistics Ministry of Finance and Strategy (httpwwwmosfgokr)
Figure x2 depicts the general growth rate of public expenditure by sector it shows a notable increase in welfare expenditure and a continuous decrease in defense expenditure The state welfare expenditure increased with the 1977 introduction of National Health Insurance (NHI) for firms with 500 or more employees After a series of expansions the NHI came to cover the entire population in 1989 and government expenditures increased accordingly1
Figure x2 General Government Spending by Function 1980ndash2008
Source Bank of Korea (httpecosbokorkr)
Note Welfare spending includes social protection health and housing and community services
PAGE 3
K O R E A
P I M R E F O R M A F T E R T H E F I N A N C I A L C R I S I S C O U N T R Y C A S E S T U D Y K O R E A
PIM Reform after the Financial Crisis
2 0 1 2
T H E P O W E R O F P U B L I C I N V E S T M E N T M A N A G E M E N T
In addition to the increase in welfare spending spending on economic affairs grew rapidly in the early 1990s with the launch of infrastructure improvements construction of roads subways dams and water supplies2 Traditionally economic affairs and education accounted for about 40 percent of total government spending the former being a slightly larger share Spending on economic affairs contributed to the fast expansion of economic infrastructure while spending on education supported the rise in enrollment rates which are currently close to 100 percent for primary and secondary education private as well as public schools depend heavily on Central Government funding (Colleges and universities are funded mainly by tuition)Table x1 distinguishes consolidated fiscal expenditure and net lending of the Central Government which provides detailed information on expenditure of economic affairs Spending on the transportation and communication sectors accounts for the largest part of expenditures on economic affairs while agriculture forestry fishing and hunting and mining manufacturing and construction hold the second and the third rank respectively Judging whether such fiscal allocation is reasonable and whether the expenditure size is feasible are both difficult tasks
Table x1 Consolidated Fiscal Expenditure and Net Lending by Central Government by Function ( of total)
Government Function Central Government Expenditure
1980 1990 2000 2008
General public services Defense
Public order and safety Education
Health Social protection
Housing construction and community amenities Recreation culture and religion
Economic affairs Fuel and energy
Agriculture forestry fishing and hunting Mining manufacturing and construction
Transportation and communication Other economic affairs Other expenditures
40 306 46
146 10 57 25 07
260 21 59 74 67 39
104
42 200 43
170 17 81
101 05
204 06
102 20 61 14
137
52 114 46
153 07
153 53 08
252 07 62 26 99 58
162
69 149 64
212 13
282 84 13
260 33 68 16
106 37
221
Total 1000 1000 1000 1000
Source MOSF (each year) Note Redemption of public funds (KRW 12 trillion) for year 2004 excluded
PAGE 4
K O R E A
P I M R E F O R M A F T E R T H E F I N A N C I A L C R I S I S C O U N T R Y C A S E S T U D Y K O R E A
PIM Reform after the Financial Crisis
2 0 1 2
T H E P O W E R O F P U B L I C I N V E S T M E N T M A N A G E M E N T
Examination of the transport sectormdashthe largest part of spending in economic affairsmdashshows a constant increase in facility stock (table x2) Road length has more than doubled from 1980 to 2008 Considering that these data do not reflect the increase in number of lanes road facilities in reality have expanded even further Indices for port loadunload capacity and capacity for airport facilities show rapid increases as well Transport facilities therefore do not appear to be a serious economic problem in Korea except for discussions on the need to increase investment in the railway sector
Table x2 Trend of Facility Stock by Transport Sector
Year
Road length Expressway length
Railway length Port loadunload capacity
Capacity for airport facility
(km) relative
indexa
(km) relative index
(km) relative index
(million ton)
relative index
(thousands of flights)
relative index
1980
1990
2000
2008
46951
56715
88775
104236
100
121
189
222
1225
1551
2131
3447
100
127
174
281
3135
3091
3123
3381
100
099
100
108
823
2243
4304
7586
100
273
523
922
1006
1331
2025
2222
100
132
201
221
Source Korea Development Institute 2004 Ministry of Land Transport and Maritime Affairs Statistics on Land Transport and Maritime Affairs
Note a Relative index according to 1980 stock level
Figure x3 shows that public investment expenditure by the Government in areas such as transport has taken an important role in total domestic investment Since 1970 the gross domestic investment ratio (which equals national total capital formationgross national disposable income) has been maintained at around 30 percent and the general government investment ratio (the general government capital formationgross national disposable income) at around 5 percent with the general government taking up about 15 percent of total investment General government public investment has increased since 2000 when the gross domestic investment ratio saw a slight decrease If public enterprises are included in the figure representation of investment by the public sector would far outweigh that of the general government
The Government has not focused only on infrastructure facility expansion in the process of economic development It has also more directly intervened in the market in order to resolve market failure especially failure of the financial markets One method used was fiscal lending Figure x4 examines the size of fiscal lending using two indices lending by the general government as indicated in Flow of Funds from the Bank of Korea (Bank of Korea var years) and loan
PAGE 5
K O R E A
P I M R E F O R M A F T E R T H E F I N A N C I A L C R I S I S C O U N T R Y C A S E S T U D Y K O R E A
PIM Reform after the Financial Crisis
2 0 1 2
T H E P O W E R O F P U B L I C I N V E S T M E N T M A N A G E M E N T
repayment by the Central Government as indicated in National Statement for Current Bonds (MOSF var years) announced by the financial authority Fiscal lending has reached a sizable amount the housing sector takes the biggest part and the small- and medium-sized enterprise (SME) sector and agricultural sector follow respectively
PAGE 6
K O R E A
P I M R E F O R M A F T E R T H E F I N A N C I A L C R I S I S C O U N T R Y C A S E S T U D Y K O R E A
PIM Reform after the Financial Crisis
2 0 1 2
T H E P O W E R O F P U B L I C I N V E S T M E N T M A N A G E M E N T
Figure x3 Capital Formation Trends by Sector 1980ndash2008 of GNI
Source MOSF internal data Bank of Korea Economic Statistics System (httpecosbokorkr)
Note Capital formation and investment to foreign country as ratio to gross national disposable income
Figure x4 Size of Government Fiscal Lending (as of balance) 1990ndash2008 of GDP
Source MOSF internal data Bank of Korea Economic Statistics System (httpecosbokorkr)
Note Government lending and loans as of 1968 System of National Accounts (SNA) before 2001 and as of 1993 SNA after 2002
PAGE 7
K O R E A
P I M R E F O R M A F T E R T H E F I N A N C I A L C R I S I S C O U N T R Y C A S E S T U D Y K O R E A
PIM Reform after the Financial Crisis
2 0 1 2
T H E P O W E R O F P U B L I C I N V E S T M E N T M A N A G E M E N T
Institutional Framework for PIM Major players in the budget process include the Ministry of Strategy and Finance (MOSF)
and the Board of Audit and Inspection (BAI) (see table x3) The MOSF is responsible for preparing the draft budget based on revenue forecasts of the Tax and Customs Office in the MOSF When the budget is authorized by the National Assembly the MOSF prepares the quarterly budget implementation plan usually within a month and allocates funds to line ministries The Treasury Bureau of the MOSF then prepares the monthly cash plan and releases cash to line ministries The Treasury Bureau keeps track of cash flows into and from the treasury single account held in the Bank of Korea It is also responsible for issuing government bonds and managing government assets and liabilities
An important issue concerning the interplay among various players is fiscal discipline The budget process has generally taken a highly centralized strategic dominance-based approach to maintaining fiscal discipline3 The MOSF plays a central role in budgeting as well as in preparing and implementing public investment programs Often the main budgeting decisions are made in bilateral negotiations between the budget authority and the spending ministry
The MOSF exercises tight control on public expenditures in the implementation stage Ministries are required to spend within the limits set in the quarterly budget implementation plan When deemed necessary the MOSF can postpone or block part of the expenditures All limits on expenditures are imposed in cash terms Transfers across appropriation accounts are prohibited unless authorized by the National Assembly or by the MOSF
The Treasury Bureau of the MOSF also has a tight grip on cash outflow All cash disbursements are made strictly within the limits set in the monthly cash plans Before the 1997 crisis it was not uncommon for the Treasury Bureau to delay disbursements to line ministries when there was not enough money left in the treasury account due to the seasonality of tax collection This was the case despite the fact that they could issue short-term debt instruments within the limit set by the National Assembly to bridge the gap between tax collection and cash needs In addition the revenue forecasts prepared by the Tax and Customs Office were often very conservative with the actual tax collection overshooting the forecast by substantial margins
PAGE 8
K O R E A
P I M R E F O R M A F T E R T H E F I N A N C I A L C R I S I S C O U N T R Y C A S E S T U D Y K O R E A
PIM Reform after the Financial Crisis
2 0 1 2
T H E P O W E R O F P U B L I C I N V E S T M E N T M A N A G E M E N T
Table x3 Major Players in Korearsquos Budget Process
Players Roles
Ministry of Strategy and Finance (MOSF)
x Compiles budget bids and prepares the draft budget x Allocates funds to spending ministries (apportionment) x Approves the transfers of funds between line items (virements)
Treasury Bureau of the MOSF
x Releases cash to spending ministries x Manages the treasury single account held in the Bank of Korea x Issues treasury bonds and manages assets and liabilities x Collects ministerial financial reports prepares the whole-of-
government financial reports and sends them to the BAI x Produces the government financial statistics
Tax and Customs Office of the MOSF
x In charge of tax policy x Prepares revenue forecasts x Oversees the National Tax Service and the Customs Service
Line ministries Execute the budget and prepare financial reports
Board of Audit and Inspection (BAI)
x The supreme audit institution in Korea whose head is nominated by and reports to the President The National Assembly can also request audits on specific issues to the BAI
x Checks the regularity of ministerial activities x Prepares and tables the financial report to the National
Assembly
National Assembly x Deliberates and votes on the budget x Approves the transfers of funds between programs x Reviews and approves audit reports
Some changes were observed in cash management and revenue forecast practices after the
1997 financial crisis Pressured to stimulate the economy and in particular to back up the front-loading4 of annual spending that has been popular since 1999 the MOSF resorted more and more to short-term debt instruments to bridge the gap between tax collection and cash needs The downward bias in revenue forecasts was also reduced In 2004 there had actually been a large shortfall in tax collection which was partly blamed on an overly optimistic assumption on the economic growth which was in turn claimed by some to have been politically motivated Now the democratization of Korean politics and the devolution of budgetary power to line ministries became an unavoidable trend
Recent Change from Bottom-Up to Top-Down Budgeting
The Korean Governmentrsquos budget process has undergone a significant change beginning when the Government introduced the Medium Term Expenditure Framework (MTEF) together with top-down budgeting in 2004 for fiscal year 20055 The reform was intended to address several defects found in the previous budgeting practice Prior to the introduction of the MTEF budgeting
PAGE 9
K O R E A
P I M R E F O R M A F T E R T H E F I N A N C I A L C R I S I S C O U N T R Y C A S E S T U D Y K O R E A
PIM Reform after the Financial Crisis
2 0 1 2
T H E P O W E R O F P U B L I C I N V E S T M E N T M A N A G E M E N T
was centered on the next single budget year and lacked a medium-term perspective The MOSF and the National Assembly gave little consideration to the out-years beyond the budget year Line ministries had little information on the extent of the resources that would be available to them in the future and their medium- to long-term planning function was severely limited It was also difficult for the MOSF to identify and cope with the trend towards increased public expenditure Without a long-term view on the appropriate level of the tax burden the MOSF would simply allow ever-increasing public spending to accommodate rising demands from various sectors
Before the introduction of the top-down process budgeting relied exclusively on a bottom-up approach At the initial stage of budget preparation the MOSF made rough estimates of the total size and the sectoral allocation of the next yearrsquos budget But the estimates were not transmitted to line ministries and therefore could not guide them in preparing their budget requests When reviewing the ministriesrsquo budget requests the MOSF focused on the microscopic spending control of individual public investment programs The sectoral allocation and the total size of the budget were determined at the last stage of budget preparation by aggregating the expenditures on individual programs As a result control of inputs assumed major significance in budget discussions and little attention was paid to outputs or outcomes The accountability and autonomy of line ministries in preparing and managing their budget was also severely limited Line ministries usually requested an unrealistically large amount of the budget and massive cuts were inevitable
With the introduction of the MTEF and top-down budgeting the process changed Now the annual budgeting exercise starts with a discussion on fiscal management over the next five years including the current year the budget year and three out-years Following this discussion the MOSF transmits spending ceilings for sectors and programs to line ministries6 These ceilings encompass the general and special accounts and funds Line ministries are now asked to prepare their budget requests within these ceilings When reviewing the ministerial budget requests the MOSF places less emphasis on the microscopic control of line items and more on the strategic alignment of budget requests with overall policy directions
New Initiatives in Public Investment Management
In order to enhance the efficiency of PIM the Korean Government in 1999 organized a cross-ministerial task force to develop an action plan The task force was jointly headed by Ministry of Planning and Budget7 (now MOSF) and the Ministry of Construction and Transportation (MOCT) (now Ministry of Land Transport and Maritime Affairs MLTMA) The MOCT issued ldquoA Comprehensive Plan to Enhance Efficiency of Public Investmentrdquo in July 1999 (MOCT 1999) Various policy measures were introduced to tackle the weaknesses of the existing public investment management system
One of the features of the new PIM system was to intensify the monitoring system of the project implementation process by the budgeting agency For example the MOSF now takes charge of the Preliminary Feasibility Studies (PFS) the results of which are reflected in the budget appropriation This arrangement represents a compromise between the MOSF which tried to take over the feasibility study function from the line ministries and the line ministries especially the
PAGE 10
K O R E A
P I M R E F O R M A F T E R T H E F I N A N C I A L C R I S I S C O U N T R Y C A S E S T U D Y K O R E A
PIM Reform after the Financial Crisis
2 0 1 2
T H E P O W E R O F P U B L I C I N V E S T M E N T M A N A G E M E N T
MLTMA which were resistant to the idea of transferring ownership of the feasibility study to the MPB Thus the PFS was ldquoinventedrdquo as a settlement to relieve the resistance from the line ministries
The Total Project Cost Management System (TPCM) in which the budget ministry checks the cost increase from the baseline throughout the project life was also strengthened Introduced in 1994 the TPCM was established as an effective measure of government expenditure management after the financial crisis Under the TPCM System the Reassessment Study of Feasibility (RSF) and Reassessment of Demand Forecast (RDF) were introduced in 1999 and 2006 respectively RSF and RDF reformulate feasibility studies and demand forecasts on projects under design development or construction and decide whether the project may continue The RSF guidelines and RDF system were developed and introduced after the PFS system was established The guidelines of RSF and RDF adopt the same analytical methodology as that of the PFS Figure x5 shows a brief chronology of PIM system evolution
Figure X5 Chronology of New Initiatives in Korearsquos PIM System
For line ministries the Government introduced the ex-post performance evaluation system in 1999 According to the MOCT Comprehensive Plan the line ministries were supposed to evaluate the performance of the project within three years after construction work is completed In 2000 the MOCT amended the Enforcement Decree of the Construction Technology Management Act to incorporate the initiatives included in the Comprehensive Plan The legal ground of PFS and TCPM resides in several laws their enforcement decrees and administrative guidelines such as the Budgeting and Accounting Act and the Fund Management Act In 2006 the National Finance Act combining several fiscal-related acts was legislated to stipulate diverse policy measures of PIM
With the establishment of a legal framework for public investment the PIM project was to be implemented in accordance with the process shown in figure x5 Throughout the process the MOSF produces information necessary for decision-making on budgeting through PFS FSF RDF
RSF guidelines
strengthened PE introduced
RSF guidelines developed
RDF introduced
The National Finance Act legislated
1994 1999 2005 2006
PFS introduced TPCM introduced
RSF introduced
9 TPCM (Total Project Cost Management) 9 PFS (Preliminary Feasibility Study)
9 RSF (Reassessment Study of Feasibility) 9 RDF (Reassessment of Demand Forecast) 9 PE (Performance Evaluation)
PAGE 11
K O R E A
P I M R E F O R M A F T E R T H E F I N A N C I A L C R I S I S C O U N T R Y C A S E S T U D Y K O R E A
PIM Reform after the Financial Crisis
2 0 1 2
T H E P O W E R O F P U B L I C I N V E S T M E N T M A N A G E M E N T
and in-depth program evaluation In the past line ministries provided selective information to procure more of the budget leading the MOSF to cut project budgets but not always on a reasonable basis New devices investigating the projects in detail made it possible for the MOSF to manage public investment more effectively
PAGE 12
K O R E A
P I M R E F O R M A F T E R T H E F I N A N C I A L C R I S I S C O U N T R Y C A S E S T U D Y K O R E A
PIM Reform after the Financial Crisis
2 0 1 2
T H E P O W E R O F P U B L I C I N V E S T M E N T M A N A G E M E N T
Figure X6 Implementation Process of Public Investment Management
Ex-Ante Intermediate Ex-Post
x TPCM(RSF amp RDF) x Performance Evaluation
x In-depth Program Evaluation
Note The bulleted items are under the aegis of MOSF
Project Appraisal by Preliminary Feasibility Study Improvement of a project appraisal system at the ex ante level is very important for
ensuring sound public expenditure As discussed the Ministry of Strategy and Finance introduced the preliminary feasibility study (PFS) to enhance efficiency in the early decision-making process of major infrastructure investment projects Throughout the project cyclemdashsuch as the stages of identification preparation implementation evaluation and so onmdashthe MOSF is interested in improving the methods of ex-ante appraisal at the preparation stage
Initiative for a Preliminary Feasibility Study
The PFS is a brief evaluation of a project to produce information for a budgetary decision A critical change is that the PFS is owned by the Ministry of Strategy and Finance (MOSF) Under the new procedure the MOSF established the Public Investment Management Center (PIMA) within the
Blueprint Design
Land Acquisition Construction
Draft Design Operation Maintenance
PFS
Feasibility Study
Strategic Planning
PAGE 13
K O R E A
P I M R E F O R M A F T E R T H E F I N A N C I A L C R I S I S C O U N T R Y C A S E S T U D Y K O R E A
PIM Reform after the Financial Crisis
2 0 1 2
T H E P O W E R O F P U B L I C I N V E S T M E N T M A N A G E M E N T
Korea Development Institute (KDI) with the mandate to conduct research and take an operational managing role in implementing the PFS procedures8
The PFS is conducted by a multi-disciplinary research team organized by PIMA (now PIMAC Public and Private Infrastructure Investment Management Center) typically consisting of economists transportation researchers and civil engineers The mix of specialists from different backgrounds and organizations helps to provide diverse ideas for the appraisal and improve the transparency and objectivity of the decision-making process The PFS Review Committee is organized by the MOSF with members of staff from the budget and line ministries PIMAC and field specialists Open discussions are held regularly on the PFS mid-term and final reports
The PFS process aims to enhance fiscal productivity by launching large-scale public investment projects based on transparent and objective ex-ante project evaluations The meaning of ldquopreliminaryrdquo is twofold first it means ldquoprovisionalrdquo evaluation a short and brief examination second it is an evaluation that precedes a (detailed) feasibility study The National Finance Act of 2006 provides the legal framework of PFS9 Before that legislation PFS was based on the Enforcement Decrees of the Budgeting and Accounting Act and the Fund Management Act these two laws were merged into the National Finance Act in 2006
The coverage of PFS is so extensive that it has made notable changes to the PIM system since its inception All new large-scale projects with a total cost of KRW50 billion (about US$50 million) or more are subject to the PFS With the National Finance Act the scope of the PFS was expanded to non-infrastructure projects (for example RampD) Local governments and PPI (private participation in infrastructure) projects are also subject to the PFS if the Central Government subsidy exceeds KRW30 billion
The following types of projects are exempted from the PFS typical building projects such as government offices and correctional institutions legally required facilities such as sewage and waste treatment facilities rehabilitating projects and restoration works from natural disasters projects implemented by international accords and by a SouthndashNorth Korea exchange and cooperation program and military facilities and projects related to national security
In every budget cycle of public infrastructure projects the PFS procedure is conducted as follows At the first stage a concerned line ministry submits a list of PFS candidate projects to the MOSF and the MOSF selects the PFS projects and requests PFS to PIMAC at KDI PIMAC organizes the research team conducts the PFS and submits the final PFS reports to the MOSF (figure x7) In the middle of conducting the PFS and making a final decision the PFS Review Committee takes charge of the whole review process
PAGE 14
K O R E A
P I M R E F O R M A F T E R T H E F I N A N C I A L C R I S I S C O U N T R Y C A S E S T U D Y K O R E A
PIM Reform after the Financial Crisis
2 0 1 2
T H E P O W E R O F P U B L I C I N V E S T M E N T M A N A G E M E N T
Figure x7 Preliminary Feasibility Study Procedures
Contents of PFS
The PFS is conducted in three phases background study main analyses and synthesis The background study reviews the statement of purpose and collects background data on socio-economic geographic and technical aspect of the project In addition key agendas for the main analyses are discussed in the background study through brainstorming
Line Ministry
Ministry of Strategy amp Finance
Korea Development Institute (Public and Private Infrastructure Investment Management Center)
Submit PFS projects candidate
Feasibility Study or Stop
Select PFS Projects
Request PFS
Make investment Decision
Announcement
Submit PFS Report
Organize Teams Conduct PFS
PAGE 15
K O R E A
P I M R E F O R M A F T E R T H E F I N A N C I A L C R I S I S C O U N T R Y C A S E S T U D Y K O R E A
PIM Reform after the Financial Crisis
2 0 1 2
T H E P O W E R O F P U B L I C I N V E S T M E N T M A N A G E M E N T
Figure x8 Outline of PFS Procedures and Contents
The main analyses in the PFS process are economic analysis policy analysis and balanced regional development analysis The backbone of the economic analysis is the cost-benefit analysis The economic benefit and economic cost of a project are estimated based on the forecasted demand The criteria of cost-benefit ratio NPV (net present value) and IRR (internal rate of return) are calculated based on the stream of annual benefit and cost As of 2007 a social discount rate of 55 percent in real terms is applied to the analysis based on the trend of risk free interstate rate in Korea
Policy analysis examines the potential effects of the projects in qualitative and quantitative terms including consistency with higher level policy possible project risk and other project-specific considerations In the consistency category the attitudes of the project owner and local residents toward the project and the level of preparedness of the project proposers are examined In the project risk category the risk of funding availability and the environmental risk of the project are evaluated
Balanced regional development analysis is an evaluation of the project from a regional perspective The regional backwardness index a composite index of eight characteristics for local entities was developed by the PFS guidelines The regional economic impact analysis is also conducted through the MRIO (Multi-Regional Input-Output) model
To synthesize the results of these economic policy and balanced regional development analyses the AHP (Analytic Hierarchy Process) technique is applied in the PFS AHP is a multi-
Project Proposal
Background Study
bull Review of Statement of purposebull Collect socio-economic
geographic and a technical data
bull Brainstorming (Other Alternatives)
bull PFS issues raised
Policy Analysis
bull Consistency with higher-level plan and policy directions
bull Project risk (financing and environmental impact)
bull Project-specific evaluation item
Balanced Regional Development Analysis
bull Regional backwardness index analysis
bull Regional Economic impact
Economic Analysis
bull Demand analysisbull Cost estimationbull Benefit estimationbull Cost-benefit analysisbull Sensitivity analysisbull Financial analysis
Analytic Hierarchy Process
bull Overall feasibilitybull Prioritizationbull Financing and policy
suggestion
Project ProposalProject Proposal
Background StudyBackground Study
bull Review of Statement of purposebull Collect socio-economic
geographic and a technical data
bull Brainstorming (Other Alternatives)
bull PFS issues raised
Policy AnalysisPolicy Analysis
bull Consistency with higher-level plan and policy directions
bull Project risk (financing and environmental impact)
bull Project-specific evaluation item
Balanced Regional Development Analysis
Balanced Regional Development Analysis
bull Regional backwardness index analysis
bull Regional Economic impact
Economic AnalysisEconomic Analysis
bull Demand analysisbull Cost estimationbull Benefit estimationbull Cost-benefit analysisbull Sensitivity analysisbull Financial analysis
Analytic Hierarchy ProcessAnalytic Hierarchy Process
bull Overall feasibilitybull Prioritizationbull Financing and policy
suggestion
PAGE 16
K O R E A
P I M R E F O R M A F T E R T H E F I N A N C I A L C R I S I S C O U N T R Y C A S E S T U D Y K O R E A
PIM Reform after the Financial Crisis
2 0 1 2
T H E P O W E R O F P U B L I C I N V E S T M E N T M A N A G E M E N T
criteria decision-making approach that enables user to combine quantitative and qualitative analyses into a decision through a hierarchical structure AHP is unique in providing a hierarchical framework to a complex problem by establishing majorminor factors and examining the importance of each factor through pair-wise comparison AHP enhances objectivity of decision-making by analyzing and managing the entire process of decision-making in steps and it ensures the consistency of weights derived from pair-wise comparison guaranteeing the robustness of decision-making
As a group decision support system AHP also enables the user to synthesize decisions of multiple decision makers Thus PFS team members comprising seven or eight experts from different organizations with different specialties rate the feasibility of a project through the AHP technique Diverse views on the level of feasibility are synthesized into a single score which results in a final decision on feasibility of a project
Figure x9 shows how AHP guides the synthesis of the analytical results of a project The PFS team sets the weight of each criterion through pair-wise comparison of each criterion against the others At the bottom level of the hierarchy are the two alternative judgments ldquoProject Implementationrdquo or ldquoStatus Quordquo (which means ldquoNot-Implementing the Projectrdquo) The score of the two alternatives are scaled to be summed up to 1 Hence if the Project Implementation alternative gets a score above 05 the project is evaluated as feasible
Figure X9 Structure of AHP in PFS
Overall FeasibilityOverall FeasibilityOverall FeasibilityOverall Feasibility
Economic AnalysisEconomic AnalysisBalanced Regional
Development AnalysisBalanced Regional
Development AnalysisPolicy AnalysisPolicy Analysis
Consistency with higher level planConsistency with higher level plan
Project riskProject riskProject-specific
factorProject-specific
factor
Attitu
de to
ward
the p
roje
ct
Attitu
de to
ward
the p
roje
ct
Consis
tency w
ith h
igher le
vel p
lan
Consis
tency w
ith h
igher le
vel p
lan
Pre
pare
dness
Pre
pare
dness
Pro
ject-
specific
item
(optio
nal)
Pro
ject-
specific
item
(optio
nal)
Fin
ancia
l feasib
ilityFin
ancia
l feasib
ility
Enviro
nm
enta
l impact a
ssessm
ent
Enviro
nm
enta
l impact a
ssessm
ent
Pro
ject-
specific
item
(optio
nal)
Pro
ject-
specific
item
(optio
nal)
Pro
ject-
specific
item
2
(optio
nal)
Pro
ject-
specific
item
2
(optio
nal)
Pro
ject-
specific
item
1
(optio
nal)
Pro
ject-
specific
item
1
(optio
nal)
Pro
ject-
specific
item
(optio
nal)
Pro
ject-
specific
item
(optio
nal)
Regio
nal e
conom
ic im
pacts
Regio
nal e
conom
ic im
pacts
Regio
nal b
ackw
ard
ness a
naly
sis
Regio
nal b
ackw
ard
ness a
naly
sis
Project ImplementationProject ImplementationProject Implementation Status QuoStatus QuoStatus QuoAlternativesAlternativesAlternatives
Level 1
Level 2
Level 3
PAGE 17
K O R E A
P I M R E F O R M A F T E R T H E F I N A N C I A L C R I S I S C O U N T R Y C A S E S T U D Y K O R E A
PIM Reform after the Financial Crisis
2 0 1 2
T H E P O W E R O F P U B L I C I N V E S T M E N T M A N A G E M E N T
PFS Evaluation Guidelines
PFS is based on three pillars of quality objectivity consistency and transparency In order to improve the objectivity of the evaluation and secure consistency among projects PIMAC developed evaluation guidelines PFS guidelines are detailed descriptions of methodology and procedures of PFS implementation PFS guidelines cover the following sectors roads railways ports airports dams and cultural facilities The guidelines stipulate that the same methodology is applied and the same or a similar dataset is used for different projects in the same sector For example the KT_DB (Korea Transport Database) should be used for all the road and railroad projects for consistency in evaluation results These guidelines are continuously revised through academic research The PFS guidelines for road and railroad projects in its fifth edition in 2009 provide specific procedures for assessing road projects (see box x1)
Box x1 How a Road Project Is Assessed in PFS Methodology cost-benefit analysis
x Criteria BC NPV (Net Present Value) IRR (Internal Rate of Return) x Social Discount Rate 55 percent (real term) x Duration Roads railways and seaports (30 yr) dams and water supply facilities (50 yr) x Tax is excluded but salvage value is included
Benefit of road project x Valuation of changes in route and travel speeds due to the project x Savings in travel time vehicle operation costs traffic accidents and environmental costs (air and noise
pollution) A multi-criteria decision-making approach by AHP (Analytical Hierarchy Process)
x Combines quantitative and qualitative criteria for decisions under a hierarchical structure x A group decision support system x Hierarchical structuring x Pair-wise comparison
Performance of PFS
Based on the PFS results only a project that has been assessed and meets the investment criteria can be approved and implemented Table x4 shows the number of PFS conducted from 1999 to 2009 A total of 437 projects were evaluated among which road (188 projects) and railway projects (79 projects) were dominant totals included 27 seaport projects 32 culture and tourism projects 34 water supply projects and 77 other projects Other projects included construction projects for welfare facilities airports and industrial complexs among others
PAGE 18
K O R E A
P I M R E F O R M A F T E R T H E F I N A N C I A L C R I S I S C O U N T R Y C A S E S T U D Y K O R E A
PIM Reform after the Financial Crisis
2 0 1 2
T H E P O W E R O F P U B L I C I N V E S T M E N T M A N A G E M E N T
Table x4 Number of PFS Submitted by Sector 1999ndash2009
Sector 1999 2000 2001 2002 2003 2004 2005 2006 2007 2008 2009 Sum Road 11 11 20 9 11 24 11 27 30 12 22 188
Railway 2 7 14 8 7 13 6 10 5 2 5 79
Seaport 1 5 1 2 3 1 2 5 1 4 2 27
Culture and Tourism
3 2 5 2 5 2 1 5 2 3 2 32
Water Resources
1 1 0 5 5 3 3 1 1 2 12 34
Others 1 4 1 4 2 12 7 4 7 15 20 77
Sum 19 30 41 30 33 55 30 52 46 38 63 437
Source Internal data (1999ndash2009) from PIMAC KDI
Table x5 shows the proportions of feasible projects 256 projects or 586 percent of 437 projects were evaluated as feasible The proportion of feasible projects for the road sector is 564 percent The highest rate of feasibility was for seaport projects at 778 percent and the projects in the culture and tourism sector had the lowest feasibility rate at 435 percent
Table x5 Proportion of Feasible Projects by Sector 1999ndash2009
of Submitted Projects Rated Feasible
Project Sector 1999 2000 2001 2002 2003 2004 2005 2006 2007 2008 2009 Total Projects (A)
Total Feasible Projects (B)
(B)(A) ()
Road 455 273 300 333 727 875 364 630 633 750 500 188 106 564
Railway 500 571 357 750 714 538 833 400 250 1000 800 79 44 557
Seaport 1000 800 1000 500 1000 1000 1000 400 1000 1000 500 27 21 778
Culture and tourism 1000 - 400 - - 1000 1000 400 500 1000 - 32 14 438
Water resources 1000 1000 - - 600 667 667 1000 1000 500 917 34 23 676
Others 1000 750 - 750 500 667 714 500 429 467 789 77 48 623
Average 632 500 341 433 606 745 633 538 565 684 677 437 256 586
Source Internal data (1999ndash2009) from PIMAC KDI Note mdash not applicable
Tables x6 and x7 show the results of PFS in terms of BC ratio and AHP score Until 2002 no technique was employed to combine BC ratio and the results of policy analyses Thus the overall PFS result was that a proposed project was announced as feasible or non-feasible along with the BC ratio During 1999ndash2002 nine projects were evaluated as non-feasible despite the fact that their BC ratios were greater than 1 The reasons were mostly their potential negative environmental impacts and difficulties in funding availability for local government projects On the
PAGE 19
K O R E A
P I M R E F O R M A F T E R T H E F I N A N C I A L C R I S I S C O U N T R Y C A S E S T U D Y K O R E A
PIM Reform after the Financial Crisis
2 0 1 2
T H E P O W E R O F P U B L I C I N V E S T M E N T M A N A G E M E N T
other hand 10 projects were evaluated as feasible with BC less than 1 The most important reason was a consideration of balanced regional development
Table x6 Feasiblenon-feasible Projects according to BC Ratios (1999ndash2002) Project numbers rated feasible or non-feasible
Year BC ge 1 BC lt 1
Total (A)
Feasible Non- feasible Feasible Non-
Feasible Feasible (B)
(B)(A) ()
1999 8 1 5 6 20 13 650
2000 14 3 1 12 30 15 500
2001 12 2 2 25 41 14 341
2002 11 3 2 14 30 13 433
Total ()
45 (372)
9 (74)
10 (83)
57 (471)
121 (1000) 55 455
Source Internal data (1999-2009) from PIMAC KDI
Table x7 shows the PFS results during 2003ndash09 In 2003 the AHP technique was officially employed to synthesize the economic and policy analyses From then on the PFS results were announced in terms of BC and AHP score Over that period 202 projects or 639 percent of 316 projects were evaluated and rated as feasible Five projects with BC greater than 1 received AHP scores of less than 05 and eventually were deemed non-feasible On the other hand 61 projects with BC less than 1 received AHP scores greater than 05
The PFS has contributed to enhance the fiscal efficiency of the PIM project selection process by preventing non-feasible projects from being launched During 1999ndash2009 a total of 437 PFS evaluations were conducted and the projects deemed non-feasible saved taxpayers funds that could be allocated to other uses
PAGE 20
K O R E A
P I M R E F O R M A F T E R T H E F I N A N C I A L C R I S I S C O U N T R Y C A S E S T U D Y K O R E A
PIM Reform after the Financial Crisis
2 0 1 2
T H E P O W E R O F P U B L I C I N V E S T M E N T M A N A G E M E N T
Table x7 Feasiblenon-feasible Projects according to BC Ratios and AHP Scores (2003ndash2009)
Project numbers rated feasible or non-feasible
Year BC ge 1 BC lt 1
Total (A)
AHPge 05
AHPlt 05
AHPge 05
AHPlt 05
Feasible (B)
(B)(A) ()
2003 18 0 2 13 33 20 606 2004 27 1 14 13 55 41 745 2005 15 1 4 10 30 19 633 2006 21 2 7 22 52 28 538 2007 19 0 7 20 46 26 565 2008 16 0 10 12 38 26 684 2009 25 1 17 19 62 42 677 Total ()
141 (446)
5 (16)
61 (193)
109 (345)
316 (1000) 202 639
Source Internal data (1999-2009) from PIMAC KDI
Procurement and Capital Budget Implementation Procurement and capital budget implementation on public investment programs and
projects has been managed mostly by a budget management system called the Total Project Cost Management System (TPCM) in the Ministry of Strategy and Finance TPCM aims to enhance fiscal productivity and to ensure a high quality of public construction work by properly adjusting and managing total project costs (TPC) throughout the implementation stages of a project The MOSF established the TPCM in 1994 and revises the ldquoGuidelines for Total Project Cost Managementrdquo on an annual basis
TPCM Manages PIP Construction Budgets
According to the National Finance Act the following types of construction projects are subject to the TPCM system
x Projects implemented by the Central Government or its agents or by local governments or private institutions relying on Central Government funding
x Projects with a construction period exceeding two years and
x Civil engineering projects whose TPC exceeds KRW 30 billion (USD 30 million) or architectural projects whose TPC exceeds KRW 10 billion (USD 10 million)
The TPC includes all cost items accrued throughout the life of the project including design land acquisition and construction costs regardless of whether the source of funding is the Central Government local governments or private institutions
Project costs should be managed by construction phase and by construction unit in reference to total construction cost The construction costs are not arbitrarily interchangeable between project
PAGE 21
K O R E A
P I M R E F O R M A F T E R T H E F I N A N C I A L C R I S I S C O U N T R Y C A S E S T U D Y K O R E A
PIM Reform after the Financial Crisis
2 0 1 2
T H E P O W E R O F P U B L I C I N V E S T M E N T M A N A G E M E N T
phases or between construction units When increases in construction size or costs are expected and even inevitable the minister in charge of the project must consult with the MOSF about adjusting the TPC
TPCM by Project Phase
The TPCM guidelines of the MOSF describe in detail how the rules and regulations of project management are carried out by project phase
Project conception phase The minister in charge of the project should make an appropriate estimate of the total cost and duration of the project and ask the MOSF for a PFS if the estimated total cost in the project conception phase is KRW 50 billion or more For local government projects the minister in charge should ask MOSF for a PFS if the funding of the project relies on a Central Government subsidy of KRW 30 billion or more
Phases of PFS and a (detailed) feasibility study The minister in charge should report on the project size TPC and project duration to MOSF for all the projects that have been evaluated as feasible by PFS and should ensure that the budget is drawn up by the end of January Detailed feasibility studies should cover the life cycle cost of the projects resulting from all technological environmental social and financial aspects as well as from land acquisition
Draft design phase The project management should ensure that enough money and time is spent on the draft design to prevent significant and frequent design modifications in the following construction phases The design team should collect various opinions from target citizens interests groups and related government authorities in order to minimize public discontent expected in the construction phase The minister in charge should consult value-engineering (VE) experts at least once before the end of this phase to prevent overestimation of costs and excessive construction
Blueprint design phase Size of the construction should not be modified significantly in this phase When it appears that a design modification or change in construction size is inevitable the minister in charge should discuss the matter with the MOSF The minister should also consult value-engineering experts at least once before the end of this phase to prevent overestimation of costs and excessive construction
Contracting phase MOSF informs the Administer of the Office of Supply Administration of the total construction cost after discussing it with the minister in charge When the contract cost exceeds the informed cost the Administer of the Office of Supply Administration should discuss the matter with the Minister of Strategy and Finance
Construction phase The minister in charge should try to minimize cost increases except when new construction techniques or new equipments are to be introduced to enhance the quality of the product substantially When an increase in costs change in construction size or change in construction duration are inevitable the minister in charge should submit a written explanation and discuss it with the Minister of Strategy and Finance
PAGE 22
K O R E A
P I M R E F O R M A F T E R T H E F I N A N C I A L C R I S I S C O U N T R Y C A S E S T U D Y K O R E A
PIM Reform after the Financial Crisis
2 0 1 2
T H E P O W E R O F P U B L I C I N V E S T M E N T M A N A G E M E N T
The line ministry is allowed to set construction contingencies for up to 8 percent of the contract price of a project to cope with inevitable design modification and amendment of the law and so on The line ministry can use its own discretion to change the TPC within the limit of these contingencies Contingencies apply only to the construction phase of a project
In general an increase in construction size through design modification is not allowed except for inevitable cases The base cost for a TPCM system is the contract cost determined by bidding not the cost estimate at design phase ldquoThe indicator adjustment formulardquo set by the Office of Supply Administration is applied to recalculate project costs incorporating inflationary effects
When a project under implementation violates the TPCM guidelines the Minister of Strategy and Finance can cut off or withhold budget allocation for the project The minister in charge can impose sanctions prohibiting invitation to tendering of construction projects on design teams when their work has resulted in a substantial cost increase due to unsatisfactory performance or when they intentionally or unintentionally fail to estimate the appropriate construction costs or sizes The minister in charge can petition the Minister of Strategy and Finance for changes in costs and project duration at any time through the Budget Information Management System when necessary
Reassessment Study of Feasibility and Reassessment of Demand Forecast
The Reassessment Study of Feasibility (RSF) aims to check unnecessary cost increases by re-affirming the feasibility of projects under implementation and scrutinizing the adequacy of the cost increase The MOSF conducts the RSF on a project if the PFS has not been conducted although it falls under the PFS coverage or if the TPC has increased by more than 20 percent (excluding inflationary effects and increase in land acquisition cost) of the cost confirmed by the Minister of Strategy and Finance at the previous phase of the project Also according to the amendment of the National Finance Act in 2009 the Board of Audit and Inspection is entitled to request that the MOSF conduct an RSF if there is a need
The line ministries conduct the RSF on a project with miscellaneous changes in construction costs and report it to the Minister of Strategy and Finance The RSF guidelines suggest that the RSF should include but should not be limited to the following components
x Outline of a project
x Analysis of background data and project issue raised
x Analysis on adequacy of the plan including size of the project
x Economic analysis including cost-benefit analysis
x Policy analysis
x Overall assessment including judgment on whether or not to continue a project and if the TPC increase is adequate
Based on these analyses the RSF team makes an overall assessment including a judgment as to whether or not to continue a project and if the TPC increase is adequate While the PFS focuses
PAGE 23
K O R E A
P I M R E F O R M A F T E R T H E F I N A N C I A L C R I S I S C O U N T R Y C A S E S T U D Y K O R E A
PIM Reform after the Financial Crisis
2 0 1 2
T H E P O W E R O F P U B L I C I N V E S T M E N T M A N A G E M E N T
on evaluating the feasibility of a project RSF puts relatively more emphasis on finding alternatives to cut down the size and cost of a project The MOSF reflects the RSF results in adjusting the TPC When the RSF results show that a project has turned out to be unfeasible the RSF team works on curtailing project size with the intent of improvinh its feasibility When no alternative way to secure the feasibility of the project is found the MOSF decides whether to stop implementing the project
Reassessment of demand forecast (RDF) is a device that verifies the adequacy of the demand forecast for a public investment project conducted in the past with the latest information By minimizing inevitable forecasting error RDF aims to improve the efficiency of expenditure and to prevent squandering of financial resources by managing demand fluctuation of large-scale long-term infrastructure projects throughout the phases of a project
The transportation facilities including roads rail airports and ports that are subject to TPCM are also subject to RDF if required The RDF is to be conducted during any of the following phases when the requirements for the reassessment are met (1) before or during completion of the basic plan or feasibility study (2) before or during completion of draft design (3) before or during completion of detailed design (4) during the construction period andor (5) when it is deemed necessary by the Minister of Strategy and Finance or the head of Central Government agency either of whom may request a RDF before or during a feasibility study or design development
The RDF shall be conducted when there are substantial changes in demand forecasts as stipulated in the following (1) when the RDF is deemed necessary because a significant decrease of demand is anticipated due to material changes in the premises on which previous demand forecasts had been made or errors had been made during implementing the methodology for demand forecasts (2) when the RDF is deemed necessary because a project has been converted to a PPP project from a conventional government procured project (3) when more than five years have passed since the latest demand forecast had been conducted andor (4) when it is deemed necessary by the Minister of Strategy and Finance or the head of line ministry
The RDF virtually belongs to the MOSF In order to ensure objectivity and transparency during the RDF process the Minister of MOSF or the minister of the line ministry responsible for the RDF may contract a specialized institution(s) to conduct the RDF When the RDF is completed the Minister of MOSF notifies the minister of line ministries of the results When it is identified that the demand forecast for a project has decreased by 30 percent or more however the MOSF begins RSF and notifies the minister of line ministries in accordance with RSF guidelines
Performance of TPCM RSF and RDF
Table x8 shows the total number of Total Project Cost Management System (TPCM) projects and the projects in which the total project costs (TPC) were adjusted during 1994ndash2005 The total number of TPCM projects increased sharply in 1999 when the PIM system was established in a rigorous way The proportion of projects for which TPC were required shows an increase from 540 percent in 2002 to 718 percent in 2005 However the percentage of projects for
PAGE 24
K O R E A
P I M R E F O R M A F T E R T H E F I N A N C I A L C R I S I S C O U N T R Y C A S E S T U D Y K O R E A
PIM Reform after the Financial Crisis
2 0 1 2
T H E P O W E R O F P U B L I C I N V E S T M E N T M A N A G E M E N T
which the TPC rose by more than substantially decreased from 119 percent in 1996 to 37 percent in 2004
Table x8 Number of Projects with Substantial Change in TPC
Year No Projects under PCM (A)
No Projects that TPC adjusted (B)
BA() No Showing Increase in TPC by over 20 (C)
(C)(A) ()
1994 218 - -
1995 207 19 92
1996 159 19 119
1997 189 20 106
1998 183 17 93
1999 459 15 33
2000 483 24 50
2001 602 26 43
2002 602 325 540 10 17
2003 667 392 587 15 22
2004 698 493 706 26 37
2005 760 546 718
Source Internal data from the Ministry of Strategy and Finance
Table x9 shows that line ministries in charge of the projects requested an increase of KRW 196 trillion and about half (495 percent) of the requested amount (KRW 097 trillion) was adjusted into the TPC While 957 percent of requests for TPC increase due to miscellaneous design change were accepted by the MOSF only 432 percent of requests due to substantial design change were adjusted into the TPC
Table x9 Sources of in Total Project Cost Adjustment
Value of miscellaneous design changes KRW billions
Value of substantial design changes KRW billions Sum KRW billions
Request for TPC increase (A) 2331 17320 19651 Projects that TPC adjusted (B) 2253 7480 9733 (B)(A) () 967 432 495 Source Internal data from the Ministry of Strategy and Finance
Note Miscellaneous design changes include changes due to factors of traffic safety and unexpected ground conditions substantial design changes include changes in route change in type of bridges and tunnels and an increase in quantity to incorporate request by local government or local citizens
PAGE 25
K O R E A
P I M R E F O R M A F T E R T H E F I N A N C I A L C R I S I S C O U N T R Y C A S E S T U D Y K O R E A
PIM Reform after the Financial Crisis
2 0 1 2
T H E P O W E R O F P U B L I C I N V E S T M E N T M A N A G E M E N T
Table x10 shows the trend of requests for TPC increase in terms of percentage of TPC During 1996ndash99 the line ministries requested an increase of 264 percent of TPC and 421 percent of the requested amount was adjusted into the TPC During 2000ndash03 however the requests dropped to as low as 44 percent of TPC and the acceptance rate also decreased to 227 percent
Table x10 Trend of Requests for TPC Increase
TPC Increase requested
1996ndash99 2000ndash03
Request for TPC increase (A) 264 44
TPC adjusted (B) 111 10
(B)(A) () 421 227
Source Internal data from the Ministry of Strategy and Finance
Table x11 shows the number of RSF studies conducted by sector during 2003ndash09 Road projects take up the largest share in the sectoral distribution of RSF The RSFs on buildings (museums and tourism) takes up 177 percent in terms of the total number of RSFs conducted
Table x11 Number of RSF by Sector 2003ndash09
2003 2004 2005 2006 2007 2008 2009 Sum
Road 2 2 6 10(2) 9(1) 9(3) 28(7) 66
Railway 0 1(1) 0 0 2(1) 2 1 6
Port 0 0 0 0 3 2 3 8 Buildings (museums and tourism) 2 3 3 4 1 6(2) 1 20
Water resources (dam) 0 0 0 5 0 1 2 8
ITRampD 0 0 0 0 0 0 1(1) 1
Others 0 0 0 1 3 0 0 4
Total 4 6(1) 9 20(2) 18(2) 20(5) 36(8) 113(18)
Source Internal data from the Ministry of Strategy and Finance
Out of 113 projects 18 were suspended as a result of RSF evaluations The results show higher percentages of feasible projects relative to PFS because while PFS focuses on evaluating the feasibility of a project RSF puts relatively more emphasis on finding alternatives to cut down the size or cost of a project
Table x12 shows the change in TPC by RSF The sum of initial TPC for projects conducted in 2003ndash09 was KRW 273 trillion and the line ministries requested a total of KRW 424 trillion So the RSF results suggested adjusting the total TPC to 347 trillion implying that KRW 77 trillion or 181 of TPC requested were cut through the RSF
PAGE 26
K O R E A
P I M R E F O R M A F T E R T H E F I N A N C I A L C R I S I S C O U N T R Y C A S E S T U D Y K O R E A
PIM Reform after the Financial Crisis
2 0 1 2
T H E P O W E R O F P U B L I C I N V E S T M E N T M A N A G E M E N T
Table x12 Results of RSF (change in total project costs KRW billions)
Initial TPC (A) TPC requested (B)
TPC by RSF (C)
(D) =(C)-(B)
(D)(B) ()
2003 1587 6137 5491 ndash646 ndash105
2004 291 711 613 ndash97 ndash136
2005 842 1511 1039 ndash472 ndash313
2006 3954 6826 3788 ndash3039 ndash445
2007 4141 4801 4040 ndash761 ndash159
2008 10569 13579 11998 ndash1581 ndash116
2009 5936 8859 7762 ndash1097 ndash124
Total 27320 42424 34731 ndash7693 ndash181
Source Internal data from the Ministry of Strategy and Finance
Until 2009 only two RDFs have been conducted since the RDF was introduced in 2006 the fourth section of the Hamyang-Ulsan Expressway and Kyungin Cannel project Based on the results of RDFs the MOSF decided to reduce the total cost limits on both projects
Performance Management and Evaluation of Completed Projects Three-tier systems of performance management and evaluation of completed projects were
simultaneously introduced within the Ministry of Strategy and Finance (1) Performance Monitoring System (2) S elf-Assessment System and (3) In-Depth Evaluation System Table x13 explains the main features of these systems
PAGE 27
K O R E A
P I M R E F O R M A F T E R T H E F I N A N C I A L C R I S I S C O U N T R Y C A S E S T U D Y K O R E A
PIM Reform after the Financial Crisis
2 0 1 2
T H E P O W E R O F P U B L I C I N V E S T M E N T M A N A G E M E N T
Table x13 Systems of Performance Management and Evaluation
Performance Monitoring Self-Assessment In-Depth Evaluation
Method
Establish objectives and indicators and use the results in government budget operation (Prepare performance report)
Provide a check list of projects for review and keep track of which projects are operated properly and which are making progress and so on
Apply scientific evaluation methods to each project to analyze spot problems and provide an alternative (Prepare evaluation report)
Main responsible body
Each ministry (Budget Division) Each Ministry (Budget division) and budget authority
Each Ministry (Project Management Division)
Applicable project
All policies and programs 20ndash30 of all Individual programs and projects
Merits
An overall progress report can be completed but not enough information can be given on individual project basis
Trade-off between Performance Monitoring and Program Evaluation
Detailed information can be given on an individual project basis but due to excessive time and costs this method is not suitable for all projects
Application
Used in management of performance of an organiza-tion as reference material for setting budget and in preparation of performance budget report
Used in improvement of project operating method and as (deliberation) reference for setting budget
Used in improvement of project operating method
Source Ministry of Strategy and Finance
Performance Monitoring System
The Performance Monitoring System (PMS) which started in the spring of 2003 requires line ministries to set up performance goals and indicators prepare annual performance plans and performance reports and submit them to the MOSF at the start of the annual budget cycle The MOSF is in charge of ensuring the system is in place by examining the status of PMS in line ministries coordinating the implementation and feeding the results back to resource allocation
PMS covers only part of the ministriesrsquo investment programs as those activities not involving large sums of expenditure (such as pure policy-making) are excluded from performance monitoring In addition activities for which the benefits of performance monitoring are expected to be small (such as wages and salaries ldquobasic programrdquo expenditures10 and general administrative expenses) are excluded as well
A performance report describes in a systematic way the degree to which program goals have been met It should list performance goals and indicators as originally set out in the performance plan describe the level of performance in terms of these goals and indicators explain the reasons for any poor performance summarize the assessment and describe future plans Optionally it can include audit results by the Board of Audit and Inspection and summarize findings of program evaluations
PAGE 28
K O R E A
P I M R E F O R M A F T E R T H E F I N A N C I A L C R I S I S C O U N T R Y C A S E S T U D Y K O R E A
PIM Reform after the Financial Crisis
2 0 1 2
T H E P O W E R O F P U B L I C I N V E S T M E N T M A N A G E M E N T
PMS will provide one source of information for budget allocation across sectors and programs Line ministries should present performance information when requesting budgets and the MOSF will utilize it when preparing the medium term National Fiscal Management Plan and drafting the budget
The PMS like its pilot project has not been very successful so far It received only lukewarm support from the top management in the MOSF Line ministries also showed little enthusiasm for the PMS In most cases performance indicators prepared by line ministries were not derived from ministerial missions in a systematic fashion Most importantly performance reports were not open to the public giving little incentive for line ministries to think seriously about the exercise
Program Review System Self-Assessment of Budgetary Programs
The Program Review System for Self-Assessment of Budgetary Programs (SABP) was introduced in 2005 by the MOSF to enhance links between performance evaluation and budget allocation It was designed after the Program Assessment Rating Tool (PART) of the US Government This program requires line ministries to assess their own programs with spending levels above a certain threshold The assessment was intended to cover all ministerial programs in a cycle of three years The assessment is based on 14 questions common to all types of programs and a few additional questions specific to different types of programs11 Table x14 shows the contents of checklist for the SABP
Table x14 Contents of Checklist for the SABP
Classification ( points weight of rating) Checklists
Design and planning (30)
y Program purpose y Rationale for government spending y Duplication with other programs y Efficiency of program design y Relevance of performance objectives and indicators y Relevance of performance targets
Management (20)
y Monitoring efforts y Obstacles of program implementation y Implementation as planned y Efficiency improvement or budget saving
Results and accountability (50)
y Independent program evaluation y Results y Satisfaction of citizens y Utilization of evaluation results
Source Park (2008)
A pilot SABP for government-financed projects was introduced in 2005 with input from various ministries and experts and a guideline for SABP was then distributed to each ministry Each ministry was to execute a self-evaluation and submit the results to the MOSF within two
PAGE 29
K O R E A
P I M R E F O R M A F T E R T H E F I N A N C I A L C R I S I S C O U N T R Y C A S E S T U D Y K O R E A
PIM Reform after the Financial Crisis
2 0 1 2
T H E P O W E R O F P U B L I C I N V E S T M E N T M A N A G E M E N T
months The evaluation took place within 40 departments of the relevant ministries for 555 projects budgeted at a total of KRW 35 trillion in project costs While the MOSF reviewed the results the relevant ministries were allowed to submit any questions or objections at two different intervals and these were reviewed again
The results of the SABP for 2005ndash07 are shown in figure x10 During the period a total of 1716 sub-programs were assessed for performance in fiscal years 2004 2005 and 2006 The figure shows the distribution of the total scores across the programs In 2005 the proportion of sub-programs in different departments in the ministries that were rated as ineffective was 157 percent and 52 percent of the programs were rated as effective The distribution of sub-program ratings did not change much between 2005 and 2006 but it improved in 2007 The proportion of ineffective programs dropped to 5 percent and that of effective sub-programs doubled This change in sub-program ratings in 2007 is attributed to the improvement of sub-program performance and agencies learning from a couple of yearsrsquo experience with SABP
Figure x10 Result of Self-Assessment of Budgetary Programs 2005ndash07 of total ratings
Source Park (2008)
Table x15 explains the linkage between SABP results and budget allocation in 2007 The programs rated as ineffective went through a 53 percent budget cut compared to the 2006 budget The main reason for this linkage between SABP results and budget allocation is that MOSF encouraged ministries to make use of assessment results in their budget requests announcing that a 10 percent of budget cut would be imposed on the programs rated as ineffective
PAGE 30
K O R E A
P I M R E F O R M A F T E R T H E F I N A N C I A L C R I S I S C O U N T R Y C A S E S T U D Y K O R E A
PIM Reform after the Financial Crisis
2 0 1 2
T H E P O W E R O F P U B L I C I N V E S T M E N T M A N A G E M E N T
Table x15 Linkage between SABP results and Budget Allocation 2007 KRW millions
2006 Budget
(A)
2007 Budget
(B) (B)-(A)
(B-A)(A)
()
Effective 889 887 -2 ndash02
Moderately Effective 3316 3565 249 75
Adequate 29718 28997 -721 ndash24
Ineffective 1143 538 ndash605 ndash529
Total 35066 33987
Source Park (2008)
Program Evaluation System In-Depth Evaluation Program
Under the current legal and administrative framework two methods of performance evaluation of public infrastructure investment are available One is performance evaluation as stipulated by the Enforcement Decree of Construction Technology Management Act The other one is In-depth Evaluation of Budgetary Programs (IEBP) under the Performance Management System12 IEBP analyzes the different factors that at different stages contribute to the performance of a government program by using scientific and systematic techniques The IEBP results are applied to improve and reform the system of operating programs
The Enforcement Decree of the Act requires the spending agency to file a performance evaluation report for construction projects whose total costs are KRW 50 billion or more In accordance with the Act MLTM established ldquoGuidelines for Performance Evaluations of Construction Projectsrdquo effective as of 2001 The guidelines outline the necessary details including the timing and methodologies for conducting performance evaluations required by government agencies These guidelines suggest that the performance evaluations be based on the Design and Implementation Evaluation Report and the Project Completion Report while comprehensively referring to all related materials including the (Pre-feasibility) Feasibility Study results
Despite the stipulation of the Enforcement Decree of the Construction Technology Management Act that requires the spending agency to file a performance evaluation report within three years of completion only a small number of performance evaluations were conducted until 2009 One reason is that there was no sanction against violation of the decrees thus the spending agencies have no incentive to implement these self-evaluations To draw lessons learned through the evaluation it is necessary to find some problems during the implementation process of the project The line ministry which is supposed to coordinate the evaluation did not take an active interest in this new system The other reason for slow progress in performance evaluation is that no clear framework for evaluation had been established A performance evaluation tracks whether a project or program achieves its objectives and secures the expected outcome The basic questions to be determined are what and how to evaluate However many projects have no clear concept of performance to be achieved by public investment For example many road construction projects under the national highway system have been regarded as just ldquonaturalrdquo It is not rare to find a statement of purpose for a road construction project that requires more than hundreds of billions
PAGE 31
K O R E A
P I M R E F O R M A F T E R T H E F I N A N C I A L C R I S I S C O U N T R Y C A S E S T U D Y K O R E A
PIM Reform after the Financial Crisis
2 0 1 2
T H E P O W E R O F P U B L I C I N V E S T M E N T M A N A G E M E N T
of KWS written in a single line ldquoTo relieve traffic congestionrdquo Since the basic concept of performance evaluations is to assess whether a project or a program achieves its objectives unless there is a clear target for a project or a program any assessment is going to be difficult
Under IEBP from 2005 to 2009 a total of 45 programs were evaluated initiated and controlled by the MOSF team With a wide coverage of areas for IEBP programs the MOSF seemingly tended to distribute the programs relatively evenly across line ministries Budgetary size was not considered as an essential criterion since half of the selected programs had an annual budget of less than KRW 100 billion The period of program implementation varies from program to program half of the programs had been in operation from four to ten years before being evaluated Although in principle IEBP was established for a single program eight programs containing three or more unit programs had been evaluated
IEBP still has a lot of trouble with implementing and feeding back results Since the availability of its database was strictly limited only 20 percent of the evaluation studies were subject to empirical analysis Data for evaluation analysis often does not exist and even when it does government officials in line ministries and agencies have given little attention to it The selection process for each IEBP has sometimes proved to be a tricky process since different purposes and approaches were taken by the MOSF and line ministries
Lessons Learned and Challenges Ahead The period after the economic crisis in 1997 witnessed many reform efforts intended to
enhance efficiency and transparency in developing and managing public infrastructure investment programs in Korea The MOSF has played a leading role in implementing an effective appraisal and evaluation system tightening the expenditure monitoring of total project cost and introducing a new budgeting system called the Medium Term Expenditure Framework (MTEF) In the past line ministries had ownership of the feasibility study process while the finance ministry used it to cut project budgets although not always on a reasonable basis With the reforms MOSF now makes the final decision on the project appraisal and determines the budget for it while the line ministries are responsible for identifying designing prioritizing and forecasting the effects of the project MOSF established a separate PIM Department responsible for the PIM reforms of PFS TPCM and RSF and these systems now mitigate information asymmetry between the finance ministry and line ministries and lead to better decision-making
The preliminary feasibility study (PFS) begun in 1999 and independently conducted mainly by the PIMAC at KDI seems to have been successful in handling the pass-or-fail hurdle of the project selection process An independent review of PFS by PIMAC used some help from policy analysts to make judgments on project desirability and their judgments were respected in most Government decision-making If policy analysis played merely a symbolic role and politicians and bureaucrats had disincentives to use this policy analysis such an independent judgment could not be made
PAGE 32
K O R E A
P I M R E F O R M A F T E R T H E F I N A N C I A L C R I S I S C O U N T R Y C A S E S T U D Y K O R E A
PIM Reform after the Financial Crisis
2 0 1 2
T H E P O W E R O F P U B L I C I N V E S T M E N T M A N A G E M E N T
The total project cost management system (TPCM) strengthened after the crisis appears to be working satisfactorily by limiting the frequency and amount of TPC increases in line ministries A reassessment study of feasibility (RSF) has been introduced as an innovative tool to control the total project cost limit in the middle of TPCM although there have been a few projects cancelled by RSF However the introduction of the performance monitoring and evaluation system is still lagging behind in Korea A greater emphasis on program evaluation is needed Once the Government adopts a performance orientation it can then encourage a greater use of performance contracts
Initiation of PFS in 1999 was a first step in the reform of PIM system in Korea which gave the Government the impetus to produce an effective sequencing of reforms in parallel with the project cycles with RSF and RDF coming later and then implementing performance evaluation last In order to improve the objectivity of the evaluation and secure consistency among projects standard evaluation and decision-making guidelines and manuals have been developed and published by the MOSF and PIMAC Sector guidelines and manuals in line ministries apply the same methodology and use the same or similar datasets for different projects in the same sector
The new PIM process and its capital budgeting has rooms for improvement The capacity for planning and prioritizing public investment programs in line ministries should be enhanced The planning and budget divisions of individual line ministries should play a greater role in the coordination of ministerial policies and budget requests unlike in previous years when they would simply compile budget requests from program divisions and send them to the MOSF with little modification The role of the MOSF should be changed as well As a central coordinator of government policies the MOSF should strengthen its capacity for policy analysis and long-term forecasts It should put less stress on input control and pay more attention to outputs and outcomes
PAGE 33
K O R E A
P I M R E F O R M A F T E R T H E F I N A N C I A L C R I S I S C O U N T R Y C A S E S T U D Y K O R E A
PIM Reform after the Financial Crisis
2 0 1 2
T H E P O W E R O F P U B L I C I N V E S T M E N T M A N A G E M E N T
Notes 1 Other social insurance programsmdashIndustrial Accident Insurance (1964) National Pension
(1988) and Employment Insurance (1995)mdashwere introduced and expanded in a similar fashion but their impact on total spending has been rather limited until recently
2 1 Examples include the West Coast Expressway Seoul-Busan High-speed Railroad and Incheon International Airport Even though such infrastructure investment takes the lionrsquos share of the spending on economic affairs it should be noted that the latter also includes subsidies to producers (farmers small and medium-sized enterprises and so on) and other possibly unproductive spending
3 1 von Hagen and Harden (1996) described two approaches to budgeting Under a target-based approach the Government collectively negotiates a set of binding numerical targets for the budget The budget process starts with negotiations among concerned parties over binding limits on the spending total or budget deficits Once these limits have been agreed upon they must be observed during the remainder of the budget process On the other hand under a strategic dominance-based approach the budget process vests the budget authorities with special strategic powers
4 1 In front-loading exercises the MOSF would allocate more funds than usual to the first half of the year and urge line ministries to spend the allocated funds as early as possible When necessary that is when growth is slower than expected despite front-loading the MOSF would consider introducing supplementary funds in the latter half of the year
5 5Potter and Diamond (1999) Schiavo-Campo and Tommasi (1999) and World Bank (1998) provide a useful guide on the reform in this direction
6 1 Ceilings are set for 14 spending areas such as social infrastructure agriculture education and environment then disaggregated into 56 programs for example social infrastructure has seven programs including roads railways subways ports airports housing and water resources Separate ceilings are also set within each program for the general account and various special accounts and funds
7 The former body of MPB was the Board of Planning and Budget which merged with the Office of National Budget to create MPB in May 1999 Subsequently merging with the Ministry of Finance and Economy the MPB became the MOSF in 2008
8 In January 2005 the Government of Korea passed an amendment to the 1999 Act on Private Participation in Infrastructure establishing the Public and Private Infrastructure Investment Management Center (PIMAC) as a new unit PIMAC is a merger between Private Infrastructure Investment Center of Korea (PICKO) of Korea Research Institute for Human Settlements established in 1999 and PIMA of KDI
9 The hierarchy of the legal framework in Korea is as follows ConstitutionndashActndashEnforcement DecreesndashMinisterial Ordinance
10 In Korea programs with small and recurrent costs are designated as ldquobasic programsrdquo after negotiation between line ministries and the MOSF Others are designated as ldquomajor programsrdquo
11 Types of programs are infrastructure investment procurement of large-scale facilities and equipment provision of direct services capital injection subsidies to private entities grants to local governments and RampD
PAGE 34
K O R E A
P I M R E F O R M A F T E R T H E F I N A N C I A L C R I S I S C O U N T R Y C A S E S T U D Y K O R E A
PIM Reform after the Financial Crisis
2 0 1 2
T H E P O W E R O F P U B L I C I N V E S T M E N T M A N A G E M E N T
12 As was pointed out Korea introduced the three-tier system for performance management and evaluation of budgetary programs performance monitoring program review and program evaluation IEBP is a core part of program evaluation
Bibliography Bank of Korea (var years) ldquoDatabase on Flow of Funds Accountsrdquo Bank of Korea Seoul
Kim Jay-Hyung 2003 Developing a Performance Evaluation System in Korea Edited by Chae-hyong
Kim Jay-Hyung 2012 ldquoPublic Investment Management Reform in Korea Efforts for Enhancing Efficiency and Sustainability of Public Expenditurerdquo Korea Development Institute
Kim and Hanguk Kaebal Yonguwon Seoul Korea Korea Development Institute
Koh Youngsun 2005 ldquoReforming the Fiscal Management System in Koreardquo Working paper Korea Development Institute Seoul Korea
Korea Development Institute 2004 The Standard Guideline for Preliminary Feasibility Studies on Road and Railway Projects 4th ed (in Korean) Seoul Korea Korea Development Institute
Ministry of Planning and Budget Korea 2007a ldquoGuidelines for Preliminary Feasibility Study Systemrdquo (in Korean) MOPB Government of Korea Seoul
Ministry of Planning and Budget Korea 2007b ldquoGuidelines for Total Project Cost Management Systemrdquo (in Korean) MOPB Government of Korea Seoul
MOCT (Ministry of Construction and Transportation Korea 1999 ldquoComprehensive Plan for Public Investment Budget Savingsrdquo(in Korean) MOCT Government of Korea Seoul
MOSF (Korea Ministry of Strategy and Finance) Government Finance Statistics in Korea various issues MOSF Government of Korea Seoul
MOSF (Korea Ministry of Strategy and Finance) various years National Statement for Current Bonds respective year MOSF Government of Korea Seoul
mdashmdashmdash various years National Statement for Current Bonds respective year MOSF Government of Korea Seoul
National Assembly Budget Office Korea 2004 ldquoSome Points at Issue in Preliminary Feasibility Study and Its Future Directionrdquo (in Korean) [[]] Government of Korea Seoul
OECD (Organisation for Economic Co-operation and Development) Various years Economic Surveys Korea Paris OECD
Perrin Burt 2002 ldquoImplementing the Vision Addressing Challenges to Results-focused Management and Budgetingrdquo Paris OECD
PAGE 35
K O R E A
P I M R E F O R M A F T E R T H E F I N A N C I A L C R I S I S C O U N T R Y C A S E S T U D Y K O R E A
PIM Reform after the Financial Crisis
2 0 1 2
T H E P O W E R O F P U B L I C I N V E S T M E N T M A N A G E M E N T
Park Nowook 2008 ldquoPerformance-oriented Budgeting in Korea Evidence and Lessonsrdquo Korea Institute of Public Finance Seoul
Potter Barry H and Jack Diamond 1999 Guidelines for Public Expenditure Management Washington DC International Monetary Fund
Schiavo-Campo Salvatore and Daniel Tommasi 1999 Managing Government Expenditure Manila Asia Development Bank
von Hagen Jurgen and Ian Harden 1996 ldquoBudget Processes and Commitment to Fiscal Disciplinerdquo IMF Working Paper WP9678 International Monetary Fund Washington DC
World Bank 1998 Public Expenditure Management Handbook Washington DC World Bank
2004 The General Guideline for Preliminary Feasibility Studies 4th ed (in Korean) Seoul Korea Korea Development Institute
mdashmdashmdash various years Korea Consolidated Fiscal Balance MOSF Government of Korea Seoul
mdashmdashmdash 2005a Annex to Summary of 2005 Budget MOSF Government of Korea Seoul
mdashmdashmdash 2005b Performance Management Handbook MOSF Government of Korea Seoul
World Bank 2003 ldquoWorld Development Indicatorsrdquo World Bank Washington DC
1 Other social insurance programsmdashIndustrial Accident Insurance (1964) National Pension (1988) and Employment Insurance (1995)mdashwere introduced and expanded in a similar fashion but their impact on total spending has been rather limited until recently
2 Examples include the West Coast Expressway Seoul-Busan High-speed Railroad and Incheon International Airport Even though such infrastructure investment takes the lionrsquos share of the spending on economic affairs it should be noted that the latter also includes subsidies to producers (farmers small and medium-sized enterprises and so on) and other possibly unproductive spending
3 von Hagen and Harden (1996) described two approaches to budgeting Under a target-based approach the Government collectively negotiates a set of binding numerical targets for the budget The budget process starts with negotiations among concerned parties over binding limits on the spending total or budget deficits Once these limits have been agreed upon they must be observed during the remainder of the budget process On the other hand under a strategic dominance-based approach the budget process vests the budget authorities with special strategic powers
4 In front-loading exercises the MOSF would allocate more funds than usual to the first half of the year and urge line ministries to spend the allocated funds as early as possible When necessary that is when growth is slower than expected despite front-loading the MOSF would consider introducing supplementary funds in the latter half of the year
5Potter and Diamond (1999) Schiavo-Campo and Tommasi (1999) and World Bank (1998) provide a useful guide on the reform in this direction
6 Ceilings are set for 14 spending areas such as social infrastructure agriculture education and environment then disaggregated into 56 programs for example social infrastructure has seven programs including roads railways subways ports airports housing and water resources Separate ceilings are also set within each program for the general account and various special accounts and funds
7 The former body of MPB was the Board of Planning and Budget which merged with the Office of National Budget to create MPB in May 1999 Subsequently merging with the Ministry of Finance and Economy the MPB became the MOSF in 2008
8 In January 2005 the Government of Korea passed an amendment to the 1999 Act on Private Participation in Infrastructure establishing the Public and Private Infrastructure Investment Management Center (PIMAC) as a new unit PIMAC is a merger between Private Infrastructure Investment Center of Korea (PICKO) of Korea Research Institute for Human Settlements established in 1999 and PIMA of KDI
9The hierarchy of the legal framework in Korea is as follows ConstitutionndashActndashEnforcement DecreesndashMinisterial Ordinance
10 In Korea programs with small and recurrent costs are designated as ldquobasic programsrdquo after negotiation between line ministries and the MOSF Others are designated as ldquomajor programsrdquo
PAGE 36
K O R E A
P I M R E F O R M A F T E R T H E F I N A N C I A L C R I S I S C O U N T R Y C A S E S T U D Y K O R E A
PIM Reform after the Financial Crisis
2 0 1 2
T H E P O W E R O F P U B L I C I N V E S T M E N T M A N A G E M E N T
11 Types of programs are infrastructure investment procurement of large-scale facilities and equipment provision of direct services capital injection subsidies to private entities grants to local governments and RampD
12 As was pointed out Korea introduced the three-tier system for performance management and evaluation of budgetary programs performance monitoring program review and program evaluation IEBP is a core part of program evaluation

PAGE 3
K O R E A
P I M R E F O R M A F T E R T H E F I N A N C I A L C R I S I S C O U N T R Y C A S E S T U D Y K O R E A
PIM Reform after the Financial Crisis
2 0 1 2
T H E P O W E R O F P U B L I C I N V E S T M E N T M A N A G E M E N T
KOREA The financial crisis that hit the Republic of Korea in the second half of 1997 had a devastating impact on its economy causing the worst recession since the Korean War era To address the fundamental causes of the crisis and revitalize the economy the Korean Government took bold decisive steps to initiate comprehensive structural reforms The major focus of reform in the fiscal and public sector was to adopt a series of initiatives for strengthening public investment management The Government endeavored to instill a performance-oriented approach in the system which implies management of public expenditure based on the principle of value for money This chapter explains the institutional setting for public investment management (PIM) and the Korean Governmentrsquos efforts to develop and manage a comprehensive PIM reform to further improve value for the money invested The Ministry of Strategy and Finance played a leading role by implementing an effective appraisal and evaluation system to tighten the expenditure monitoring of total project cost and introducing a new budgeting system called the Medium Term Expenditure Framework An initiative of the preliminary feasibility study (PFS) introduced in 1999 and conducted mainly by the Public and Private Infrastructure Investment Management Center has been successful in handling the pass-or-fail bottleneck of the whole project selection process The total project cost management system (TPCM) strengthened after the crisis is working satisfactorily by discouraging the request frequency and the amount of TPC increases in line ministries A reassessment study of feasibility is an innovative tool to control and keep the total project cost limit in the middle of TPCM However the performance monitoring and evaluation system on PIM still has room for improvement in Korea A greater emphasis on program evaluation is being called for with the Government currently establishing a performance-orientation a greater use of performance contracts can be encouraged
PAGE 4
K O R E A
P I M R E F O R M A F T E R T H E F I N A N C I A L C R I S I S C O U N T R Y C A S E S T U D Y K O R E A
PIM Reform after the Financial Crisis
2 0 1 2
T H E P O W E R O F P U B L I C I N V E S T M E N T M A N A G E M E N T
Contents Trends in Public Investment Expenditure 1
Institutional Framework for PIM 7
Recent Change from Bottom-Up to Top-Down Budgeting 8 New Initiatives in Public Investment Management 9
Project Appraisal by Preliminary Feasibility Study 12
Initiative for a Preliminary Feasibility Study 12 Contents of PFS 14 PFS Evaluation Guidelines 17 Performance of PFS 17
Procurement and Capital Budget Implementation 20
TPCM Manages PIP Construction Budgets 20 TPCM by Project Phase 21 Reassessment Study of Feasibility and Reassessment of Demand Forecast 22 Performance of TPCM RSF and RDF 23
Performance Management and Evaluation of Completed Projects 26
Performance Monitoring System 27 Program Review System Self-Assessment of Budgetary Programs 28 Program Evaluation System In-Depth Evaluation Program 30
Lessons Learned and Challenges Ahead 31
References 32
Bibliography 34
Endnotes Error Bookmark not defined
Figures
Figure x1 General and Central Government Spending 1980ndash2008 2 Figure x2 General Government Spending by Function 1980ndash2008 2 Figure x3 Capital Formation Trends by Sector 1980ndash2008 of GNI 6 Figure x4 Size of Government Fiscal Lending (as of balance) 1990ndash2008 of GDP 6 Figure x5 Chronology of New Initiatives in Korearsquos PIM System 10 Figure x6 Implementation Process of Public Investment Management 12 Figure x7 Preliminary Feasibility Study Procedures 14 Figure x8 Outline of PFS Procedures and Contents 15 Figure x9 Structure of AHP in PFS 16 Figure x10 Result of Self-Assessment of Budgetary Programs 2005ndash07 of total ratings 29
PAGE 5
K O R E A
P I M R E F O R M A F T E R T H E F I N A N C I A L C R I S I S C O U N T R Y C A S E S T U D Y K O R E A
PIM Reform after the Financial Crisis
2 0 1 2
T H E P O W E R O F P U B L I C I N V E S T M E N T M A N A G E M E N T
Tables Table x1 Consolidated Fiscal Expenditure and Net Lending by Central Government by Function 3 ( of total) 3 Table x2 Trend of Facility Stock by Transport Sector 4 Table x3 Major Players in Korearsquos Budget Process 8 Table x4 Number of PFS Submitted by Sector 1999ndash2009 18 Table x5 Proportion of Feasible Projects by Sector 1999ndash2009 18 Table x6 Feasiblenon-feasible Projects according to BC Ratios (1999ndash2002) 19 Table x7 Feasiblenon-feasible Projects according to BC Ratios and AHP Scores (2003ndash2009) 20 Table x8 Number of Projects with Substantial Change in TPC 24 Table x9 Sources of in Total Project Cost Adjustment 24 Table x10 Trend of Requests for TPC Increase 25 Table x11 Number of RSF by Sector 2003ndash09 25 Table x12 Results of RSF (change in total project costs KRW billions) 25 Table x13 Systems of Performance Management and Evaluation 27 Table x14 Contents of Checklist for the SABP 28 Table x15 Linkage between SABP results and Budget Allocation 2007 KRW millions 30
PAGE 1
K O R E A
P I M R E F O R M A F T E R T H E F I N A N C I A L C R I S I S C O U N T R Y C A S E S T U D Y K O R E A
PIM Reform after the Financial Crisis
2 0 1 2
T H E P O W E R O F P U B L I C I N V E S T M E N T M A N A G E M E N T
The financial crisis that hit the Republic of Korea (ldquoKoreardquo) in the second half of 1997 had a devastating impact on its economy causing the worst recession since the Korean War era To address the fundamental causes of the crisis and revitalize the economy the Korean Government took bold decisive steps to initiate comprehensive structural reforms The major focus of reform in the fiscal and public sector was to adopt a market-oriented focus and managerial strategies to increase efficiency and transparency The Government endeavored to instill a performance-oriented approach in the system which implies management of public expenditure based on the principle of value for money
In the last decade the Korean Government adopted a series of integrated (ex ante intermediate and ex post) quality control efforts for efficient management of its public investment program The budget ministry established a strong and effective project appraisal scheme to provide oversight of the line ministriesrsquo project selection process The reforms include a formal review process to ensure that funds are continually subjected to monitoring and evaluation In addition budgeting for public investment was simplified by reducing the number of special accounts and government funds The Government in 2004 introduced the Medium Term Expenditure Framework (MTEF) with top-down budgeting for fiscal year 2005 The MTEF pointed to a need to enhance the capacity for planning and prioritizing public investment management (PIM) programs in the line ministries It also emphasized the need to change the role of the budget ministry as well
This chapter explains the institutional setting for PIM and the reform efforts of the Korean Government to develop and manage a comprehensive PIM program to further improve value for money invested The first section provides a brief summary of public investment expenditure trends in Korea followed by an outline of an institutional framework for public investment management The major players in the budget process are described and the reform efforts to pass the MTEF as well as recent PIM initiatives are examined Then an in-depth description focuses on how the public investment projects (PIPs) are selected prioritized and managed in the budget process beginning with a description of how the project appraisal is carried out up to the preliminary feasibility study Next the design of the total project cost management system from procurement implementation to performance management and the evaluation system are discussed Finally a summary presents challenges and recommendations for improving public investment selection prioritization management and budgeting procedures
Trends in Public Investment Expenditure The Korean Government increased public investment expenditure rapidly in response to
the growing demand for public services along with rapid economic development As a result general government (local and central) spending rose from 18 percent of GDP in 1987 to 30 percent in 2009 (figure x1) Central Government expenditure and net lending showed similar growth
PAGE 2
K O R E A
P I M R E F O R M A F T E R T H E F I N A N C I A L C R I S I S C O U N T R Y C A S E S T U D Y K O R E A
PIM Reform after the Financial Crisis
2 0 1 2
T H E P O W E R O F P U B L I C I N V E S T M E N T M A N A G E M E N T
Figure x1 General and Central Government Spending 1980ndash2008
Source System of National Accounts Bank of Korea (httpecosbokorkr) Government Finance Statistics Ministry of Finance and Strategy (httpwwwmosfgokr)
Figure x2 depicts the general growth rate of public expenditure by sector it shows a notable increase in welfare expenditure and a continuous decrease in defense expenditure The state welfare expenditure increased with the 1977 introduction of National Health Insurance (NHI) for firms with 500 or more employees After a series of expansions the NHI came to cover the entire population in 1989 and government expenditures increased accordingly1
Figure x2 General Government Spending by Function 1980ndash2008
Source Bank of Korea (httpecosbokorkr)
Note Welfare spending includes social protection health and housing and community services
PAGE 3
K O R E A
P I M R E F O R M A F T E R T H E F I N A N C I A L C R I S I S C O U N T R Y C A S E S T U D Y K O R E A
PIM Reform after the Financial Crisis
2 0 1 2
T H E P O W E R O F P U B L I C I N V E S T M E N T M A N A G E M E N T
In addition to the increase in welfare spending spending on economic affairs grew rapidly in the early 1990s with the launch of infrastructure improvements construction of roads subways dams and water supplies2 Traditionally economic affairs and education accounted for about 40 percent of total government spending the former being a slightly larger share Spending on economic affairs contributed to the fast expansion of economic infrastructure while spending on education supported the rise in enrollment rates which are currently close to 100 percent for primary and secondary education private as well as public schools depend heavily on Central Government funding (Colleges and universities are funded mainly by tuition)Table x1 distinguishes consolidated fiscal expenditure and net lending of the Central Government which provides detailed information on expenditure of economic affairs Spending on the transportation and communication sectors accounts for the largest part of expenditures on economic affairs while agriculture forestry fishing and hunting and mining manufacturing and construction hold the second and the third rank respectively Judging whether such fiscal allocation is reasonable and whether the expenditure size is feasible are both difficult tasks
Table x1 Consolidated Fiscal Expenditure and Net Lending by Central Government by Function ( of total)
Government Function Central Government Expenditure
1980 1990 2000 2008
General public services Defense
Public order and safety Education
Health Social protection
Housing construction and community amenities Recreation culture and religion
Economic affairs Fuel and energy
Agriculture forestry fishing and hunting Mining manufacturing and construction
Transportation and communication Other economic affairs Other expenditures
40 306 46
146 10 57 25 07
260 21 59 74 67 39
104
42 200 43
170 17 81
101 05
204 06
102 20 61 14
137
52 114 46
153 07
153 53 08
252 07 62 26 99 58
162
69 149 64
212 13
282 84 13
260 33 68 16
106 37
221
Total 1000 1000 1000 1000
Source MOSF (each year) Note Redemption of public funds (KRW 12 trillion) for year 2004 excluded
PAGE 4
K O R E A
P I M R E F O R M A F T E R T H E F I N A N C I A L C R I S I S C O U N T R Y C A S E S T U D Y K O R E A
PIM Reform after the Financial Crisis
2 0 1 2
T H E P O W E R O F P U B L I C I N V E S T M E N T M A N A G E M E N T
Examination of the transport sectormdashthe largest part of spending in economic affairsmdashshows a constant increase in facility stock (table x2) Road length has more than doubled from 1980 to 2008 Considering that these data do not reflect the increase in number of lanes road facilities in reality have expanded even further Indices for port loadunload capacity and capacity for airport facilities show rapid increases as well Transport facilities therefore do not appear to be a serious economic problem in Korea except for discussions on the need to increase investment in the railway sector
Table x2 Trend of Facility Stock by Transport Sector
Year
Road length Expressway length
Railway length Port loadunload capacity
Capacity for airport facility
(km) relative
indexa
(km) relative index
(km) relative index
(million ton)
relative index
(thousands of flights)
relative index
1980
1990
2000
2008
46951
56715
88775
104236
100
121
189
222
1225
1551
2131
3447
100
127
174
281
3135
3091
3123
3381
100
099
100
108
823
2243
4304
7586
100
273
523
922
1006
1331
2025
2222
100
132
201
221
Source Korea Development Institute 2004 Ministry of Land Transport and Maritime Affairs Statistics on Land Transport and Maritime Affairs
Note a Relative index according to 1980 stock level
Figure x3 shows that public investment expenditure by the Government in areas such as transport has taken an important role in total domestic investment Since 1970 the gross domestic investment ratio (which equals national total capital formationgross national disposable income) has been maintained at around 30 percent and the general government investment ratio (the general government capital formationgross national disposable income) at around 5 percent with the general government taking up about 15 percent of total investment General government public investment has increased since 2000 when the gross domestic investment ratio saw a slight decrease If public enterprises are included in the figure representation of investment by the public sector would far outweigh that of the general government
The Government has not focused only on infrastructure facility expansion in the process of economic development It has also more directly intervened in the market in order to resolve market failure especially failure of the financial markets One method used was fiscal lending Figure x4 examines the size of fiscal lending using two indices lending by the general government as indicated in Flow of Funds from the Bank of Korea (Bank of Korea var years) and loan
PAGE 5
K O R E A
P I M R E F O R M A F T E R T H E F I N A N C I A L C R I S I S C O U N T R Y C A S E S T U D Y K O R E A
PIM Reform after the Financial Crisis
2 0 1 2
T H E P O W E R O F P U B L I C I N V E S T M E N T M A N A G E M E N T
repayment by the Central Government as indicated in National Statement for Current Bonds (MOSF var years) announced by the financial authority Fiscal lending has reached a sizable amount the housing sector takes the biggest part and the small- and medium-sized enterprise (SME) sector and agricultural sector follow respectively
PAGE 6
K O R E A
P I M R E F O R M A F T E R T H E F I N A N C I A L C R I S I S C O U N T R Y C A S E S T U D Y K O R E A
PIM Reform after the Financial Crisis
2 0 1 2
T H E P O W E R O F P U B L I C I N V E S T M E N T M A N A G E M E N T
Figure x3 Capital Formation Trends by Sector 1980ndash2008 of GNI
Source MOSF internal data Bank of Korea Economic Statistics System (httpecosbokorkr)
Note Capital formation and investment to foreign country as ratio to gross national disposable income
Figure x4 Size of Government Fiscal Lending (as of balance) 1990ndash2008 of GDP
Source MOSF internal data Bank of Korea Economic Statistics System (httpecosbokorkr)
Note Government lending and loans as of 1968 System of National Accounts (SNA) before 2001 and as of 1993 SNA after 2002
PAGE 7
K O R E A
P I M R E F O R M A F T E R T H E F I N A N C I A L C R I S I S C O U N T R Y C A S E S T U D Y K O R E A
PIM Reform after the Financial Crisis
2 0 1 2
T H E P O W E R O F P U B L I C I N V E S T M E N T M A N A G E M E N T
Institutional Framework for PIM Major players in the budget process include the Ministry of Strategy and Finance (MOSF)
and the Board of Audit and Inspection (BAI) (see table x3) The MOSF is responsible for preparing the draft budget based on revenue forecasts of the Tax and Customs Office in the MOSF When the budget is authorized by the National Assembly the MOSF prepares the quarterly budget implementation plan usually within a month and allocates funds to line ministries The Treasury Bureau of the MOSF then prepares the monthly cash plan and releases cash to line ministries The Treasury Bureau keeps track of cash flows into and from the treasury single account held in the Bank of Korea It is also responsible for issuing government bonds and managing government assets and liabilities
An important issue concerning the interplay among various players is fiscal discipline The budget process has generally taken a highly centralized strategic dominance-based approach to maintaining fiscal discipline3 The MOSF plays a central role in budgeting as well as in preparing and implementing public investment programs Often the main budgeting decisions are made in bilateral negotiations between the budget authority and the spending ministry
The MOSF exercises tight control on public expenditures in the implementation stage Ministries are required to spend within the limits set in the quarterly budget implementation plan When deemed necessary the MOSF can postpone or block part of the expenditures All limits on expenditures are imposed in cash terms Transfers across appropriation accounts are prohibited unless authorized by the National Assembly or by the MOSF
The Treasury Bureau of the MOSF also has a tight grip on cash outflow All cash disbursements are made strictly within the limits set in the monthly cash plans Before the 1997 crisis it was not uncommon for the Treasury Bureau to delay disbursements to line ministries when there was not enough money left in the treasury account due to the seasonality of tax collection This was the case despite the fact that they could issue short-term debt instruments within the limit set by the National Assembly to bridge the gap between tax collection and cash needs In addition the revenue forecasts prepared by the Tax and Customs Office were often very conservative with the actual tax collection overshooting the forecast by substantial margins
PAGE 8
K O R E A
P I M R E F O R M A F T E R T H E F I N A N C I A L C R I S I S C O U N T R Y C A S E S T U D Y K O R E A
PIM Reform after the Financial Crisis
2 0 1 2
T H E P O W E R O F P U B L I C I N V E S T M E N T M A N A G E M E N T
Table x3 Major Players in Korearsquos Budget Process
Players Roles
Ministry of Strategy and Finance (MOSF)
x Compiles budget bids and prepares the draft budget x Allocates funds to spending ministries (apportionment) x Approves the transfers of funds between line items (virements)
Treasury Bureau of the MOSF
x Releases cash to spending ministries x Manages the treasury single account held in the Bank of Korea x Issues treasury bonds and manages assets and liabilities x Collects ministerial financial reports prepares the whole-of-
government financial reports and sends them to the BAI x Produces the government financial statistics
Tax and Customs Office of the MOSF
x In charge of tax policy x Prepares revenue forecasts x Oversees the National Tax Service and the Customs Service
Line ministries Execute the budget and prepare financial reports
Board of Audit and Inspection (BAI)
x The supreme audit institution in Korea whose head is nominated by and reports to the President The National Assembly can also request audits on specific issues to the BAI
x Checks the regularity of ministerial activities x Prepares and tables the financial report to the National
Assembly
National Assembly x Deliberates and votes on the budget x Approves the transfers of funds between programs x Reviews and approves audit reports
Some changes were observed in cash management and revenue forecast practices after the
1997 financial crisis Pressured to stimulate the economy and in particular to back up the front-loading4 of annual spending that has been popular since 1999 the MOSF resorted more and more to short-term debt instruments to bridge the gap between tax collection and cash needs The downward bias in revenue forecasts was also reduced In 2004 there had actually been a large shortfall in tax collection which was partly blamed on an overly optimistic assumption on the economic growth which was in turn claimed by some to have been politically motivated Now the democratization of Korean politics and the devolution of budgetary power to line ministries became an unavoidable trend
Recent Change from Bottom-Up to Top-Down Budgeting
The Korean Governmentrsquos budget process has undergone a significant change beginning when the Government introduced the Medium Term Expenditure Framework (MTEF) together with top-down budgeting in 2004 for fiscal year 20055 The reform was intended to address several defects found in the previous budgeting practice Prior to the introduction of the MTEF budgeting
PAGE 9
K O R E A
P I M R E F O R M A F T E R T H E F I N A N C I A L C R I S I S C O U N T R Y C A S E S T U D Y K O R E A
PIM Reform after the Financial Crisis
2 0 1 2
T H E P O W E R O F P U B L I C I N V E S T M E N T M A N A G E M E N T
was centered on the next single budget year and lacked a medium-term perspective The MOSF and the National Assembly gave little consideration to the out-years beyond the budget year Line ministries had little information on the extent of the resources that would be available to them in the future and their medium- to long-term planning function was severely limited It was also difficult for the MOSF to identify and cope with the trend towards increased public expenditure Without a long-term view on the appropriate level of the tax burden the MOSF would simply allow ever-increasing public spending to accommodate rising demands from various sectors
Before the introduction of the top-down process budgeting relied exclusively on a bottom-up approach At the initial stage of budget preparation the MOSF made rough estimates of the total size and the sectoral allocation of the next yearrsquos budget But the estimates were not transmitted to line ministries and therefore could not guide them in preparing their budget requests When reviewing the ministriesrsquo budget requests the MOSF focused on the microscopic spending control of individual public investment programs The sectoral allocation and the total size of the budget were determined at the last stage of budget preparation by aggregating the expenditures on individual programs As a result control of inputs assumed major significance in budget discussions and little attention was paid to outputs or outcomes The accountability and autonomy of line ministries in preparing and managing their budget was also severely limited Line ministries usually requested an unrealistically large amount of the budget and massive cuts were inevitable
With the introduction of the MTEF and top-down budgeting the process changed Now the annual budgeting exercise starts with a discussion on fiscal management over the next five years including the current year the budget year and three out-years Following this discussion the MOSF transmits spending ceilings for sectors and programs to line ministries6 These ceilings encompass the general and special accounts and funds Line ministries are now asked to prepare their budget requests within these ceilings When reviewing the ministerial budget requests the MOSF places less emphasis on the microscopic control of line items and more on the strategic alignment of budget requests with overall policy directions
New Initiatives in Public Investment Management
In order to enhance the efficiency of PIM the Korean Government in 1999 organized a cross-ministerial task force to develop an action plan The task force was jointly headed by Ministry of Planning and Budget7 (now MOSF) and the Ministry of Construction and Transportation (MOCT) (now Ministry of Land Transport and Maritime Affairs MLTMA) The MOCT issued ldquoA Comprehensive Plan to Enhance Efficiency of Public Investmentrdquo in July 1999 (MOCT 1999) Various policy measures were introduced to tackle the weaknesses of the existing public investment management system
One of the features of the new PIM system was to intensify the monitoring system of the project implementation process by the budgeting agency For example the MOSF now takes charge of the Preliminary Feasibility Studies (PFS) the results of which are reflected in the budget appropriation This arrangement represents a compromise between the MOSF which tried to take over the feasibility study function from the line ministries and the line ministries especially the
PAGE 10
K O R E A
P I M R E F O R M A F T E R T H E F I N A N C I A L C R I S I S C O U N T R Y C A S E S T U D Y K O R E A
PIM Reform after the Financial Crisis
2 0 1 2
T H E P O W E R O F P U B L I C I N V E S T M E N T M A N A G E M E N T
MLTMA which were resistant to the idea of transferring ownership of the feasibility study to the MPB Thus the PFS was ldquoinventedrdquo as a settlement to relieve the resistance from the line ministries
The Total Project Cost Management System (TPCM) in which the budget ministry checks the cost increase from the baseline throughout the project life was also strengthened Introduced in 1994 the TPCM was established as an effective measure of government expenditure management after the financial crisis Under the TPCM System the Reassessment Study of Feasibility (RSF) and Reassessment of Demand Forecast (RDF) were introduced in 1999 and 2006 respectively RSF and RDF reformulate feasibility studies and demand forecasts on projects under design development or construction and decide whether the project may continue The RSF guidelines and RDF system were developed and introduced after the PFS system was established The guidelines of RSF and RDF adopt the same analytical methodology as that of the PFS Figure x5 shows a brief chronology of PIM system evolution
Figure X5 Chronology of New Initiatives in Korearsquos PIM System
For line ministries the Government introduced the ex-post performance evaluation system in 1999 According to the MOCT Comprehensive Plan the line ministries were supposed to evaluate the performance of the project within three years after construction work is completed In 2000 the MOCT amended the Enforcement Decree of the Construction Technology Management Act to incorporate the initiatives included in the Comprehensive Plan The legal ground of PFS and TCPM resides in several laws their enforcement decrees and administrative guidelines such as the Budgeting and Accounting Act and the Fund Management Act In 2006 the National Finance Act combining several fiscal-related acts was legislated to stipulate diverse policy measures of PIM
With the establishment of a legal framework for public investment the PIM project was to be implemented in accordance with the process shown in figure x5 Throughout the process the MOSF produces information necessary for decision-making on budgeting through PFS FSF RDF
RSF guidelines
strengthened PE introduced
RSF guidelines developed
RDF introduced
The National Finance Act legislated
1994 1999 2005 2006
PFS introduced TPCM introduced
RSF introduced
9 TPCM (Total Project Cost Management) 9 PFS (Preliminary Feasibility Study)
9 RSF (Reassessment Study of Feasibility) 9 RDF (Reassessment of Demand Forecast) 9 PE (Performance Evaluation)
PAGE 11
K O R E A
P I M R E F O R M A F T E R T H E F I N A N C I A L C R I S I S C O U N T R Y C A S E S T U D Y K O R E A
PIM Reform after the Financial Crisis
2 0 1 2
T H E P O W E R O F P U B L I C I N V E S T M E N T M A N A G E M E N T
and in-depth program evaluation In the past line ministries provided selective information to procure more of the budget leading the MOSF to cut project budgets but not always on a reasonable basis New devices investigating the projects in detail made it possible for the MOSF to manage public investment more effectively
PAGE 12
K O R E A
P I M R E F O R M A F T E R T H E F I N A N C I A L C R I S I S C O U N T R Y C A S E S T U D Y K O R E A
PIM Reform after the Financial Crisis
2 0 1 2
T H E P O W E R O F P U B L I C I N V E S T M E N T M A N A G E M E N T
Figure X6 Implementation Process of Public Investment Management
Ex-Ante Intermediate Ex-Post
x TPCM(RSF amp RDF) x Performance Evaluation
x In-depth Program Evaluation
Note The bulleted items are under the aegis of MOSF
Project Appraisal by Preliminary Feasibility Study Improvement of a project appraisal system at the ex ante level is very important for
ensuring sound public expenditure As discussed the Ministry of Strategy and Finance introduced the preliminary feasibility study (PFS) to enhance efficiency in the early decision-making process of major infrastructure investment projects Throughout the project cyclemdashsuch as the stages of identification preparation implementation evaluation and so onmdashthe MOSF is interested in improving the methods of ex-ante appraisal at the preparation stage
Initiative for a Preliminary Feasibility Study
The PFS is a brief evaluation of a project to produce information for a budgetary decision A critical change is that the PFS is owned by the Ministry of Strategy and Finance (MOSF) Under the new procedure the MOSF established the Public Investment Management Center (PIMA) within the
Blueprint Design
Land Acquisition Construction
Draft Design Operation Maintenance
PFS
Feasibility Study
Strategic Planning
PAGE 13
K O R E A
P I M R E F O R M A F T E R T H E F I N A N C I A L C R I S I S C O U N T R Y C A S E S T U D Y K O R E A
PIM Reform after the Financial Crisis
2 0 1 2
T H E P O W E R O F P U B L I C I N V E S T M E N T M A N A G E M E N T
Korea Development Institute (KDI) with the mandate to conduct research and take an operational managing role in implementing the PFS procedures8
The PFS is conducted by a multi-disciplinary research team organized by PIMA (now PIMAC Public and Private Infrastructure Investment Management Center) typically consisting of economists transportation researchers and civil engineers The mix of specialists from different backgrounds and organizations helps to provide diverse ideas for the appraisal and improve the transparency and objectivity of the decision-making process The PFS Review Committee is organized by the MOSF with members of staff from the budget and line ministries PIMAC and field specialists Open discussions are held regularly on the PFS mid-term and final reports
The PFS process aims to enhance fiscal productivity by launching large-scale public investment projects based on transparent and objective ex-ante project evaluations The meaning of ldquopreliminaryrdquo is twofold first it means ldquoprovisionalrdquo evaluation a short and brief examination second it is an evaluation that precedes a (detailed) feasibility study The National Finance Act of 2006 provides the legal framework of PFS9 Before that legislation PFS was based on the Enforcement Decrees of the Budgeting and Accounting Act and the Fund Management Act these two laws were merged into the National Finance Act in 2006
The coverage of PFS is so extensive that it has made notable changes to the PIM system since its inception All new large-scale projects with a total cost of KRW50 billion (about US$50 million) or more are subject to the PFS With the National Finance Act the scope of the PFS was expanded to non-infrastructure projects (for example RampD) Local governments and PPI (private participation in infrastructure) projects are also subject to the PFS if the Central Government subsidy exceeds KRW30 billion
The following types of projects are exempted from the PFS typical building projects such as government offices and correctional institutions legally required facilities such as sewage and waste treatment facilities rehabilitating projects and restoration works from natural disasters projects implemented by international accords and by a SouthndashNorth Korea exchange and cooperation program and military facilities and projects related to national security
In every budget cycle of public infrastructure projects the PFS procedure is conducted as follows At the first stage a concerned line ministry submits a list of PFS candidate projects to the MOSF and the MOSF selects the PFS projects and requests PFS to PIMAC at KDI PIMAC organizes the research team conducts the PFS and submits the final PFS reports to the MOSF (figure x7) In the middle of conducting the PFS and making a final decision the PFS Review Committee takes charge of the whole review process
PAGE 14
K O R E A
P I M R E F O R M A F T E R T H E F I N A N C I A L C R I S I S C O U N T R Y C A S E S T U D Y K O R E A
PIM Reform after the Financial Crisis
2 0 1 2
T H E P O W E R O F P U B L I C I N V E S T M E N T M A N A G E M E N T
Figure x7 Preliminary Feasibility Study Procedures
Contents of PFS
The PFS is conducted in three phases background study main analyses and synthesis The background study reviews the statement of purpose and collects background data on socio-economic geographic and technical aspect of the project In addition key agendas for the main analyses are discussed in the background study through brainstorming
Line Ministry
Ministry of Strategy amp Finance
Korea Development Institute (Public and Private Infrastructure Investment Management Center)
Submit PFS projects candidate
Feasibility Study or Stop
Select PFS Projects
Request PFS
Make investment Decision
Announcement
Submit PFS Report
Organize Teams Conduct PFS
PAGE 15
K O R E A
P I M R E F O R M A F T E R T H E F I N A N C I A L C R I S I S C O U N T R Y C A S E S T U D Y K O R E A
PIM Reform after the Financial Crisis
2 0 1 2
T H E P O W E R O F P U B L I C I N V E S T M E N T M A N A G E M E N T
Figure x8 Outline of PFS Procedures and Contents
The main analyses in the PFS process are economic analysis policy analysis and balanced regional development analysis The backbone of the economic analysis is the cost-benefit analysis The economic benefit and economic cost of a project are estimated based on the forecasted demand The criteria of cost-benefit ratio NPV (net present value) and IRR (internal rate of return) are calculated based on the stream of annual benefit and cost As of 2007 a social discount rate of 55 percent in real terms is applied to the analysis based on the trend of risk free interstate rate in Korea
Policy analysis examines the potential effects of the projects in qualitative and quantitative terms including consistency with higher level policy possible project risk and other project-specific considerations In the consistency category the attitudes of the project owner and local residents toward the project and the level of preparedness of the project proposers are examined In the project risk category the risk of funding availability and the environmental risk of the project are evaluated
Balanced regional development analysis is an evaluation of the project from a regional perspective The regional backwardness index a composite index of eight characteristics for local entities was developed by the PFS guidelines The regional economic impact analysis is also conducted through the MRIO (Multi-Regional Input-Output) model
To synthesize the results of these economic policy and balanced regional development analyses the AHP (Analytic Hierarchy Process) technique is applied in the PFS AHP is a multi-
Project Proposal
Background Study
bull Review of Statement of purposebull Collect socio-economic
geographic and a technical data
bull Brainstorming (Other Alternatives)
bull PFS issues raised
Policy Analysis
bull Consistency with higher-level plan and policy directions
bull Project risk (financing and environmental impact)
bull Project-specific evaluation item
Balanced Regional Development Analysis
bull Regional backwardness index analysis
bull Regional Economic impact
Economic Analysis
bull Demand analysisbull Cost estimationbull Benefit estimationbull Cost-benefit analysisbull Sensitivity analysisbull Financial analysis
Analytic Hierarchy Process
bull Overall feasibilitybull Prioritizationbull Financing and policy
suggestion
Project ProposalProject Proposal
Background StudyBackground Study
bull Review of Statement of purposebull Collect socio-economic
geographic and a technical data
bull Brainstorming (Other Alternatives)
bull PFS issues raised
Policy AnalysisPolicy Analysis
bull Consistency with higher-level plan and policy directions
bull Project risk (financing and environmental impact)
bull Project-specific evaluation item
Balanced Regional Development Analysis
Balanced Regional Development Analysis
bull Regional backwardness index analysis
bull Regional Economic impact
Economic AnalysisEconomic Analysis
bull Demand analysisbull Cost estimationbull Benefit estimationbull Cost-benefit analysisbull Sensitivity analysisbull Financial analysis
Analytic Hierarchy ProcessAnalytic Hierarchy Process
bull Overall feasibilitybull Prioritizationbull Financing and policy
suggestion
PAGE 16
K O R E A
P I M R E F O R M A F T E R T H E F I N A N C I A L C R I S I S C O U N T R Y C A S E S T U D Y K O R E A
PIM Reform after the Financial Crisis
2 0 1 2
T H E P O W E R O F P U B L I C I N V E S T M E N T M A N A G E M E N T
criteria decision-making approach that enables user to combine quantitative and qualitative analyses into a decision through a hierarchical structure AHP is unique in providing a hierarchical framework to a complex problem by establishing majorminor factors and examining the importance of each factor through pair-wise comparison AHP enhances objectivity of decision-making by analyzing and managing the entire process of decision-making in steps and it ensures the consistency of weights derived from pair-wise comparison guaranteeing the robustness of decision-making
As a group decision support system AHP also enables the user to synthesize decisions of multiple decision makers Thus PFS team members comprising seven or eight experts from different organizations with different specialties rate the feasibility of a project through the AHP technique Diverse views on the level of feasibility are synthesized into a single score which results in a final decision on feasibility of a project
Figure x9 shows how AHP guides the synthesis of the analytical results of a project The PFS team sets the weight of each criterion through pair-wise comparison of each criterion against the others At the bottom level of the hierarchy are the two alternative judgments ldquoProject Implementationrdquo or ldquoStatus Quordquo (which means ldquoNot-Implementing the Projectrdquo) The score of the two alternatives are scaled to be summed up to 1 Hence if the Project Implementation alternative gets a score above 05 the project is evaluated as feasible
Figure X9 Structure of AHP in PFS
Overall FeasibilityOverall FeasibilityOverall FeasibilityOverall Feasibility
Economic AnalysisEconomic AnalysisBalanced Regional
Development AnalysisBalanced Regional
Development AnalysisPolicy AnalysisPolicy Analysis
Consistency with higher level planConsistency with higher level plan
Project riskProject riskProject-specific
factorProject-specific
factor
Attitu
de to
ward
the p
roje
ct
Attitu
de to
ward
the p
roje
ct
Consis
tency w
ith h
igher le
vel p
lan
Consis
tency w
ith h
igher le
vel p
lan
Pre
pare
dness
Pre
pare
dness
Pro
ject-
specific
item
(optio
nal)
Pro
ject-
specific
item
(optio
nal)
Fin
ancia
l feasib
ilityFin
ancia
l feasib
ility
Enviro
nm
enta
l impact a
ssessm
ent
Enviro
nm
enta
l impact a
ssessm
ent
Pro
ject-
specific
item
(optio
nal)
Pro
ject-
specific
item
(optio
nal)
Pro
ject-
specific
item
2
(optio
nal)
Pro
ject-
specific
item
2
(optio
nal)
Pro
ject-
specific
item
1
(optio
nal)
Pro
ject-
specific
item
1
(optio
nal)
Pro
ject-
specific
item
(optio
nal)
Pro
ject-
specific
item
(optio
nal)
Regio
nal e
conom
ic im
pacts
Regio
nal e
conom
ic im
pacts
Regio
nal b
ackw
ard
ness a
naly
sis
Regio
nal b
ackw
ard
ness a
naly
sis
Project ImplementationProject ImplementationProject Implementation Status QuoStatus QuoStatus QuoAlternativesAlternativesAlternatives
Level 1
Level 2
Level 3
PAGE 17
K O R E A
P I M R E F O R M A F T E R T H E F I N A N C I A L C R I S I S C O U N T R Y C A S E S T U D Y K O R E A
PIM Reform after the Financial Crisis
2 0 1 2
T H E P O W E R O F P U B L I C I N V E S T M E N T M A N A G E M E N T
PFS Evaluation Guidelines
PFS is based on three pillars of quality objectivity consistency and transparency In order to improve the objectivity of the evaluation and secure consistency among projects PIMAC developed evaluation guidelines PFS guidelines are detailed descriptions of methodology and procedures of PFS implementation PFS guidelines cover the following sectors roads railways ports airports dams and cultural facilities The guidelines stipulate that the same methodology is applied and the same or a similar dataset is used for different projects in the same sector For example the KT_DB (Korea Transport Database) should be used for all the road and railroad projects for consistency in evaluation results These guidelines are continuously revised through academic research The PFS guidelines for road and railroad projects in its fifth edition in 2009 provide specific procedures for assessing road projects (see box x1)
Box x1 How a Road Project Is Assessed in PFS Methodology cost-benefit analysis
x Criteria BC NPV (Net Present Value) IRR (Internal Rate of Return) x Social Discount Rate 55 percent (real term) x Duration Roads railways and seaports (30 yr) dams and water supply facilities (50 yr) x Tax is excluded but salvage value is included
Benefit of road project x Valuation of changes in route and travel speeds due to the project x Savings in travel time vehicle operation costs traffic accidents and environmental costs (air and noise
pollution) A multi-criteria decision-making approach by AHP (Analytical Hierarchy Process)
x Combines quantitative and qualitative criteria for decisions under a hierarchical structure x A group decision support system x Hierarchical structuring x Pair-wise comparison
Performance of PFS
Based on the PFS results only a project that has been assessed and meets the investment criteria can be approved and implemented Table x4 shows the number of PFS conducted from 1999 to 2009 A total of 437 projects were evaluated among which road (188 projects) and railway projects (79 projects) were dominant totals included 27 seaport projects 32 culture and tourism projects 34 water supply projects and 77 other projects Other projects included construction projects for welfare facilities airports and industrial complexs among others
PAGE 18
K O R E A
P I M R E F O R M A F T E R T H E F I N A N C I A L C R I S I S C O U N T R Y C A S E S T U D Y K O R E A
PIM Reform after the Financial Crisis
2 0 1 2
T H E P O W E R O F P U B L I C I N V E S T M E N T M A N A G E M E N T
Table x4 Number of PFS Submitted by Sector 1999ndash2009
Sector 1999 2000 2001 2002 2003 2004 2005 2006 2007 2008 2009 Sum Road 11 11 20 9 11 24 11 27 30 12 22 188
Railway 2 7 14 8 7 13 6 10 5 2 5 79
Seaport 1 5 1 2 3 1 2 5 1 4 2 27
Culture and Tourism
3 2 5 2 5 2 1 5 2 3 2 32
Water Resources
1 1 0 5 5 3 3 1 1 2 12 34
Others 1 4 1 4 2 12 7 4 7 15 20 77
Sum 19 30 41 30 33 55 30 52 46 38 63 437
Source Internal data (1999ndash2009) from PIMAC KDI
Table x5 shows the proportions of feasible projects 256 projects or 586 percent of 437 projects were evaluated as feasible The proportion of feasible projects for the road sector is 564 percent The highest rate of feasibility was for seaport projects at 778 percent and the projects in the culture and tourism sector had the lowest feasibility rate at 435 percent
Table x5 Proportion of Feasible Projects by Sector 1999ndash2009
of Submitted Projects Rated Feasible
Project Sector 1999 2000 2001 2002 2003 2004 2005 2006 2007 2008 2009 Total Projects (A)
Total Feasible Projects (B)
(B)(A) ()
Road 455 273 300 333 727 875 364 630 633 750 500 188 106 564
Railway 500 571 357 750 714 538 833 400 250 1000 800 79 44 557
Seaport 1000 800 1000 500 1000 1000 1000 400 1000 1000 500 27 21 778
Culture and tourism 1000 - 400 - - 1000 1000 400 500 1000 - 32 14 438
Water resources 1000 1000 - - 600 667 667 1000 1000 500 917 34 23 676
Others 1000 750 - 750 500 667 714 500 429 467 789 77 48 623
Average 632 500 341 433 606 745 633 538 565 684 677 437 256 586
Source Internal data (1999ndash2009) from PIMAC KDI Note mdash not applicable
Tables x6 and x7 show the results of PFS in terms of BC ratio and AHP score Until 2002 no technique was employed to combine BC ratio and the results of policy analyses Thus the overall PFS result was that a proposed project was announced as feasible or non-feasible along with the BC ratio During 1999ndash2002 nine projects were evaluated as non-feasible despite the fact that their BC ratios were greater than 1 The reasons were mostly their potential negative environmental impacts and difficulties in funding availability for local government projects On the
PAGE 19
K O R E A
P I M R E F O R M A F T E R T H E F I N A N C I A L C R I S I S C O U N T R Y C A S E S T U D Y K O R E A
PIM Reform after the Financial Crisis
2 0 1 2
T H E P O W E R O F P U B L I C I N V E S T M E N T M A N A G E M E N T
other hand 10 projects were evaluated as feasible with BC less than 1 The most important reason was a consideration of balanced regional development
Table x6 Feasiblenon-feasible Projects according to BC Ratios (1999ndash2002) Project numbers rated feasible or non-feasible
Year BC ge 1 BC lt 1
Total (A)
Feasible Non- feasible Feasible Non-
Feasible Feasible (B)
(B)(A) ()
1999 8 1 5 6 20 13 650
2000 14 3 1 12 30 15 500
2001 12 2 2 25 41 14 341
2002 11 3 2 14 30 13 433
Total ()
45 (372)
9 (74)
10 (83)
57 (471)
121 (1000) 55 455
Source Internal data (1999-2009) from PIMAC KDI
Table x7 shows the PFS results during 2003ndash09 In 2003 the AHP technique was officially employed to synthesize the economic and policy analyses From then on the PFS results were announced in terms of BC and AHP score Over that period 202 projects or 639 percent of 316 projects were evaluated and rated as feasible Five projects with BC greater than 1 received AHP scores of less than 05 and eventually were deemed non-feasible On the other hand 61 projects with BC less than 1 received AHP scores greater than 05
The PFS has contributed to enhance the fiscal efficiency of the PIM project selection process by preventing non-feasible projects from being launched During 1999ndash2009 a total of 437 PFS evaluations were conducted and the projects deemed non-feasible saved taxpayers funds that could be allocated to other uses
PAGE 20
K O R E A
P I M R E F O R M A F T E R T H E F I N A N C I A L C R I S I S C O U N T R Y C A S E S T U D Y K O R E A
PIM Reform after the Financial Crisis
2 0 1 2
T H E P O W E R O F P U B L I C I N V E S T M E N T M A N A G E M E N T
Table x7 Feasiblenon-feasible Projects according to BC Ratios and AHP Scores (2003ndash2009)
Project numbers rated feasible or non-feasible
Year BC ge 1 BC lt 1
Total (A)
AHPge 05
AHPlt 05
AHPge 05
AHPlt 05
Feasible (B)
(B)(A) ()
2003 18 0 2 13 33 20 606 2004 27 1 14 13 55 41 745 2005 15 1 4 10 30 19 633 2006 21 2 7 22 52 28 538 2007 19 0 7 20 46 26 565 2008 16 0 10 12 38 26 684 2009 25 1 17 19 62 42 677 Total ()
141 (446)
5 (16)
61 (193)
109 (345)
316 (1000) 202 639
Source Internal data (1999-2009) from PIMAC KDI
Procurement and Capital Budget Implementation Procurement and capital budget implementation on public investment programs and
projects has been managed mostly by a budget management system called the Total Project Cost Management System (TPCM) in the Ministry of Strategy and Finance TPCM aims to enhance fiscal productivity and to ensure a high quality of public construction work by properly adjusting and managing total project costs (TPC) throughout the implementation stages of a project The MOSF established the TPCM in 1994 and revises the ldquoGuidelines for Total Project Cost Managementrdquo on an annual basis
TPCM Manages PIP Construction Budgets
According to the National Finance Act the following types of construction projects are subject to the TPCM system
x Projects implemented by the Central Government or its agents or by local governments or private institutions relying on Central Government funding
x Projects with a construction period exceeding two years and
x Civil engineering projects whose TPC exceeds KRW 30 billion (USD 30 million) or architectural projects whose TPC exceeds KRW 10 billion (USD 10 million)
The TPC includes all cost items accrued throughout the life of the project including design land acquisition and construction costs regardless of whether the source of funding is the Central Government local governments or private institutions
Project costs should be managed by construction phase and by construction unit in reference to total construction cost The construction costs are not arbitrarily interchangeable between project
PAGE 21
K O R E A
P I M R E F O R M A F T E R T H E F I N A N C I A L C R I S I S C O U N T R Y C A S E S T U D Y K O R E A
PIM Reform after the Financial Crisis
2 0 1 2
T H E P O W E R O F P U B L I C I N V E S T M E N T M A N A G E M E N T
phases or between construction units When increases in construction size or costs are expected and even inevitable the minister in charge of the project must consult with the MOSF about adjusting the TPC
TPCM by Project Phase
The TPCM guidelines of the MOSF describe in detail how the rules and regulations of project management are carried out by project phase
Project conception phase The minister in charge of the project should make an appropriate estimate of the total cost and duration of the project and ask the MOSF for a PFS if the estimated total cost in the project conception phase is KRW 50 billion or more For local government projects the minister in charge should ask MOSF for a PFS if the funding of the project relies on a Central Government subsidy of KRW 30 billion or more
Phases of PFS and a (detailed) feasibility study The minister in charge should report on the project size TPC and project duration to MOSF for all the projects that have been evaluated as feasible by PFS and should ensure that the budget is drawn up by the end of January Detailed feasibility studies should cover the life cycle cost of the projects resulting from all technological environmental social and financial aspects as well as from land acquisition
Draft design phase The project management should ensure that enough money and time is spent on the draft design to prevent significant and frequent design modifications in the following construction phases The design team should collect various opinions from target citizens interests groups and related government authorities in order to minimize public discontent expected in the construction phase The minister in charge should consult value-engineering (VE) experts at least once before the end of this phase to prevent overestimation of costs and excessive construction
Blueprint design phase Size of the construction should not be modified significantly in this phase When it appears that a design modification or change in construction size is inevitable the minister in charge should discuss the matter with the MOSF The minister should also consult value-engineering experts at least once before the end of this phase to prevent overestimation of costs and excessive construction
Contracting phase MOSF informs the Administer of the Office of Supply Administration of the total construction cost after discussing it with the minister in charge When the contract cost exceeds the informed cost the Administer of the Office of Supply Administration should discuss the matter with the Minister of Strategy and Finance
Construction phase The minister in charge should try to minimize cost increases except when new construction techniques or new equipments are to be introduced to enhance the quality of the product substantially When an increase in costs change in construction size or change in construction duration are inevitable the minister in charge should submit a written explanation and discuss it with the Minister of Strategy and Finance
PAGE 22
K O R E A
P I M R E F O R M A F T E R T H E F I N A N C I A L C R I S I S C O U N T R Y C A S E S T U D Y K O R E A
PIM Reform after the Financial Crisis
2 0 1 2
T H E P O W E R O F P U B L I C I N V E S T M E N T M A N A G E M E N T
The line ministry is allowed to set construction contingencies for up to 8 percent of the contract price of a project to cope with inevitable design modification and amendment of the law and so on The line ministry can use its own discretion to change the TPC within the limit of these contingencies Contingencies apply only to the construction phase of a project
In general an increase in construction size through design modification is not allowed except for inevitable cases The base cost for a TPCM system is the contract cost determined by bidding not the cost estimate at design phase ldquoThe indicator adjustment formulardquo set by the Office of Supply Administration is applied to recalculate project costs incorporating inflationary effects
When a project under implementation violates the TPCM guidelines the Minister of Strategy and Finance can cut off or withhold budget allocation for the project The minister in charge can impose sanctions prohibiting invitation to tendering of construction projects on design teams when their work has resulted in a substantial cost increase due to unsatisfactory performance or when they intentionally or unintentionally fail to estimate the appropriate construction costs or sizes The minister in charge can petition the Minister of Strategy and Finance for changes in costs and project duration at any time through the Budget Information Management System when necessary
Reassessment Study of Feasibility and Reassessment of Demand Forecast
The Reassessment Study of Feasibility (RSF) aims to check unnecessary cost increases by re-affirming the feasibility of projects under implementation and scrutinizing the adequacy of the cost increase The MOSF conducts the RSF on a project if the PFS has not been conducted although it falls under the PFS coverage or if the TPC has increased by more than 20 percent (excluding inflationary effects and increase in land acquisition cost) of the cost confirmed by the Minister of Strategy and Finance at the previous phase of the project Also according to the amendment of the National Finance Act in 2009 the Board of Audit and Inspection is entitled to request that the MOSF conduct an RSF if there is a need
The line ministries conduct the RSF on a project with miscellaneous changes in construction costs and report it to the Minister of Strategy and Finance The RSF guidelines suggest that the RSF should include but should not be limited to the following components
x Outline of a project
x Analysis of background data and project issue raised
x Analysis on adequacy of the plan including size of the project
x Economic analysis including cost-benefit analysis
x Policy analysis
x Overall assessment including judgment on whether or not to continue a project and if the TPC increase is adequate
Based on these analyses the RSF team makes an overall assessment including a judgment as to whether or not to continue a project and if the TPC increase is adequate While the PFS focuses
PAGE 23
K O R E A
P I M R E F O R M A F T E R T H E F I N A N C I A L C R I S I S C O U N T R Y C A S E S T U D Y K O R E A
PIM Reform after the Financial Crisis
2 0 1 2
T H E P O W E R O F P U B L I C I N V E S T M E N T M A N A G E M E N T
on evaluating the feasibility of a project RSF puts relatively more emphasis on finding alternatives to cut down the size and cost of a project The MOSF reflects the RSF results in adjusting the TPC When the RSF results show that a project has turned out to be unfeasible the RSF team works on curtailing project size with the intent of improvinh its feasibility When no alternative way to secure the feasibility of the project is found the MOSF decides whether to stop implementing the project
Reassessment of demand forecast (RDF) is a device that verifies the adequacy of the demand forecast for a public investment project conducted in the past with the latest information By minimizing inevitable forecasting error RDF aims to improve the efficiency of expenditure and to prevent squandering of financial resources by managing demand fluctuation of large-scale long-term infrastructure projects throughout the phases of a project
The transportation facilities including roads rail airports and ports that are subject to TPCM are also subject to RDF if required The RDF is to be conducted during any of the following phases when the requirements for the reassessment are met (1) before or during completion of the basic plan or feasibility study (2) before or during completion of draft design (3) before or during completion of detailed design (4) during the construction period andor (5) when it is deemed necessary by the Minister of Strategy and Finance or the head of Central Government agency either of whom may request a RDF before or during a feasibility study or design development
The RDF shall be conducted when there are substantial changes in demand forecasts as stipulated in the following (1) when the RDF is deemed necessary because a significant decrease of demand is anticipated due to material changes in the premises on which previous demand forecasts had been made or errors had been made during implementing the methodology for demand forecasts (2) when the RDF is deemed necessary because a project has been converted to a PPP project from a conventional government procured project (3) when more than five years have passed since the latest demand forecast had been conducted andor (4) when it is deemed necessary by the Minister of Strategy and Finance or the head of line ministry
The RDF virtually belongs to the MOSF In order to ensure objectivity and transparency during the RDF process the Minister of MOSF or the minister of the line ministry responsible for the RDF may contract a specialized institution(s) to conduct the RDF When the RDF is completed the Minister of MOSF notifies the minister of line ministries of the results When it is identified that the demand forecast for a project has decreased by 30 percent or more however the MOSF begins RSF and notifies the minister of line ministries in accordance with RSF guidelines
Performance of TPCM RSF and RDF
Table x8 shows the total number of Total Project Cost Management System (TPCM) projects and the projects in which the total project costs (TPC) were adjusted during 1994ndash2005 The total number of TPCM projects increased sharply in 1999 when the PIM system was established in a rigorous way The proportion of projects for which TPC were required shows an increase from 540 percent in 2002 to 718 percent in 2005 However the percentage of projects for
PAGE 24
K O R E A
P I M R E F O R M A F T E R T H E F I N A N C I A L C R I S I S C O U N T R Y C A S E S T U D Y K O R E A
PIM Reform after the Financial Crisis
2 0 1 2
T H E P O W E R O F P U B L I C I N V E S T M E N T M A N A G E M E N T
which the TPC rose by more than substantially decreased from 119 percent in 1996 to 37 percent in 2004
Table x8 Number of Projects with Substantial Change in TPC
Year No Projects under PCM (A)
No Projects that TPC adjusted (B)
BA() No Showing Increase in TPC by over 20 (C)
(C)(A) ()
1994 218 - -
1995 207 19 92
1996 159 19 119
1997 189 20 106
1998 183 17 93
1999 459 15 33
2000 483 24 50
2001 602 26 43
2002 602 325 540 10 17
2003 667 392 587 15 22
2004 698 493 706 26 37
2005 760 546 718
Source Internal data from the Ministry of Strategy and Finance
Table x9 shows that line ministries in charge of the projects requested an increase of KRW 196 trillion and about half (495 percent) of the requested amount (KRW 097 trillion) was adjusted into the TPC While 957 percent of requests for TPC increase due to miscellaneous design change were accepted by the MOSF only 432 percent of requests due to substantial design change were adjusted into the TPC
Table x9 Sources of in Total Project Cost Adjustment
Value of miscellaneous design changes KRW billions
Value of substantial design changes KRW billions Sum KRW billions
Request for TPC increase (A) 2331 17320 19651 Projects that TPC adjusted (B) 2253 7480 9733 (B)(A) () 967 432 495 Source Internal data from the Ministry of Strategy and Finance
Note Miscellaneous design changes include changes due to factors of traffic safety and unexpected ground conditions substantial design changes include changes in route change in type of bridges and tunnels and an increase in quantity to incorporate request by local government or local citizens
PAGE 25
K O R E A
P I M R E F O R M A F T E R T H E F I N A N C I A L C R I S I S C O U N T R Y C A S E S T U D Y K O R E A
PIM Reform after the Financial Crisis
2 0 1 2
T H E P O W E R O F P U B L I C I N V E S T M E N T M A N A G E M E N T
Table x10 shows the trend of requests for TPC increase in terms of percentage of TPC During 1996ndash99 the line ministries requested an increase of 264 percent of TPC and 421 percent of the requested amount was adjusted into the TPC During 2000ndash03 however the requests dropped to as low as 44 percent of TPC and the acceptance rate also decreased to 227 percent
Table x10 Trend of Requests for TPC Increase
TPC Increase requested
1996ndash99 2000ndash03
Request for TPC increase (A) 264 44
TPC adjusted (B) 111 10
(B)(A) () 421 227
Source Internal data from the Ministry of Strategy and Finance
Table x11 shows the number of RSF studies conducted by sector during 2003ndash09 Road projects take up the largest share in the sectoral distribution of RSF The RSFs on buildings (museums and tourism) takes up 177 percent in terms of the total number of RSFs conducted
Table x11 Number of RSF by Sector 2003ndash09
2003 2004 2005 2006 2007 2008 2009 Sum
Road 2 2 6 10(2) 9(1) 9(3) 28(7) 66
Railway 0 1(1) 0 0 2(1) 2 1 6
Port 0 0 0 0 3 2 3 8 Buildings (museums and tourism) 2 3 3 4 1 6(2) 1 20
Water resources (dam) 0 0 0 5 0 1 2 8
ITRampD 0 0 0 0 0 0 1(1) 1
Others 0 0 0 1 3 0 0 4
Total 4 6(1) 9 20(2) 18(2) 20(5) 36(8) 113(18)
Source Internal data from the Ministry of Strategy and Finance
Out of 113 projects 18 were suspended as a result of RSF evaluations The results show higher percentages of feasible projects relative to PFS because while PFS focuses on evaluating the feasibility of a project RSF puts relatively more emphasis on finding alternatives to cut down the size or cost of a project
Table x12 shows the change in TPC by RSF The sum of initial TPC for projects conducted in 2003ndash09 was KRW 273 trillion and the line ministries requested a total of KRW 424 trillion So the RSF results suggested adjusting the total TPC to 347 trillion implying that KRW 77 trillion or 181 of TPC requested were cut through the RSF
PAGE 26
K O R E A
P I M R E F O R M A F T E R T H E F I N A N C I A L C R I S I S C O U N T R Y C A S E S T U D Y K O R E A
PIM Reform after the Financial Crisis
2 0 1 2
T H E P O W E R O F P U B L I C I N V E S T M E N T M A N A G E M E N T
Table x12 Results of RSF (change in total project costs KRW billions)
Initial TPC (A) TPC requested (B)
TPC by RSF (C)
(D) =(C)-(B)
(D)(B) ()
2003 1587 6137 5491 ndash646 ndash105
2004 291 711 613 ndash97 ndash136
2005 842 1511 1039 ndash472 ndash313
2006 3954 6826 3788 ndash3039 ndash445
2007 4141 4801 4040 ndash761 ndash159
2008 10569 13579 11998 ndash1581 ndash116
2009 5936 8859 7762 ndash1097 ndash124
Total 27320 42424 34731 ndash7693 ndash181
Source Internal data from the Ministry of Strategy and Finance
Until 2009 only two RDFs have been conducted since the RDF was introduced in 2006 the fourth section of the Hamyang-Ulsan Expressway and Kyungin Cannel project Based on the results of RDFs the MOSF decided to reduce the total cost limits on both projects
Performance Management and Evaluation of Completed Projects Three-tier systems of performance management and evaluation of completed projects were
simultaneously introduced within the Ministry of Strategy and Finance (1) Performance Monitoring System (2) S elf-Assessment System and (3) In-Depth Evaluation System Table x13 explains the main features of these systems
PAGE 27
K O R E A
P I M R E F O R M A F T E R T H E F I N A N C I A L C R I S I S C O U N T R Y C A S E S T U D Y K O R E A
PIM Reform after the Financial Crisis
2 0 1 2
T H E P O W E R O F P U B L I C I N V E S T M E N T M A N A G E M E N T
Table x13 Systems of Performance Management and Evaluation
Performance Monitoring Self-Assessment In-Depth Evaluation
Method
Establish objectives and indicators and use the results in government budget operation (Prepare performance report)
Provide a check list of projects for review and keep track of which projects are operated properly and which are making progress and so on
Apply scientific evaluation methods to each project to analyze spot problems and provide an alternative (Prepare evaluation report)
Main responsible body
Each ministry (Budget Division) Each Ministry (Budget division) and budget authority
Each Ministry (Project Management Division)
Applicable project
All policies and programs 20ndash30 of all Individual programs and projects
Merits
An overall progress report can be completed but not enough information can be given on individual project basis
Trade-off between Performance Monitoring and Program Evaluation
Detailed information can be given on an individual project basis but due to excessive time and costs this method is not suitable for all projects
Application
Used in management of performance of an organiza-tion as reference material for setting budget and in preparation of performance budget report
Used in improvement of project operating method and as (deliberation) reference for setting budget
Used in improvement of project operating method
Source Ministry of Strategy and Finance
Performance Monitoring System
The Performance Monitoring System (PMS) which started in the spring of 2003 requires line ministries to set up performance goals and indicators prepare annual performance plans and performance reports and submit them to the MOSF at the start of the annual budget cycle The MOSF is in charge of ensuring the system is in place by examining the status of PMS in line ministries coordinating the implementation and feeding the results back to resource allocation
PMS covers only part of the ministriesrsquo investment programs as those activities not involving large sums of expenditure (such as pure policy-making) are excluded from performance monitoring In addition activities for which the benefits of performance monitoring are expected to be small (such as wages and salaries ldquobasic programrdquo expenditures10 and general administrative expenses) are excluded as well
A performance report describes in a systematic way the degree to which program goals have been met It should list performance goals and indicators as originally set out in the performance plan describe the level of performance in terms of these goals and indicators explain the reasons for any poor performance summarize the assessment and describe future plans Optionally it can include audit results by the Board of Audit and Inspection and summarize findings of program evaluations
PAGE 28
K O R E A
P I M R E F O R M A F T E R T H E F I N A N C I A L C R I S I S C O U N T R Y C A S E S T U D Y K O R E A
PIM Reform after the Financial Crisis
2 0 1 2
T H E P O W E R O F P U B L I C I N V E S T M E N T M A N A G E M E N T
PMS will provide one source of information for budget allocation across sectors and programs Line ministries should present performance information when requesting budgets and the MOSF will utilize it when preparing the medium term National Fiscal Management Plan and drafting the budget
The PMS like its pilot project has not been very successful so far It received only lukewarm support from the top management in the MOSF Line ministries also showed little enthusiasm for the PMS In most cases performance indicators prepared by line ministries were not derived from ministerial missions in a systematic fashion Most importantly performance reports were not open to the public giving little incentive for line ministries to think seriously about the exercise
Program Review System Self-Assessment of Budgetary Programs
The Program Review System for Self-Assessment of Budgetary Programs (SABP) was introduced in 2005 by the MOSF to enhance links between performance evaluation and budget allocation It was designed after the Program Assessment Rating Tool (PART) of the US Government This program requires line ministries to assess their own programs with spending levels above a certain threshold The assessment was intended to cover all ministerial programs in a cycle of three years The assessment is based on 14 questions common to all types of programs and a few additional questions specific to different types of programs11 Table x14 shows the contents of checklist for the SABP
Table x14 Contents of Checklist for the SABP
Classification ( points weight of rating) Checklists
Design and planning (30)
y Program purpose y Rationale for government spending y Duplication with other programs y Efficiency of program design y Relevance of performance objectives and indicators y Relevance of performance targets
Management (20)
y Monitoring efforts y Obstacles of program implementation y Implementation as planned y Efficiency improvement or budget saving
Results and accountability (50)
y Independent program evaluation y Results y Satisfaction of citizens y Utilization of evaluation results
Source Park (2008)
A pilot SABP for government-financed projects was introduced in 2005 with input from various ministries and experts and a guideline for SABP was then distributed to each ministry Each ministry was to execute a self-evaluation and submit the results to the MOSF within two
PAGE 29
K O R E A
P I M R E F O R M A F T E R T H E F I N A N C I A L C R I S I S C O U N T R Y C A S E S T U D Y K O R E A
PIM Reform after the Financial Crisis
2 0 1 2
T H E P O W E R O F P U B L I C I N V E S T M E N T M A N A G E M E N T
months The evaluation took place within 40 departments of the relevant ministries for 555 projects budgeted at a total of KRW 35 trillion in project costs While the MOSF reviewed the results the relevant ministries were allowed to submit any questions or objections at two different intervals and these were reviewed again
The results of the SABP for 2005ndash07 are shown in figure x10 During the period a total of 1716 sub-programs were assessed for performance in fiscal years 2004 2005 and 2006 The figure shows the distribution of the total scores across the programs In 2005 the proportion of sub-programs in different departments in the ministries that were rated as ineffective was 157 percent and 52 percent of the programs were rated as effective The distribution of sub-program ratings did not change much between 2005 and 2006 but it improved in 2007 The proportion of ineffective programs dropped to 5 percent and that of effective sub-programs doubled This change in sub-program ratings in 2007 is attributed to the improvement of sub-program performance and agencies learning from a couple of yearsrsquo experience with SABP
Figure x10 Result of Self-Assessment of Budgetary Programs 2005ndash07 of total ratings
Source Park (2008)
Table x15 explains the linkage between SABP results and budget allocation in 2007 The programs rated as ineffective went through a 53 percent budget cut compared to the 2006 budget The main reason for this linkage between SABP results and budget allocation is that MOSF encouraged ministries to make use of assessment results in their budget requests announcing that a 10 percent of budget cut would be imposed on the programs rated as ineffective
PAGE 30
K O R E A
P I M R E F O R M A F T E R T H E F I N A N C I A L C R I S I S C O U N T R Y C A S E S T U D Y K O R E A
PIM Reform after the Financial Crisis
2 0 1 2
T H E P O W E R O F P U B L I C I N V E S T M E N T M A N A G E M E N T
Table x15 Linkage between SABP results and Budget Allocation 2007 KRW millions
2006 Budget
(A)
2007 Budget
(B) (B)-(A)
(B-A)(A)
()
Effective 889 887 -2 ndash02
Moderately Effective 3316 3565 249 75
Adequate 29718 28997 -721 ndash24
Ineffective 1143 538 ndash605 ndash529
Total 35066 33987
Source Park (2008)
Program Evaluation System In-Depth Evaluation Program
Under the current legal and administrative framework two methods of performance evaluation of public infrastructure investment are available One is performance evaluation as stipulated by the Enforcement Decree of Construction Technology Management Act The other one is In-depth Evaluation of Budgetary Programs (IEBP) under the Performance Management System12 IEBP analyzes the different factors that at different stages contribute to the performance of a government program by using scientific and systematic techniques The IEBP results are applied to improve and reform the system of operating programs
The Enforcement Decree of the Act requires the spending agency to file a performance evaluation report for construction projects whose total costs are KRW 50 billion or more In accordance with the Act MLTM established ldquoGuidelines for Performance Evaluations of Construction Projectsrdquo effective as of 2001 The guidelines outline the necessary details including the timing and methodologies for conducting performance evaluations required by government agencies These guidelines suggest that the performance evaluations be based on the Design and Implementation Evaluation Report and the Project Completion Report while comprehensively referring to all related materials including the (Pre-feasibility) Feasibility Study results
Despite the stipulation of the Enforcement Decree of the Construction Technology Management Act that requires the spending agency to file a performance evaluation report within three years of completion only a small number of performance evaluations were conducted until 2009 One reason is that there was no sanction against violation of the decrees thus the spending agencies have no incentive to implement these self-evaluations To draw lessons learned through the evaluation it is necessary to find some problems during the implementation process of the project The line ministry which is supposed to coordinate the evaluation did not take an active interest in this new system The other reason for slow progress in performance evaluation is that no clear framework for evaluation had been established A performance evaluation tracks whether a project or program achieves its objectives and secures the expected outcome The basic questions to be determined are what and how to evaluate However many projects have no clear concept of performance to be achieved by public investment For example many road construction projects under the national highway system have been regarded as just ldquonaturalrdquo It is not rare to find a statement of purpose for a road construction project that requires more than hundreds of billions
PAGE 31
K O R E A
P I M R E F O R M A F T E R T H E F I N A N C I A L C R I S I S C O U N T R Y C A S E S T U D Y K O R E A
PIM Reform after the Financial Crisis
2 0 1 2
T H E P O W E R O F P U B L I C I N V E S T M E N T M A N A G E M E N T
of KWS written in a single line ldquoTo relieve traffic congestionrdquo Since the basic concept of performance evaluations is to assess whether a project or a program achieves its objectives unless there is a clear target for a project or a program any assessment is going to be difficult
Under IEBP from 2005 to 2009 a total of 45 programs were evaluated initiated and controlled by the MOSF team With a wide coverage of areas for IEBP programs the MOSF seemingly tended to distribute the programs relatively evenly across line ministries Budgetary size was not considered as an essential criterion since half of the selected programs had an annual budget of less than KRW 100 billion The period of program implementation varies from program to program half of the programs had been in operation from four to ten years before being evaluated Although in principle IEBP was established for a single program eight programs containing three or more unit programs had been evaluated
IEBP still has a lot of trouble with implementing and feeding back results Since the availability of its database was strictly limited only 20 percent of the evaluation studies were subject to empirical analysis Data for evaluation analysis often does not exist and even when it does government officials in line ministries and agencies have given little attention to it The selection process for each IEBP has sometimes proved to be a tricky process since different purposes and approaches were taken by the MOSF and line ministries
Lessons Learned and Challenges Ahead The period after the economic crisis in 1997 witnessed many reform efforts intended to
enhance efficiency and transparency in developing and managing public infrastructure investment programs in Korea The MOSF has played a leading role in implementing an effective appraisal and evaluation system tightening the expenditure monitoring of total project cost and introducing a new budgeting system called the Medium Term Expenditure Framework (MTEF) In the past line ministries had ownership of the feasibility study process while the finance ministry used it to cut project budgets although not always on a reasonable basis With the reforms MOSF now makes the final decision on the project appraisal and determines the budget for it while the line ministries are responsible for identifying designing prioritizing and forecasting the effects of the project MOSF established a separate PIM Department responsible for the PIM reforms of PFS TPCM and RSF and these systems now mitigate information asymmetry between the finance ministry and line ministries and lead to better decision-making
The preliminary feasibility study (PFS) begun in 1999 and independently conducted mainly by the PIMAC at KDI seems to have been successful in handling the pass-or-fail hurdle of the project selection process An independent review of PFS by PIMAC used some help from policy analysts to make judgments on project desirability and their judgments were respected in most Government decision-making If policy analysis played merely a symbolic role and politicians and bureaucrats had disincentives to use this policy analysis such an independent judgment could not be made
PAGE 32
K O R E A
P I M R E F O R M A F T E R T H E F I N A N C I A L C R I S I S C O U N T R Y C A S E S T U D Y K O R E A
PIM Reform after the Financial Crisis
2 0 1 2
T H E P O W E R O F P U B L I C I N V E S T M E N T M A N A G E M E N T
The total project cost management system (TPCM) strengthened after the crisis appears to be working satisfactorily by limiting the frequency and amount of TPC increases in line ministries A reassessment study of feasibility (RSF) has been introduced as an innovative tool to control the total project cost limit in the middle of TPCM although there have been a few projects cancelled by RSF However the introduction of the performance monitoring and evaluation system is still lagging behind in Korea A greater emphasis on program evaluation is needed Once the Government adopts a performance orientation it can then encourage a greater use of performance contracts
Initiation of PFS in 1999 was a first step in the reform of PIM system in Korea which gave the Government the impetus to produce an effective sequencing of reforms in parallel with the project cycles with RSF and RDF coming later and then implementing performance evaluation last In order to improve the objectivity of the evaluation and secure consistency among projects standard evaluation and decision-making guidelines and manuals have been developed and published by the MOSF and PIMAC Sector guidelines and manuals in line ministries apply the same methodology and use the same or similar datasets for different projects in the same sector
The new PIM process and its capital budgeting has rooms for improvement The capacity for planning and prioritizing public investment programs in line ministries should be enhanced The planning and budget divisions of individual line ministries should play a greater role in the coordination of ministerial policies and budget requests unlike in previous years when they would simply compile budget requests from program divisions and send them to the MOSF with little modification The role of the MOSF should be changed as well As a central coordinator of government policies the MOSF should strengthen its capacity for policy analysis and long-term forecasts It should put less stress on input control and pay more attention to outputs and outcomes
PAGE 33
K O R E A
P I M R E F O R M A F T E R T H E F I N A N C I A L C R I S I S C O U N T R Y C A S E S T U D Y K O R E A
PIM Reform after the Financial Crisis
2 0 1 2
T H E P O W E R O F P U B L I C I N V E S T M E N T M A N A G E M E N T
Notes 1 Other social insurance programsmdashIndustrial Accident Insurance (1964) National Pension
(1988) and Employment Insurance (1995)mdashwere introduced and expanded in a similar fashion but their impact on total spending has been rather limited until recently
2 1 Examples include the West Coast Expressway Seoul-Busan High-speed Railroad and Incheon International Airport Even though such infrastructure investment takes the lionrsquos share of the spending on economic affairs it should be noted that the latter also includes subsidies to producers (farmers small and medium-sized enterprises and so on) and other possibly unproductive spending
3 1 von Hagen and Harden (1996) described two approaches to budgeting Under a target-based approach the Government collectively negotiates a set of binding numerical targets for the budget The budget process starts with negotiations among concerned parties over binding limits on the spending total or budget deficits Once these limits have been agreed upon they must be observed during the remainder of the budget process On the other hand under a strategic dominance-based approach the budget process vests the budget authorities with special strategic powers
4 1 In front-loading exercises the MOSF would allocate more funds than usual to the first half of the year and urge line ministries to spend the allocated funds as early as possible When necessary that is when growth is slower than expected despite front-loading the MOSF would consider introducing supplementary funds in the latter half of the year
5 5Potter and Diamond (1999) Schiavo-Campo and Tommasi (1999) and World Bank (1998) provide a useful guide on the reform in this direction
6 1 Ceilings are set for 14 spending areas such as social infrastructure agriculture education and environment then disaggregated into 56 programs for example social infrastructure has seven programs including roads railways subways ports airports housing and water resources Separate ceilings are also set within each program for the general account and various special accounts and funds
7 The former body of MPB was the Board of Planning and Budget which merged with the Office of National Budget to create MPB in May 1999 Subsequently merging with the Ministry of Finance and Economy the MPB became the MOSF in 2008
8 In January 2005 the Government of Korea passed an amendment to the 1999 Act on Private Participation in Infrastructure establishing the Public and Private Infrastructure Investment Management Center (PIMAC) as a new unit PIMAC is a merger between Private Infrastructure Investment Center of Korea (PICKO) of Korea Research Institute for Human Settlements established in 1999 and PIMA of KDI
9 The hierarchy of the legal framework in Korea is as follows ConstitutionndashActndashEnforcement DecreesndashMinisterial Ordinance
10 In Korea programs with small and recurrent costs are designated as ldquobasic programsrdquo after negotiation between line ministries and the MOSF Others are designated as ldquomajor programsrdquo
11 Types of programs are infrastructure investment procurement of large-scale facilities and equipment provision of direct services capital injection subsidies to private entities grants to local governments and RampD
PAGE 34
K O R E A
P I M R E F O R M A F T E R T H E F I N A N C I A L C R I S I S C O U N T R Y C A S E S T U D Y K O R E A
PIM Reform after the Financial Crisis
2 0 1 2
T H E P O W E R O F P U B L I C I N V E S T M E N T M A N A G E M E N T
12 As was pointed out Korea introduced the three-tier system for performance management and evaluation of budgetary programs performance monitoring program review and program evaluation IEBP is a core part of program evaluation
Bibliography Bank of Korea (var years) ldquoDatabase on Flow of Funds Accountsrdquo Bank of Korea Seoul
Kim Jay-Hyung 2003 Developing a Performance Evaluation System in Korea Edited by Chae-hyong
Kim Jay-Hyung 2012 ldquoPublic Investment Management Reform in Korea Efforts for Enhancing Efficiency and Sustainability of Public Expenditurerdquo Korea Development Institute
Kim and Hanguk Kaebal Yonguwon Seoul Korea Korea Development Institute
Koh Youngsun 2005 ldquoReforming the Fiscal Management System in Koreardquo Working paper Korea Development Institute Seoul Korea
Korea Development Institute 2004 The Standard Guideline for Preliminary Feasibility Studies on Road and Railway Projects 4th ed (in Korean) Seoul Korea Korea Development Institute
Ministry of Planning and Budget Korea 2007a ldquoGuidelines for Preliminary Feasibility Study Systemrdquo (in Korean) MOPB Government of Korea Seoul
Ministry of Planning and Budget Korea 2007b ldquoGuidelines for Total Project Cost Management Systemrdquo (in Korean) MOPB Government of Korea Seoul
MOCT (Ministry of Construction and Transportation Korea 1999 ldquoComprehensive Plan for Public Investment Budget Savingsrdquo(in Korean) MOCT Government of Korea Seoul
MOSF (Korea Ministry of Strategy and Finance) Government Finance Statistics in Korea various issues MOSF Government of Korea Seoul
MOSF (Korea Ministry of Strategy and Finance) various years National Statement for Current Bonds respective year MOSF Government of Korea Seoul
mdashmdashmdash various years National Statement for Current Bonds respective year MOSF Government of Korea Seoul
National Assembly Budget Office Korea 2004 ldquoSome Points at Issue in Preliminary Feasibility Study and Its Future Directionrdquo (in Korean) [[]] Government of Korea Seoul
OECD (Organisation for Economic Co-operation and Development) Various years Economic Surveys Korea Paris OECD
Perrin Burt 2002 ldquoImplementing the Vision Addressing Challenges to Results-focused Management and Budgetingrdquo Paris OECD
PAGE 35
K O R E A
P I M R E F O R M A F T E R T H E F I N A N C I A L C R I S I S C O U N T R Y C A S E S T U D Y K O R E A
PIM Reform after the Financial Crisis
2 0 1 2
T H E P O W E R O F P U B L I C I N V E S T M E N T M A N A G E M E N T
Park Nowook 2008 ldquoPerformance-oriented Budgeting in Korea Evidence and Lessonsrdquo Korea Institute of Public Finance Seoul
Potter Barry H and Jack Diamond 1999 Guidelines for Public Expenditure Management Washington DC International Monetary Fund
Schiavo-Campo Salvatore and Daniel Tommasi 1999 Managing Government Expenditure Manila Asia Development Bank
von Hagen Jurgen and Ian Harden 1996 ldquoBudget Processes and Commitment to Fiscal Disciplinerdquo IMF Working Paper WP9678 International Monetary Fund Washington DC
World Bank 1998 Public Expenditure Management Handbook Washington DC World Bank
2004 The General Guideline for Preliminary Feasibility Studies 4th ed (in Korean) Seoul Korea Korea Development Institute
mdashmdashmdash various years Korea Consolidated Fiscal Balance MOSF Government of Korea Seoul
mdashmdashmdash 2005a Annex to Summary of 2005 Budget MOSF Government of Korea Seoul
mdashmdashmdash 2005b Performance Management Handbook MOSF Government of Korea Seoul
World Bank 2003 ldquoWorld Development Indicatorsrdquo World Bank Washington DC
1 Other social insurance programsmdashIndustrial Accident Insurance (1964) National Pension (1988) and Employment Insurance (1995)mdashwere introduced and expanded in a similar fashion but their impact on total spending has been rather limited until recently
2 Examples include the West Coast Expressway Seoul-Busan High-speed Railroad and Incheon International Airport Even though such infrastructure investment takes the lionrsquos share of the spending on economic affairs it should be noted that the latter also includes subsidies to producers (farmers small and medium-sized enterprises and so on) and other possibly unproductive spending
3 von Hagen and Harden (1996) described two approaches to budgeting Under a target-based approach the Government collectively negotiates a set of binding numerical targets for the budget The budget process starts with negotiations among concerned parties over binding limits on the spending total or budget deficits Once these limits have been agreed upon they must be observed during the remainder of the budget process On the other hand under a strategic dominance-based approach the budget process vests the budget authorities with special strategic powers
4 In front-loading exercises the MOSF would allocate more funds than usual to the first half of the year and urge line ministries to spend the allocated funds as early as possible When necessary that is when growth is slower than expected despite front-loading the MOSF would consider introducing supplementary funds in the latter half of the year
5Potter and Diamond (1999) Schiavo-Campo and Tommasi (1999) and World Bank (1998) provide a useful guide on the reform in this direction
6 Ceilings are set for 14 spending areas such as social infrastructure agriculture education and environment then disaggregated into 56 programs for example social infrastructure has seven programs including roads railways subways ports airports housing and water resources Separate ceilings are also set within each program for the general account and various special accounts and funds
7 The former body of MPB was the Board of Planning and Budget which merged with the Office of National Budget to create MPB in May 1999 Subsequently merging with the Ministry of Finance and Economy the MPB became the MOSF in 2008
8 In January 2005 the Government of Korea passed an amendment to the 1999 Act on Private Participation in Infrastructure establishing the Public and Private Infrastructure Investment Management Center (PIMAC) as a new unit PIMAC is a merger between Private Infrastructure Investment Center of Korea (PICKO) of Korea Research Institute for Human Settlements established in 1999 and PIMA of KDI
9The hierarchy of the legal framework in Korea is as follows ConstitutionndashActndashEnforcement DecreesndashMinisterial Ordinance
10 In Korea programs with small and recurrent costs are designated as ldquobasic programsrdquo after negotiation between line ministries and the MOSF Others are designated as ldquomajor programsrdquo
PAGE 36
K O R E A
P I M R E F O R M A F T E R T H E F I N A N C I A L C R I S I S C O U N T R Y C A S E S T U D Y K O R E A
PIM Reform after the Financial Crisis
2 0 1 2
T H E P O W E R O F P U B L I C I N V E S T M E N T M A N A G E M E N T
11 Types of programs are infrastructure investment procurement of large-scale facilities and equipment provision of direct services capital injection subsidies to private entities grants to local governments and RampD
12 As was pointed out Korea introduced the three-tier system for performance management and evaluation of budgetary programs performance monitoring program review and program evaluation IEBP is a core part of program evaluation

PAGE 4
K O R E A
P I M R E F O R M A F T E R T H E F I N A N C I A L C R I S I S C O U N T R Y C A S E S T U D Y K O R E A
PIM Reform after the Financial Crisis
2 0 1 2
T H E P O W E R O F P U B L I C I N V E S T M E N T M A N A G E M E N T
Contents Trends in Public Investment Expenditure 1
Institutional Framework for PIM 7
Recent Change from Bottom-Up to Top-Down Budgeting 8 New Initiatives in Public Investment Management 9
Project Appraisal by Preliminary Feasibility Study 12
Initiative for a Preliminary Feasibility Study 12 Contents of PFS 14 PFS Evaluation Guidelines 17 Performance of PFS 17
Procurement and Capital Budget Implementation 20
TPCM Manages PIP Construction Budgets 20 TPCM by Project Phase 21 Reassessment Study of Feasibility and Reassessment of Demand Forecast 22 Performance of TPCM RSF and RDF 23
Performance Management and Evaluation of Completed Projects 26
Performance Monitoring System 27 Program Review System Self-Assessment of Budgetary Programs 28 Program Evaluation System In-Depth Evaluation Program 30
Lessons Learned and Challenges Ahead 31
References 32
Bibliography 34
Endnotes Error Bookmark not defined
Figures
Figure x1 General and Central Government Spending 1980ndash2008 2 Figure x2 General Government Spending by Function 1980ndash2008 2 Figure x3 Capital Formation Trends by Sector 1980ndash2008 of GNI 6 Figure x4 Size of Government Fiscal Lending (as of balance) 1990ndash2008 of GDP 6 Figure x5 Chronology of New Initiatives in Korearsquos PIM System 10 Figure x6 Implementation Process of Public Investment Management 12 Figure x7 Preliminary Feasibility Study Procedures 14 Figure x8 Outline of PFS Procedures and Contents 15 Figure x9 Structure of AHP in PFS 16 Figure x10 Result of Self-Assessment of Budgetary Programs 2005ndash07 of total ratings 29
PAGE 5
K O R E A
P I M R E F O R M A F T E R T H E F I N A N C I A L C R I S I S C O U N T R Y C A S E S T U D Y K O R E A
PIM Reform after the Financial Crisis
2 0 1 2
T H E P O W E R O F P U B L I C I N V E S T M E N T M A N A G E M E N T
Tables Table x1 Consolidated Fiscal Expenditure and Net Lending by Central Government by Function 3 ( of total) 3 Table x2 Trend of Facility Stock by Transport Sector 4 Table x3 Major Players in Korearsquos Budget Process 8 Table x4 Number of PFS Submitted by Sector 1999ndash2009 18 Table x5 Proportion of Feasible Projects by Sector 1999ndash2009 18 Table x6 Feasiblenon-feasible Projects according to BC Ratios (1999ndash2002) 19 Table x7 Feasiblenon-feasible Projects according to BC Ratios and AHP Scores (2003ndash2009) 20 Table x8 Number of Projects with Substantial Change in TPC 24 Table x9 Sources of in Total Project Cost Adjustment 24 Table x10 Trend of Requests for TPC Increase 25 Table x11 Number of RSF by Sector 2003ndash09 25 Table x12 Results of RSF (change in total project costs KRW billions) 25 Table x13 Systems of Performance Management and Evaluation 27 Table x14 Contents of Checklist for the SABP 28 Table x15 Linkage between SABP results and Budget Allocation 2007 KRW millions 30
PAGE 1
K O R E A
P I M R E F O R M A F T E R T H E F I N A N C I A L C R I S I S C O U N T R Y C A S E S T U D Y K O R E A
PIM Reform after the Financial Crisis
2 0 1 2
T H E P O W E R O F P U B L I C I N V E S T M E N T M A N A G E M E N T
The financial crisis that hit the Republic of Korea (ldquoKoreardquo) in the second half of 1997 had a devastating impact on its economy causing the worst recession since the Korean War era To address the fundamental causes of the crisis and revitalize the economy the Korean Government took bold decisive steps to initiate comprehensive structural reforms The major focus of reform in the fiscal and public sector was to adopt a market-oriented focus and managerial strategies to increase efficiency and transparency The Government endeavored to instill a performance-oriented approach in the system which implies management of public expenditure based on the principle of value for money
In the last decade the Korean Government adopted a series of integrated (ex ante intermediate and ex post) quality control efforts for efficient management of its public investment program The budget ministry established a strong and effective project appraisal scheme to provide oversight of the line ministriesrsquo project selection process The reforms include a formal review process to ensure that funds are continually subjected to monitoring and evaluation In addition budgeting for public investment was simplified by reducing the number of special accounts and government funds The Government in 2004 introduced the Medium Term Expenditure Framework (MTEF) with top-down budgeting for fiscal year 2005 The MTEF pointed to a need to enhance the capacity for planning and prioritizing public investment management (PIM) programs in the line ministries It also emphasized the need to change the role of the budget ministry as well
This chapter explains the institutional setting for PIM and the reform efforts of the Korean Government to develop and manage a comprehensive PIM program to further improve value for money invested The first section provides a brief summary of public investment expenditure trends in Korea followed by an outline of an institutional framework for public investment management The major players in the budget process are described and the reform efforts to pass the MTEF as well as recent PIM initiatives are examined Then an in-depth description focuses on how the public investment projects (PIPs) are selected prioritized and managed in the budget process beginning with a description of how the project appraisal is carried out up to the preliminary feasibility study Next the design of the total project cost management system from procurement implementation to performance management and the evaluation system are discussed Finally a summary presents challenges and recommendations for improving public investment selection prioritization management and budgeting procedures
Trends in Public Investment Expenditure The Korean Government increased public investment expenditure rapidly in response to
the growing demand for public services along with rapid economic development As a result general government (local and central) spending rose from 18 percent of GDP in 1987 to 30 percent in 2009 (figure x1) Central Government expenditure and net lending showed similar growth
PAGE 2
K O R E A
P I M R E F O R M A F T E R T H E F I N A N C I A L C R I S I S C O U N T R Y C A S E S T U D Y K O R E A
PIM Reform after the Financial Crisis
2 0 1 2
T H E P O W E R O F P U B L I C I N V E S T M E N T M A N A G E M E N T
Figure x1 General and Central Government Spending 1980ndash2008
Source System of National Accounts Bank of Korea (httpecosbokorkr) Government Finance Statistics Ministry of Finance and Strategy (httpwwwmosfgokr)
Figure x2 depicts the general growth rate of public expenditure by sector it shows a notable increase in welfare expenditure and a continuous decrease in defense expenditure The state welfare expenditure increased with the 1977 introduction of National Health Insurance (NHI) for firms with 500 or more employees After a series of expansions the NHI came to cover the entire population in 1989 and government expenditures increased accordingly1
Figure x2 General Government Spending by Function 1980ndash2008
Source Bank of Korea (httpecosbokorkr)
Note Welfare spending includes social protection health and housing and community services
PAGE 3
K O R E A
P I M R E F O R M A F T E R T H E F I N A N C I A L C R I S I S C O U N T R Y C A S E S T U D Y K O R E A
PIM Reform after the Financial Crisis
2 0 1 2
T H E P O W E R O F P U B L I C I N V E S T M E N T M A N A G E M E N T
In addition to the increase in welfare spending spending on economic affairs grew rapidly in the early 1990s with the launch of infrastructure improvements construction of roads subways dams and water supplies2 Traditionally economic affairs and education accounted for about 40 percent of total government spending the former being a slightly larger share Spending on economic affairs contributed to the fast expansion of economic infrastructure while spending on education supported the rise in enrollment rates which are currently close to 100 percent for primary and secondary education private as well as public schools depend heavily on Central Government funding (Colleges and universities are funded mainly by tuition)Table x1 distinguishes consolidated fiscal expenditure and net lending of the Central Government which provides detailed information on expenditure of economic affairs Spending on the transportation and communication sectors accounts for the largest part of expenditures on economic affairs while agriculture forestry fishing and hunting and mining manufacturing and construction hold the second and the third rank respectively Judging whether such fiscal allocation is reasonable and whether the expenditure size is feasible are both difficult tasks
Table x1 Consolidated Fiscal Expenditure and Net Lending by Central Government by Function ( of total)
Government Function Central Government Expenditure
1980 1990 2000 2008
General public services Defense
Public order and safety Education
Health Social protection
Housing construction and community amenities Recreation culture and religion
Economic affairs Fuel and energy
Agriculture forestry fishing and hunting Mining manufacturing and construction
Transportation and communication Other economic affairs Other expenditures
40 306 46
146 10 57 25 07
260 21 59 74 67 39
104
42 200 43
170 17 81
101 05
204 06
102 20 61 14
137
52 114 46
153 07
153 53 08
252 07 62 26 99 58
162
69 149 64
212 13
282 84 13
260 33 68 16
106 37
221
Total 1000 1000 1000 1000
Source MOSF (each year) Note Redemption of public funds (KRW 12 trillion) for year 2004 excluded
PAGE 4
K O R E A
P I M R E F O R M A F T E R T H E F I N A N C I A L C R I S I S C O U N T R Y C A S E S T U D Y K O R E A
PIM Reform after the Financial Crisis
2 0 1 2
T H E P O W E R O F P U B L I C I N V E S T M E N T M A N A G E M E N T
Examination of the transport sectormdashthe largest part of spending in economic affairsmdashshows a constant increase in facility stock (table x2) Road length has more than doubled from 1980 to 2008 Considering that these data do not reflect the increase in number of lanes road facilities in reality have expanded even further Indices for port loadunload capacity and capacity for airport facilities show rapid increases as well Transport facilities therefore do not appear to be a serious economic problem in Korea except for discussions on the need to increase investment in the railway sector
Table x2 Trend of Facility Stock by Transport Sector
Year
Road length Expressway length
Railway length Port loadunload capacity
Capacity for airport facility
(km) relative
indexa
(km) relative index
(km) relative index
(million ton)
relative index
(thousands of flights)
relative index
1980
1990
2000
2008
46951
56715
88775
104236
100
121
189
222
1225
1551
2131
3447
100
127
174
281
3135
3091
3123
3381
100
099
100
108
823
2243
4304
7586
100
273
523
922
1006
1331
2025
2222
100
132
201
221
Source Korea Development Institute 2004 Ministry of Land Transport and Maritime Affairs Statistics on Land Transport and Maritime Affairs
Note a Relative index according to 1980 stock level
Figure x3 shows that public investment expenditure by the Government in areas such as transport has taken an important role in total domestic investment Since 1970 the gross domestic investment ratio (which equals national total capital formationgross national disposable income) has been maintained at around 30 percent and the general government investment ratio (the general government capital formationgross national disposable income) at around 5 percent with the general government taking up about 15 percent of total investment General government public investment has increased since 2000 when the gross domestic investment ratio saw a slight decrease If public enterprises are included in the figure representation of investment by the public sector would far outweigh that of the general government
The Government has not focused only on infrastructure facility expansion in the process of economic development It has also more directly intervened in the market in order to resolve market failure especially failure of the financial markets One method used was fiscal lending Figure x4 examines the size of fiscal lending using two indices lending by the general government as indicated in Flow of Funds from the Bank of Korea (Bank of Korea var years) and loan
PAGE 5
K O R E A
P I M R E F O R M A F T E R T H E F I N A N C I A L C R I S I S C O U N T R Y C A S E S T U D Y K O R E A
PIM Reform after the Financial Crisis
2 0 1 2
T H E P O W E R O F P U B L I C I N V E S T M E N T M A N A G E M E N T
repayment by the Central Government as indicated in National Statement for Current Bonds (MOSF var years) announced by the financial authority Fiscal lending has reached a sizable amount the housing sector takes the biggest part and the small- and medium-sized enterprise (SME) sector and agricultural sector follow respectively
PAGE 6
K O R E A
P I M R E F O R M A F T E R T H E F I N A N C I A L C R I S I S C O U N T R Y C A S E S T U D Y K O R E A
PIM Reform after the Financial Crisis
2 0 1 2
T H E P O W E R O F P U B L I C I N V E S T M E N T M A N A G E M E N T
Figure x3 Capital Formation Trends by Sector 1980ndash2008 of GNI
Source MOSF internal data Bank of Korea Economic Statistics System (httpecosbokorkr)
Note Capital formation and investment to foreign country as ratio to gross national disposable income
Figure x4 Size of Government Fiscal Lending (as of balance) 1990ndash2008 of GDP
Source MOSF internal data Bank of Korea Economic Statistics System (httpecosbokorkr)
Note Government lending and loans as of 1968 System of National Accounts (SNA) before 2001 and as of 1993 SNA after 2002
PAGE 7
K O R E A
P I M R E F O R M A F T E R T H E F I N A N C I A L C R I S I S C O U N T R Y C A S E S T U D Y K O R E A
PIM Reform after the Financial Crisis
2 0 1 2
T H E P O W E R O F P U B L I C I N V E S T M E N T M A N A G E M E N T
Institutional Framework for PIM Major players in the budget process include the Ministry of Strategy and Finance (MOSF)
and the Board of Audit and Inspection (BAI) (see table x3) The MOSF is responsible for preparing the draft budget based on revenue forecasts of the Tax and Customs Office in the MOSF When the budget is authorized by the National Assembly the MOSF prepares the quarterly budget implementation plan usually within a month and allocates funds to line ministries The Treasury Bureau of the MOSF then prepares the monthly cash plan and releases cash to line ministries The Treasury Bureau keeps track of cash flows into and from the treasury single account held in the Bank of Korea It is also responsible for issuing government bonds and managing government assets and liabilities
An important issue concerning the interplay among various players is fiscal discipline The budget process has generally taken a highly centralized strategic dominance-based approach to maintaining fiscal discipline3 The MOSF plays a central role in budgeting as well as in preparing and implementing public investment programs Often the main budgeting decisions are made in bilateral negotiations between the budget authority and the spending ministry
The MOSF exercises tight control on public expenditures in the implementation stage Ministries are required to spend within the limits set in the quarterly budget implementation plan When deemed necessary the MOSF can postpone or block part of the expenditures All limits on expenditures are imposed in cash terms Transfers across appropriation accounts are prohibited unless authorized by the National Assembly or by the MOSF
The Treasury Bureau of the MOSF also has a tight grip on cash outflow All cash disbursements are made strictly within the limits set in the monthly cash plans Before the 1997 crisis it was not uncommon for the Treasury Bureau to delay disbursements to line ministries when there was not enough money left in the treasury account due to the seasonality of tax collection This was the case despite the fact that they could issue short-term debt instruments within the limit set by the National Assembly to bridge the gap between tax collection and cash needs In addition the revenue forecasts prepared by the Tax and Customs Office were often very conservative with the actual tax collection overshooting the forecast by substantial margins
PAGE 8
K O R E A
P I M R E F O R M A F T E R T H E F I N A N C I A L C R I S I S C O U N T R Y C A S E S T U D Y K O R E A
PIM Reform after the Financial Crisis
2 0 1 2
T H E P O W E R O F P U B L I C I N V E S T M E N T M A N A G E M E N T
Table x3 Major Players in Korearsquos Budget Process
Players Roles
Ministry of Strategy and Finance (MOSF)
x Compiles budget bids and prepares the draft budget x Allocates funds to spending ministries (apportionment) x Approves the transfers of funds between line items (virements)
Treasury Bureau of the MOSF
x Releases cash to spending ministries x Manages the treasury single account held in the Bank of Korea x Issues treasury bonds and manages assets and liabilities x Collects ministerial financial reports prepares the whole-of-
government financial reports and sends them to the BAI x Produces the government financial statistics
Tax and Customs Office of the MOSF
x In charge of tax policy x Prepares revenue forecasts x Oversees the National Tax Service and the Customs Service
Line ministries Execute the budget and prepare financial reports
Board of Audit and Inspection (BAI)
x The supreme audit institution in Korea whose head is nominated by and reports to the President The National Assembly can also request audits on specific issues to the BAI
x Checks the regularity of ministerial activities x Prepares and tables the financial report to the National
Assembly
National Assembly x Deliberates and votes on the budget x Approves the transfers of funds between programs x Reviews and approves audit reports
Some changes were observed in cash management and revenue forecast practices after the
1997 financial crisis Pressured to stimulate the economy and in particular to back up the front-loading4 of annual spending that has been popular since 1999 the MOSF resorted more and more to short-term debt instruments to bridge the gap between tax collection and cash needs The downward bias in revenue forecasts was also reduced In 2004 there had actually been a large shortfall in tax collection which was partly blamed on an overly optimistic assumption on the economic growth which was in turn claimed by some to have been politically motivated Now the democratization of Korean politics and the devolution of budgetary power to line ministries became an unavoidable trend
Recent Change from Bottom-Up to Top-Down Budgeting
The Korean Governmentrsquos budget process has undergone a significant change beginning when the Government introduced the Medium Term Expenditure Framework (MTEF) together with top-down budgeting in 2004 for fiscal year 20055 The reform was intended to address several defects found in the previous budgeting practice Prior to the introduction of the MTEF budgeting
PAGE 9
K O R E A
P I M R E F O R M A F T E R T H E F I N A N C I A L C R I S I S C O U N T R Y C A S E S T U D Y K O R E A
PIM Reform after the Financial Crisis
2 0 1 2
T H E P O W E R O F P U B L I C I N V E S T M E N T M A N A G E M E N T
was centered on the next single budget year and lacked a medium-term perspective The MOSF and the National Assembly gave little consideration to the out-years beyond the budget year Line ministries had little information on the extent of the resources that would be available to them in the future and their medium- to long-term planning function was severely limited It was also difficult for the MOSF to identify and cope with the trend towards increased public expenditure Without a long-term view on the appropriate level of the tax burden the MOSF would simply allow ever-increasing public spending to accommodate rising demands from various sectors
Before the introduction of the top-down process budgeting relied exclusively on a bottom-up approach At the initial stage of budget preparation the MOSF made rough estimates of the total size and the sectoral allocation of the next yearrsquos budget But the estimates were not transmitted to line ministries and therefore could not guide them in preparing their budget requests When reviewing the ministriesrsquo budget requests the MOSF focused on the microscopic spending control of individual public investment programs The sectoral allocation and the total size of the budget were determined at the last stage of budget preparation by aggregating the expenditures on individual programs As a result control of inputs assumed major significance in budget discussions and little attention was paid to outputs or outcomes The accountability and autonomy of line ministries in preparing and managing their budget was also severely limited Line ministries usually requested an unrealistically large amount of the budget and massive cuts were inevitable
With the introduction of the MTEF and top-down budgeting the process changed Now the annual budgeting exercise starts with a discussion on fiscal management over the next five years including the current year the budget year and three out-years Following this discussion the MOSF transmits spending ceilings for sectors and programs to line ministries6 These ceilings encompass the general and special accounts and funds Line ministries are now asked to prepare their budget requests within these ceilings When reviewing the ministerial budget requests the MOSF places less emphasis on the microscopic control of line items and more on the strategic alignment of budget requests with overall policy directions
New Initiatives in Public Investment Management
In order to enhance the efficiency of PIM the Korean Government in 1999 organized a cross-ministerial task force to develop an action plan The task force was jointly headed by Ministry of Planning and Budget7 (now MOSF) and the Ministry of Construction and Transportation (MOCT) (now Ministry of Land Transport and Maritime Affairs MLTMA) The MOCT issued ldquoA Comprehensive Plan to Enhance Efficiency of Public Investmentrdquo in July 1999 (MOCT 1999) Various policy measures were introduced to tackle the weaknesses of the existing public investment management system
One of the features of the new PIM system was to intensify the monitoring system of the project implementation process by the budgeting agency For example the MOSF now takes charge of the Preliminary Feasibility Studies (PFS) the results of which are reflected in the budget appropriation This arrangement represents a compromise between the MOSF which tried to take over the feasibility study function from the line ministries and the line ministries especially the
PAGE 10
K O R E A
P I M R E F O R M A F T E R T H E F I N A N C I A L C R I S I S C O U N T R Y C A S E S T U D Y K O R E A
PIM Reform after the Financial Crisis
2 0 1 2
T H E P O W E R O F P U B L I C I N V E S T M E N T M A N A G E M E N T
MLTMA which were resistant to the idea of transferring ownership of the feasibility study to the MPB Thus the PFS was ldquoinventedrdquo as a settlement to relieve the resistance from the line ministries
The Total Project Cost Management System (TPCM) in which the budget ministry checks the cost increase from the baseline throughout the project life was also strengthened Introduced in 1994 the TPCM was established as an effective measure of government expenditure management after the financial crisis Under the TPCM System the Reassessment Study of Feasibility (RSF) and Reassessment of Demand Forecast (RDF) were introduced in 1999 and 2006 respectively RSF and RDF reformulate feasibility studies and demand forecasts on projects under design development or construction and decide whether the project may continue The RSF guidelines and RDF system were developed and introduced after the PFS system was established The guidelines of RSF and RDF adopt the same analytical methodology as that of the PFS Figure x5 shows a brief chronology of PIM system evolution
Figure X5 Chronology of New Initiatives in Korearsquos PIM System
For line ministries the Government introduced the ex-post performance evaluation system in 1999 According to the MOCT Comprehensive Plan the line ministries were supposed to evaluate the performance of the project within three years after construction work is completed In 2000 the MOCT amended the Enforcement Decree of the Construction Technology Management Act to incorporate the initiatives included in the Comprehensive Plan The legal ground of PFS and TCPM resides in several laws their enforcement decrees and administrative guidelines such as the Budgeting and Accounting Act and the Fund Management Act In 2006 the National Finance Act combining several fiscal-related acts was legislated to stipulate diverse policy measures of PIM
With the establishment of a legal framework for public investment the PIM project was to be implemented in accordance with the process shown in figure x5 Throughout the process the MOSF produces information necessary for decision-making on budgeting through PFS FSF RDF
RSF guidelines
strengthened PE introduced
RSF guidelines developed
RDF introduced
The National Finance Act legislated
1994 1999 2005 2006
PFS introduced TPCM introduced
RSF introduced
9 TPCM (Total Project Cost Management) 9 PFS (Preliminary Feasibility Study)
9 RSF (Reassessment Study of Feasibility) 9 RDF (Reassessment of Demand Forecast) 9 PE (Performance Evaluation)
PAGE 11
K O R E A
P I M R E F O R M A F T E R T H E F I N A N C I A L C R I S I S C O U N T R Y C A S E S T U D Y K O R E A
PIM Reform after the Financial Crisis
2 0 1 2
T H E P O W E R O F P U B L I C I N V E S T M E N T M A N A G E M E N T
and in-depth program evaluation In the past line ministries provided selective information to procure more of the budget leading the MOSF to cut project budgets but not always on a reasonable basis New devices investigating the projects in detail made it possible for the MOSF to manage public investment more effectively
PAGE 12
K O R E A
P I M R E F O R M A F T E R T H E F I N A N C I A L C R I S I S C O U N T R Y C A S E S T U D Y K O R E A
PIM Reform after the Financial Crisis
2 0 1 2
T H E P O W E R O F P U B L I C I N V E S T M E N T M A N A G E M E N T
Figure X6 Implementation Process of Public Investment Management
Ex-Ante Intermediate Ex-Post
x TPCM(RSF amp RDF) x Performance Evaluation
x In-depth Program Evaluation
Note The bulleted items are under the aegis of MOSF
Project Appraisal by Preliminary Feasibility Study Improvement of a project appraisal system at the ex ante level is very important for
ensuring sound public expenditure As discussed the Ministry of Strategy and Finance introduced the preliminary feasibility study (PFS) to enhance efficiency in the early decision-making process of major infrastructure investment projects Throughout the project cyclemdashsuch as the stages of identification preparation implementation evaluation and so onmdashthe MOSF is interested in improving the methods of ex-ante appraisal at the preparation stage
Initiative for a Preliminary Feasibility Study
The PFS is a brief evaluation of a project to produce information for a budgetary decision A critical change is that the PFS is owned by the Ministry of Strategy and Finance (MOSF) Under the new procedure the MOSF established the Public Investment Management Center (PIMA) within the
Blueprint Design
Land Acquisition Construction
Draft Design Operation Maintenance
PFS
Feasibility Study
Strategic Planning
PAGE 13
K O R E A
P I M R E F O R M A F T E R T H E F I N A N C I A L C R I S I S C O U N T R Y C A S E S T U D Y K O R E A
PIM Reform after the Financial Crisis
2 0 1 2
T H E P O W E R O F P U B L I C I N V E S T M E N T M A N A G E M E N T
Korea Development Institute (KDI) with the mandate to conduct research and take an operational managing role in implementing the PFS procedures8
The PFS is conducted by a multi-disciplinary research team organized by PIMA (now PIMAC Public and Private Infrastructure Investment Management Center) typically consisting of economists transportation researchers and civil engineers The mix of specialists from different backgrounds and organizations helps to provide diverse ideas for the appraisal and improve the transparency and objectivity of the decision-making process The PFS Review Committee is organized by the MOSF with members of staff from the budget and line ministries PIMAC and field specialists Open discussions are held regularly on the PFS mid-term and final reports
The PFS process aims to enhance fiscal productivity by launching large-scale public investment projects based on transparent and objective ex-ante project evaluations The meaning of ldquopreliminaryrdquo is twofold first it means ldquoprovisionalrdquo evaluation a short and brief examination second it is an evaluation that precedes a (detailed) feasibility study The National Finance Act of 2006 provides the legal framework of PFS9 Before that legislation PFS was based on the Enforcement Decrees of the Budgeting and Accounting Act and the Fund Management Act these two laws were merged into the National Finance Act in 2006
The coverage of PFS is so extensive that it has made notable changes to the PIM system since its inception All new large-scale projects with a total cost of KRW50 billion (about US$50 million) or more are subject to the PFS With the National Finance Act the scope of the PFS was expanded to non-infrastructure projects (for example RampD) Local governments and PPI (private participation in infrastructure) projects are also subject to the PFS if the Central Government subsidy exceeds KRW30 billion
The following types of projects are exempted from the PFS typical building projects such as government offices and correctional institutions legally required facilities such as sewage and waste treatment facilities rehabilitating projects and restoration works from natural disasters projects implemented by international accords and by a SouthndashNorth Korea exchange and cooperation program and military facilities and projects related to national security
In every budget cycle of public infrastructure projects the PFS procedure is conducted as follows At the first stage a concerned line ministry submits a list of PFS candidate projects to the MOSF and the MOSF selects the PFS projects and requests PFS to PIMAC at KDI PIMAC organizes the research team conducts the PFS and submits the final PFS reports to the MOSF (figure x7) In the middle of conducting the PFS and making a final decision the PFS Review Committee takes charge of the whole review process
PAGE 14
K O R E A
P I M R E F O R M A F T E R T H E F I N A N C I A L C R I S I S C O U N T R Y C A S E S T U D Y K O R E A
PIM Reform after the Financial Crisis
2 0 1 2
T H E P O W E R O F P U B L I C I N V E S T M E N T M A N A G E M E N T
Figure x7 Preliminary Feasibility Study Procedures
Contents of PFS
The PFS is conducted in three phases background study main analyses and synthesis The background study reviews the statement of purpose and collects background data on socio-economic geographic and technical aspect of the project In addition key agendas for the main analyses are discussed in the background study through brainstorming
Line Ministry
Ministry of Strategy amp Finance
Korea Development Institute (Public and Private Infrastructure Investment Management Center)
Submit PFS projects candidate
Feasibility Study or Stop
Select PFS Projects
Request PFS
Make investment Decision
Announcement
Submit PFS Report
Organize Teams Conduct PFS
PAGE 15
K O R E A
P I M R E F O R M A F T E R T H E F I N A N C I A L C R I S I S C O U N T R Y C A S E S T U D Y K O R E A
PIM Reform after the Financial Crisis
2 0 1 2
T H E P O W E R O F P U B L I C I N V E S T M E N T M A N A G E M E N T
Figure x8 Outline of PFS Procedures and Contents
The main analyses in the PFS process are economic analysis policy analysis and balanced regional development analysis The backbone of the economic analysis is the cost-benefit analysis The economic benefit and economic cost of a project are estimated based on the forecasted demand The criteria of cost-benefit ratio NPV (net present value) and IRR (internal rate of return) are calculated based on the stream of annual benefit and cost As of 2007 a social discount rate of 55 percent in real terms is applied to the analysis based on the trend of risk free interstate rate in Korea
Policy analysis examines the potential effects of the projects in qualitative and quantitative terms including consistency with higher level policy possible project risk and other project-specific considerations In the consistency category the attitudes of the project owner and local residents toward the project and the level of preparedness of the project proposers are examined In the project risk category the risk of funding availability and the environmental risk of the project are evaluated
Balanced regional development analysis is an evaluation of the project from a regional perspective The regional backwardness index a composite index of eight characteristics for local entities was developed by the PFS guidelines The regional economic impact analysis is also conducted through the MRIO (Multi-Regional Input-Output) model
To synthesize the results of these economic policy and balanced regional development analyses the AHP (Analytic Hierarchy Process) technique is applied in the PFS AHP is a multi-
Project Proposal
Background Study
bull Review of Statement of purposebull Collect socio-economic
geographic and a technical data
bull Brainstorming (Other Alternatives)
bull PFS issues raised
Policy Analysis
bull Consistency with higher-level plan and policy directions
bull Project risk (financing and environmental impact)
bull Project-specific evaluation item
Balanced Regional Development Analysis
bull Regional backwardness index analysis
bull Regional Economic impact
Economic Analysis
bull Demand analysisbull Cost estimationbull Benefit estimationbull Cost-benefit analysisbull Sensitivity analysisbull Financial analysis
Analytic Hierarchy Process
bull Overall feasibilitybull Prioritizationbull Financing and policy
suggestion
Project ProposalProject Proposal
Background StudyBackground Study
bull Review of Statement of purposebull Collect socio-economic
geographic and a technical data
bull Brainstorming (Other Alternatives)
bull PFS issues raised
Policy AnalysisPolicy Analysis
bull Consistency with higher-level plan and policy directions
bull Project risk (financing and environmental impact)
bull Project-specific evaluation item
Balanced Regional Development Analysis
Balanced Regional Development Analysis
bull Regional backwardness index analysis
bull Regional Economic impact
Economic AnalysisEconomic Analysis
bull Demand analysisbull Cost estimationbull Benefit estimationbull Cost-benefit analysisbull Sensitivity analysisbull Financial analysis
Analytic Hierarchy ProcessAnalytic Hierarchy Process
bull Overall feasibilitybull Prioritizationbull Financing and policy
suggestion
PAGE 16
K O R E A
P I M R E F O R M A F T E R T H E F I N A N C I A L C R I S I S C O U N T R Y C A S E S T U D Y K O R E A
PIM Reform after the Financial Crisis
2 0 1 2
T H E P O W E R O F P U B L I C I N V E S T M E N T M A N A G E M E N T
criteria decision-making approach that enables user to combine quantitative and qualitative analyses into a decision through a hierarchical structure AHP is unique in providing a hierarchical framework to a complex problem by establishing majorminor factors and examining the importance of each factor through pair-wise comparison AHP enhances objectivity of decision-making by analyzing and managing the entire process of decision-making in steps and it ensures the consistency of weights derived from pair-wise comparison guaranteeing the robustness of decision-making
As a group decision support system AHP also enables the user to synthesize decisions of multiple decision makers Thus PFS team members comprising seven or eight experts from different organizations with different specialties rate the feasibility of a project through the AHP technique Diverse views on the level of feasibility are synthesized into a single score which results in a final decision on feasibility of a project
Figure x9 shows how AHP guides the synthesis of the analytical results of a project The PFS team sets the weight of each criterion through pair-wise comparison of each criterion against the others At the bottom level of the hierarchy are the two alternative judgments ldquoProject Implementationrdquo or ldquoStatus Quordquo (which means ldquoNot-Implementing the Projectrdquo) The score of the two alternatives are scaled to be summed up to 1 Hence if the Project Implementation alternative gets a score above 05 the project is evaluated as feasible
Figure X9 Structure of AHP in PFS
Overall FeasibilityOverall FeasibilityOverall FeasibilityOverall Feasibility
Economic AnalysisEconomic AnalysisBalanced Regional
Development AnalysisBalanced Regional
Development AnalysisPolicy AnalysisPolicy Analysis
Consistency with higher level planConsistency with higher level plan
Project riskProject riskProject-specific
factorProject-specific
factor
Attitu
de to
ward
the p
roje
ct
Attitu
de to
ward
the p
roje
ct
Consis
tency w
ith h
igher le
vel p
lan
Consis
tency w
ith h
igher le
vel p
lan
Pre
pare
dness
Pre
pare
dness
Pro
ject-
specific
item
(optio
nal)
Pro
ject-
specific
item
(optio
nal)
Fin
ancia
l feasib
ilityFin
ancia
l feasib
ility
Enviro
nm
enta
l impact a
ssessm
ent
Enviro
nm
enta
l impact a
ssessm
ent
Pro
ject-
specific
item
(optio
nal)
Pro
ject-
specific
item
(optio
nal)
Pro
ject-
specific
item
2
(optio
nal)
Pro
ject-
specific
item
2
(optio
nal)
Pro
ject-
specific
item
1
(optio
nal)
Pro
ject-
specific
item
1
(optio
nal)
Pro
ject-
specific
item
(optio
nal)
Pro
ject-
specific
item
(optio
nal)
Regio
nal e
conom
ic im
pacts
Regio
nal e
conom
ic im
pacts
Regio
nal b
ackw
ard
ness a
naly
sis
Regio
nal b
ackw
ard
ness a
naly
sis
Project ImplementationProject ImplementationProject Implementation Status QuoStatus QuoStatus QuoAlternativesAlternativesAlternatives
Level 1
Level 2
Level 3
PAGE 17
K O R E A
P I M R E F O R M A F T E R T H E F I N A N C I A L C R I S I S C O U N T R Y C A S E S T U D Y K O R E A
PIM Reform after the Financial Crisis
2 0 1 2
T H E P O W E R O F P U B L I C I N V E S T M E N T M A N A G E M E N T
PFS Evaluation Guidelines
PFS is based on three pillars of quality objectivity consistency and transparency In order to improve the objectivity of the evaluation and secure consistency among projects PIMAC developed evaluation guidelines PFS guidelines are detailed descriptions of methodology and procedures of PFS implementation PFS guidelines cover the following sectors roads railways ports airports dams and cultural facilities The guidelines stipulate that the same methodology is applied and the same or a similar dataset is used for different projects in the same sector For example the KT_DB (Korea Transport Database) should be used for all the road and railroad projects for consistency in evaluation results These guidelines are continuously revised through academic research The PFS guidelines for road and railroad projects in its fifth edition in 2009 provide specific procedures for assessing road projects (see box x1)
Box x1 How a Road Project Is Assessed in PFS Methodology cost-benefit analysis
x Criteria BC NPV (Net Present Value) IRR (Internal Rate of Return) x Social Discount Rate 55 percent (real term) x Duration Roads railways and seaports (30 yr) dams and water supply facilities (50 yr) x Tax is excluded but salvage value is included
Benefit of road project x Valuation of changes in route and travel speeds due to the project x Savings in travel time vehicle operation costs traffic accidents and environmental costs (air and noise
pollution) A multi-criteria decision-making approach by AHP (Analytical Hierarchy Process)
x Combines quantitative and qualitative criteria for decisions under a hierarchical structure x A group decision support system x Hierarchical structuring x Pair-wise comparison
Performance of PFS
Based on the PFS results only a project that has been assessed and meets the investment criteria can be approved and implemented Table x4 shows the number of PFS conducted from 1999 to 2009 A total of 437 projects were evaluated among which road (188 projects) and railway projects (79 projects) were dominant totals included 27 seaport projects 32 culture and tourism projects 34 water supply projects and 77 other projects Other projects included construction projects for welfare facilities airports and industrial complexs among others
PAGE 18
K O R E A
P I M R E F O R M A F T E R T H E F I N A N C I A L C R I S I S C O U N T R Y C A S E S T U D Y K O R E A
PIM Reform after the Financial Crisis
2 0 1 2
T H E P O W E R O F P U B L I C I N V E S T M E N T M A N A G E M E N T
Table x4 Number of PFS Submitted by Sector 1999ndash2009
Sector 1999 2000 2001 2002 2003 2004 2005 2006 2007 2008 2009 Sum Road 11 11 20 9 11 24 11 27 30 12 22 188
Railway 2 7 14 8 7 13 6 10 5 2 5 79
Seaport 1 5 1 2 3 1 2 5 1 4 2 27
Culture and Tourism
3 2 5 2 5 2 1 5 2 3 2 32
Water Resources
1 1 0 5 5 3 3 1 1 2 12 34
Others 1 4 1 4 2 12 7 4 7 15 20 77
Sum 19 30 41 30 33 55 30 52 46 38 63 437
Source Internal data (1999ndash2009) from PIMAC KDI
Table x5 shows the proportions of feasible projects 256 projects or 586 percent of 437 projects were evaluated as feasible The proportion of feasible projects for the road sector is 564 percent The highest rate of feasibility was for seaport projects at 778 percent and the projects in the culture and tourism sector had the lowest feasibility rate at 435 percent
Table x5 Proportion of Feasible Projects by Sector 1999ndash2009
of Submitted Projects Rated Feasible
Project Sector 1999 2000 2001 2002 2003 2004 2005 2006 2007 2008 2009 Total Projects (A)
Total Feasible Projects (B)
(B)(A) ()
Road 455 273 300 333 727 875 364 630 633 750 500 188 106 564
Railway 500 571 357 750 714 538 833 400 250 1000 800 79 44 557
Seaport 1000 800 1000 500 1000 1000 1000 400 1000 1000 500 27 21 778
Culture and tourism 1000 - 400 - - 1000 1000 400 500 1000 - 32 14 438
Water resources 1000 1000 - - 600 667 667 1000 1000 500 917 34 23 676
Others 1000 750 - 750 500 667 714 500 429 467 789 77 48 623
Average 632 500 341 433 606 745 633 538 565 684 677 437 256 586
Source Internal data (1999ndash2009) from PIMAC KDI Note mdash not applicable
Tables x6 and x7 show the results of PFS in terms of BC ratio and AHP score Until 2002 no technique was employed to combine BC ratio and the results of policy analyses Thus the overall PFS result was that a proposed project was announced as feasible or non-feasible along with the BC ratio During 1999ndash2002 nine projects were evaluated as non-feasible despite the fact that their BC ratios were greater than 1 The reasons were mostly their potential negative environmental impacts and difficulties in funding availability for local government projects On the
PAGE 19
K O R E A
P I M R E F O R M A F T E R T H E F I N A N C I A L C R I S I S C O U N T R Y C A S E S T U D Y K O R E A
PIM Reform after the Financial Crisis
2 0 1 2
T H E P O W E R O F P U B L I C I N V E S T M E N T M A N A G E M E N T
other hand 10 projects were evaluated as feasible with BC less than 1 The most important reason was a consideration of balanced regional development
Table x6 Feasiblenon-feasible Projects according to BC Ratios (1999ndash2002) Project numbers rated feasible or non-feasible
Year BC ge 1 BC lt 1
Total (A)
Feasible Non- feasible Feasible Non-
Feasible Feasible (B)
(B)(A) ()
1999 8 1 5 6 20 13 650
2000 14 3 1 12 30 15 500
2001 12 2 2 25 41 14 341
2002 11 3 2 14 30 13 433
Total ()
45 (372)
9 (74)
10 (83)
57 (471)
121 (1000) 55 455
Source Internal data (1999-2009) from PIMAC KDI
Table x7 shows the PFS results during 2003ndash09 In 2003 the AHP technique was officially employed to synthesize the economic and policy analyses From then on the PFS results were announced in terms of BC and AHP score Over that period 202 projects or 639 percent of 316 projects were evaluated and rated as feasible Five projects with BC greater than 1 received AHP scores of less than 05 and eventually were deemed non-feasible On the other hand 61 projects with BC less than 1 received AHP scores greater than 05
The PFS has contributed to enhance the fiscal efficiency of the PIM project selection process by preventing non-feasible projects from being launched During 1999ndash2009 a total of 437 PFS evaluations were conducted and the projects deemed non-feasible saved taxpayers funds that could be allocated to other uses
PAGE 20
K O R E A
P I M R E F O R M A F T E R T H E F I N A N C I A L C R I S I S C O U N T R Y C A S E S T U D Y K O R E A
PIM Reform after the Financial Crisis
2 0 1 2
T H E P O W E R O F P U B L I C I N V E S T M E N T M A N A G E M E N T
Table x7 Feasiblenon-feasible Projects according to BC Ratios and AHP Scores (2003ndash2009)
Project numbers rated feasible or non-feasible
Year BC ge 1 BC lt 1
Total (A)
AHPge 05
AHPlt 05
AHPge 05
AHPlt 05
Feasible (B)
(B)(A) ()
2003 18 0 2 13 33 20 606 2004 27 1 14 13 55 41 745 2005 15 1 4 10 30 19 633 2006 21 2 7 22 52 28 538 2007 19 0 7 20 46 26 565 2008 16 0 10 12 38 26 684 2009 25 1 17 19 62 42 677 Total ()
141 (446)
5 (16)
61 (193)
109 (345)
316 (1000) 202 639
Source Internal data (1999-2009) from PIMAC KDI
Procurement and Capital Budget Implementation Procurement and capital budget implementation on public investment programs and
projects has been managed mostly by a budget management system called the Total Project Cost Management System (TPCM) in the Ministry of Strategy and Finance TPCM aims to enhance fiscal productivity and to ensure a high quality of public construction work by properly adjusting and managing total project costs (TPC) throughout the implementation stages of a project The MOSF established the TPCM in 1994 and revises the ldquoGuidelines for Total Project Cost Managementrdquo on an annual basis
TPCM Manages PIP Construction Budgets
According to the National Finance Act the following types of construction projects are subject to the TPCM system
x Projects implemented by the Central Government or its agents or by local governments or private institutions relying on Central Government funding
x Projects with a construction period exceeding two years and
x Civil engineering projects whose TPC exceeds KRW 30 billion (USD 30 million) or architectural projects whose TPC exceeds KRW 10 billion (USD 10 million)
The TPC includes all cost items accrued throughout the life of the project including design land acquisition and construction costs regardless of whether the source of funding is the Central Government local governments or private institutions
Project costs should be managed by construction phase and by construction unit in reference to total construction cost The construction costs are not arbitrarily interchangeable between project
PAGE 21
K O R E A
P I M R E F O R M A F T E R T H E F I N A N C I A L C R I S I S C O U N T R Y C A S E S T U D Y K O R E A
PIM Reform after the Financial Crisis
2 0 1 2
T H E P O W E R O F P U B L I C I N V E S T M E N T M A N A G E M E N T
phases or between construction units When increases in construction size or costs are expected and even inevitable the minister in charge of the project must consult with the MOSF about adjusting the TPC
TPCM by Project Phase
The TPCM guidelines of the MOSF describe in detail how the rules and regulations of project management are carried out by project phase
Project conception phase The minister in charge of the project should make an appropriate estimate of the total cost and duration of the project and ask the MOSF for a PFS if the estimated total cost in the project conception phase is KRW 50 billion or more For local government projects the minister in charge should ask MOSF for a PFS if the funding of the project relies on a Central Government subsidy of KRW 30 billion or more
Phases of PFS and a (detailed) feasibility study The minister in charge should report on the project size TPC and project duration to MOSF for all the projects that have been evaluated as feasible by PFS and should ensure that the budget is drawn up by the end of January Detailed feasibility studies should cover the life cycle cost of the projects resulting from all technological environmental social and financial aspects as well as from land acquisition
Draft design phase The project management should ensure that enough money and time is spent on the draft design to prevent significant and frequent design modifications in the following construction phases The design team should collect various opinions from target citizens interests groups and related government authorities in order to minimize public discontent expected in the construction phase The minister in charge should consult value-engineering (VE) experts at least once before the end of this phase to prevent overestimation of costs and excessive construction
Blueprint design phase Size of the construction should not be modified significantly in this phase When it appears that a design modification or change in construction size is inevitable the minister in charge should discuss the matter with the MOSF The minister should also consult value-engineering experts at least once before the end of this phase to prevent overestimation of costs and excessive construction
Contracting phase MOSF informs the Administer of the Office of Supply Administration of the total construction cost after discussing it with the minister in charge When the contract cost exceeds the informed cost the Administer of the Office of Supply Administration should discuss the matter with the Minister of Strategy and Finance
Construction phase The minister in charge should try to minimize cost increases except when new construction techniques or new equipments are to be introduced to enhance the quality of the product substantially When an increase in costs change in construction size or change in construction duration are inevitable the minister in charge should submit a written explanation and discuss it with the Minister of Strategy and Finance
PAGE 22
K O R E A
P I M R E F O R M A F T E R T H E F I N A N C I A L C R I S I S C O U N T R Y C A S E S T U D Y K O R E A
PIM Reform after the Financial Crisis
2 0 1 2
T H E P O W E R O F P U B L I C I N V E S T M E N T M A N A G E M E N T
The line ministry is allowed to set construction contingencies for up to 8 percent of the contract price of a project to cope with inevitable design modification and amendment of the law and so on The line ministry can use its own discretion to change the TPC within the limit of these contingencies Contingencies apply only to the construction phase of a project
In general an increase in construction size through design modification is not allowed except for inevitable cases The base cost for a TPCM system is the contract cost determined by bidding not the cost estimate at design phase ldquoThe indicator adjustment formulardquo set by the Office of Supply Administration is applied to recalculate project costs incorporating inflationary effects
When a project under implementation violates the TPCM guidelines the Minister of Strategy and Finance can cut off or withhold budget allocation for the project The minister in charge can impose sanctions prohibiting invitation to tendering of construction projects on design teams when their work has resulted in a substantial cost increase due to unsatisfactory performance or when they intentionally or unintentionally fail to estimate the appropriate construction costs or sizes The minister in charge can petition the Minister of Strategy and Finance for changes in costs and project duration at any time through the Budget Information Management System when necessary
Reassessment Study of Feasibility and Reassessment of Demand Forecast
The Reassessment Study of Feasibility (RSF) aims to check unnecessary cost increases by re-affirming the feasibility of projects under implementation and scrutinizing the adequacy of the cost increase The MOSF conducts the RSF on a project if the PFS has not been conducted although it falls under the PFS coverage or if the TPC has increased by more than 20 percent (excluding inflationary effects and increase in land acquisition cost) of the cost confirmed by the Minister of Strategy and Finance at the previous phase of the project Also according to the amendment of the National Finance Act in 2009 the Board of Audit and Inspection is entitled to request that the MOSF conduct an RSF if there is a need
The line ministries conduct the RSF on a project with miscellaneous changes in construction costs and report it to the Minister of Strategy and Finance The RSF guidelines suggest that the RSF should include but should not be limited to the following components
x Outline of a project
x Analysis of background data and project issue raised
x Analysis on adequacy of the plan including size of the project
x Economic analysis including cost-benefit analysis
x Policy analysis
x Overall assessment including judgment on whether or not to continue a project and if the TPC increase is adequate
Based on these analyses the RSF team makes an overall assessment including a judgment as to whether or not to continue a project and if the TPC increase is adequate While the PFS focuses
PAGE 23
K O R E A
P I M R E F O R M A F T E R T H E F I N A N C I A L C R I S I S C O U N T R Y C A S E S T U D Y K O R E A
PIM Reform after the Financial Crisis
2 0 1 2
T H E P O W E R O F P U B L I C I N V E S T M E N T M A N A G E M E N T
on evaluating the feasibility of a project RSF puts relatively more emphasis on finding alternatives to cut down the size and cost of a project The MOSF reflects the RSF results in adjusting the TPC When the RSF results show that a project has turned out to be unfeasible the RSF team works on curtailing project size with the intent of improvinh its feasibility When no alternative way to secure the feasibility of the project is found the MOSF decides whether to stop implementing the project
Reassessment of demand forecast (RDF) is a device that verifies the adequacy of the demand forecast for a public investment project conducted in the past with the latest information By minimizing inevitable forecasting error RDF aims to improve the efficiency of expenditure and to prevent squandering of financial resources by managing demand fluctuation of large-scale long-term infrastructure projects throughout the phases of a project
The transportation facilities including roads rail airports and ports that are subject to TPCM are also subject to RDF if required The RDF is to be conducted during any of the following phases when the requirements for the reassessment are met (1) before or during completion of the basic plan or feasibility study (2) before or during completion of draft design (3) before or during completion of detailed design (4) during the construction period andor (5) when it is deemed necessary by the Minister of Strategy and Finance or the head of Central Government agency either of whom may request a RDF before or during a feasibility study or design development
The RDF shall be conducted when there are substantial changes in demand forecasts as stipulated in the following (1) when the RDF is deemed necessary because a significant decrease of demand is anticipated due to material changes in the premises on which previous demand forecasts had been made or errors had been made during implementing the methodology for demand forecasts (2) when the RDF is deemed necessary because a project has been converted to a PPP project from a conventional government procured project (3) when more than five years have passed since the latest demand forecast had been conducted andor (4) when it is deemed necessary by the Minister of Strategy and Finance or the head of line ministry
The RDF virtually belongs to the MOSF In order to ensure objectivity and transparency during the RDF process the Minister of MOSF or the minister of the line ministry responsible for the RDF may contract a specialized institution(s) to conduct the RDF When the RDF is completed the Minister of MOSF notifies the minister of line ministries of the results When it is identified that the demand forecast for a project has decreased by 30 percent or more however the MOSF begins RSF and notifies the minister of line ministries in accordance with RSF guidelines
Performance of TPCM RSF and RDF
Table x8 shows the total number of Total Project Cost Management System (TPCM) projects and the projects in which the total project costs (TPC) were adjusted during 1994ndash2005 The total number of TPCM projects increased sharply in 1999 when the PIM system was established in a rigorous way The proportion of projects for which TPC were required shows an increase from 540 percent in 2002 to 718 percent in 2005 However the percentage of projects for
PAGE 24
K O R E A
P I M R E F O R M A F T E R T H E F I N A N C I A L C R I S I S C O U N T R Y C A S E S T U D Y K O R E A
PIM Reform after the Financial Crisis
2 0 1 2
T H E P O W E R O F P U B L I C I N V E S T M E N T M A N A G E M E N T
which the TPC rose by more than substantially decreased from 119 percent in 1996 to 37 percent in 2004
Table x8 Number of Projects with Substantial Change in TPC
Year No Projects under PCM (A)
No Projects that TPC adjusted (B)
BA() No Showing Increase in TPC by over 20 (C)
(C)(A) ()
1994 218 - -
1995 207 19 92
1996 159 19 119
1997 189 20 106
1998 183 17 93
1999 459 15 33
2000 483 24 50
2001 602 26 43
2002 602 325 540 10 17
2003 667 392 587 15 22
2004 698 493 706 26 37
2005 760 546 718
Source Internal data from the Ministry of Strategy and Finance
Table x9 shows that line ministries in charge of the projects requested an increase of KRW 196 trillion and about half (495 percent) of the requested amount (KRW 097 trillion) was adjusted into the TPC While 957 percent of requests for TPC increase due to miscellaneous design change were accepted by the MOSF only 432 percent of requests due to substantial design change were adjusted into the TPC
Table x9 Sources of in Total Project Cost Adjustment
Value of miscellaneous design changes KRW billions
Value of substantial design changes KRW billions Sum KRW billions
Request for TPC increase (A) 2331 17320 19651 Projects that TPC adjusted (B) 2253 7480 9733 (B)(A) () 967 432 495 Source Internal data from the Ministry of Strategy and Finance
Note Miscellaneous design changes include changes due to factors of traffic safety and unexpected ground conditions substantial design changes include changes in route change in type of bridges and tunnels and an increase in quantity to incorporate request by local government or local citizens
PAGE 25
K O R E A
P I M R E F O R M A F T E R T H E F I N A N C I A L C R I S I S C O U N T R Y C A S E S T U D Y K O R E A
PIM Reform after the Financial Crisis
2 0 1 2
T H E P O W E R O F P U B L I C I N V E S T M E N T M A N A G E M E N T
Table x10 shows the trend of requests for TPC increase in terms of percentage of TPC During 1996ndash99 the line ministries requested an increase of 264 percent of TPC and 421 percent of the requested amount was adjusted into the TPC During 2000ndash03 however the requests dropped to as low as 44 percent of TPC and the acceptance rate also decreased to 227 percent
Table x10 Trend of Requests for TPC Increase
TPC Increase requested
1996ndash99 2000ndash03
Request for TPC increase (A) 264 44
TPC adjusted (B) 111 10
(B)(A) () 421 227
Source Internal data from the Ministry of Strategy and Finance
Table x11 shows the number of RSF studies conducted by sector during 2003ndash09 Road projects take up the largest share in the sectoral distribution of RSF The RSFs on buildings (museums and tourism) takes up 177 percent in terms of the total number of RSFs conducted
Table x11 Number of RSF by Sector 2003ndash09
2003 2004 2005 2006 2007 2008 2009 Sum
Road 2 2 6 10(2) 9(1) 9(3) 28(7) 66
Railway 0 1(1) 0 0 2(1) 2 1 6
Port 0 0 0 0 3 2 3 8 Buildings (museums and tourism) 2 3 3 4 1 6(2) 1 20
Water resources (dam) 0 0 0 5 0 1 2 8
ITRampD 0 0 0 0 0 0 1(1) 1
Others 0 0 0 1 3 0 0 4
Total 4 6(1) 9 20(2) 18(2) 20(5) 36(8) 113(18)
Source Internal data from the Ministry of Strategy and Finance
Out of 113 projects 18 were suspended as a result of RSF evaluations The results show higher percentages of feasible projects relative to PFS because while PFS focuses on evaluating the feasibility of a project RSF puts relatively more emphasis on finding alternatives to cut down the size or cost of a project
Table x12 shows the change in TPC by RSF The sum of initial TPC for projects conducted in 2003ndash09 was KRW 273 trillion and the line ministries requested a total of KRW 424 trillion So the RSF results suggested adjusting the total TPC to 347 trillion implying that KRW 77 trillion or 181 of TPC requested were cut through the RSF
PAGE 26
K O R E A
P I M R E F O R M A F T E R T H E F I N A N C I A L C R I S I S C O U N T R Y C A S E S T U D Y K O R E A
PIM Reform after the Financial Crisis
2 0 1 2
T H E P O W E R O F P U B L I C I N V E S T M E N T M A N A G E M E N T
Table x12 Results of RSF (change in total project costs KRW billions)
Initial TPC (A) TPC requested (B)
TPC by RSF (C)
(D) =(C)-(B)
(D)(B) ()
2003 1587 6137 5491 ndash646 ndash105
2004 291 711 613 ndash97 ndash136
2005 842 1511 1039 ndash472 ndash313
2006 3954 6826 3788 ndash3039 ndash445
2007 4141 4801 4040 ndash761 ndash159
2008 10569 13579 11998 ndash1581 ndash116
2009 5936 8859 7762 ndash1097 ndash124
Total 27320 42424 34731 ndash7693 ndash181
Source Internal data from the Ministry of Strategy and Finance
Until 2009 only two RDFs have been conducted since the RDF was introduced in 2006 the fourth section of the Hamyang-Ulsan Expressway and Kyungin Cannel project Based on the results of RDFs the MOSF decided to reduce the total cost limits on both projects
Performance Management and Evaluation of Completed Projects Three-tier systems of performance management and evaluation of completed projects were
simultaneously introduced within the Ministry of Strategy and Finance (1) Performance Monitoring System (2) S elf-Assessment System and (3) In-Depth Evaluation System Table x13 explains the main features of these systems
PAGE 27
K O R E A
P I M R E F O R M A F T E R T H E F I N A N C I A L C R I S I S C O U N T R Y C A S E S T U D Y K O R E A
PIM Reform after the Financial Crisis
2 0 1 2
T H E P O W E R O F P U B L I C I N V E S T M E N T M A N A G E M E N T
Table x13 Systems of Performance Management and Evaluation
Performance Monitoring Self-Assessment In-Depth Evaluation
Method
Establish objectives and indicators and use the results in government budget operation (Prepare performance report)
Provide a check list of projects for review and keep track of which projects are operated properly and which are making progress and so on
Apply scientific evaluation methods to each project to analyze spot problems and provide an alternative (Prepare evaluation report)
Main responsible body
Each ministry (Budget Division) Each Ministry (Budget division) and budget authority
Each Ministry (Project Management Division)
Applicable project
All policies and programs 20ndash30 of all Individual programs and projects
Merits
An overall progress report can be completed but not enough information can be given on individual project basis
Trade-off between Performance Monitoring and Program Evaluation
Detailed information can be given on an individual project basis but due to excessive time and costs this method is not suitable for all projects
Application
Used in management of performance of an organiza-tion as reference material for setting budget and in preparation of performance budget report
Used in improvement of project operating method and as (deliberation) reference for setting budget
Used in improvement of project operating method
Source Ministry of Strategy and Finance
Performance Monitoring System
The Performance Monitoring System (PMS) which started in the spring of 2003 requires line ministries to set up performance goals and indicators prepare annual performance plans and performance reports and submit them to the MOSF at the start of the annual budget cycle The MOSF is in charge of ensuring the system is in place by examining the status of PMS in line ministries coordinating the implementation and feeding the results back to resource allocation
PMS covers only part of the ministriesrsquo investment programs as those activities not involving large sums of expenditure (such as pure policy-making) are excluded from performance monitoring In addition activities for which the benefits of performance monitoring are expected to be small (such as wages and salaries ldquobasic programrdquo expenditures10 and general administrative expenses) are excluded as well
A performance report describes in a systematic way the degree to which program goals have been met It should list performance goals and indicators as originally set out in the performance plan describe the level of performance in terms of these goals and indicators explain the reasons for any poor performance summarize the assessment and describe future plans Optionally it can include audit results by the Board of Audit and Inspection and summarize findings of program evaluations
PAGE 28
K O R E A
P I M R E F O R M A F T E R T H E F I N A N C I A L C R I S I S C O U N T R Y C A S E S T U D Y K O R E A
PIM Reform after the Financial Crisis
2 0 1 2
T H E P O W E R O F P U B L I C I N V E S T M E N T M A N A G E M E N T
PMS will provide one source of information for budget allocation across sectors and programs Line ministries should present performance information when requesting budgets and the MOSF will utilize it when preparing the medium term National Fiscal Management Plan and drafting the budget
The PMS like its pilot project has not been very successful so far It received only lukewarm support from the top management in the MOSF Line ministries also showed little enthusiasm for the PMS In most cases performance indicators prepared by line ministries were not derived from ministerial missions in a systematic fashion Most importantly performance reports were not open to the public giving little incentive for line ministries to think seriously about the exercise
Program Review System Self-Assessment of Budgetary Programs
The Program Review System for Self-Assessment of Budgetary Programs (SABP) was introduced in 2005 by the MOSF to enhance links between performance evaluation and budget allocation It was designed after the Program Assessment Rating Tool (PART) of the US Government This program requires line ministries to assess their own programs with spending levels above a certain threshold The assessment was intended to cover all ministerial programs in a cycle of three years The assessment is based on 14 questions common to all types of programs and a few additional questions specific to different types of programs11 Table x14 shows the contents of checklist for the SABP
Table x14 Contents of Checklist for the SABP
Classification ( points weight of rating) Checklists
Design and planning (30)
y Program purpose y Rationale for government spending y Duplication with other programs y Efficiency of program design y Relevance of performance objectives and indicators y Relevance of performance targets
Management (20)
y Monitoring efforts y Obstacles of program implementation y Implementation as planned y Efficiency improvement or budget saving
Results and accountability (50)
y Independent program evaluation y Results y Satisfaction of citizens y Utilization of evaluation results
Source Park (2008)
A pilot SABP for government-financed projects was introduced in 2005 with input from various ministries and experts and a guideline for SABP was then distributed to each ministry Each ministry was to execute a self-evaluation and submit the results to the MOSF within two
PAGE 29
K O R E A
P I M R E F O R M A F T E R T H E F I N A N C I A L C R I S I S C O U N T R Y C A S E S T U D Y K O R E A
PIM Reform after the Financial Crisis
2 0 1 2
T H E P O W E R O F P U B L I C I N V E S T M E N T M A N A G E M E N T
months The evaluation took place within 40 departments of the relevant ministries for 555 projects budgeted at a total of KRW 35 trillion in project costs While the MOSF reviewed the results the relevant ministries were allowed to submit any questions or objections at two different intervals and these were reviewed again
The results of the SABP for 2005ndash07 are shown in figure x10 During the period a total of 1716 sub-programs were assessed for performance in fiscal years 2004 2005 and 2006 The figure shows the distribution of the total scores across the programs In 2005 the proportion of sub-programs in different departments in the ministries that were rated as ineffective was 157 percent and 52 percent of the programs were rated as effective The distribution of sub-program ratings did not change much between 2005 and 2006 but it improved in 2007 The proportion of ineffective programs dropped to 5 percent and that of effective sub-programs doubled This change in sub-program ratings in 2007 is attributed to the improvement of sub-program performance and agencies learning from a couple of yearsrsquo experience with SABP
Figure x10 Result of Self-Assessment of Budgetary Programs 2005ndash07 of total ratings
Source Park (2008)
Table x15 explains the linkage between SABP results and budget allocation in 2007 The programs rated as ineffective went through a 53 percent budget cut compared to the 2006 budget The main reason for this linkage between SABP results and budget allocation is that MOSF encouraged ministries to make use of assessment results in their budget requests announcing that a 10 percent of budget cut would be imposed on the programs rated as ineffective
PAGE 30
K O R E A
P I M R E F O R M A F T E R T H E F I N A N C I A L C R I S I S C O U N T R Y C A S E S T U D Y K O R E A
PIM Reform after the Financial Crisis
2 0 1 2
T H E P O W E R O F P U B L I C I N V E S T M E N T M A N A G E M E N T
Table x15 Linkage between SABP results and Budget Allocation 2007 KRW millions
2006 Budget
(A)
2007 Budget
(B) (B)-(A)
(B-A)(A)
()
Effective 889 887 -2 ndash02
Moderately Effective 3316 3565 249 75
Adequate 29718 28997 -721 ndash24
Ineffective 1143 538 ndash605 ndash529
Total 35066 33987
Source Park (2008)
Program Evaluation System In-Depth Evaluation Program
Under the current legal and administrative framework two methods of performance evaluation of public infrastructure investment are available One is performance evaluation as stipulated by the Enforcement Decree of Construction Technology Management Act The other one is In-depth Evaluation of Budgetary Programs (IEBP) under the Performance Management System12 IEBP analyzes the different factors that at different stages contribute to the performance of a government program by using scientific and systematic techniques The IEBP results are applied to improve and reform the system of operating programs
The Enforcement Decree of the Act requires the spending agency to file a performance evaluation report for construction projects whose total costs are KRW 50 billion or more In accordance with the Act MLTM established ldquoGuidelines for Performance Evaluations of Construction Projectsrdquo effective as of 2001 The guidelines outline the necessary details including the timing and methodologies for conducting performance evaluations required by government agencies These guidelines suggest that the performance evaluations be based on the Design and Implementation Evaluation Report and the Project Completion Report while comprehensively referring to all related materials including the (Pre-feasibility) Feasibility Study results
Despite the stipulation of the Enforcement Decree of the Construction Technology Management Act that requires the spending agency to file a performance evaluation report within three years of completion only a small number of performance evaluations were conducted until 2009 One reason is that there was no sanction against violation of the decrees thus the spending agencies have no incentive to implement these self-evaluations To draw lessons learned through the evaluation it is necessary to find some problems during the implementation process of the project The line ministry which is supposed to coordinate the evaluation did not take an active interest in this new system The other reason for slow progress in performance evaluation is that no clear framework for evaluation had been established A performance evaluation tracks whether a project or program achieves its objectives and secures the expected outcome The basic questions to be determined are what and how to evaluate However many projects have no clear concept of performance to be achieved by public investment For example many road construction projects under the national highway system have been regarded as just ldquonaturalrdquo It is not rare to find a statement of purpose for a road construction project that requires more than hundreds of billions
PAGE 31
K O R E A
P I M R E F O R M A F T E R T H E F I N A N C I A L C R I S I S C O U N T R Y C A S E S T U D Y K O R E A
PIM Reform after the Financial Crisis
2 0 1 2
T H E P O W E R O F P U B L I C I N V E S T M E N T M A N A G E M E N T
of KWS written in a single line ldquoTo relieve traffic congestionrdquo Since the basic concept of performance evaluations is to assess whether a project or a program achieves its objectives unless there is a clear target for a project or a program any assessment is going to be difficult
Under IEBP from 2005 to 2009 a total of 45 programs were evaluated initiated and controlled by the MOSF team With a wide coverage of areas for IEBP programs the MOSF seemingly tended to distribute the programs relatively evenly across line ministries Budgetary size was not considered as an essential criterion since half of the selected programs had an annual budget of less than KRW 100 billion The period of program implementation varies from program to program half of the programs had been in operation from four to ten years before being evaluated Although in principle IEBP was established for a single program eight programs containing three or more unit programs had been evaluated
IEBP still has a lot of trouble with implementing and feeding back results Since the availability of its database was strictly limited only 20 percent of the evaluation studies were subject to empirical analysis Data for evaluation analysis often does not exist and even when it does government officials in line ministries and agencies have given little attention to it The selection process for each IEBP has sometimes proved to be a tricky process since different purposes and approaches were taken by the MOSF and line ministries
Lessons Learned and Challenges Ahead The period after the economic crisis in 1997 witnessed many reform efforts intended to
enhance efficiency and transparency in developing and managing public infrastructure investment programs in Korea The MOSF has played a leading role in implementing an effective appraisal and evaluation system tightening the expenditure monitoring of total project cost and introducing a new budgeting system called the Medium Term Expenditure Framework (MTEF) In the past line ministries had ownership of the feasibility study process while the finance ministry used it to cut project budgets although not always on a reasonable basis With the reforms MOSF now makes the final decision on the project appraisal and determines the budget for it while the line ministries are responsible for identifying designing prioritizing and forecasting the effects of the project MOSF established a separate PIM Department responsible for the PIM reforms of PFS TPCM and RSF and these systems now mitigate information asymmetry between the finance ministry and line ministries and lead to better decision-making
The preliminary feasibility study (PFS) begun in 1999 and independently conducted mainly by the PIMAC at KDI seems to have been successful in handling the pass-or-fail hurdle of the project selection process An independent review of PFS by PIMAC used some help from policy analysts to make judgments on project desirability and their judgments were respected in most Government decision-making If policy analysis played merely a symbolic role and politicians and bureaucrats had disincentives to use this policy analysis such an independent judgment could not be made
PAGE 32
K O R E A
P I M R E F O R M A F T E R T H E F I N A N C I A L C R I S I S C O U N T R Y C A S E S T U D Y K O R E A
PIM Reform after the Financial Crisis
2 0 1 2
T H E P O W E R O F P U B L I C I N V E S T M E N T M A N A G E M E N T
The total project cost management system (TPCM) strengthened after the crisis appears to be working satisfactorily by limiting the frequency and amount of TPC increases in line ministries A reassessment study of feasibility (RSF) has been introduced as an innovative tool to control the total project cost limit in the middle of TPCM although there have been a few projects cancelled by RSF However the introduction of the performance monitoring and evaluation system is still lagging behind in Korea A greater emphasis on program evaluation is needed Once the Government adopts a performance orientation it can then encourage a greater use of performance contracts
Initiation of PFS in 1999 was a first step in the reform of PIM system in Korea which gave the Government the impetus to produce an effective sequencing of reforms in parallel with the project cycles with RSF and RDF coming later and then implementing performance evaluation last In order to improve the objectivity of the evaluation and secure consistency among projects standard evaluation and decision-making guidelines and manuals have been developed and published by the MOSF and PIMAC Sector guidelines and manuals in line ministries apply the same methodology and use the same or similar datasets for different projects in the same sector
The new PIM process and its capital budgeting has rooms for improvement The capacity for planning and prioritizing public investment programs in line ministries should be enhanced The planning and budget divisions of individual line ministries should play a greater role in the coordination of ministerial policies and budget requests unlike in previous years when they would simply compile budget requests from program divisions and send them to the MOSF with little modification The role of the MOSF should be changed as well As a central coordinator of government policies the MOSF should strengthen its capacity for policy analysis and long-term forecasts It should put less stress on input control and pay more attention to outputs and outcomes
PAGE 33
K O R E A
P I M R E F O R M A F T E R T H E F I N A N C I A L C R I S I S C O U N T R Y C A S E S T U D Y K O R E A
PIM Reform after the Financial Crisis
2 0 1 2
T H E P O W E R O F P U B L I C I N V E S T M E N T M A N A G E M E N T
Notes 1 Other social insurance programsmdashIndustrial Accident Insurance (1964) National Pension
(1988) and Employment Insurance (1995)mdashwere introduced and expanded in a similar fashion but their impact on total spending has been rather limited until recently
2 1 Examples include the West Coast Expressway Seoul-Busan High-speed Railroad and Incheon International Airport Even though such infrastructure investment takes the lionrsquos share of the spending on economic affairs it should be noted that the latter also includes subsidies to producers (farmers small and medium-sized enterprises and so on) and other possibly unproductive spending
3 1 von Hagen and Harden (1996) described two approaches to budgeting Under a target-based approach the Government collectively negotiates a set of binding numerical targets for the budget The budget process starts with negotiations among concerned parties over binding limits on the spending total or budget deficits Once these limits have been agreed upon they must be observed during the remainder of the budget process On the other hand under a strategic dominance-based approach the budget process vests the budget authorities with special strategic powers
4 1 In front-loading exercises the MOSF would allocate more funds than usual to the first half of the year and urge line ministries to spend the allocated funds as early as possible When necessary that is when growth is slower than expected despite front-loading the MOSF would consider introducing supplementary funds in the latter half of the year
5 5Potter and Diamond (1999) Schiavo-Campo and Tommasi (1999) and World Bank (1998) provide a useful guide on the reform in this direction
6 1 Ceilings are set for 14 spending areas such as social infrastructure agriculture education and environment then disaggregated into 56 programs for example social infrastructure has seven programs including roads railways subways ports airports housing and water resources Separate ceilings are also set within each program for the general account and various special accounts and funds
7 The former body of MPB was the Board of Planning and Budget which merged with the Office of National Budget to create MPB in May 1999 Subsequently merging with the Ministry of Finance and Economy the MPB became the MOSF in 2008
8 In January 2005 the Government of Korea passed an amendment to the 1999 Act on Private Participation in Infrastructure establishing the Public and Private Infrastructure Investment Management Center (PIMAC) as a new unit PIMAC is a merger between Private Infrastructure Investment Center of Korea (PICKO) of Korea Research Institute for Human Settlements established in 1999 and PIMA of KDI
9 The hierarchy of the legal framework in Korea is as follows ConstitutionndashActndashEnforcement DecreesndashMinisterial Ordinance
10 In Korea programs with small and recurrent costs are designated as ldquobasic programsrdquo after negotiation between line ministries and the MOSF Others are designated as ldquomajor programsrdquo
11 Types of programs are infrastructure investment procurement of large-scale facilities and equipment provision of direct services capital injection subsidies to private entities grants to local governments and RampD
PAGE 34
K O R E A
P I M R E F O R M A F T E R T H E F I N A N C I A L C R I S I S C O U N T R Y C A S E S T U D Y K O R E A
PIM Reform after the Financial Crisis
2 0 1 2
T H E P O W E R O F P U B L I C I N V E S T M E N T M A N A G E M E N T
12 As was pointed out Korea introduced the three-tier system for performance management and evaluation of budgetary programs performance monitoring program review and program evaluation IEBP is a core part of program evaluation
Bibliography Bank of Korea (var years) ldquoDatabase on Flow of Funds Accountsrdquo Bank of Korea Seoul
Kim Jay-Hyung 2003 Developing a Performance Evaluation System in Korea Edited by Chae-hyong
Kim Jay-Hyung 2012 ldquoPublic Investment Management Reform in Korea Efforts for Enhancing Efficiency and Sustainability of Public Expenditurerdquo Korea Development Institute
Kim and Hanguk Kaebal Yonguwon Seoul Korea Korea Development Institute
Koh Youngsun 2005 ldquoReforming the Fiscal Management System in Koreardquo Working paper Korea Development Institute Seoul Korea
Korea Development Institute 2004 The Standard Guideline for Preliminary Feasibility Studies on Road and Railway Projects 4th ed (in Korean) Seoul Korea Korea Development Institute
Ministry of Planning and Budget Korea 2007a ldquoGuidelines for Preliminary Feasibility Study Systemrdquo (in Korean) MOPB Government of Korea Seoul
Ministry of Planning and Budget Korea 2007b ldquoGuidelines for Total Project Cost Management Systemrdquo (in Korean) MOPB Government of Korea Seoul
MOCT (Ministry of Construction and Transportation Korea 1999 ldquoComprehensive Plan for Public Investment Budget Savingsrdquo(in Korean) MOCT Government of Korea Seoul
MOSF (Korea Ministry of Strategy and Finance) Government Finance Statistics in Korea various issues MOSF Government of Korea Seoul
MOSF (Korea Ministry of Strategy and Finance) various years National Statement for Current Bonds respective year MOSF Government of Korea Seoul
mdashmdashmdash various years National Statement for Current Bonds respective year MOSF Government of Korea Seoul
National Assembly Budget Office Korea 2004 ldquoSome Points at Issue in Preliminary Feasibility Study and Its Future Directionrdquo (in Korean) [[]] Government of Korea Seoul
OECD (Organisation for Economic Co-operation and Development) Various years Economic Surveys Korea Paris OECD
Perrin Burt 2002 ldquoImplementing the Vision Addressing Challenges to Results-focused Management and Budgetingrdquo Paris OECD
PAGE 35
K O R E A
P I M R E F O R M A F T E R T H E F I N A N C I A L C R I S I S C O U N T R Y C A S E S T U D Y K O R E A
PIM Reform after the Financial Crisis
2 0 1 2
T H E P O W E R O F P U B L I C I N V E S T M E N T M A N A G E M E N T
Park Nowook 2008 ldquoPerformance-oriented Budgeting in Korea Evidence and Lessonsrdquo Korea Institute of Public Finance Seoul
Potter Barry H and Jack Diamond 1999 Guidelines for Public Expenditure Management Washington DC International Monetary Fund
Schiavo-Campo Salvatore and Daniel Tommasi 1999 Managing Government Expenditure Manila Asia Development Bank
von Hagen Jurgen and Ian Harden 1996 ldquoBudget Processes and Commitment to Fiscal Disciplinerdquo IMF Working Paper WP9678 International Monetary Fund Washington DC
World Bank 1998 Public Expenditure Management Handbook Washington DC World Bank
2004 The General Guideline for Preliminary Feasibility Studies 4th ed (in Korean) Seoul Korea Korea Development Institute
mdashmdashmdash various years Korea Consolidated Fiscal Balance MOSF Government of Korea Seoul
mdashmdashmdash 2005a Annex to Summary of 2005 Budget MOSF Government of Korea Seoul
mdashmdashmdash 2005b Performance Management Handbook MOSF Government of Korea Seoul
World Bank 2003 ldquoWorld Development Indicatorsrdquo World Bank Washington DC
1 Other social insurance programsmdashIndustrial Accident Insurance (1964) National Pension (1988) and Employment Insurance (1995)mdashwere introduced and expanded in a similar fashion but their impact on total spending has been rather limited until recently
2 Examples include the West Coast Expressway Seoul-Busan High-speed Railroad and Incheon International Airport Even though such infrastructure investment takes the lionrsquos share of the spending on economic affairs it should be noted that the latter also includes subsidies to producers (farmers small and medium-sized enterprises and so on) and other possibly unproductive spending
3 von Hagen and Harden (1996) described two approaches to budgeting Under a target-based approach the Government collectively negotiates a set of binding numerical targets for the budget The budget process starts with negotiations among concerned parties over binding limits on the spending total or budget deficits Once these limits have been agreed upon they must be observed during the remainder of the budget process On the other hand under a strategic dominance-based approach the budget process vests the budget authorities with special strategic powers
4 In front-loading exercises the MOSF would allocate more funds than usual to the first half of the year and urge line ministries to spend the allocated funds as early as possible When necessary that is when growth is slower than expected despite front-loading the MOSF would consider introducing supplementary funds in the latter half of the year
5Potter and Diamond (1999) Schiavo-Campo and Tommasi (1999) and World Bank (1998) provide a useful guide on the reform in this direction
6 Ceilings are set for 14 spending areas such as social infrastructure agriculture education and environment then disaggregated into 56 programs for example social infrastructure has seven programs including roads railways subways ports airports housing and water resources Separate ceilings are also set within each program for the general account and various special accounts and funds
7 The former body of MPB was the Board of Planning and Budget which merged with the Office of National Budget to create MPB in May 1999 Subsequently merging with the Ministry of Finance and Economy the MPB became the MOSF in 2008
8 In January 2005 the Government of Korea passed an amendment to the 1999 Act on Private Participation in Infrastructure establishing the Public and Private Infrastructure Investment Management Center (PIMAC) as a new unit PIMAC is a merger between Private Infrastructure Investment Center of Korea (PICKO) of Korea Research Institute for Human Settlements established in 1999 and PIMA of KDI
9The hierarchy of the legal framework in Korea is as follows ConstitutionndashActndashEnforcement DecreesndashMinisterial Ordinance
10 In Korea programs with small and recurrent costs are designated as ldquobasic programsrdquo after negotiation between line ministries and the MOSF Others are designated as ldquomajor programsrdquo
PAGE 36
K O R E A
P I M R E F O R M A F T E R T H E F I N A N C I A L C R I S I S C O U N T R Y C A S E S T U D Y K O R E A
PIM Reform after the Financial Crisis
2 0 1 2
T H E P O W E R O F P U B L I C I N V E S T M E N T M A N A G E M E N T
11 Types of programs are infrastructure investment procurement of large-scale facilities and equipment provision of direct services capital injection subsidies to private entities grants to local governments and RampD
12 As was pointed out Korea introduced the three-tier system for performance management and evaluation of budgetary programs performance monitoring program review and program evaluation IEBP is a core part of program evaluation

PAGE 5
K O R E A
P I M R E F O R M A F T E R T H E F I N A N C I A L C R I S I S C O U N T R Y C A S E S T U D Y K O R E A
PIM Reform after the Financial Crisis
2 0 1 2
T H E P O W E R O F P U B L I C I N V E S T M E N T M A N A G E M E N T
Tables Table x1 Consolidated Fiscal Expenditure and Net Lending by Central Government by Function 3 ( of total) 3 Table x2 Trend of Facility Stock by Transport Sector 4 Table x3 Major Players in Korearsquos Budget Process 8 Table x4 Number of PFS Submitted by Sector 1999ndash2009 18 Table x5 Proportion of Feasible Projects by Sector 1999ndash2009 18 Table x6 Feasiblenon-feasible Projects according to BC Ratios (1999ndash2002) 19 Table x7 Feasiblenon-feasible Projects according to BC Ratios and AHP Scores (2003ndash2009) 20 Table x8 Number of Projects with Substantial Change in TPC 24 Table x9 Sources of in Total Project Cost Adjustment 24 Table x10 Trend of Requests for TPC Increase 25 Table x11 Number of RSF by Sector 2003ndash09 25 Table x12 Results of RSF (change in total project costs KRW billions) 25 Table x13 Systems of Performance Management and Evaluation 27 Table x14 Contents of Checklist for the SABP 28 Table x15 Linkage between SABP results and Budget Allocation 2007 KRW millions 30
PAGE 1
K O R E A
P I M R E F O R M A F T E R T H E F I N A N C I A L C R I S I S C O U N T R Y C A S E S T U D Y K O R E A
PIM Reform after the Financial Crisis
2 0 1 2
T H E P O W E R O F P U B L I C I N V E S T M E N T M A N A G E M E N T
The financial crisis that hit the Republic of Korea (ldquoKoreardquo) in the second half of 1997 had a devastating impact on its economy causing the worst recession since the Korean War era To address the fundamental causes of the crisis and revitalize the economy the Korean Government took bold decisive steps to initiate comprehensive structural reforms The major focus of reform in the fiscal and public sector was to adopt a market-oriented focus and managerial strategies to increase efficiency and transparency The Government endeavored to instill a performance-oriented approach in the system which implies management of public expenditure based on the principle of value for money
In the last decade the Korean Government adopted a series of integrated (ex ante intermediate and ex post) quality control efforts for efficient management of its public investment program The budget ministry established a strong and effective project appraisal scheme to provide oversight of the line ministriesrsquo project selection process The reforms include a formal review process to ensure that funds are continually subjected to monitoring and evaluation In addition budgeting for public investment was simplified by reducing the number of special accounts and government funds The Government in 2004 introduced the Medium Term Expenditure Framework (MTEF) with top-down budgeting for fiscal year 2005 The MTEF pointed to a need to enhance the capacity for planning and prioritizing public investment management (PIM) programs in the line ministries It also emphasized the need to change the role of the budget ministry as well
This chapter explains the institutional setting for PIM and the reform efforts of the Korean Government to develop and manage a comprehensive PIM program to further improve value for money invested The first section provides a brief summary of public investment expenditure trends in Korea followed by an outline of an institutional framework for public investment management The major players in the budget process are described and the reform efforts to pass the MTEF as well as recent PIM initiatives are examined Then an in-depth description focuses on how the public investment projects (PIPs) are selected prioritized and managed in the budget process beginning with a description of how the project appraisal is carried out up to the preliminary feasibility study Next the design of the total project cost management system from procurement implementation to performance management and the evaluation system are discussed Finally a summary presents challenges and recommendations for improving public investment selection prioritization management and budgeting procedures
Trends in Public Investment Expenditure The Korean Government increased public investment expenditure rapidly in response to
the growing demand for public services along with rapid economic development As a result general government (local and central) spending rose from 18 percent of GDP in 1987 to 30 percent in 2009 (figure x1) Central Government expenditure and net lending showed similar growth
PAGE 2
K O R E A
P I M R E F O R M A F T E R T H E F I N A N C I A L C R I S I S C O U N T R Y C A S E S T U D Y K O R E A
PIM Reform after the Financial Crisis
2 0 1 2
T H E P O W E R O F P U B L I C I N V E S T M E N T M A N A G E M E N T
Figure x1 General and Central Government Spending 1980ndash2008
Source System of National Accounts Bank of Korea (httpecosbokorkr) Government Finance Statistics Ministry of Finance and Strategy (httpwwwmosfgokr)
Figure x2 depicts the general growth rate of public expenditure by sector it shows a notable increase in welfare expenditure and a continuous decrease in defense expenditure The state welfare expenditure increased with the 1977 introduction of National Health Insurance (NHI) for firms with 500 or more employees After a series of expansions the NHI came to cover the entire population in 1989 and government expenditures increased accordingly1
Figure x2 General Government Spending by Function 1980ndash2008
Source Bank of Korea (httpecosbokorkr)
Note Welfare spending includes social protection health and housing and community services
PAGE 3
K O R E A
P I M R E F O R M A F T E R T H E F I N A N C I A L C R I S I S C O U N T R Y C A S E S T U D Y K O R E A
PIM Reform after the Financial Crisis
2 0 1 2
T H E P O W E R O F P U B L I C I N V E S T M E N T M A N A G E M E N T
In addition to the increase in welfare spending spending on economic affairs grew rapidly in the early 1990s with the launch of infrastructure improvements construction of roads subways dams and water supplies2 Traditionally economic affairs and education accounted for about 40 percent of total government spending the former being a slightly larger share Spending on economic affairs contributed to the fast expansion of economic infrastructure while spending on education supported the rise in enrollment rates which are currently close to 100 percent for primary and secondary education private as well as public schools depend heavily on Central Government funding (Colleges and universities are funded mainly by tuition)Table x1 distinguishes consolidated fiscal expenditure and net lending of the Central Government which provides detailed information on expenditure of economic affairs Spending on the transportation and communication sectors accounts for the largest part of expenditures on economic affairs while agriculture forestry fishing and hunting and mining manufacturing and construction hold the second and the third rank respectively Judging whether such fiscal allocation is reasonable and whether the expenditure size is feasible are both difficult tasks
Table x1 Consolidated Fiscal Expenditure and Net Lending by Central Government by Function ( of total)
Government Function Central Government Expenditure
1980 1990 2000 2008
General public services Defense
Public order and safety Education
Health Social protection
Housing construction and community amenities Recreation culture and religion
Economic affairs Fuel and energy
Agriculture forestry fishing and hunting Mining manufacturing and construction
Transportation and communication Other economic affairs Other expenditures
40 306 46
146 10 57 25 07
260 21 59 74 67 39
104
42 200 43
170 17 81
101 05
204 06
102 20 61 14
137
52 114 46
153 07
153 53 08
252 07 62 26 99 58
162
69 149 64
212 13
282 84 13
260 33 68 16
106 37
221
Total 1000 1000 1000 1000
Source MOSF (each year) Note Redemption of public funds (KRW 12 trillion) for year 2004 excluded
PAGE 4
K O R E A
P I M R E F O R M A F T E R T H E F I N A N C I A L C R I S I S C O U N T R Y C A S E S T U D Y K O R E A
PIM Reform after the Financial Crisis
2 0 1 2
T H E P O W E R O F P U B L I C I N V E S T M E N T M A N A G E M E N T
Examination of the transport sectormdashthe largest part of spending in economic affairsmdashshows a constant increase in facility stock (table x2) Road length has more than doubled from 1980 to 2008 Considering that these data do not reflect the increase in number of lanes road facilities in reality have expanded even further Indices for port loadunload capacity and capacity for airport facilities show rapid increases as well Transport facilities therefore do not appear to be a serious economic problem in Korea except for discussions on the need to increase investment in the railway sector
Table x2 Trend of Facility Stock by Transport Sector
Year
Road length Expressway length
Railway length Port loadunload capacity
Capacity for airport facility
(km) relative
indexa
(km) relative index
(km) relative index
(million ton)
relative index
(thousands of flights)
relative index
1980
1990
2000
2008
46951
56715
88775
104236
100
121
189
222
1225
1551
2131
3447
100
127
174
281
3135
3091
3123
3381
100
099
100
108
823
2243
4304
7586
100
273
523
922
1006
1331
2025
2222
100
132
201
221
Source Korea Development Institute 2004 Ministry of Land Transport and Maritime Affairs Statistics on Land Transport and Maritime Affairs
Note a Relative index according to 1980 stock level
Figure x3 shows that public investment expenditure by the Government in areas such as transport has taken an important role in total domestic investment Since 1970 the gross domestic investment ratio (which equals national total capital formationgross national disposable income) has been maintained at around 30 percent and the general government investment ratio (the general government capital formationgross national disposable income) at around 5 percent with the general government taking up about 15 percent of total investment General government public investment has increased since 2000 when the gross domestic investment ratio saw a slight decrease If public enterprises are included in the figure representation of investment by the public sector would far outweigh that of the general government
The Government has not focused only on infrastructure facility expansion in the process of economic development It has also more directly intervened in the market in order to resolve market failure especially failure of the financial markets One method used was fiscal lending Figure x4 examines the size of fiscal lending using two indices lending by the general government as indicated in Flow of Funds from the Bank of Korea (Bank of Korea var years) and loan
PAGE 5
K O R E A
P I M R E F O R M A F T E R T H E F I N A N C I A L C R I S I S C O U N T R Y C A S E S T U D Y K O R E A
PIM Reform after the Financial Crisis
2 0 1 2
T H E P O W E R O F P U B L I C I N V E S T M E N T M A N A G E M E N T
repayment by the Central Government as indicated in National Statement for Current Bonds (MOSF var years) announced by the financial authority Fiscal lending has reached a sizable amount the housing sector takes the biggest part and the small- and medium-sized enterprise (SME) sector and agricultural sector follow respectively
PAGE 6
K O R E A
P I M R E F O R M A F T E R T H E F I N A N C I A L C R I S I S C O U N T R Y C A S E S T U D Y K O R E A
PIM Reform after the Financial Crisis
2 0 1 2
T H E P O W E R O F P U B L I C I N V E S T M E N T M A N A G E M E N T
Figure x3 Capital Formation Trends by Sector 1980ndash2008 of GNI
Source MOSF internal data Bank of Korea Economic Statistics System (httpecosbokorkr)
Note Capital formation and investment to foreign country as ratio to gross national disposable income
Figure x4 Size of Government Fiscal Lending (as of balance) 1990ndash2008 of GDP
Source MOSF internal data Bank of Korea Economic Statistics System (httpecosbokorkr)
Note Government lending and loans as of 1968 System of National Accounts (SNA) before 2001 and as of 1993 SNA after 2002
PAGE 7
K O R E A
P I M R E F O R M A F T E R T H E F I N A N C I A L C R I S I S C O U N T R Y C A S E S T U D Y K O R E A
PIM Reform after the Financial Crisis
2 0 1 2
T H E P O W E R O F P U B L I C I N V E S T M E N T M A N A G E M E N T
Institutional Framework for PIM Major players in the budget process include the Ministry of Strategy and Finance (MOSF)
and the Board of Audit and Inspection (BAI) (see table x3) The MOSF is responsible for preparing the draft budget based on revenue forecasts of the Tax and Customs Office in the MOSF When the budget is authorized by the National Assembly the MOSF prepares the quarterly budget implementation plan usually within a month and allocates funds to line ministries The Treasury Bureau of the MOSF then prepares the monthly cash plan and releases cash to line ministries The Treasury Bureau keeps track of cash flows into and from the treasury single account held in the Bank of Korea It is also responsible for issuing government bonds and managing government assets and liabilities
An important issue concerning the interplay among various players is fiscal discipline The budget process has generally taken a highly centralized strategic dominance-based approach to maintaining fiscal discipline3 The MOSF plays a central role in budgeting as well as in preparing and implementing public investment programs Often the main budgeting decisions are made in bilateral negotiations between the budget authority and the spending ministry
The MOSF exercises tight control on public expenditures in the implementation stage Ministries are required to spend within the limits set in the quarterly budget implementation plan When deemed necessary the MOSF can postpone or block part of the expenditures All limits on expenditures are imposed in cash terms Transfers across appropriation accounts are prohibited unless authorized by the National Assembly or by the MOSF
The Treasury Bureau of the MOSF also has a tight grip on cash outflow All cash disbursements are made strictly within the limits set in the monthly cash plans Before the 1997 crisis it was not uncommon for the Treasury Bureau to delay disbursements to line ministries when there was not enough money left in the treasury account due to the seasonality of tax collection This was the case despite the fact that they could issue short-term debt instruments within the limit set by the National Assembly to bridge the gap between tax collection and cash needs In addition the revenue forecasts prepared by the Tax and Customs Office were often very conservative with the actual tax collection overshooting the forecast by substantial margins
PAGE 8
K O R E A
P I M R E F O R M A F T E R T H E F I N A N C I A L C R I S I S C O U N T R Y C A S E S T U D Y K O R E A
PIM Reform after the Financial Crisis
2 0 1 2
T H E P O W E R O F P U B L I C I N V E S T M E N T M A N A G E M E N T
Table x3 Major Players in Korearsquos Budget Process
Players Roles
Ministry of Strategy and Finance (MOSF)
x Compiles budget bids and prepares the draft budget x Allocates funds to spending ministries (apportionment) x Approves the transfers of funds between line items (virements)
Treasury Bureau of the MOSF
x Releases cash to spending ministries x Manages the treasury single account held in the Bank of Korea x Issues treasury bonds and manages assets and liabilities x Collects ministerial financial reports prepares the whole-of-
government financial reports and sends them to the BAI x Produces the government financial statistics
Tax and Customs Office of the MOSF
x In charge of tax policy x Prepares revenue forecasts x Oversees the National Tax Service and the Customs Service
Line ministries Execute the budget and prepare financial reports
Board of Audit and Inspection (BAI)
x The supreme audit institution in Korea whose head is nominated by and reports to the President The National Assembly can also request audits on specific issues to the BAI
x Checks the regularity of ministerial activities x Prepares and tables the financial report to the National
Assembly
National Assembly x Deliberates and votes on the budget x Approves the transfers of funds between programs x Reviews and approves audit reports
Some changes were observed in cash management and revenue forecast practices after the
1997 financial crisis Pressured to stimulate the economy and in particular to back up the front-loading4 of annual spending that has been popular since 1999 the MOSF resorted more and more to short-term debt instruments to bridge the gap between tax collection and cash needs The downward bias in revenue forecasts was also reduced In 2004 there had actually been a large shortfall in tax collection which was partly blamed on an overly optimistic assumption on the economic growth which was in turn claimed by some to have been politically motivated Now the democratization of Korean politics and the devolution of budgetary power to line ministries became an unavoidable trend
Recent Change from Bottom-Up to Top-Down Budgeting
The Korean Governmentrsquos budget process has undergone a significant change beginning when the Government introduced the Medium Term Expenditure Framework (MTEF) together with top-down budgeting in 2004 for fiscal year 20055 The reform was intended to address several defects found in the previous budgeting practice Prior to the introduction of the MTEF budgeting
PAGE 9
K O R E A
P I M R E F O R M A F T E R T H E F I N A N C I A L C R I S I S C O U N T R Y C A S E S T U D Y K O R E A
PIM Reform after the Financial Crisis
2 0 1 2
T H E P O W E R O F P U B L I C I N V E S T M E N T M A N A G E M E N T
was centered on the next single budget year and lacked a medium-term perspective The MOSF and the National Assembly gave little consideration to the out-years beyond the budget year Line ministries had little information on the extent of the resources that would be available to them in the future and their medium- to long-term planning function was severely limited It was also difficult for the MOSF to identify and cope with the trend towards increased public expenditure Without a long-term view on the appropriate level of the tax burden the MOSF would simply allow ever-increasing public spending to accommodate rising demands from various sectors
Before the introduction of the top-down process budgeting relied exclusively on a bottom-up approach At the initial stage of budget preparation the MOSF made rough estimates of the total size and the sectoral allocation of the next yearrsquos budget But the estimates were not transmitted to line ministries and therefore could not guide them in preparing their budget requests When reviewing the ministriesrsquo budget requests the MOSF focused on the microscopic spending control of individual public investment programs The sectoral allocation and the total size of the budget were determined at the last stage of budget preparation by aggregating the expenditures on individual programs As a result control of inputs assumed major significance in budget discussions and little attention was paid to outputs or outcomes The accountability and autonomy of line ministries in preparing and managing their budget was also severely limited Line ministries usually requested an unrealistically large amount of the budget and massive cuts were inevitable
With the introduction of the MTEF and top-down budgeting the process changed Now the annual budgeting exercise starts with a discussion on fiscal management over the next five years including the current year the budget year and three out-years Following this discussion the MOSF transmits spending ceilings for sectors and programs to line ministries6 These ceilings encompass the general and special accounts and funds Line ministries are now asked to prepare their budget requests within these ceilings When reviewing the ministerial budget requests the MOSF places less emphasis on the microscopic control of line items and more on the strategic alignment of budget requests with overall policy directions
New Initiatives in Public Investment Management
In order to enhance the efficiency of PIM the Korean Government in 1999 organized a cross-ministerial task force to develop an action plan The task force was jointly headed by Ministry of Planning and Budget7 (now MOSF) and the Ministry of Construction and Transportation (MOCT) (now Ministry of Land Transport and Maritime Affairs MLTMA) The MOCT issued ldquoA Comprehensive Plan to Enhance Efficiency of Public Investmentrdquo in July 1999 (MOCT 1999) Various policy measures were introduced to tackle the weaknesses of the existing public investment management system
One of the features of the new PIM system was to intensify the monitoring system of the project implementation process by the budgeting agency For example the MOSF now takes charge of the Preliminary Feasibility Studies (PFS) the results of which are reflected in the budget appropriation This arrangement represents a compromise between the MOSF which tried to take over the feasibility study function from the line ministries and the line ministries especially the
PAGE 10
K O R E A
P I M R E F O R M A F T E R T H E F I N A N C I A L C R I S I S C O U N T R Y C A S E S T U D Y K O R E A
PIM Reform after the Financial Crisis
2 0 1 2
T H E P O W E R O F P U B L I C I N V E S T M E N T M A N A G E M E N T
MLTMA which were resistant to the idea of transferring ownership of the feasibility study to the MPB Thus the PFS was ldquoinventedrdquo as a settlement to relieve the resistance from the line ministries
The Total Project Cost Management System (TPCM) in which the budget ministry checks the cost increase from the baseline throughout the project life was also strengthened Introduced in 1994 the TPCM was established as an effective measure of government expenditure management after the financial crisis Under the TPCM System the Reassessment Study of Feasibility (RSF) and Reassessment of Demand Forecast (RDF) were introduced in 1999 and 2006 respectively RSF and RDF reformulate feasibility studies and demand forecasts on projects under design development or construction and decide whether the project may continue The RSF guidelines and RDF system were developed and introduced after the PFS system was established The guidelines of RSF and RDF adopt the same analytical methodology as that of the PFS Figure x5 shows a brief chronology of PIM system evolution
Figure X5 Chronology of New Initiatives in Korearsquos PIM System
For line ministries the Government introduced the ex-post performance evaluation system in 1999 According to the MOCT Comprehensive Plan the line ministries were supposed to evaluate the performance of the project within three years after construction work is completed In 2000 the MOCT amended the Enforcement Decree of the Construction Technology Management Act to incorporate the initiatives included in the Comprehensive Plan The legal ground of PFS and TCPM resides in several laws their enforcement decrees and administrative guidelines such as the Budgeting and Accounting Act and the Fund Management Act In 2006 the National Finance Act combining several fiscal-related acts was legislated to stipulate diverse policy measures of PIM
With the establishment of a legal framework for public investment the PIM project was to be implemented in accordance with the process shown in figure x5 Throughout the process the MOSF produces information necessary for decision-making on budgeting through PFS FSF RDF
RSF guidelines
strengthened PE introduced
RSF guidelines developed
RDF introduced
The National Finance Act legislated
1994 1999 2005 2006
PFS introduced TPCM introduced
RSF introduced
9 TPCM (Total Project Cost Management) 9 PFS (Preliminary Feasibility Study)
9 RSF (Reassessment Study of Feasibility) 9 RDF (Reassessment of Demand Forecast) 9 PE (Performance Evaluation)
PAGE 11
K O R E A
P I M R E F O R M A F T E R T H E F I N A N C I A L C R I S I S C O U N T R Y C A S E S T U D Y K O R E A
PIM Reform after the Financial Crisis
2 0 1 2
T H E P O W E R O F P U B L I C I N V E S T M E N T M A N A G E M E N T
and in-depth program evaluation In the past line ministries provided selective information to procure more of the budget leading the MOSF to cut project budgets but not always on a reasonable basis New devices investigating the projects in detail made it possible for the MOSF to manage public investment more effectively
PAGE 12
K O R E A
P I M R E F O R M A F T E R T H E F I N A N C I A L C R I S I S C O U N T R Y C A S E S T U D Y K O R E A
PIM Reform after the Financial Crisis
2 0 1 2
T H E P O W E R O F P U B L I C I N V E S T M E N T M A N A G E M E N T
Figure X6 Implementation Process of Public Investment Management
Ex-Ante Intermediate Ex-Post
x TPCM(RSF amp RDF) x Performance Evaluation
x In-depth Program Evaluation
Note The bulleted items are under the aegis of MOSF
Project Appraisal by Preliminary Feasibility Study Improvement of a project appraisal system at the ex ante level is very important for
ensuring sound public expenditure As discussed the Ministry of Strategy and Finance introduced the preliminary feasibility study (PFS) to enhance efficiency in the early decision-making process of major infrastructure investment projects Throughout the project cyclemdashsuch as the stages of identification preparation implementation evaluation and so onmdashthe MOSF is interested in improving the methods of ex-ante appraisal at the preparation stage
Initiative for a Preliminary Feasibility Study
The PFS is a brief evaluation of a project to produce information for a budgetary decision A critical change is that the PFS is owned by the Ministry of Strategy and Finance (MOSF) Under the new procedure the MOSF established the Public Investment Management Center (PIMA) within the
Blueprint Design
Land Acquisition Construction
Draft Design Operation Maintenance
PFS
Feasibility Study
Strategic Planning
PAGE 13
K O R E A
P I M R E F O R M A F T E R T H E F I N A N C I A L C R I S I S C O U N T R Y C A S E S T U D Y K O R E A
PIM Reform after the Financial Crisis
2 0 1 2
T H E P O W E R O F P U B L I C I N V E S T M E N T M A N A G E M E N T
Korea Development Institute (KDI) with the mandate to conduct research and take an operational managing role in implementing the PFS procedures8
The PFS is conducted by a multi-disciplinary research team organized by PIMA (now PIMAC Public and Private Infrastructure Investment Management Center) typically consisting of economists transportation researchers and civil engineers The mix of specialists from different backgrounds and organizations helps to provide diverse ideas for the appraisal and improve the transparency and objectivity of the decision-making process The PFS Review Committee is organized by the MOSF with members of staff from the budget and line ministries PIMAC and field specialists Open discussions are held regularly on the PFS mid-term and final reports
The PFS process aims to enhance fiscal productivity by launching large-scale public investment projects based on transparent and objective ex-ante project evaluations The meaning of ldquopreliminaryrdquo is twofold first it means ldquoprovisionalrdquo evaluation a short and brief examination second it is an evaluation that precedes a (detailed) feasibility study The National Finance Act of 2006 provides the legal framework of PFS9 Before that legislation PFS was based on the Enforcement Decrees of the Budgeting and Accounting Act and the Fund Management Act these two laws were merged into the National Finance Act in 2006
The coverage of PFS is so extensive that it has made notable changes to the PIM system since its inception All new large-scale projects with a total cost of KRW50 billion (about US$50 million) or more are subject to the PFS With the National Finance Act the scope of the PFS was expanded to non-infrastructure projects (for example RampD) Local governments and PPI (private participation in infrastructure) projects are also subject to the PFS if the Central Government subsidy exceeds KRW30 billion
The following types of projects are exempted from the PFS typical building projects such as government offices and correctional institutions legally required facilities such as sewage and waste treatment facilities rehabilitating projects and restoration works from natural disasters projects implemented by international accords and by a SouthndashNorth Korea exchange and cooperation program and military facilities and projects related to national security
In every budget cycle of public infrastructure projects the PFS procedure is conducted as follows At the first stage a concerned line ministry submits a list of PFS candidate projects to the MOSF and the MOSF selects the PFS projects and requests PFS to PIMAC at KDI PIMAC organizes the research team conducts the PFS and submits the final PFS reports to the MOSF (figure x7) In the middle of conducting the PFS and making a final decision the PFS Review Committee takes charge of the whole review process
PAGE 14
K O R E A
P I M R E F O R M A F T E R T H E F I N A N C I A L C R I S I S C O U N T R Y C A S E S T U D Y K O R E A
PIM Reform after the Financial Crisis
2 0 1 2
T H E P O W E R O F P U B L I C I N V E S T M E N T M A N A G E M E N T
Figure x7 Preliminary Feasibility Study Procedures
Contents of PFS
The PFS is conducted in three phases background study main analyses and synthesis The background study reviews the statement of purpose and collects background data on socio-economic geographic and technical aspect of the project In addition key agendas for the main analyses are discussed in the background study through brainstorming
Line Ministry
Ministry of Strategy amp Finance
Korea Development Institute (Public and Private Infrastructure Investment Management Center)
Submit PFS projects candidate
Feasibility Study or Stop
Select PFS Projects
Request PFS
Make investment Decision
Announcement
Submit PFS Report
Organize Teams Conduct PFS
PAGE 15
K O R E A
P I M R E F O R M A F T E R T H E F I N A N C I A L C R I S I S C O U N T R Y C A S E S T U D Y K O R E A
PIM Reform after the Financial Crisis
2 0 1 2
T H E P O W E R O F P U B L I C I N V E S T M E N T M A N A G E M E N T
Figure x8 Outline of PFS Procedures and Contents
The main analyses in the PFS process are economic analysis policy analysis and balanced regional development analysis The backbone of the economic analysis is the cost-benefit analysis The economic benefit and economic cost of a project are estimated based on the forecasted demand The criteria of cost-benefit ratio NPV (net present value) and IRR (internal rate of return) are calculated based on the stream of annual benefit and cost As of 2007 a social discount rate of 55 percent in real terms is applied to the analysis based on the trend of risk free interstate rate in Korea
Policy analysis examines the potential effects of the projects in qualitative and quantitative terms including consistency with higher level policy possible project risk and other project-specific considerations In the consistency category the attitudes of the project owner and local residents toward the project and the level of preparedness of the project proposers are examined In the project risk category the risk of funding availability and the environmental risk of the project are evaluated
Balanced regional development analysis is an evaluation of the project from a regional perspective The regional backwardness index a composite index of eight characteristics for local entities was developed by the PFS guidelines The regional economic impact analysis is also conducted through the MRIO (Multi-Regional Input-Output) model
To synthesize the results of these economic policy and balanced regional development analyses the AHP (Analytic Hierarchy Process) technique is applied in the PFS AHP is a multi-
Project Proposal
Background Study
bull Review of Statement of purposebull Collect socio-economic
geographic and a technical data
bull Brainstorming (Other Alternatives)
bull PFS issues raised
Policy Analysis
bull Consistency with higher-level plan and policy directions
bull Project risk (financing and environmental impact)
bull Project-specific evaluation item
Balanced Regional Development Analysis
bull Regional backwardness index analysis
bull Regional Economic impact
Economic Analysis
bull Demand analysisbull Cost estimationbull Benefit estimationbull Cost-benefit analysisbull Sensitivity analysisbull Financial analysis
Analytic Hierarchy Process
bull Overall feasibilitybull Prioritizationbull Financing and policy
suggestion
Project ProposalProject Proposal
Background StudyBackground Study
bull Review of Statement of purposebull Collect socio-economic
geographic and a technical data
bull Brainstorming (Other Alternatives)
bull PFS issues raised
Policy AnalysisPolicy Analysis
bull Consistency with higher-level plan and policy directions
bull Project risk (financing and environmental impact)
bull Project-specific evaluation item
Balanced Regional Development Analysis
Balanced Regional Development Analysis
bull Regional backwardness index analysis
bull Regional Economic impact
Economic AnalysisEconomic Analysis
bull Demand analysisbull Cost estimationbull Benefit estimationbull Cost-benefit analysisbull Sensitivity analysisbull Financial analysis
Analytic Hierarchy ProcessAnalytic Hierarchy Process
bull Overall feasibilitybull Prioritizationbull Financing and policy
suggestion
PAGE 16
K O R E A
P I M R E F O R M A F T E R T H E F I N A N C I A L C R I S I S C O U N T R Y C A S E S T U D Y K O R E A
PIM Reform after the Financial Crisis
2 0 1 2
T H E P O W E R O F P U B L I C I N V E S T M E N T M A N A G E M E N T
criteria decision-making approach that enables user to combine quantitative and qualitative analyses into a decision through a hierarchical structure AHP is unique in providing a hierarchical framework to a complex problem by establishing majorminor factors and examining the importance of each factor through pair-wise comparison AHP enhances objectivity of decision-making by analyzing and managing the entire process of decision-making in steps and it ensures the consistency of weights derived from pair-wise comparison guaranteeing the robustness of decision-making
As a group decision support system AHP also enables the user to synthesize decisions of multiple decision makers Thus PFS team members comprising seven or eight experts from different organizations with different specialties rate the feasibility of a project through the AHP technique Diverse views on the level of feasibility are synthesized into a single score which results in a final decision on feasibility of a project
Figure x9 shows how AHP guides the synthesis of the analytical results of a project The PFS team sets the weight of each criterion through pair-wise comparison of each criterion against the others At the bottom level of the hierarchy are the two alternative judgments ldquoProject Implementationrdquo or ldquoStatus Quordquo (which means ldquoNot-Implementing the Projectrdquo) The score of the two alternatives are scaled to be summed up to 1 Hence if the Project Implementation alternative gets a score above 05 the project is evaluated as feasible
Figure X9 Structure of AHP in PFS
Overall FeasibilityOverall FeasibilityOverall FeasibilityOverall Feasibility
Economic AnalysisEconomic AnalysisBalanced Regional
Development AnalysisBalanced Regional
Development AnalysisPolicy AnalysisPolicy Analysis
Consistency with higher level planConsistency with higher level plan
Project riskProject riskProject-specific
factorProject-specific
factor
Attitu
de to
ward
the p
roje
ct
Attitu
de to
ward
the p
roje
ct
Consis
tency w
ith h
igher le
vel p
lan
Consis
tency w
ith h
igher le
vel p
lan
Pre
pare
dness
Pre
pare
dness
Pro
ject-
specific
item
(optio
nal)
Pro
ject-
specific
item
(optio
nal)
Fin
ancia
l feasib
ilityFin
ancia
l feasib
ility
Enviro
nm
enta
l impact a
ssessm
ent
Enviro
nm
enta
l impact a
ssessm
ent
Pro
ject-
specific
item
(optio
nal)
Pro
ject-
specific
item
(optio
nal)
Pro
ject-
specific
item
2
(optio
nal)
Pro
ject-
specific
item
2
(optio
nal)
Pro
ject-
specific
item
1
(optio
nal)
Pro
ject-
specific
item
1
(optio
nal)
Pro
ject-
specific
item
(optio
nal)
Pro
ject-
specific
item
(optio
nal)
Regio
nal e
conom
ic im
pacts
Regio
nal e
conom
ic im
pacts
Regio
nal b
ackw
ard
ness a
naly
sis
Regio
nal b
ackw
ard
ness a
naly
sis
Project ImplementationProject ImplementationProject Implementation Status QuoStatus QuoStatus QuoAlternativesAlternativesAlternatives
Level 1
Level 2
Level 3
PAGE 17
K O R E A
P I M R E F O R M A F T E R T H E F I N A N C I A L C R I S I S C O U N T R Y C A S E S T U D Y K O R E A
PIM Reform after the Financial Crisis
2 0 1 2
T H E P O W E R O F P U B L I C I N V E S T M E N T M A N A G E M E N T
PFS Evaluation Guidelines
PFS is based on three pillars of quality objectivity consistency and transparency In order to improve the objectivity of the evaluation and secure consistency among projects PIMAC developed evaluation guidelines PFS guidelines are detailed descriptions of methodology and procedures of PFS implementation PFS guidelines cover the following sectors roads railways ports airports dams and cultural facilities The guidelines stipulate that the same methodology is applied and the same or a similar dataset is used for different projects in the same sector For example the KT_DB (Korea Transport Database) should be used for all the road and railroad projects for consistency in evaluation results These guidelines are continuously revised through academic research The PFS guidelines for road and railroad projects in its fifth edition in 2009 provide specific procedures for assessing road projects (see box x1)
Box x1 How a Road Project Is Assessed in PFS Methodology cost-benefit analysis
x Criteria BC NPV (Net Present Value) IRR (Internal Rate of Return) x Social Discount Rate 55 percent (real term) x Duration Roads railways and seaports (30 yr) dams and water supply facilities (50 yr) x Tax is excluded but salvage value is included
Benefit of road project x Valuation of changes in route and travel speeds due to the project x Savings in travel time vehicle operation costs traffic accidents and environmental costs (air and noise
pollution) A multi-criteria decision-making approach by AHP (Analytical Hierarchy Process)
x Combines quantitative and qualitative criteria for decisions under a hierarchical structure x A group decision support system x Hierarchical structuring x Pair-wise comparison
Performance of PFS
Based on the PFS results only a project that has been assessed and meets the investment criteria can be approved and implemented Table x4 shows the number of PFS conducted from 1999 to 2009 A total of 437 projects were evaluated among which road (188 projects) and railway projects (79 projects) were dominant totals included 27 seaport projects 32 culture and tourism projects 34 water supply projects and 77 other projects Other projects included construction projects for welfare facilities airports and industrial complexs among others
PAGE 18
K O R E A
P I M R E F O R M A F T E R T H E F I N A N C I A L C R I S I S C O U N T R Y C A S E S T U D Y K O R E A
PIM Reform after the Financial Crisis
2 0 1 2
T H E P O W E R O F P U B L I C I N V E S T M E N T M A N A G E M E N T
Table x4 Number of PFS Submitted by Sector 1999ndash2009
Sector 1999 2000 2001 2002 2003 2004 2005 2006 2007 2008 2009 Sum Road 11 11 20 9 11 24 11 27 30 12 22 188
Railway 2 7 14 8 7 13 6 10 5 2 5 79
Seaport 1 5 1 2 3 1 2 5 1 4 2 27
Culture and Tourism
3 2 5 2 5 2 1 5 2 3 2 32
Water Resources
1 1 0 5 5 3 3 1 1 2 12 34
Others 1 4 1 4 2 12 7 4 7 15 20 77
Sum 19 30 41 30 33 55 30 52 46 38 63 437
Source Internal data (1999ndash2009) from PIMAC KDI
Table x5 shows the proportions of feasible projects 256 projects or 586 percent of 437 projects were evaluated as feasible The proportion of feasible projects for the road sector is 564 percent The highest rate of feasibility was for seaport projects at 778 percent and the projects in the culture and tourism sector had the lowest feasibility rate at 435 percent
Table x5 Proportion of Feasible Projects by Sector 1999ndash2009
of Submitted Projects Rated Feasible
Project Sector 1999 2000 2001 2002 2003 2004 2005 2006 2007 2008 2009 Total Projects (A)
Total Feasible Projects (B)
(B)(A) ()
Road 455 273 300 333 727 875 364 630 633 750 500 188 106 564
Railway 500 571 357 750 714 538 833 400 250 1000 800 79 44 557
Seaport 1000 800 1000 500 1000 1000 1000 400 1000 1000 500 27 21 778
Culture and tourism 1000 - 400 - - 1000 1000 400 500 1000 - 32 14 438
Water resources 1000 1000 - - 600 667 667 1000 1000 500 917 34 23 676
Others 1000 750 - 750 500 667 714 500 429 467 789 77 48 623
Average 632 500 341 433 606 745 633 538 565 684 677 437 256 586
Source Internal data (1999ndash2009) from PIMAC KDI Note mdash not applicable
Tables x6 and x7 show the results of PFS in terms of BC ratio and AHP score Until 2002 no technique was employed to combine BC ratio and the results of policy analyses Thus the overall PFS result was that a proposed project was announced as feasible or non-feasible along with the BC ratio During 1999ndash2002 nine projects were evaluated as non-feasible despite the fact that their BC ratios were greater than 1 The reasons were mostly their potential negative environmental impacts and difficulties in funding availability for local government projects On the
PAGE 19
K O R E A
P I M R E F O R M A F T E R T H E F I N A N C I A L C R I S I S C O U N T R Y C A S E S T U D Y K O R E A
PIM Reform after the Financial Crisis
2 0 1 2
T H E P O W E R O F P U B L I C I N V E S T M E N T M A N A G E M E N T
other hand 10 projects were evaluated as feasible with BC less than 1 The most important reason was a consideration of balanced regional development
Table x6 Feasiblenon-feasible Projects according to BC Ratios (1999ndash2002) Project numbers rated feasible or non-feasible
Year BC ge 1 BC lt 1
Total (A)
Feasible Non- feasible Feasible Non-
Feasible Feasible (B)
(B)(A) ()
1999 8 1 5 6 20 13 650
2000 14 3 1 12 30 15 500
2001 12 2 2 25 41 14 341
2002 11 3 2 14 30 13 433
Total ()
45 (372)
9 (74)
10 (83)
57 (471)
121 (1000) 55 455
Source Internal data (1999-2009) from PIMAC KDI
Table x7 shows the PFS results during 2003ndash09 In 2003 the AHP technique was officially employed to synthesize the economic and policy analyses From then on the PFS results were announced in terms of BC and AHP score Over that period 202 projects or 639 percent of 316 projects were evaluated and rated as feasible Five projects with BC greater than 1 received AHP scores of less than 05 and eventually were deemed non-feasible On the other hand 61 projects with BC less than 1 received AHP scores greater than 05
The PFS has contributed to enhance the fiscal efficiency of the PIM project selection process by preventing non-feasible projects from being launched During 1999ndash2009 a total of 437 PFS evaluations were conducted and the projects deemed non-feasible saved taxpayers funds that could be allocated to other uses
PAGE 20
K O R E A
P I M R E F O R M A F T E R T H E F I N A N C I A L C R I S I S C O U N T R Y C A S E S T U D Y K O R E A
PIM Reform after the Financial Crisis
2 0 1 2
T H E P O W E R O F P U B L I C I N V E S T M E N T M A N A G E M E N T
Table x7 Feasiblenon-feasible Projects according to BC Ratios and AHP Scores (2003ndash2009)
Project numbers rated feasible or non-feasible
Year BC ge 1 BC lt 1
Total (A)
AHPge 05
AHPlt 05
AHPge 05
AHPlt 05
Feasible (B)
(B)(A) ()
2003 18 0 2 13 33 20 606 2004 27 1 14 13 55 41 745 2005 15 1 4 10 30 19 633 2006 21 2 7 22 52 28 538 2007 19 0 7 20 46 26 565 2008 16 0 10 12 38 26 684 2009 25 1 17 19 62 42 677 Total ()
141 (446)
5 (16)
61 (193)
109 (345)
316 (1000) 202 639
Source Internal data (1999-2009) from PIMAC KDI
Procurement and Capital Budget Implementation Procurement and capital budget implementation on public investment programs and
projects has been managed mostly by a budget management system called the Total Project Cost Management System (TPCM) in the Ministry of Strategy and Finance TPCM aims to enhance fiscal productivity and to ensure a high quality of public construction work by properly adjusting and managing total project costs (TPC) throughout the implementation stages of a project The MOSF established the TPCM in 1994 and revises the ldquoGuidelines for Total Project Cost Managementrdquo on an annual basis
TPCM Manages PIP Construction Budgets
According to the National Finance Act the following types of construction projects are subject to the TPCM system
x Projects implemented by the Central Government or its agents or by local governments or private institutions relying on Central Government funding
x Projects with a construction period exceeding two years and
x Civil engineering projects whose TPC exceeds KRW 30 billion (USD 30 million) or architectural projects whose TPC exceeds KRW 10 billion (USD 10 million)
The TPC includes all cost items accrued throughout the life of the project including design land acquisition and construction costs regardless of whether the source of funding is the Central Government local governments or private institutions
Project costs should be managed by construction phase and by construction unit in reference to total construction cost The construction costs are not arbitrarily interchangeable between project
PAGE 21
K O R E A
P I M R E F O R M A F T E R T H E F I N A N C I A L C R I S I S C O U N T R Y C A S E S T U D Y K O R E A
PIM Reform after the Financial Crisis
2 0 1 2
T H E P O W E R O F P U B L I C I N V E S T M E N T M A N A G E M E N T
phases or between construction units When increases in construction size or costs are expected and even inevitable the minister in charge of the project must consult with the MOSF about adjusting the TPC
TPCM by Project Phase
The TPCM guidelines of the MOSF describe in detail how the rules and regulations of project management are carried out by project phase
Project conception phase The minister in charge of the project should make an appropriate estimate of the total cost and duration of the project and ask the MOSF for a PFS if the estimated total cost in the project conception phase is KRW 50 billion or more For local government projects the minister in charge should ask MOSF for a PFS if the funding of the project relies on a Central Government subsidy of KRW 30 billion or more
Phases of PFS and a (detailed) feasibility study The minister in charge should report on the project size TPC and project duration to MOSF for all the projects that have been evaluated as feasible by PFS and should ensure that the budget is drawn up by the end of January Detailed feasibility studies should cover the life cycle cost of the projects resulting from all technological environmental social and financial aspects as well as from land acquisition
Draft design phase The project management should ensure that enough money and time is spent on the draft design to prevent significant and frequent design modifications in the following construction phases The design team should collect various opinions from target citizens interests groups and related government authorities in order to minimize public discontent expected in the construction phase The minister in charge should consult value-engineering (VE) experts at least once before the end of this phase to prevent overestimation of costs and excessive construction
Blueprint design phase Size of the construction should not be modified significantly in this phase When it appears that a design modification or change in construction size is inevitable the minister in charge should discuss the matter with the MOSF The minister should also consult value-engineering experts at least once before the end of this phase to prevent overestimation of costs and excessive construction
Contracting phase MOSF informs the Administer of the Office of Supply Administration of the total construction cost after discussing it with the minister in charge When the contract cost exceeds the informed cost the Administer of the Office of Supply Administration should discuss the matter with the Minister of Strategy and Finance
Construction phase The minister in charge should try to minimize cost increases except when new construction techniques or new equipments are to be introduced to enhance the quality of the product substantially When an increase in costs change in construction size or change in construction duration are inevitable the minister in charge should submit a written explanation and discuss it with the Minister of Strategy and Finance
PAGE 22
K O R E A
P I M R E F O R M A F T E R T H E F I N A N C I A L C R I S I S C O U N T R Y C A S E S T U D Y K O R E A
PIM Reform after the Financial Crisis
2 0 1 2
T H E P O W E R O F P U B L I C I N V E S T M E N T M A N A G E M E N T
The line ministry is allowed to set construction contingencies for up to 8 percent of the contract price of a project to cope with inevitable design modification and amendment of the law and so on The line ministry can use its own discretion to change the TPC within the limit of these contingencies Contingencies apply only to the construction phase of a project
In general an increase in construction size through design modification is not allowed except for inevitable cases The base cost for a TPCM system is the contract cost determined by bidding not the cost estimate at design phase ldquoThe indicator adjustment formulardquo set by the Office of Supply Administration is applied to recalculate project costs incorporating inflationary effects
When a project under implementation violates the TPCM guidelines the Minister of Strategy and Finance can cut off or withhold budget allocation for the project The minister in charge can impose sanctions prohibiting invitation to tendering of construction projects on design teams when their work has resulted in a substantial cost increase due to unsatisfactory performance or when they intentionally or unintentionally fail to estimate the appropriate construction costs or sizes The minister in charge can petition the Minister of Strategy and Finance for changes in costs and project duration at any time through the Budget Information Management System when necessary
Reassessment Study of Feasibility and Reassessment of Demand Forecast
The Reassessment Study of Feasibility (RSF) aims to check unnecessary cost increases by re-affirming the feasibility of projects under implementation and scrutinizing the adequacy of the cost increase The MOSF conducts the RSF on a project if the PFS has not been conducted although it falls under the PFS coverage or if the TPC has increased by more than 20 percent (excluding inflationary effects and increase in land acquisition cost) of the cost confirmed by the Minister of Strategy and Finance at the previous phase of the project Also according to the amendment of the National Finance Act in 2009 the Board of Audit and Inspection is entitled to request that the MOSF conduct an RSF if there is a need
The line ministries conduct the RSF on a project with miscellaneous changes in construction costs and report it to the Minister of Strategy and Finance The RSF guidelines suggest that the RSF should include but should not be limited to the following components
x Outline of a project
x Analysis of background data and project issue raised
x Analysis on adequacy of the plan including size of the project
x Economic analysis including cost-benefit analysis
x Policy analysis
x Overall assessment including judgment on whether or not to continue a project and if the TPC increase is adequate
Based on these analyses the RSF team makes an overall assessment including a judgment as to whether or not to continue a project and if the TPC increase is adequate While the PFS focuses
PAGE 23
K O R E A
P I M R E F O R M A F T E R T H E F I N A N C I A L C R I S I S C O U N T R Y C A S E S T U D Y K O R E A
PIM Reform after the Financial Crisis
2 0 1 2
T H E P O W E R O F P U B L I C I N V E S T M E N T M A N A G E M E N T
on evaluating the feasibility of a project RSF puts relatively more emphasis on finding alternatives to cut down the size and cost of a project The MOSF reflects the RSF results in adjusting the TPC When the RSF results show that a project has turned out to be unfeasible the RSF team works on curtailing project size with the intent of improvinh its feasibility When no alternative way to secure the feasibility of the project is found the MOSF decides whether to stop implementing the project
Reassessment of demand forecast (RDF) is a device that verifies the adequacy of the demand forecast for a public investment project conducted in the past with the latest information By minimizing inevitable forecasting error RDF aims to improve the efficiency of expenditure and to prevent squandering of financial resources by managing demand fluctuation of large-scale long-term infrastructure projects throughout the phases of a project
The transportation facilities including roads rail airports and ports that are subject to TPCM are also subject to RDF if required The RDF is to be conducted during any of the following phases when the requirements for the reassessment are met (1) before or during completion of the basic plan or feasibility study (2) before or during completion of draft design (3) before or during completion of detailed design (4) during the construction period andor (5) when it is deemed necessary by the Minister of Strategy and Finance or the head of Central Government agency either of whom may request a RDF before or during a feasibility study or design development
The RDF shall be conducted when there are substantial changes in demand forecasts as stipulated in the following (1) when the RDF is deemed necessary because a significant decrease of demand is anticipated due to material changes in the premises on which previous demand forecasts had been made or errors had been made during implementing the methodology for demand forecasts (2) when the RDF is deemed necessary because a project has been converted to a PPP project from a conventional government procured project (3) when more than five years have passed since the latest demand forecast had been conducted andor (4) when it is deemed necessary by the Minister of Strategy and Finance or the head of line ministry
The RDF virtually belongs to the MOSF In order to ensure objectivity and transparency during the RDF process the Minister of MOSF or the minister of the line ministry responsible for the RDF may contract a specialized institution(s) to conduct the RDF When the RDF is completed the Minister of MOSF notifies the minister of line ministries of the results When it is identified that the demand forecast for a project has decreased by 30 percent or more however the MOSF begins RSF and notifies the minister of line ministries in accordance with RSF guidelines
Performance of TPCM RSF and RDF
Table x8 shows the total number of Total Project Cost Management System (TPCM) projects and the projects in which the total project costs (TPC) were adjusted during 1994ndash2005 The total number of TPCM projects increased sharply in 1999 when the PIM system was established in a rigorous way The proportion of projects for which TPC were required shows an increase from 540 percent in 2002 to 718 percent in 2005 However the percentage of projects for
PAGE 24
K O R E A
P I M R E F O R M A F T E R T H E F I N A N C I A L C R I S I S C O U N T R Y C A S E S T U D Y K O R E A
PIM Reform after the Financial Crisis
2 0 1 2
T H E P O W E R O F P U B L I C I N V E S T M E N T M A N A G E M E N T
which the TPC rose by more than substantially decreased from 119 percent in 1996 to 37 percent in 2004
Table x8 Number of Projects with Substantial Change in TPC
Year No Projects under PCM (A)
No Projects that TPC adjusted (B)
BA() No Showing Increase in TPC by over 20 (C)
(C)(A) ()
1994 218 - -
1995 207 19 92
1996 159 19 119
1997 189 20 106
1998 183 17 93
1999 459 15 33
2000 483 24 50
2001 602 26 43
2002 602 325 540 10 17
2003 667 392 587 15 22
2004 698 493 706 26 37
2005 760 546 718
Source Internal data from the Ministry of Strategy and Finance
Table x9 shows that line ministries in charge of the projects requested an increase of KRW 196 trillion and about half (495 percent) of the requested amount (KRW 097 trillion) was adjusted into the TPC While 957 percent of requests for TPC increase due to miscellaneous design change were accepted by the MOSF only 432 percent of requests due to substantial design change were adjusted into the TPC
Table x9 Sources of in Total Project Cost Adjustment
Value of miscellaneous design changes KRW billions
Value of substantial design changes KRW billions Sum KRW billions
Request for TPC increase (A) 2331 17320 19651 Projects that TPC adjusted (B) 2253 7480 9733 (B)(A) () 967 432 495 Source Internal data from the Ministry of Strategy and Finance
Note Miscellaneous design changes include changes due to factors of traffic safety and unexpected ground conditions substantial design changes include changes in route change in type of bridges and tunnels and an increase in quantity to incorporate request by local government or local citizens
PAGE 25
K O R E A
P I M R E F O R M A F T E R T H E F I N A N C I A L C R I S I S C O U N T R Y C A S E S T U D Y K O R E A
PIM Reform after the Financial Crisis
2 0 1 2
T H E P O W E R O F P U B L I C I N V E S T M E N T M A N A G E M E N T
Table x10 shows the trend of requests for TPC increase in terms of percentage of TPC During 1996ndash99 the line ministries requested an increase of 264 percent of TPC and 421 percent of the requested amount was adjusted into the TPC During 2000ndash03 however the requests dropped to as low as 44 percent of TPC and the acceptance rate also decreased to 227 percent
Table x10 Trend of Requests for TPC Increase
TPC Increase requested
1996ndash99 2000ndash03
Request for TPC increase (A) 264 44
TPC adjusted (B) 111 10
(B)(A) () 421 227
Source Internal data from the Ministry of Strategy and Finance
Table x11 shows the number of RSF studies conducted by sector during 2003ndash09 Road projects take up the largest share in the sectoral distribution of RSF The RSFs on buildings (museums and tourism) takes up 177 percent in terms of the total number of RSFs conducted
Table x11 Number of RSF by Sector 2003ndash09
2003 2004 2005 2006 2007 2008 2009 Sum
Road 2 2 6 10(2) 9(1) 9(3) 28(7) 66
Railway 0 1(1) 0 0 2(1) 2 1 6
Port 0 0 0 0 3 2 3 8 Buildings (museums and tourism) 2 3 3 4 1 6(2) 1 20
Water resources (dam) 0 0 0 5 0 1 2 8
ITRampD 0 0 0 0 0 0 1(1) 1
Others 0 0 0 1 3 0 0 4
Total 4 6(1) 9 20(2) 18(2) 20(5) 36(8) 113(18)
Source Internal data from the Ministry of Strategy and Finance
Out of 113 projects 18 were suspended as a result of RSF evaluations The results show higher percentages of feasible projects relative to PFS because while PFS focuses on evaluating the feasibility of a project RSF puts relatively more emphasis on finding alternatives to cut down the size or cost of a project
Table x12 shows the change in TPC by RSF The sum of initial TPC for projects conducted in 2003ndash09 was KRW 273 trillion and the line ministries requested a total of KRW 424 trillion So the RSF results suggested adjusting the total TPC to 347 trillion implying that KRW 77 trillion or 181 of TPC requested were cut through the RSF
PAGE 26
K O R E A
P I M R E F O R M A F T E R T H E F I N A N C I A L C R I S I S C O U N T R Y C A S E S T U D Y K O R E A
PIM Reform after the Financial Crisis
2 0 1 2
T H E P O W E R O F P U B L I C I N V E S T M E N T M A N A G E M E N T
Table x12 Results of RSF (change in total project costs KRW billions)
Initial TPC (A) TPC requested (B)
TPC by RSF (C)
(D) =(C)-(B)
(D)(B) ()
2003 1587 6137 5491 ndash646 ndash105
2004 291 711 613 ndash97 ndash136
2005 842 1511 1039 ndash472 ndash313
2006 3954 6826 3788 ndash3039 ndash445
2007 4141 4801 4040 ndash761 ndash159
2008 10569 13579 11998 ndash1581 ndash116
2009 5936 8859 7762 ndash1097 ndash124
Total 27320 42424 34731 ndash7693 ndash181
Source Internal data from the Ministry of Strategy and Finance
Until 2009 only two RDFs have been conducted since the RDF was introduced in 2006 the fourth section of the Hamyang-Ulsan Expressway and Kyungin Cannel project Based on the results of RDFs the MOSF decided to reduce the total cost limits on both projects
Performance Management and Evaluation of Completed Projects Three-tier systems of performance management and evaluation of completed projects were
simultaneously introduced within the Ministry of Strategy and Finance (1) Performance Monitoring System (2) S elf-Assessment System and (3) In-Depth Evaluation System Table x13 explains the main features of these systems
PAGE 27
K O R E A
P I M R E F O R M A F T E R T H E F I N A N C I A L C R I S I S C O U N T R Y C A S E S T U D Y K O R E A
PIM Reform after the Financial Crisis
2 0 1 2
T H E P O W E R O F P U B L I C I N V E S T M E N T M A N A G E M E N T
Table x13 Systems of Performance Management and Evaluation
Performance Monitoring Self-Assessment In-Depth Evaluation
Method
Establish objectives and indicators and use the results in government budget operation (Prepare performance report)
Provide a check list of projects for review and keep track of which projects are operated properly and which are making progress and so on
Apply scientific evaluation methods to each project to analyze spot problems and provide an alternative (Prepare evaluation report)
Main responsible body
Each ministry (Budget Division) Each Ministry (Budget division) and budget authority
Each Ministry (Project Management Division)
Applicable project
All policies and programs 20ndash30 of all Individual programs and projects
Merits
An overall progress report can be completed but not enough information can be given on individual project basis
Trade-off between Performance Monitoring and Program Evaluation
Detailed information can be given on an individual project basis but due to excessive time and costs this method is not suitable for all projects
Application
Used in management of performance of an organiza-tion as reference material for setting budget and in preparation of performance budget report
Used in improvement of project operating method and as (deliberation) reference for setting budget
Used in improvement of project operating method
Source Ministry of Strategy and Finance
Performance Monitoring System
The Performance Monitoring System (PMS) which started in the spring of 2003 requires line ministries to set up performance goals and indicators prepare annual performance plans and performance reports and submit them to the MOSF at the start of the annual budget cycle The MOSF is in charge of ensuring the system is in place by examining the status of PMS in line ministries coordinating the implementation and feeding the results back to resource allocation
PMS covers only part of the ministriesrsquo investment programs as those activities not involving large sums of expenditure (such as pure policy-making) are excluded from performance monitoring In addition activities for which the benefits of performance monitoring are expected to be small (such as wages and salaries ldquobasic programrdquo expenditures10 and general administrative expenses) are excluded as well
A performance report describes in a systematic way the degree to which program goals have been met It should list performance goals and indicators as originally set out in the performance plan describe the level of performance in terms of these goals and indicators explain the reasons for any poor performance summarize the assessment and describe future plans Optionally it can include audit results by the Board of Audit and Inspection and summarize findings of program evaluations
PAGE 28
K O R E A
P I M R E F O R M A F T E R T H E F I N A N C I A L C R I S I S C O U N T R Y C A S E S T U D Y K O R E A
PIM Reform after the Financial Crisis
2 0 1 2
T H E P O W E R O F P U B L I C I N V E S T M E N T M A N A G E M E N T
PMS will provide one source of information for budget allocation across sectors and programs Line ministries should present performance information when requesting budgets and the MOSF will utilize it when preparing the medium term National Fiscal Management Plan and drafting the budget
The PMS like its pilot project has not been very successful so far It received only lukewarm support from the top management in the MOSF Line ministries also showed little enthusiasm for the PMS In most cases performance indicators prepared by line ministries were not derived from ministerial missions in a systematic fashion Most importantly performance reports were not open to the public giving little incentive for line ministries to think seriously about the exercise
Program Review System Self-Assessment of Budgetary Programs
The Program Review System for Self-Assessment of Budgetary Programs (SABP) was introduced in 2005 by the MOSF to enhance links between performance evaluation and budget allocation It was designed after the Program Assessment Rating Tool (PART) of the US Government This program requires line ministries to assess their own programs with spending levels above a certain threshold The assessment was intended to cover all ministerial programs in a cycle of three years The assessment is based on 14 questions common to all types of programs and a few additional questions specific to different types of programs11 Table x14 shows the contents of checklist for the SABP
Table x14 Contents of Checklist for the SABP
Classification ( points weight of rating) Checklists
Design and planning (30)
y Program purpose y Rationale for government spending y Duplication with other programs y Efficiency of program design y Relevance of performance objectives and indicators y Relevance of performance targets
Management (20)
y Monitoring efforts y Obstacles of program implementation y Implementation as planned y Efficiency improvement or budget saving
Results and accountability (50)
y Independent program evaluation y Results y Satisfaction of citizens y Utilization of evaluation results
Source Park (2008)
A pilot SABP for government-financed projects was introduced in 2005 with input from various ministries and experts and a guideline for SABP was then distributed to each ministry Each ministry was to execute a self-evaluation and submit the results to the MOSF within two
PAGE 29
K O R E A
P I M R E F O R M A F T E R T H E F I N A N C I A L C R I S I S C O U N T R Y C A S E S T U D Y K O R E A
PIM Reform after the Financial Crisis
2 0 1 2
T H E P O W E R O F P U B L I C I N V E S T M E N T M A N A G E M E N T
months The evaluation took place within 40 departments of the relevant ministries for 555 projects budgeted at a total of KRW 35 trillion in project costs While the MOSF reviewed the results the relevant ministries were allowed to submit any questions or objections at two different intervals and these were reviewed again
The results of the SABP for 2005ndash07 are shown in figure x10 During the period a total of 1716 sub-programs were assessed for performance in fiscal years 2004 2005 and 2006 The figure shows the distribution of the total scores across the programs In 2005 the proportion of sub-programs in different departments in the ministries that were rated as ineffective was 157 percent and 52 percent of the programs were rated as effective The distribution of sub-program ratings did not change much between 2005 and 2006 but it improved in 2007 The proportion of ineffective programs dropped to 5 percent and that of effective sub-programs doubled This change in sub-program ratings in 2007 is attributed to the improvement of sub-program performance and agencies learning from a couple of yearsrsquo experience with SABP
Figure x10 Result of Self-Assessment of Budgetary Programs 2005ndash07 of total ratings
Source Park (2008)
Table x15 explains the linkage between SABP results and budget allocation in 2007 The programs rated as ineffective went through a 53 percent budget cut compared to the 2006 budget The main reason for this linkage between SABP results and budget allocation is that MOSF encouraged ministries to make use of assessment results in their budget requests announcing that a 10 percent of budget cut would be imposed on the programs rated as ineffective
PAGE 30
K O R E A
P I M R E F O R M A F T E R T H E F I N A N C I A L C R I S I S C O U N T R Y C A S E S T U D Y K O R E A
PIM Reform after the Financial Crisis
2 0 1 2
T H E P O W E R O F P U B L I C I N V E S T M E N T M A N A G E M E N T
Table x15 Linkage between SABP results and Budget Allocation 2007 KRW millions
2006 Budget
(A)
2007 Budget
(B) (B)-(A)
(B-A)(A)
()
Effective 889 887 -2 ndash02
Moderately Effective 3316 3565 249 75
Adequate 29718 28997 -721 ndash24
Ineffective 1143 538 ndash605 ndash529
Total 35066 33987
Source Park (2008)
Program Evaluation System In-Depth Evaluation Program
Under the current legal and administrative framework two methods of performance evaluation of public infrastructure investment are available One is performance evaluation as stipulated by the Enforcement Decree of Construction Technology Management Act The other one is In-depth Evaluation of Budgetary Programs (IEBP) under the Performance Management System12 IEBP analyzes the different factors that at different stages contribute to the performance of a government program by using scientific and systematic techniques The IEBP results are applied to improve and reform the system of operating programs
The Enforcement Decree of the Act requires the spending agency to file a performance evaluation report for construction projects whose total costs are KRW 50 billion or more In accordance with the Act MLTM established ldquoGuidelines for Performance Evaluations of Construction Projectsrdquo effective as of 2001 The guidelines outline the necessary details including the timing and methodologies for conducting performance evaluations required by government agencies These guidelines suggest that the performance evaluations be based on the Design and Implementation Evaluation Report and the Project Completion Report while comprehensively referring to all related materials including the (Pre-feasibility) Feasibility Study results
Despite the stipulation of the Enforcement Decree of the Construction Technology Management Act that requires the spending agency to file a performance evaluation report within three years of completion only a small number of performance evaluations were conducted until 2009 One reason is that there was no sanction against violation of the decrees thus the spending agencies have no incentive to implement these self-evaluations To draw lessons learned through the evaluation it is necessary to find some problems during the implementation process of the project The line ministry which is supposed to coordinate the evaluation did not take an active interest in this new system The other reason for slow progress in performance evaluation is that no clear framework for evaluation had been established A performance evaluation tracks whether a project or program achieves its objectives and secures the expected outcome The basic questions to be determined are what and how to evaluate However many projects have no clear concept of performance to be achieved by public investment For example many road construction projects under the national highway system have been regarded as just ldquonaturalrdquo It is not rare to find a statement of purpose for a road construction project that requires more than hundreds of billions
PAGE 31
K O R E A
P I M R E F O R M A F T E R T H E F I N A N C I A L C R I S I S C O U N T R Y C A S E S T U D Y K O R E A
PIM Reform after the Financial Crisis
2 0 1 2
T H E P O W E R O F P U B L I C I N V E S T M E N T M A N A G E M E N T
of KWS written in a single line ldquoTo relieve traffic congestionrdquo Since the basic concept of performance evaluations is to assess whether a project or a program achieves its objectives unless there is a clear target for a project or a program any assessment is going to be difficult
Under IEBP from 2005 to 2009 a total of 45 programs were evaluated initiated and controlled by the MOSF team With a wide coverage of areas for IEBP programs the MOSF seemingly tended to distribute the programs relatively evenly across line ministries Budgetary size was not considered as an essential criterion since half of the selected programs had an annual budget of less than KRW 100 billion The period of program implementation varies from program to program half of the programs had been in operation from four to ten years before being evaluated Although in principle IEBP was established for a single program eight programs containing three or more unit programs had been evaluated
IEBP still has a lot of trouble with implementing and feeding back results Since the availability of its database was strictly limited only 20 percent of the evaluation studies were subject to empirical analysis Data for evaluation analysis often does not exist and even when it does government officials in line ministries and agencies have given little attention to it The selection process for each IEBP has sometimes proved to be a tricky process since different purposes and approaches were taken by the MOSF and line ministries
Lessons Learned and Challenges Ahead The period after the economic crisis in 1997 witnessed many reform efforts intended to
enhance efficiency and transparency in developing and managing public infrastructure investment programs in Korea The MOSF has played a leading role in implementing an effective appraisal and evaluation system tightening the expenditure monitoring of total project cost and introducing a new budgeting system called the Medium Term Expenditure Framework (MTEF) In the past line ministries had ownership of the feasibility study process while the finance ministry used it to cut project budgets although not always on a reasonable basis With the reforms MOSF now makes the final decision on the project appraisal and determines the budget for it while the line ministries are responsible for identifying designing prioritizing and forecasting the effects of the project MOSF established a separate PIM Department responsible for the PIM reforms of PFS TPCM and RSF and these systems now mitigate information asymmetry between the finance ministry and line ministries and lead to better decision-making
The preliminary feasibility study (PFS) begun in 1999 and independently conducted mainly by the PIMAC at KDI seems to have been successful in handling the pass-or-fail hurdle of the project selection process An independent review of PFS by PIMAC used some help from policy analysts to make judgments on project desirability and their judgments were respected in most Government decision-making If policy analysis played merely a symbolic role and politicians and bureaucrats had disincentives to use this policy analysis such an independent judgment could not be made
PAGE 32
K O R E A
P I M R E F O R M A F T E R T H E F I N A N C I A L C R I S I S C O U N T R Y C A S E S T U D Y K O R E A
PIM Reform after the Financial Crisis
2 0 1 2
T H E P O W E R O F P U B L I C I N V E S T M E N T M A N A G E M E N T
The total project cost management system (TPCM) strengthened after the crisis appears to be working satisfactorily by limiting the frequency and amount of TPC increases in line ministries A reassessment study of feasibility (RSF) has been introduced as an innovative tool to control the total project cost limit in the middle of TPCM although there have been a few projects cancelled by RSF However the introduction of the performance monitoring and evaluation system is still lagging behind in Korea A greater emphasis on program evaluation is needed Once the Government adopts a performance orientation it can then encourage a greater use of performance contracts
Initiation of PFS in 1999 was a first step in the reform of PIM system in Korea which gave the Government the impetus to produce an effective sequencing of reforms in parallel with the project cycles with RSF and RDF coming later and then implementing performance evaluation last In order to improve the objectivity of the evaluation and secure consistency among projects standard evaluation and decision-making guidelines and manuals have been developed and published by the MOSF and PIMAC Sector guidelines and manuals in line ministries apply the same methodology and use the same or similar datasets for different projects in the same sector
The new PIM process and its capital budgeting has rooms for improvement The capacity for planning and prioritizing public investment programs in line ministries should be enhanced The planning and budget divisions of individual line ministries should play a greater role in the coordination of ministerial policies and budget requests unlike in previous years when they would simply compile budget requests from program divisions and send them to the MOSF with little modification The role of the MOSF should be changed as well As a central coordinator of government policies the MOSF should strengthen its capacity for policy analysis and long-term forecasts It should put less stress on input control and pay more attention to outputs and outcomes
PAGE 33
K O R E A
P I M R E F O R M A F T E R T H E F I N A N C I A L C R I S I S C O U N T R Y C A S E S T U D Y K O R E A
PIM Reform after the Financial Crisis
2 0 1 2
T H E P O W E R O F P U B L I C I N V E S T M E N T M A N A G E M E N T
Notes 1 Other social insurance programsmdashIndustrial Accident Insurance (1964) National Pension
(1988) and Employment Insurance (1995)mdashwere introduced and expanded in a similar fashion but their impact on total spending has been rather limited until recently
2 1 Examples include the West Coast Expressway Seoul-Busan High-speed Railroad and Incheon International Airport Even though such infrastructure investment takes the lionrsquos share of the spending on economic affairs it should be noted that the latter also includes subsidies to producers (farmers small and medium-sized enterprises and so on) and other possibly unproductive spending
3 1 von Hagen and Harden (1996) described two approaches to budgeting Under a target-based approach the Government collectively negotiates a set of binding numerical targets for the budget The budget process starts with negotiations among concerned parties over binding limits on the spending total or budget deficits Once these limits have been agreed upon they must be observed during the remainder of the budget process On the other hand under a strategic dominance-based approach the budget process vests the budget authorities with special strategic powers
4 1 In front-loading exercises the MOSF would allocate more funds than usual to the first half of the year and urge line ministries to spend the allocated funds as early as possible When necessary that is when growth is slower than expected despite front-loading the MOSF would consider introducing supplementary funds in the latter half of the year
5 5Potter and Diamond (1999) Schiavo-Campo and Tommasi (1999) and World Bank (1998) provide a useful guide on the reform in this direction
6 1 Ceilings are set for 14 spending areas such as social infrastructure agriculture education and environment then disaggregated into 56 programs for example social infrastructure has seven programs including roads railways subways ports airports housing and water resources Separate ceilings are also set within each program for the general account and various special accounts and funds
7 The former body of MPB was the Board of Planning and Budget which merged with the Office of National Budget to create MPB in May 1999 Subsequently merging with the Ministry of Finance and Economy the MPB became the MOSF in 2008
8 In January 2005 the Government of Korea passed an amendment to the 1999 Act on Private Participation in Infrastructure establishing the Public and Private Infrastructure Investment Management Center (PIMAC) as a new unit PIMAC is a merger between Private Infrastructure Investment Center of Korea (PICKO) of Korea Research Institute for Human Settlements established in 1999 and PIMA of KDI
9 The hierarchy of the legal framework in Korea is as follows ConstitutionndashActndashEnforcement DecreesndashMinisterial Ordinance
10 In Korea programs with small and recurrent costs are designated as ldquobasic programsrdquo after negotiation between line ministries and the MOSF Others are designated as ldquomajor programsrdquo
11 Types of programs are infrastructure investment procurement of large-scale facilities and equipment provision of direct services capital injection subsidies to private entities grants to local governments and RampD
PAGE 34
K O R E A
P I M R E F O R M A F T E R T H E F I N A N C I A L C R I S I S C O U N T R Y C A S E S T U D Y K O R E A
PIM Reform after the Financial Crisis
2 0 1 2
T H E P O W E R O F P U B L I C I N V E S T M E N T M A N A G E M E N T
12 As was pointed out Korea introduced the three-tier system for performance management and evaluation of budgetary programs performance monitoring program review and program evaluation IEBP is a core part of program evaluation
Bibliography Bank of Korea (var years) ldquoDatabase on Flow of Funds Accountsrdquo Bank of Korea Seoul
Kim Jay-Hyung 2003 Developing a Performance Evaluation System in Korea Edited by Chae-hyong
Kim Jay-Hyung 2012 ldquoPublic Investment Management Reform in Korea Efforts for Enhancing Efficiency and Sustainability of Public Expenditurerdquo Korea Development Institute
Kim and Hanguk Kaebal Yonguwon Seoul Korea Korea Development Institute
Koh Youngsun 2005 ldquoReforming the Fiscal Management System in Koreardquo Working paper Korea Development Institute Seoul Korea
Korea Development Institute 2004 The Standard Guideline for Preliminary Feasibility Studies on Road and Railway Projects 4th ed (in Korean) Seoul Korea Korea Development Institute
Ministry of Planning and Budget Korea 2007a ldquoGuidelines for Preliminary Feasibility Study Systemrdquo (in Korean) MOPB Government of Korea Seoul
Ministry of Planning and Budget Korea 2007b ldquoGuidelines for Total Project Cost Management Systemrdquo (in Korean) MOPB Government of Korea Seoul
MOCT (Ministry of Construction and Transportation Korea 1999 ldquoComprehensive Plan for Public Investment Budget Savingsrdquo(in Korean) MOCT Government of Korea Seoul
MOSF (Korea Ministry of Strategy and Finance) Government Finance Statistics in Korea various issues MOSF Government of Korea Seoul
MOSF (Korea Ministry of Strategy and Finance) various years National Statement for Current Bonds respective year MOSF Government of Korea Seoul
mdashmdashmdash various years National Statement for Current Bonds respective year MOSF Government of Korea Seoul
National Assembly Budget Office Korea 2004 ldquoSome Points at Issue in Preliminary Feasibility Study and Its Future Directionrdquo (in Korean) [[]] Government of Korea Seoul
OECD (Organisation for Economic Co-operation and Development) Various years Economic Surveys Korea Paris OECD
Perrin Burt 2002 ldquoImplementing the Vision Addressing Challenges to Results-focused Management and Budgetingrdquo Paris OECD
PAGE 35
K O R E A
P I M R E F O R M A F T E R T H E F I N A N C I A L C R I S I S C O U N T R Y C A S E S T U D Y K O R E A
PIM Reform after the Financial Crisis
2 0 1 2
T H E P O W E R O F P U B L I C I N V E S T M E N T M A N A G E M E N T
Park Nowook 2008 ldquoPerformance-oriented Budgeting in Korea Evidence and Lessonsrdquo Korea Institute of Public Finance Seoul
Potter Barry H and Jack Diamond 1999 Guidelines for Public Expenditure Management Washington DC International Monetary Fund
Schiavo-Campo Salvatore and Daniel Tommasi 1999 Managing Government Expenditure Manila Asia Development Bank
von Hagen Jurgen and Ian Harden 1996 ldquoBudget Processes and Commitment to Fiscal Disciplinerdquo IMF Working Paper WP9678 International Monetary Fund Washington DC
World Bank 1998 Public Expenditure Management Handbook Washington DC World Bank
2004 The General Guideline for Preliminary Feasibility Studies 4th ed (in Korean) Seoul Korea Korea Development Institute
mdashmdashmdash various years Korea Consolidated Fiscal Balance MOSF Government of Korea Seoul
mdashmdashmdash 2005a Annex to Summary of 2005 Budget MOSF Government of Korea Seoul
mdashmdashmdash 2005b Performance Management Handbook MOSF Government of Korea Seoul
World Bank 2003 ldquoWorld Development Indicatorsrdquo World Bank Washington DC
1 Other social insurance programsmdashIndustrial Accident Insurance (1964) National Pension (1988) and Employment Insurance (1995)mdashwere introduced and expanded in a similar fashion but their impact on total spending has been rather limited until recently
2 Examples include the West Coast Expressway Seoul-Busan High-speed Railroad and Incheon International Airport Even though such infrastructure investment takes the lionrsquos share of the spending on economic affairs it should be noted that the latter also includes subsidies to producers (farmers small and medium-sized enterprises and so on) and other possibly unproductive spending
3 von Hagen and Harden (1996) described two approaches to budgeting Under a target-based approach the Government collectively negotiates a set of binding numerical targets for the budget The budget process starts with negotiations among concerned parties over binding limits on the spending total or budget deficits Once these limits have been agreed upon they must be observed during the remainder of the budget process On the other hand under a strategic dominance-based approach the budget process vests the budget authorities with special strategic powers
4 In front-loading exercises the MOSF would allocate more funds than usual to the first half of the year and urge line ministries to spend the allocated funds as early as possible When necessary that is when growth is slower than expected despite front-loading the MOSF would consider introducing supplementary funds in the latter half of the year
5Potter and Diamond (1999) Schiavo-Campo and Tommasi (1999) and World Bank (1998) provide a useful guide on the reform in this direction
6 Ceilings are set for 14 spending areas such as social infrastructure agriculture education and environment then disaggregated into 56 programs for example social infrastructure has seven programs including roads railways subways ports airports housing and water resources Separate ceilings are also set within each program for the general account and various special accounts and funds
7 The former body of MPB was the Board of Planning and Budget which merged with the Office of National Budget to create MPB in May 1999 Subsequently merging with the Ministry of Finance and Economy the MPB became the MOSF in 2008
8 In January 2005 the Government of Korea passed an amendment to the 1999 Act on Private Participation in Infrastructure establishing the Public and Private Infrastructure Investment Management Center (PIMAC) as a new unit PIMAC is a merger between Private Infrastructure Investment Center of Korea (PICKO) of Korea Research Institute for Human Settlements established in 1999 and PIMA of KDI
9The hierarchy of the legal framework in Korea is as follows ConstitutionndashActndashEnforcement DecreesndashMinisterial Ordinance
10 In Korea programs with small and recurrent costs are designated as ldquobasic programsrdquo after negotiation between line ministries and the MOSF Others are designated as ldquomajor programsrdquo
PAGE 36
K O R E A
P I M R E F O R M A F T E R T H E F I N A N C I A L C R I S I S C O U N T R Y C A S E S T U D Y K O R E A
PIM Reform after the Financial Crisis
2 0 1 2
T H E P O W E R O F P U B L I C I N V E S T M E N T M A N A G E M E N T
11 Types of programs are infrastructure investment procurement of large-scale facilities and equipment provision of direct services capital injection subsidies to private entities grants to local governments and RampD
12 As was pointed out Korea introduced the three-tier system for performance management and evaluation of budgetary programs performance monitoring program review and program evaluation IEBP is a core part of program evaluation
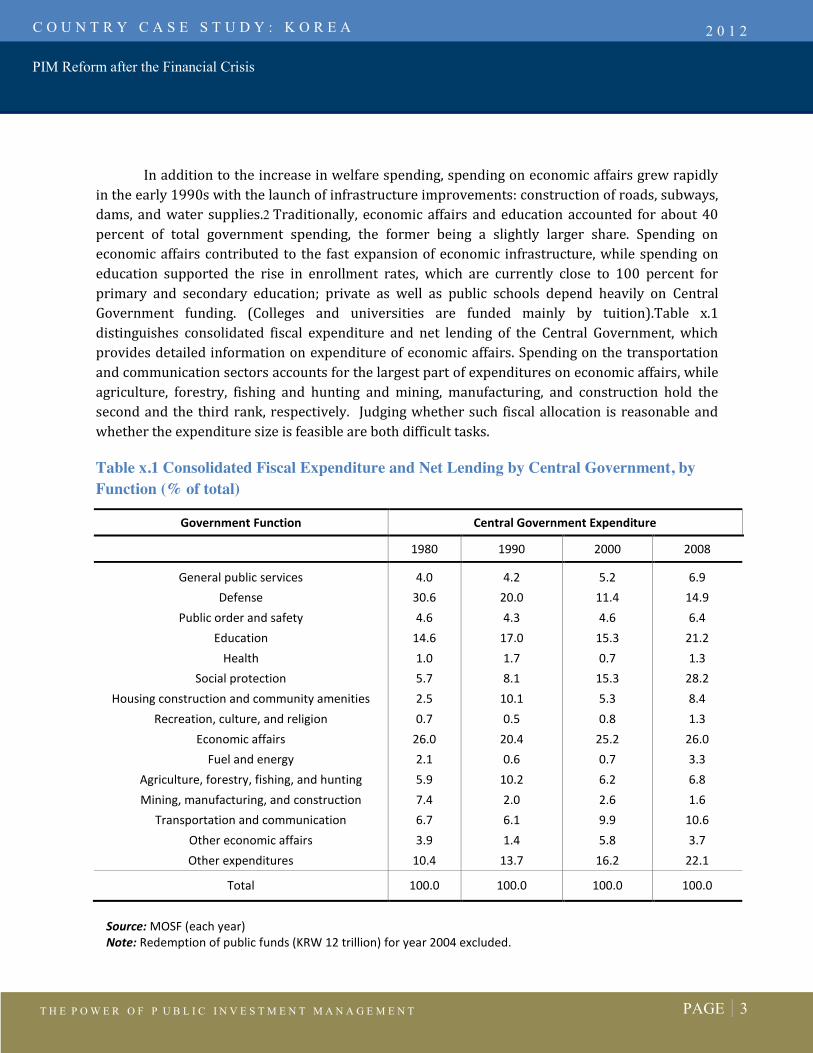