the reports of the death of active investing have been
TRANSCRIPT

For Professional Investors and Advisers Only
February 2017
The Reports of the Death of Active Investing have been Greatly Exaggerated
RWC Equity IncomeInvestor letter Q1 2017

www.rwcpartners.com | E [email protected] | Authorised and regulated by the Financial Conduct Authority
Portfolio Managers
Ian Lance, Nick Purves and John Teahan have managed funds together for over 10 years. Their loyalty and experience is leading within the industry and has awarded them a number of accolades. Ian, Nick and John joined RWC Partners in 2010 to establish the Equity Income team and now manage over £3.5 billion for their clients.
The team’s approach fully integrates conviction led, value-based stock selection with a distinctive and technical approach to stablising assets, with the aim of delivering investment solutions that both grow investors’ assets and protect the purchasing power of capital and income.
Does active management still work? The answer is yes – when funds are managed within a truly active construct.
In this edition of our Investor Letter Ian Lance scrutinises the relative merits and pitfalls of active, passive and “smart beta” investing.

RWC Partners Limited 60 Petty France, London SW1H 9EU | T +44 (0)20 7227 6000 | F +44 (0)20 7227 6003
RWC Equity Income 3
The difficulties facing active fund managers have been widely reported1. Looking at the charts below, the flows out of active and into passively managed funds have been very significant over the last decade and the fact that this transition has occurred in a virtually straight line suggests that much of it has been driven by fees
demanded for passive exposure falling continuously over this time period. The conclusion seems to be that active fund managers have over charged and under delivered for too long, enriching themselves at their clients’ expense and are now getting their comeuppance2.
1 For instance ‘Large investors pull $350bn from active equity funds’ FTFM December 11, 2016
2 This view has been endorsed by the FCA in their recent report in to active management
Active versus Passive versus Smart Beta
2500
2000
1500
1000
500
0
-500
-1000
-1500
-2000
Jan-
00
Jul-0
1
Jan-
03
Jan-
04
Jan-
06
Jul-0
7
Jan-
09
Jul-1
0
Jan-
12
Jul-1
3
Jan-
15
Jul-1
6
USD
bn
40
35
30
25
20
15
10
5
0
Jan-
00
Jul-0
1
Jan-
03
Jan-
04
Jan-
06
Jul-0
7
Jan-
09
Jul-1
0
Jan-
12
Jul-1
3
Jan-
15
Jul-1
6
%
2500
2000
1500
1000
500
0
-500
-1000
-1500
-2000
Jan-
00
Jul-0
1
Jan-
03
Jan-
04
Jan-
06
Jul-0
7
Jan-
09
Jul-1
0
Jan-
12
Jul-1
3
Jan-
15
Jul-1
6
USD
bn
40
35
30
25
20
15
10
5
0
Jan-
00
Jul-0
1
Jan-
03
Jan-
04
Jan-
06
Jul-0
7
Jan-
09
Jul-1
0
Jan-
12
Jul-1
3
Jan-
15
Jul-1
6
%
2500
2000
1500
1000
500
0
-500
-1000
-1500
-2000
Jan-
00
Jul-0
1
Jan-
03
Jan-
04
Jan-
06
Jul-0
7
Jan-
09
Jul-1
0
Jan-
12
Jul-1
3
Jan-
15
Jul-1
6
USD
bn
40
35
30
25
20
15
10
5
0
Jan-
00
Jul-0
1
Jan-
03
Jan-
04
Jan-
06
Jul-0
7
Jan-
09
Jul-1
0
Jan-
12
Jul-1
3
Jan-
15
Jul-1
6
%
FIGURE 1: GLOBAL FLOWS INTO A PASSIVE EQUITY FUND
FIGURE 2: GLOBAL PASSIVE EQUITY FUND SHARE OF TOTAL EQUITY FUND NET ASSETS
Source: EPFR Global and Bernstein analysis, 01 January 2000 - 31 July 2016 Source: EPFR Global and Bernstein analysis, 01 January 2000 - 31 July 2016
Passive Active

www.rwcpartners.com | E [email protected] | Authorised and regulated by the Financial Conduct Authority
The strange thing is, despite being an active fund manager for all of my career, I can completely sympathise with those who have made this transition, as in aggregate I do not think the fund management industry has done a great job over the last few years. Passive investing has been a force for good in that it has brought down active fees which, although justified in the 1960s to 1980s, became unsustainable given the increased scale of the industry and advances in technology that occurred in the following decades. In addition, as expected returns fell, so fees ate a greater proportion of them and also implied a need for costs to fall. What worries me about the stampede towards passive investing is that the financial services industry has an unfortunate habit of over selling products by over-playing their positive aspects whilst under-playing the pitfalls and I believe we have reached this stage in the active/passive debate. In this note I will attempt to even up the debate by highlighting some of these pitfalls but first let us start by looking at some of the arguments used by the passive industry against active investing.
Argument 1: Investing is a zero sum game therefore the median fund manager cannot outperform
Across the entire equity market, this is true but that does not mean it also holds across actively managed equity funds since they are NOT the entire market. If we take the example of the US, the equity market is $38 trillion but when one considers the amount of this owned by large pensions and endowments, private investors, and corporates themselves, the segment owned by active mutual funds is only $3.6 trillion (about 9%)3. Mathematically speaking anyway, there is no reason why the average active mutual fund manager cannot outperform.
Argument 2: 86% of active funds fail to beat their benchmarks after fees
When accompanied by a chart such as the one below, the high percentage of active funds that fail to beat their benchmark is a very powerful narrative in favour of passive investing4.
3 Is active management dead? Not even close by Jason Voss 26 July 2016
4 Active managers defend their performance record by Madison Marriage FTFM 24 March 2016
FIGURE 3: PERCENTAGE OF ACTIVE EQUITY FUNDS THAT FAILED TO BEAT THEIR BENCHMARK
0
20
40
60
80
100
1 1053
Investment timeline (years)
Source: SPIVA, 2015
Denmark France Netherlands Spain Switzerland
RWC Partners Limited 60 Petty France, London SW1H 9EU | T +44 (0)20 7227 6000 | F +44 (0)20 7227 6003
RWC Equity Income 5
Here of course, I am not disputing the result but it is a clever use of a limited amount of statistics. For instance, a chart of the percentage of passive funds that underperform their benchmarks after fees would show 100% in each country. They are designed to give the market return less fees so mathematically they will all underperform (some more than others).
In addition, the data used does not tell us about the distribution or range of returns hence it could be that the average active manager is only underperforming by 5bp whilst all passive managers are underperforming by 10bps. We also don’t know how much those who succeeded actually outperformed by. If the answer is 4% p.a. then it would suggest the additional return is worth looking for. We don’t know anything about the size of the funds (is the 90% figure made up of ninety small funds which underperformed whilst ten large ones outperformed?). Moreover were the ninety funds low tracking error, low active share funds and the ten winners all focused funds? More data is needed to be able to make a reasonable judgement here and yet the narrative is clearly ‘there is no sense in investing in active funds’.
Argument 3: Outperformance does not persist, therefore there is no reason to own active funds
One study I have seen looks at fund managers consistently in the top quintile for five years and then asks how many of them are in the top quintile in the following five years5. Since the answer is not many6, the conclusion is that active management is not worth paying for. Yet again, this is highly misleading since the question to ask is who was in the top quintile for the ten years – whether they got there by being first quintile followed by third or vice versa is almost entirely irrelevant.
What you need to know about passive investing
The articles trashing active management rarely seem to balance their criticism by highlighting the pitfalls of passive investing which we now consider.
Passive investing automatically overweights expensive shares and underweights cheap ones
The vast majority of passive investing is done via mainstream cap weighted index-based instruments. For anyone who believes in the long term merits of value investing, passive investing should make little sense since it is the antithesis: passive investing structurally overweights expensive stocks whilst underweighting cheap stocks. Passive investors in 2000 were allocating large chunks of their money to bubble stocks like Cisco, Sun and Yahoo, and also to accounting frauds like Enron and Worldcom which were on their way to zero. This negative aspect of passive investing is demonstrated by the fact that index returns can be improved just by equal weighting, or weighting by a variable such as sales. In fact, a piece of research by Rob Arnott showed that you can use virtually any methodology to weight a portfolio and it will outperform a cap weighted one because it introduces value and small cap tilts in to the portfolio7.
Do not confuse tracking error risk with risk of losing money
In yet another recent article entitled ‘The end of active investing’8 Charles D Ellis stated:
‘As indexing earns higher returns at lower cost and with less risk and less uncertainty, the world of active management will be taken down, firm by firm, from its once dominant position.’
Mr Ellis does not explain what he means by ‘risk’ but since he states that passive investing is less risky, then I can only assume he is talking about tracking error here. For Mr Ellis, buying the market at today’s elevated levels thus represents ‘low risk’ whereas to me it looks very risky.
5 ‘The case for low-cost index-fund investing’ by Harbron, Roberts and Rowley, Vanguard Research August 2016
6 The actual figure is 16.2% which does actually indicate that about 1 in 6 managers were able to outperform on a sustainable basis.
7 The Surprising “Alpha” from Malkiel’s Monkey and Upside-Down Strategies
8 The end of active investing by Charles D Ellis Financial Times 20 Jan 2017

www.rwcpartners.com | E [email protected] | Authorised and regulated by the Financial Conduct Authority
Passive investing will blindly follow bubbles up and then back down again. For instance, Japan was 17% of MSCI World in 1982, going on to peak at 41% in 1989 before falling back to 12% in 1997.
Despite performing in line with the index, those investors who suffered a 78% loss from the peak may question whether this was a good outcome.
There are times when the market return is good enough, but now is not one of them
Many people investing in the stock market are doing so on the basis that they want to be able to fund some future liability and hence will often have a required return on their investment which will enable
them to meet that liability. A good example here would be pension funds and by looking at the return assumptions of the pension funds of the biggest US and UK companies, we can get a feel for those required returns.
FIGURE 4: S&P 500 INDEX
FIGURE 5: NIKKEI INDEX
2500
2000
1500
1000
500
0
Is this really a ’low risk’ investment?
1977
1979
1981
1983
1985
1987
1989
1991
1993
1995
1997
1999
2001
2003
2005
2007
2009
2011
2013
2015
45000
40000
35000
30000
25000
20000
15000
10000
5000
0
1970
1971
1973
1974
1976
1977
1979
1980
1982
1983
1985
1986
1988
1989
1991
1992
1994
1995
1997
1998
2000
2001
Source: Bloomberg, 31 January 1977 - 31 January 2017
Source: Bloomberg, 31 January 1970 - 31 January 2003
RWC Partners Limited 60 Petty France, London SW1H 9EU | T +44 (0)20 7227 6000 | F +44 (0)20 7227 6003
RWC Equity Income 7
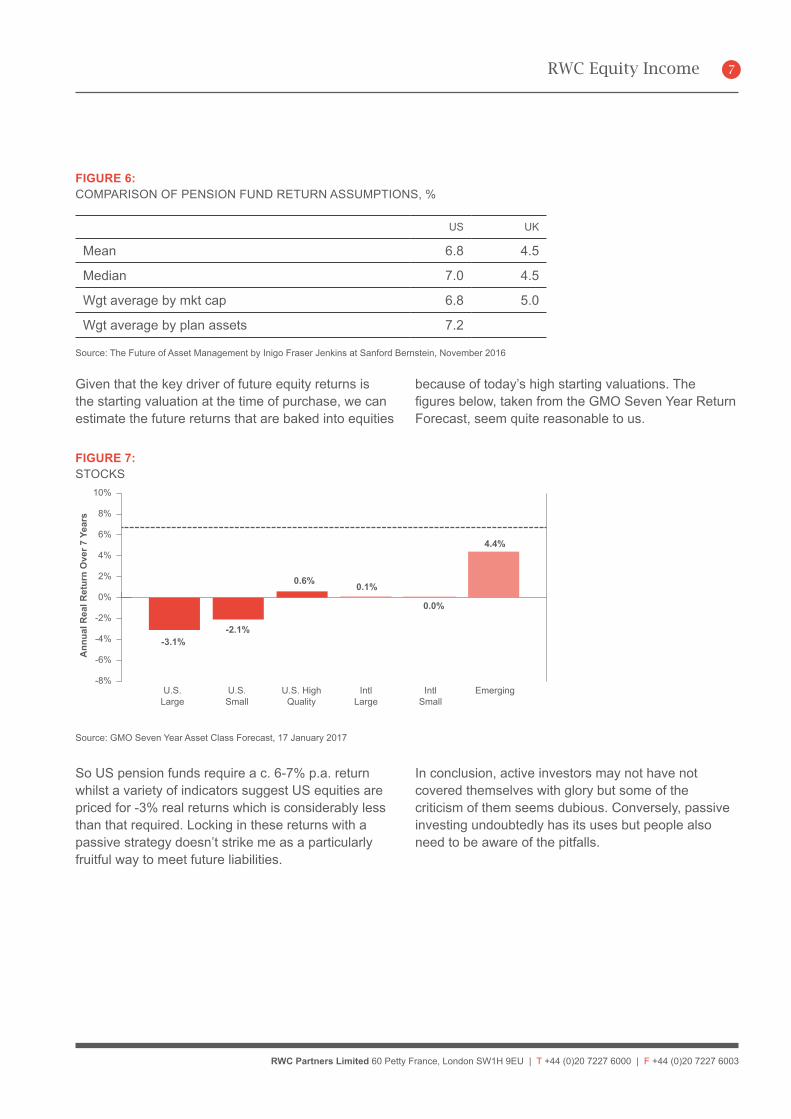
So US pension funds require a c. 6-7% p.a. return whilst a variety of indicators suggest US equities are priced for -3% real returns which is considerably less than that required. Locking in these returns with a passive strategy doesn’t strike me as a particularly fruitful way to meet future liabilities.
In conclusion, active investors may not have not covered themselves with glory but some of the criticism of them seems dubious. Conversely, passive investing undoubtedly has its uses but people also need to be aware of the pitfalls.
FIGURE 6: COMPARISON OF PENSION FUND RETURN ASSUMPTIONS, %
US UK
Mean 6.8 4.5
Median 7.0 4.5
Wgt average by mkt cap 6.8 5.0
Wgt average by plan assets 7.2
Source: The Future of Asset Management by Inigo Fraser Jenkins at Sanford Bernstein, November 2016
Given that the key driver of future equity returns is the starting valuation at the time of purchase, we can estimate the future returns that are baked into equities
because of today’s high starting valuations. The figures below, taken from the GMO Seven Year Return Forecast, seem quite reasonable to us.
FIGURE 7: STOCKS
-8%
-6%
-4%
-2%
0%
2%
4%
6%
8%
10%
-3.1%-2.1%
0.6% 0.1%
0.0%
4.4%
U.S.Large
EmergingIntlSmall
IntlLarge
U.S. HighQuality
U.S.Small
Ann
ual R
eal R
etur
n O
ver 7
Yea
rs
Source: GMO Seven Year Asset Class Forecast, 17 January 2017

www.rwcpartners.com | E [email protected] | Authorised and regulated by the Financial Conduct Authority
A third way – smart beta
The debate between active and passive has now moved on to a third option which is frequently referred to as ‘smart beta’. This is a systematic rules-based form of investing in which asset classes are broken down in to factors that explain their risk return and correlation, which allows investors to remodel their portfolios by allocating assets to risk factors such as value, size, market, low volatility, term and credit. The move away from active equity mutual funds and into index funds, ETFs and hedge funds is being driven largely by investors’ desire to move away from funds that provide a total market exposure, and into funds that provide exposure to beta, macro factors, sector, style and idiosyncratic risks separately, or packaged together as required, and importantly, at a conservative price.
Once more, I have no problem with smart beta other than, yet again, I think it has been oversold. Thus the
three good things you can say about smart beta are: 1) it’s low cost, 2) it’s consistent i.e. the computerdoesn’t get depressed and finally give up when its strategy is out of favour, and 3) it has allowed investors to specifically select the exposures they are comfortable with at the right price. I do believe, however, that smartbeta may have over promised and be set to under deliver for the following reasons.
Back tested results frequently perform better than the real strategy
I am sceptical of some of the back tested results from smart beta which frequently don’t make sufficient adjustment for transaction costs (t-costs) or the negative impact of an increase in AUM. The chart below shows how the returns from a large fund including t-costs can end up looking radically worse than those from small fund with no t-costs.
100
80
60
40
20
0
-20
-40
Information RatiosFeb 1987 – Dec 2008
Cum
ulat
ive
retu
rn (%
)
1987
1990
1993
1996
1999
2002
2005
2008
Gross ofT-cost0.270.70
Net ofT-cost0.080.51
High AUMLow AUM
FIGURE 8:CUMULATIVE DAILY RETURN
Cumulative daily return to t-cost optimised value portfolios, February 1987 – December 2008
Source: Goldman Sachs Asset Management, 16 June 2009
Low AUM, gross of t-costs Low AUM, net of t-costs High AUM, gross of t-costs High AUM, net of t-costs

RWC Partners Limited 60 Petty France, London SW1H 9EU | T +44 (0)20 7227 6000 | F +44 (0)20 7227 6003
RWC Equity Income 9
Secondly, the factor portfolios used to measure returns are long stocks with the desired characteristic, e.g. cheap stocks, and short stocks with undesired characteristics, e.g. expensive stocks. In reality, an investor cannot practically invest in factor portfolios because of the restrictions on shorting and leverage.
Thirdly, there is a whiff of data mining about many of the factors that have been ‘discovered’. Harvey, Liu and Zhu (2015) document over 300 distinct factors but note that because the number of factors is practically unlimited and stock price changes are largely random, hundreds of false positives are inevitable.
Finally, evidence has accrued over the years that it becomes harder to profit from market anomalies once they’re harvested en masse. According to research from David McLean, a finance professor at DePaul University, the returns from investment ideas outlined in academic papers fall by more than half three years after publication9.
Most of the excess return from smart beta comes from exposure to value and size
In a paper called ‘The Surprising Alpha from Malkiels Monkey and Upside-Down Strategies’ the authors showed that various smart beta strategies outperform a cap weighted benchmark but went on to show that so did an equal weighted index. The reason for this is that an equal weighted benchmark loads on factors which are known to perform such as value and small cap. They then extended this analysis to the major smart beta strategies and showed (in the table below) that when these strategies are corrected for their exposure to value and size, they exhibit no statistically significant outperformance compared to a cap-weighted benchmark.
9 Wall Street’s Hottest Investment Idea May Be Getting Too Hot by Dani Burger 06 February 2017
FIGURE 9: US STRATEGIES 1963-2012
ReturnStandard Deviation
Sharpe Ratio Value Small
Alpha’ t stat after Value and Size
Cap Weighted 9.66 15.29 0.29
Equal Weighted 11.46 17.37 0.36 X XX 0.38
Minimum Variance 11.75 11.69 0.56 XX X 1.39
Maximum Diversification 11.99 13.96 0.48 XX XX 0.54
Risk Efficient 12.50 16.81 0.43 XX X 1.32
Risk Cluster Equal Weight 11.18 14.61 0.41 XX 0.49
Fundamental Weight 11.60 15.45 0.41 XX 1.83
Simulated Simians 11.26 18.34 0.33 X XX -0.31Inverse Strategies
Minimum Variance 12.66 18.14 0.41 X XX 0.54
Maximum Diversification 12.48 17.58 0.41 XX XX 0.94
Risk Efficient 12.35 17.32 0.41 XX X 0.25
Risk Cluster Equal Weight 13.23 18.96 0.42 X XX -0.16
Fundamental Weight 14.06 18.77 0.47 X XX 1.40
Source: Arnott, Hsu, Kalesnik, Tindall (2013)

www.rwcpartners.com | E [email protected] | Authorised and regulated by the Financial Conduct Authority
Returns from smart beta, like all investment strategies, are reliant on starting valuation
This is something we discussed in our recent white paper on the subject of ‘quality investing’10. In summary, we concluded that there is NO evidence of a quality premium in the long run and that even returns from quality are dependent on starting valuation (see Figure 10).
The second observation is that recent strong returns from quality strategies have been driven by expansion of valuation and future returns should therefore be lower as this valuation mean reverts. Generally speaking, if a factor does not include a rotation or update feature (so stocks with the desired characteristics are constantly recycled) then the factor may get more and more expensive as its popularity grows which ultimately reduces its future expected returns. The notable exceptions are value and momentum where the nature of these factors means that the composition of funds and indices will be constantly updated with new stocks which exhibit the required factor.
Some factors are difficult to identify on a quantitative basis
When a smart beta product seeks to produce exposure to a particular, factor e.g. quality, they will choose a measure such as return on assets and then look at historic figures, which can sometimes be overly simplistic and a poor guide to the future. In the case of ROA, returns could be at a cyclical high and about to collapse. The same applies to value smart beta where the use of measures such as price-to-book or price-to-earnings can lead to the selection of stocks which are anything but good value. Prior to the financial crisis, many low volatility ETFs had high exposure to financials because they had exhibited very low volatility. Unfortunately for investors in these funds this changed dramatically in 2008.
Too much money has gone into certain smart beta strategies thus sowing the seeds of its own destruction and actually leading to a potential gap risk
In 2007 many active quant strategies performed badly during the financial crisis. Leading up to 2007, quantitative investing had become an increasing percentage of the overall market. When quantitative investors were forced to unwind their positions simultaneously in August 2007, it created the dramatic moves that were synchronised across factors and markets shown in Figure 11.
10 Beauty is in the eye of the beholder by Ian Lance RWC 2016
FIGURE 10: QUALITY PERFORMANCE BY STARTING VALUATION QUINTILE (%)
Source: SG Cross Asset Research/Equity Quant, FactSet, FTSE, I/B/E/S
-30
-25
-20
-15
-10
-5
0
5
10
15
20
Cheap Expensive432
Return Valuation Change

RWC Partners Limited 60 Petty France, London SW1H 9EU | T +44 (0)20 7227 6000 | F +44 (0)20 7227 6003
RWC Equity Income 11
As certain smart beta products such as low volatility and minimum variance have attracted lots of money, there must be a risk that in the event of sudden drawdown and redemptions, many funds will be forced to sell similar positions into an illiquid market, causing significant share price reactions.
‘If anything, we think it’s reasonably likely a smart beta crash will be a consequence of the soaring popularity of factor-tilt strategies.’12
Some believe that the ‘side crashes’ of 2014 and 2016 (where many smart beta and active managers experienced significant underperformance in what
appeared to be uneventful, non-directional markets) were early indications of the potential vulnerability of these strategies. An example of this was given in an article entitled Wall Street’s Hottest Investment Idea May Be Getting Too Hot by Dani Burger:
“For example, total assets in the iShares Edge MSCI Minimum Volatility fund reached $15 billion by late July, more than twice what they were at the start of 2016. Soon, the BlackRock Inc. product began to see historically large price swings. It fell 2.8 percent in October, its worst month in over a year, as investors pulled $2.1 billion in the last three months of 2016.”
12 How can Smart Beta go Horribly Wrong by Arnott, Beck, Kalesnik and West Feb 2016
FIGURE 11: SUDDEN AND DRAMATIC UNDERPERFORMANCE OF PREVIOUSLY UNCORRELATED COMMON QUANT FACTORSFactor performance in August 2007 scaled by 1% daily volatility11
Source: QIS
11 Equivalent to 16% annualised volatility. Scaled to normalise different return series. The graphs above illustrate backtested average daily returns to our target investment portfolios without taking into account translations costs. These returns are reported for informational purposes only and do not reflect the performance of any GSAM product. These performance results are backtested based on an analysis of past market data with the benefit of hindsight, do not reflect the performance of any GSAM product and are being shown for informational purposes only.
20%
10%
0%
-10%
-20%
-30%
-40%
-50%
-60%1 3 7 9 13 15 17 21 23 27 29 31
US
August 2007
Revisions Momentum Value Accruals

www.rwcpartners.com | E [email protected] | Authorised and regulated by the Financial Conduct Authority
FIGURE 12: LOW-VOL ETFs TURN UPSIDE-DOWNPrice turmoil causes funds to swing more than SPY
Dec Mar Jun Sep Dec Mar Jun Sep Dec
0.00
-2.00
-4.00
-6.00
-8.0030
20
10
2014 2015 2016 2017
30 Day Volatility Spread
30 Day Volatility Spread
High PSR
Low PSR
High P/Cashflow
Low P/Cashflow
High P/Book
Low P/Book
High PE
Low PE
$19,118
$136,834
$267,147
$793,558
$22,012,919
$17,724,382
$22,004,691
$8,189,182
Value USD
iShares MSCI Min Vol ETF – SPDR S&P500 ETF
iShares Edge MSCI Min Vol USA ETF
SPDR S&P500 ETF Trust
In conclusion, smart beta serves a function and has played a big part in bringing down fees but is maybe not the investing nirvana that it is being sold as.
Why don’t active managers do better?
In the same way that all the academic evidence shows fund managers can’t outperform, lots of evidence shows that certain factors do generate excess returns:
value, size and momentum. Figure 13, from one of the most famous studies ‘What works on Wall Street’ by James P O’Shaughnessy, shows the excess return from value strategies. This then raises another interesting question, if it is theoretically possible for active investors to earn excess returns, why do so few achieve this in practice?
Source: What Works on Wall Street, James P. O’Shaughnessy, 1996
Source: Bloomberg, November 2014 - February 2017
FIGURE 13: VALUE OF $10,000 INVESTED IN VARIOUS STRATEGIES FOR THE 52 YEARS ENDING IN DECEMBER 2003

RWC Partners Limited 60 Petty France, London SW1H 9EU | T +44 (0)20 7227 6000 | F +44 (0)20 7227 6003
RWC Equity Income 13
13 The active management dead? By Jason Voss discusses the issue of ‘fund bloat’ or how returns deteriorate as funds grow larger
14 Taken from ‘Timing Poorly: A guide to generating poor returns whilst investing in successful strategies’ by Hsu et al
Various attempts have been made to explain why active managers don’t perform better, with some of the most common factors being as follows.
• Career risk and psychological pressure leading tocloset tracking
• Funds becoming excessively large
• Investors don’t stay with funds across a market cycle
The common theme running through all of these issues is the agent principal conflict. In essence, this refers to the fact that the interests of the underlying investor or principal are different from the fund manager or agent. The latter wants to grow his AUM as large as possible since he is paid an ad valorem fee, whilst the former wants the best risk-adjusted returns. Most managers know which investment factors work (value, size, momentum) but they also know that these styles will often be out of favour for periods of time. They also know that they are likely to get fired after three years of poor performance and hence their best chance of
minimising this is to blend factors across the portfolio, keep tracking error low and thus hopefully reducing the chance of a sustained period of poor performance but also sacrificing potential return. Welcome to the world of the closet tracker.
Finally it is also worth noting that active and passive scale differently – passive needs to be very large in order to drive efficiencies of scale and keep fees low whilst active returns deteriorate beyond a certain fund size.13
So returns can either be destroyed by fund managers straying from the optimum investment strategy in order to safeguard their job, or investors in funds can diminish their own returns by chasing performance between funds as shown in the chart below. This suggests that on average investors have given up about 2% p.a. by not sticking with funds.14
In order to maximise returns investors need to be willing to stick with a strategy even during periods when it is not ‘working’.
FIGURE 14: U.S. EQUITY MUTUAL FUNDS: RETURNS REALISED BY TYPE OF FUND (NET OF FEES)Monthly Data Compounded to Annual Periods (1991 to 2013)
Source: Hsu, Jason, Brett W. Myers, and Ryan Whitby. “Timing Poorly: A Guide to Generating Poor Returns While Investing in Successful Strategies”
4%
5%
6%
7%
8%
9%
10%
All Funds Large-CapFunds
S&P 500Small-CapFunds
GrowthFunds
ValueFunds
By Style By Size
Buy-and-Hold Actual Investors

www.rwcpartners.com | E [email protected] | Authorised and regulated by the Financial Conduct Authority
What can active managers do better than passive or smart beta?
One of the main claims active managers will make is that by taking an absolute approach to valuation, they can protect on the downside by going to cash at times when valuations are high. I would also contend that this is better done on a bottom up basis than a top down one as the top down investor struggles to see the valuation dispersion within a market that may offer opportunities even when the cap weighted index valuation looks full.
I do, at this juncture, struggle to defend the industry as a whole. As the chart below shows, across the industry, fund managers tend to raise cash after the market has fallen (as in 2008) and invest it after the market has gone up (now) thus almost guaranteeing a return that is worse than a passive fund that had been fully invested throughout. It is important to note, however, that this is an industry average and that within this there would be funds like us, who have been increasing cash levels over the last few years.
Is now a good time to make the switch from active to passive?
In a recent note from Nomura Quant Strategy15, the authors pointed out that active performance tends to go in cycles and this is the fourth trough reached in the last fifty years. Each one has been followed by a mean reverting recovery as active managers have bounced back (see Figure 16).
FIGURE 15:
6.0
5.5
5.0
4.5
4.0
3.5
3.02006 2007 2008 2009 2010 2011 2012 2013 2014 2015 2016
0
500
1000
1500
2000
2500 Liquidity ratio (LHS) 10 year average (LHS) S&P 500 Index (RHS)
Source: Bloomberg, StockCharts.com, ICI, 28 September 2006 to 30 November 2016 The liquidity ratio of equity funds (the percentage of liquid assets over total net assets) was 3.2% in August, compared with 3.3% in July
15 Peak passive: The coming active renaissance by Nomura Quant Strategy 5 January 2017

RWC Partners Limited 60 Petty France, London SW1H 9EU | T +44 (0)20 7227 6000 | F +44 (0)20 7227 6003
RWC Equity Income 15
There is a logic to the patterns of active performance; active managers tend to outperform when cross sectional volatility (return dispersion) is high, and pairwise correlation (the extent to which all stocks are being driven by common factors) is low, hence
allowing for unique insights to be used into the investment process16. This concept is demonstrated in the chart below which shows the correlation of equity hedge fund excess return with 3 month return dispersion.
16 UBS Q series Active versus Passive: How will the World of Investing Evolve 31 January 2017
FIGURE 16: WE HAVE BEEN HERE BEFORE – EACH TROUGH HAS BEEN FOLLOWED BY RECOVERYPercentage of Funds (Fund Assets) Outperforming S&P 500 on a 5-Year Basis
FIGURE 17: STOCK-PICKERS STRUGGLE WHEN DISPERSION IS LOW3-month return dispersion and equity hedge fund excess return vs. S&P 500
100%
90%
80%
70%
60%
50%
40%
30%
20%
10%
0%
1970
1972
1974
1976
1978
1980
1982
1984
1986
1988
1990
1992
1994
1996
1998
2000
2002
2004
2006
2008
2010
2012
2014
2016
35
30
25
20
15
10
5
0
8
6
4
2
0
-2
-4
-6
1992
1993
1994
1995
1996
1997
1998
1999
2000
2001
2002
2003
2004
2005
2006
2007
2008
2009
2010
2011
2012
2013
2014
2015
2016
2017
Return dispersion
4Q a
vera
ge p
erfo
rman
ce v
s. S
&P
500
(pp) Equity hedge fund
excess return vs. S&P 500(4-quarter average, left)
3-month S&P 500return dispersion
(right)Funds
underperform
Fundsoutperform
Percentage of Funds Outperforming Percentage of Fund Assets Outperforming
Source: CRSP, Bloomberg, Robert Shiller data, Instinet research, 1970-2016
Source: Goldman Sachs, 1992-2017

www.rwcpartners.com | E [email protected] | Authorised and regulated by the Financial Conduct Authority
Unfortunately for active managers, since 2007 macro factor risk has driven correlation to historically high levels and return dispersion to low levels. A recent article in the Wall Street Journal explained, in plain English, why fundamental based stock pickers have struggled in this environment.
“Last year’s markets were difficult for Tiger Cubs and other bottom-up investors because companies often didn’t rise or fall on their individual fundamentals. Instead, entire sectors of the market traded in lockstep, such as when energy companies rallied during the first half and when financial stocks surged after the presidential election of Donald Trump on expectations of economic growth. Stocks that traditionally were more expensive and had strong growth prospects also sold off, another development that surprised some of these managers.”17
There are now signs that this is changing and dispersion could be set to increase. If history is any guide, now could be the worse time to consider a switch from active to passive.
So if you are going to hunt for an active manager, what should you look for?
• One that follows an approach with empiricalbacking. Value, momentum, and size have been
shown to work whereas ‘quality at any price’ or ‘we do lots of company meetings’ have not.
• They have followed that approach which has beenproven to work over a long period of time and theyhave applied it in a disciplined fashion. They havethe patience and discipline to stick to this approachthroughout periods when it is not working.
• Someone who thinks in absolute terms ratherthan joining the relative performance derby. Thiswill necessitate going to cash when there are noopportunities around, sometimes for long periodsof time.
• The strategy is implemented in a concentratedfashion. Numerous studies show managers withhigh active share strategies are more likely togenerate long-term alpha. Martijn Cremers andAntti Petajisto wrote the seminal study definingactive share: ‘How Active Is Your Fund Manager?A New Measure That Predicts Performance’ in 2007.They concluded:
“Funds with the highest Active Share significantlyoutperform their benchmarks, both before and afterexpenses, and they exhibit strong performancepersistence. Non-index funds with the lowest ActiveShare underperform their benchmarks.”
17 J uliet Chung The Wall Street Journal 07 February 2017
Source: Cremers and Petajisto (2009)
FIGURE 18: DIFFERENT TYPES OF ACTIVE MANAGEMENT
DiversifiedStock Picks
ConcentratedStock Picks
ClosetIndexing
FactorBets
Low
High
ActiveShare
Low
Tracking Error
High00

RWC Partners Limited 60 Petty France, London SW1H 9EU | T +44 (0)20 7227 6000 | F +44 (0)20 7227 6003
RWC Equity Income 17
This evidence was supported by recent research from Sanford Bernstein who not only showed that funds with higher active share generate higher returns, but that they also had a higher information ratio (see Figure 19).
FIGURE 19: RISK-ADJUSTED PERFORMANCE OF FUNDAMENTAL FUNDS BY ACTIVE SHARE BUCKET
Active Share
Annualised return (Gross performance)
Annualised TE Return/Risk
<50 1.1% 2.9% 0.39
50-70 1.8% 1.3% 1.38
70-90 2.5% 1.8% 1.37
>90 4.2% 2.9% 1.45
Source: eVestment and Bernstein analysis
• Costs such as turnover are kept to a minimum.Research by Roger Edelen “Shedding Light on‘Invisible’ Costs: Trading Costs and Mutual FundPerformance” found a strong negative relationshipbetween aggregate trading costs and fund returns.Mutual funds in the lowest quintile of aggregatetrading costs in Edelen’s study had average annualreturns 1.78 percentage points higher than thehighest quintile, highlighting the detrimental effecttrading costs can have on performance.
• In terms of the asset management firm that youractive manager works for, I would tend to focuson two things. Firstly, is the firm independent andowner managed or is it a large quoted firm? DavidSwensen, the former CIO of Yale Endowment hassaid he prefers smaller, private partnership overthe larger, listed full service operator. Secondly,as Tim Price suggests in his book ‘Investingthrough the Looking Glass,’ fund management firmscan be broadly separated into asset managers andasset gatherers18:
“The investment world is polarised between asset managers, who focus their energies on delivering the best possible returns for their clients, and asset gatherers, who just want to maximise fee income. Most fund management firms fall into the latter category. Favour the former.”
Conclusion
• Passive funds have been a force for good asthey have put pressure on industry fees andallowed investors to buy market return cheaply.Some of their criticism of active funds, however,is disingenuous at best. Investors also need to beaware of the pitfalls of going passive, namely thatthe strategy over-weights expensive stocks andunder-weights cheap ones and that even an equalweighted strategy can improve returns by tiltingtowards value and size. Whilst they may have notracking error risk, going passive at a time of veryhigh valuations almost guarantees low future returnswhich may be insufficient to meet future liabilities.
• Smart beta has clouded the differentiation betweenactive and passive and is a systematic strategythat allows exposure to certain factors. Fees for thestrategy are very competitive and it has attracted asignificant amount of money. Investors need to beaware that most of the excess return comes fromexposure to value and size, and that many of thesefactors are trading at historically high valuations whichshould lower future returns, and that the crowding ofmoney into the strategies could cause turbulence inthe event of a drawdown which leads to redemptions.
• The returns from active funds can be disappointing,either because managers do not expose the fundto factors which should produce an excess return,or because investors are unwilling to stick withstrategies through a full market cycle.
• Active fund managers should be able to reducedrawdown risk by increasing cash at times of highvaluations, although the evidence suggests manyactually do the opposite.
• The most successful active managers tend to follow astrategy tilted towards factors which have been shownto work, such as value, momentum or size, but havethe patience and discipline to stick with them througha market cycle. They will often have high trackingerror, high active share and concentrated portfolios,but have low turnover and keep costs to a minimum.
• Finally, the manager is likely to be working in astable business environment that allows them toeffectively implement their investment strategy andone which encourages longevity.
18 Investing through the looking glass by Tim Price December 2017
RWC Partners Limited 60 Petty France, London SW1H 9EU | T +44 (0)20 7227 6000 | F +44 (0)20 7227 6003 | www.rwcpartners.com E [email protected] | Authorised and regulated by the Financial Conduct Authority
The term “RWC” may include any one or more RWC branded entities including RWC Partners Limited and RWC Asset Management LLP, each of which is authorised and regulated by the UK Financial Conduct Authority and, in the case of RWC Asset Management LLP, the US Securities and Exchange Commission; RWC Asset Advisors (US) LLC, which is registered with the US Securities and Exchange Commission; and RWC Singapore (Pte) Limited, which is licensed as a Licensed Fund Management Company by the Monetary Authority of Singapore.RWC may act as investment manager or adviser, or otherwise provide services, to more than one product pursuing a similar investment strategy or focus to the product detailed in this document. RWC seeks to minimise any conflicts of interest, and endeavours to act at all times in accordance with its legal and regulatory obligations as well as its own policies and codes of conduct.This document is directed only at professional, institutional, wholesale or qualified investors. The services provided by RWC are available only to such persons. It is not intended for distribution to and should not be relied on by any person who would qualify as a retail or individual investor in any jurisdiction or for distribution to, or use by, any person or entity in any jurisdiction where such distribution or use would be contrary to local law or regulation.This document has been prepared for general information purposes only and has not been delivered for registration in any jurisdiction nor has its content been reviewed or approved by any regulatory authority in any jurisdiction. The information contained herein does not constitute: (i) a binding legal agreement; (ii) legal, regulatory, tax, accounting or other advice; (iii) an offer, recommendation or solicitation to buy or sell shares in any fund, security, commodity, financial instrument or derivative linked to, or otherwise included in a portfolio managed or advised by RWC; or (iv) an offer to enter into any other transaction whatsoever (each a “Transaction”). No representations and/or warranties are made that the information contained herein is either up to date and/or accurate and is not intended to be used or relied upon by any counterparty, investor or any other third party.RWC uses information from third party vendors, such as statistical and other data, that it believes to be reliable. However, the accuracy of this data, which may be used to calculate results or otherwise compile data that finds its way over time into RWC research data stored on its systems, is not guaranteed. If such information is not accurate, some of the conclusions reached or statements made may be adversely affected. RWC bears no responsibility for your investment research and/or investment decisions and you should consult your own lawyer, accountant, tax adviser or other professional adviser before entering into any Transaction. Any opinion expressed herein, which may be subjective in nature, may not be shared by all directors, officers, employees, or representatives of RWC and may be subject to change without notice. RWC is not liable for any decisions made or actions or inactions taken by you or others based on the contents of this document and neither RWC nor any of its directors, officers, employees, or representatives (including affiliates) accepts any liability whatsoever for any errors and/or omissions or for any direct, indirect, special, incidental, or consequential loss, damages, or expenses of any kind howsoever arising from the use of, or reliance on, any information contained herein.Information contained in this document should not be viewed as indicative of future results. Past performance of any Transaction is not indicative of future results. The value of investments can go down as well as up. Certain assumptions and forward looking statements may have been made either for modelling purposes, to simplify the presentation and/or calculation of any projections or estimates contained herein and RWC does not represent that that any such assumptions or statements will reflect actual future events or that all assumptions have been considered or stated. Forward-looking statements are inherently uncertain, and changing factors such as those affecting the markets generally, or those affecting particular industries or issuers, may cause results to differ from those discussed. Accordingly, there can be no assurance that estimated returns or projections will be realised or that actual returns or performance results will not materially differ from those estimated herein. Some of the information contained in this document may be aggregated data of Transactions executed by RWC that has been compiled so as not to identify the underlying Transactions of any particular customer.The information transmitted is intended only for the person or entity to which it has been given and may contain confidential and/or privileged material. In accepting receipt of the information transmitted you agree that you and/or your affiliates, partners, directors, officers and employees, as applicable, will keep all information strictly confidential. Any review, retransmission, dissemination or other use of, or taking of any action in reliance upon, this information is prohibited. The information contained herein is confidential and is intended for the exclusive use of the intended recipient(s) to which this document has been provided. Any distribution or reproduction of this document is not authorised and is prohibited without the express written consent of RWC or any of its affiliates.The benchmark index is included to show the general trend of the securities markets in the period indicated. The portfolio is managed according to its investment strategy, which may differ significantly in terms of security holdings, industry weightings, and asset allocation from those of the benchmark index. Portfolio performance, characteristics and volatility may differ from the benchmark index. No representation is made that the portfolio’s strategy is or will be comparable, either in composition or regarding the element of risk involved, to the securities comprising the benchmark index. Unmanaged index returns assume reinvestment of any and all distributions and do not reflect any fees, expenses or sales charges. Investors cannot invest directly in an index.Representative holdings and portfolio characteristics are specific only to the portfolio shown at that point in time and is subject to change. The representative portfolio shown has been selected by RWC based on account characteristics that RWC believes accurately represents the investment strategy as a whole.Changes in rates of exchange may cause the value of such investments to fluctuate. An investor may not be able to get back the amount invested and the loss on realisation may be very high and could result in a substantial or complete loss of the investment. In addition, an investor who realises their investment in a RWC-managed fund after a short period may not realise the amount originally invested as a result of charges made on the issue and/or redemption of such investment. The value of such interests for the purposes of purchases may differ from their value for the purpose of redemptions. No representations or warranties of any kind are intended or should be inferred with respect to the economic return from, or the tax consequences of, an investment in a RWC-managed fund. Current tax levels and reliefs may change. Depending on individual circumstances, this may affect investment returns. Nothing in this document constitutes advice on the merits of buying or selling a particular investment. This document expresses no views as to the suitability or appropriateness of the fund or any other investments described herein to the individual circumstances of any recipient.AIFMD and Distribution in the European Economic Area (“EEA”)The Alternative Fund Managers Directive (Directive 2011/61/EU) (“AIFMD”) is a regulatory regime which came into full effect in the EEA on 22 July 2014. RWC Asset Management LLP is an Alternative Investment Fund Manager (an “AIFM”) to certain funds managed by it (each an “AIF”). The AIFM is required to make available to investors certain prescribed information prior to their investment in an AIF. The majority of the prescribed information is contained in the latest Offering Document of the AIF. The remainder of the prescribed information is contained in the relevant AIF’s annual report and accounts. All of the information is provided in accordance with the AIFMD.In relation to each member state of the EEA (each a “Member State”), this document may only be distributed and shares in a RWC fund (“Shares”) may only be offered and placed to the extent that (a) the relevant RWC fund is permitted to be marketed to professional investors in accordance with the AIFMD (as implemented into the local law/regulation of the relevant Member State); or (b) this document may otherwise be lawfully distributed and the Shares may lawfully offered or placed in that Member State (including at the initiative of the investor).Information Required for Distribution of Foreign Collective Investment Schemes to Qualified Investors in SwitzerlandThe representative and paying agent of the RWC-managed funds in Switzerland (the “Representative in Switzerland”) is Société Générale, Paris, Zurich Branch, Talacker 50, P.O. Box 5070, CH-8021 Zürich. In respect of the units of the RWC-managed funds distributed in Switzerland, the place of performance and jurisdiction is at the registered office of the Representative in Switzerland.
CONTACT US
Please contact us if you have any questions or would like to discuss any of our strategies.E [email protected] | W www.rwcpartners.com
Unless expressed otherwise, all opinions within this document are those of the RWC Equity Income investment team.
RWC London60 Petty France London SW1H 9EU T +4420 7227 6000
RWC Miami2640 South Bayshore Drive Suite 201 Miami Florida. 33133 T +1 305 602 9501
RWC Singapore80 Raffles Place #22-23 UOB Plaza 2 Singapore 048624 T +65 6812 9540