the rem cookbook - oticon/media/oticon us/main/download center/opn... · 2 terminology the rem...
TRANSCRIPT
The REM CookbookHow to Correctly Perform Real Ear Measurements
2
TerminologyThe REM CookbookWhy do audiologists perform real ear measurements?
The main reason is to verify that speech sounds are audible for a client with a given hearing loss and a given hearing aid. Another important reason is to ensure that targets for a chosen rationale are met as a good starting point for a new fitting. Real ear measurements (REMs) must therefore be consistent, reliable, repeat-able, and correct.
This short guide helps the audiologist perform correct measurements and gives ideas for troubleshooting when measurements do not turn out as expected.
Terminology
Position of equipment
Otoscopic examination
Calibrating probe tube
Client placement
Signal types and levels
Test of openness of fitting
MPO and on-ear measurements
Coupler verification
Consistency above all
Conclusion
References
REM: Real Ear Measurement. Also called probe microphone measurement. A method of assessing sound pressure levels in the ear canal using a calibrated probe tube.
REUR: Real Ear Unaided Response. The SPL, across frequencies, measured in the open (unaided) ear canal for a given input signal.
REUG: Real Ear Unaided Gain. The input signal (pure-tone) subtracted from the REUR is the REUG.
REIG: Real Ear Insertion Gain. The difference between aided and unaided ear canal SPL (REAR-REUR=REIG). REIG is a calcu-lated difference measurement.
REOR: Real Ear Occluded Response. The SPL, across frequencies, measured in the ear canal with a hearing aid inserted and OFF, for a given input signal.
REOG: Real Ear Occluded Gain. The difference in dB, across frequencies, between the signal level measured in the ear canal and the input signal, with the hearing aid turned off.
REAR: Real Ear Aided Response. The output of a hearing aid that is turned on, measured at the eardrum, for a particular input signal.
REAG: Real Ear Aided Gain. The gain across fre-quencies of a hearing aid that is turned on, measured at the eardrum. The input signal subtracted from the REAR is REAG.
RECD: Real Ear to Coupler Difference. Difference in dB across frequencies, between the SPL measured in the ear at the tympanic membrane and in a 2cc coupler, produced by a transducer generating the same input signal.

3
Terminology
Position of equipment
Otoscopic examination
Calibrating probe tube
Client placement
Signal types and levels
Test of openness of fitting
MPO and on-ear measurements
Coupler verification
Consistency above all
Conclusion
References
This guide focuses on the most common fitting situation in the clinic, i.e. the verification of open or partially open fittings, use of speech as the input signal, and verification on the ear, rather than in a test box.
Average age-specific RECD values are used in the gain prescription in Genie, the Oticon fitting software. Measuring and taking into account individual RECD is only applicable for a closed vent fitting, which is mostly relevant for either young children or in cases of a severe-to-profound hearing loss. This document does not include guidance for measuring RECD.
Separate guides cover how to verify the OpenSound NavigatorTM feature. The guides each address a commonly used REM system and contain instructions on how to prepare for and run the measurements. The OpenSound Navigator feature requires running special tests for verification of noise reduction and directionality. This verification can help the hearing care professional to know exactly how these features work for individual clients with specific hearing losses and amplification needs.
In addition to the OpenSound Navigator verification guides, a new and improved REM AutoFit is available in Genie 2 for easy verification. REM AutoFit allows the clinician to quickly verify audibility and match targets for the individual client. Using this feature, hearing aid gain can automatically be adjusted to fit targets in under six minutes. Manual fine-tuning is also an option. REM
Autofit eliminates the need to open REM software separately. One of the advan-tages of REM AutoFit is that it is possible to verify against Oticon’s proprietary VAC+ rationale, since these targets are shown. Moreover, the International Speech Test Signal (ISTS) is included in REM AutoFit. More information and instructions can be found in the REM AutoFit Cookbook.
4
Position of equipmentYour verification equipment should preferably be placed inside a sound booth; however for most, this is not feasible or convenient since the clinician needs to be able to make quick changes to the hearing aid and acoustics, if a change is warranted. Tecca (1990) showed that a reverberant room can be used, but as a general rule, ensure the following:
• Loudspeaker is as close to the listener as possible, approximately 0.5-1m away. It is a balance of client comfort and precision
• Quiet room away from waiting room, break room and daily conversation
• No hard reflective surfaces near the measurement location (at least 1.5m, if possible)
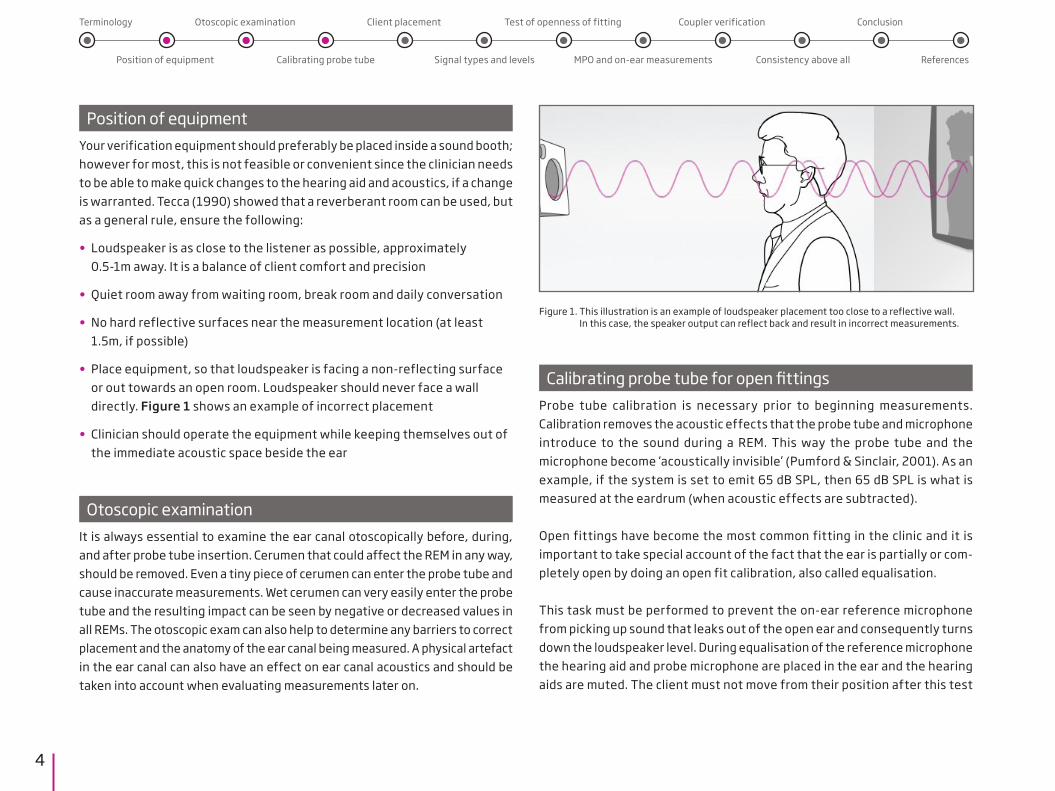
• Place equipment, so that loudspeaker is facing a non-reflecting surface or out towards an open room. Loudspeaker should never face a wall directly. Figure 1 shows an example of incorrect placement
• Clinician should operate the equipment while keeping themselves out of the immediate acoustic space beside the ear
• Otoscopic examination
It is always essential to examine the ear canal otoscopically before, during, and after probe tube insertion. Cerumen that could affect the REM in any way, should be removed. Even a tiny piece of cerumen can enter the probe tube and cause inaccurate measurements. Wet cerumen can very easily enter the probe tube and the resulting impact can be seen by negative or decreased values in all REMs. The otoscopic exam can also help to determine any barriers to correct placement and the anatomy of the ear canal being measured. A physical artefact in the ear canal can also have an effect on ear canal acoustics and should be taken into account when evaluating measurements later on.
Figure 1. This illustration is an example of loudspeaker placement too close to a reflective wall. In this case, the speaker output can reflect back and result in incorrect measurements.
Calibrating probe tube for open fittingsProbe tube calibration is necessary prior to beginning measurements. Calibration removes the acoustic effects that the probe tube and microphone introduce to the sound during a REM. This way the probe tube and the microphone become ‘acoustically invisible’ (Pumford & Sinclair, 2001). As an example, if the system is set to emit 65 dB SPL, then 65 dB SPL is what is measured at the eardrum (when acoustic effects are subtracted).
Open fittings have become the most common fitting in the clinic and it is important to take special account of the fact that the ear is partially or com-pletely open by doing an open fit calibration, also called equalisation.
This task must be performed to prevent the on-ear reference microphone from picking up sound that leaks out of the open ear and consequently turns down the loudspeaker level. During equalisation of the reference microphone the hearing aid and probe microphone are placed in the ear and the hearing aids are muted. The client must not move from their position after this test
Terminology
Position of equipment
Otoscopic examination
Calibrating probe tube
Client placement
Signal types and levels
Test of openness of fitting
MPO and on-ear measurements
Coupler verification
Consistency above all
Conclusion
References

5
is done, because this can result in more or less SPL measured at ear level and this can have a large impact on REMs. Keep in mind, once equalisation is com-plete, the reference microphone by the ear is turned off for the remainder of the open fitting measurement. If the client now moves, then the equip-ment’s estimated level of sound at ear level is no longer valid and this can lead to inaccurate measurements. Instructing the client to move as little as possible after equalisation is therefore crucial. If the client moves, it will be necessary to recalibrate.
If an open fitting hearing aid is measured and equalisation is not performed, it could result in very unreliable curves because the reference microphone may be picking up the amplified, leaked output from the hearing aid in the ear and it mistakenly thinks that the sound level at the ear is higher than it is. The reference microphone now signals the hearing aid analyser to lower the level of the signal and, consequently, measured ear canal SPL is reduced. Now, the audiologist may think the hearing aid is providing insufficient gain or output when it may not be.
Client placement in front of loudspeaker Loudspeaker distance and azimuth can affect the REM. A general rule of thumb is placement 0.5-1 metres away from loudspeaker and the client facing the measurement module directly in front, or 0 degrees azimuth horizontally and vertically, as shown in figure 2. Closer is better since it lessens the significance of early reflections.
Probe tube placementProbe tube placement can have a detrimental effect on REMs, especially at high frequencies. Therefore, probe tube placement should be verified, and there are at least three valid ways to do this:
• Performing unaided measurement (REUR or REUG) and monitoring gain at 6 kHz
• Ensuring correct probe insertion depth using intratragal notch as a marker
• Otoscopic examination (described earlier)
These methods complement each other and it is a matter of preference exactly which method(s) are used.
Unaided measurementPerforming an unaided test is helpful and informative for the clinician because it provides clues as to the quality of the probe microphone insertion we have just done. For example, a notch in the high frequencies is a good indicator of shallow insertion and a very low response is a good indicator that the tube may be placed against the ear canal wall or is blocked by cerumen. An average adult will have a peak around 2700 Hz of 17 dB and a second peak in the 4000-5000 Hz range of approximately 12-14 dB (Mueller, 1992). However, individual unaided measurements can vary substantially from per-son to person. Unaided measurements can also indicate ear abnormalities, such as an eardrum perforation.
Figure 2. Correct distance between loudspeaker of REM system and the person wearing hearing aids.
0.5-1 metres
Terminology
Position of equipment
Otoscopic examination
Calibrating probe tube
Client placement
Signal types and levels
Test of openness of fitting
MPO and on-ear measurements
Coupler verification
Consistency above all
Conclusion
References
6
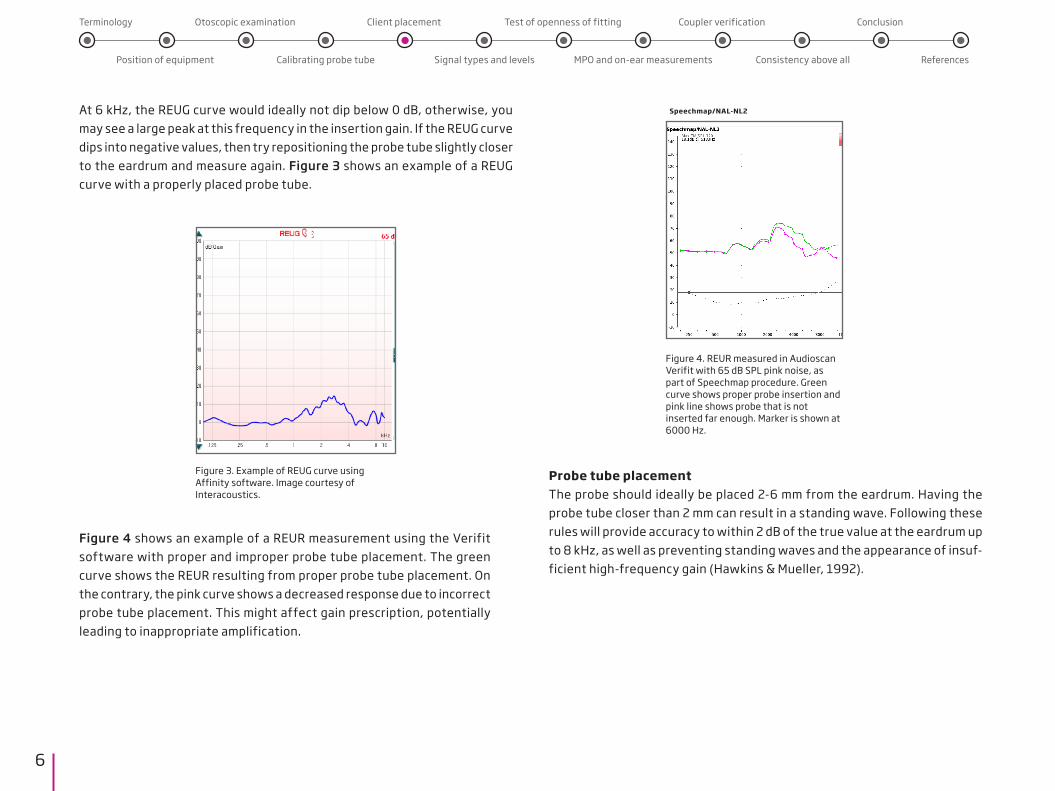
At 6 kHz, the REUG curve would ideally not dip below 0 dB, otherwise, you may see a large peak at this frequency in the insertion gain. If the REUG curve dips into negative values, then try repositioning the probe tube slightly closer to the eardrum and measure again. Figure 3 shows an example of a REUG curve with a properly placed probe tube.
Probe tube placementThe probe should ideally be placed 2-6 mm from the eardrum. Having the probe tube closer than 2 mm can result in a standing wave. Following these rules will provide accuracy to within 2 dB of the true value at the eardrum up to 8 kHz, as well as preventing standing waves and the appearance of insuf-ficient high-frequency gain (Hawkins & Mueller, 1992).
Figure 3. Example of REUG curve usingAffinity software. Image courtesy of Interacoustics.
Terminology
Position of equipment
Otoscopic examination
Calibrating probe tube
Client placement
Signal types and levels
Test of openness of fitting
MPO and on-ear measurements
Coupler verification
Consistency above all
Conclusion
References
Figure 4. REUR measured in Audioscan Verifit with 65 dB SPL pink noise, as part of Speechmap procedure. Green curve shows proper probe insertion and pink line shows probe that is not inserted far enough. Marker is shown at 6000 Hz.
Speechmap/NAL-NL2
Figure 4 shows an example of a REUR measurement using the Verifit software with proper and improper probe tube placement. The green curve shows the REUR resulting from proper probe tube placement. On the contrary, the pink curve shows a decreased response due to incorrect probe tube placement. This might affect gain prescription, potentially leading to inappropriate amplification.
7
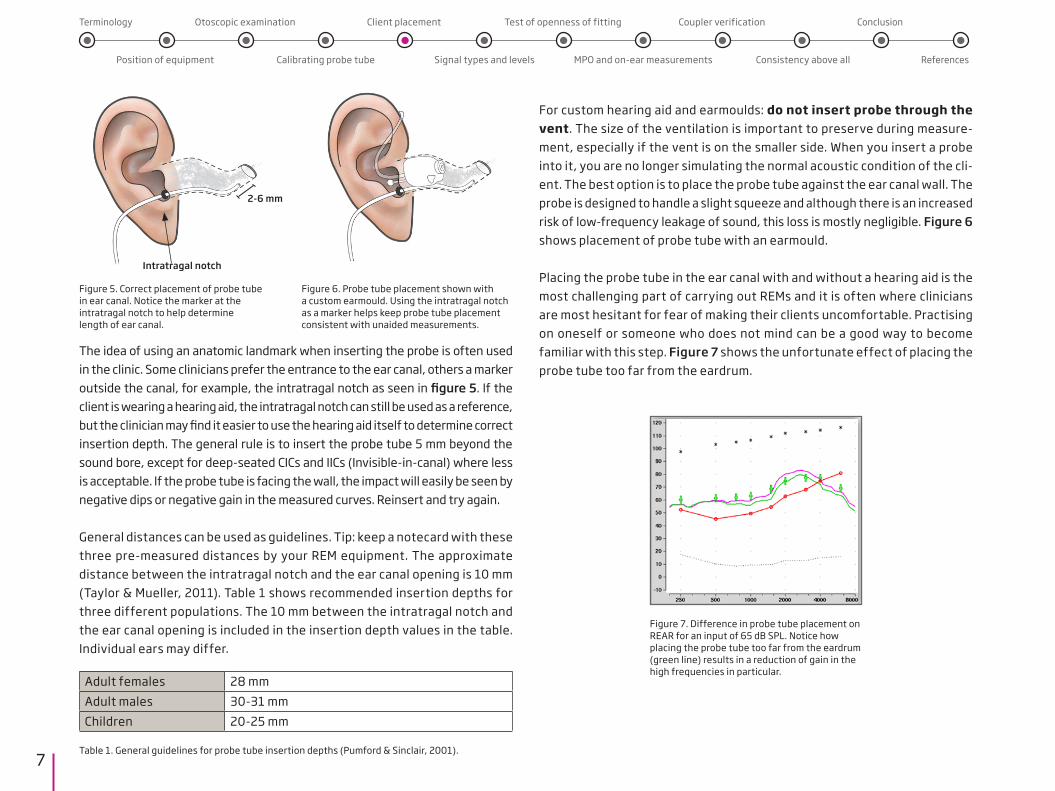
The idea of using an anatomic landmark when inserting the probe is often used in the clinic. Some clinicians prefer the entrance to the ear canal, others a marker outside the canal, for example, the intratragal notch as seen in figure 5. If the client is wearing a hearing aid, the intratragal notch can still be used as a reference, but the clinician may find it easier to use the hearing aid itself to determine correct insertion depth. The general rule is to insert the probe tube 5 mm beyond the sound bore, except for deep-seated CICs and IICs (Invisible-in-canal) where less is acceptable. If the probe tube is facing the wall, the impact will easily be seen by negative dips or negative gain in the measured curves. Reinsert and try again.
General distances can be used as guidelines. Tip: keep a notecard with these three pre-measured distances by your REM equipment. The approximate distance between the intratragal notch and the ear canal opening is 10 mm (Taylor & Mueller, 2011). Table 1 shows recommended insertion depths for three different populations. The 10 mm between the intratragal notch and the ear canal opening is included in the insertion depth values in the table. Individual ears may differ.
Adult females 28 mmAdult males 30-31 mm Children 20-25 mm
For custom hearing aid and earmoulds: do not insert probe through the vent. The size of the ventilation is important to preserve during measure-ment, especially if the vent is on the smaller side. When you insert a probe into it, you are no longer simulating the normal acoustic condition of the cli-ent. The best option is to place the probe tube against the ear canal wall. The probe is designed to handle a slight squeeze and although there is an increased risk of low-frequency leakage of sound, this loss is mostly negligible. Figure 6 shows placement of probe tube with an earmould.
Placing the probe tube in the ear canal with and without a hearing aid is the most challenging part of carrying out REMs and it is often where clinicians are most hesitant for fear of making their clients uncomfortable. Practising on oneself or someone who does not mind can be a good way to become familiar with this step. Figure 7 shows the unfortunate effect of placing the probe tube too far from the eardrum.
Figure 5. Correct placement of probe tube in ear canal. Notice the marker at the intratragal notch to help determine length of ear canal.
Figure 6. Probe tube placement shown with a custom earmould. Using the intratragal notch as a marker helps keep probe tube placement consistent with unaided measurements.
Terminology
Position of equipment
Otoscopic examination
Calibrating probe tube
Client placement
Signal types and levels
Test of openness of fitting
MPO and on-ear measurements
Coupler verification
Consistency above all
Conclusion
References
2-6 mm
Intratragal notch
Table 1. General guidelines for probe tube insertion depths (Pumford & Sinclair, 2001).
Figure 7. Difference in probe tube placement on REAR for an input of 65 dB SPL. Notice how placing the probe tube too far from the eardrum (green line) results in a reduction of gain in the high frequencies in particular.
8
Signal types and levelsIn the days of linear hearing aids, pure-tones and static noise signals were adequate for measuring the hearing aid response. With modern hearing aids, it has become necessary to use dynamic speech signals and multiple input levels in order to get a more accurate estimate of hearing aid function (Mueller 2006). Realistic and dynamic speech signals such as ISTS (described below) make it possible to test hearing aids with advanced features activated, such as noise reduction algorithms. Digital hearing aids adjust amplification depend-ing on the input and this can only be reflected in a REM if the signal used approximates the sounds that the client is exposed to in their daily lives (Fabry, 2004). REMs performed with pure-tone signals do not reflect advanced signal processing (Kuk & Ludvigsen, 2005). Below are some common test signals, briefly described.
Speech signalsISTS: International Speech Test Signal. An internationally recognised test signal based on natural recordings of non-intelligible speech. The signal reflects a female speaker for six different mother tongues (American English, Arabic, Chinese, French, German, and Spanish) and it is shaped according to the Long Term Average Speech Spectrum (LTASS) standards (Holube et al, 2007). ISTS is available in most REM equipment , including the REM AutoFit feature in Oticon Genie 2 fitting software. It is increasingly being used all over the world as a valid and representative speech signal.
Standard Speech 1 & 2: These are recorded samples of North American speech and they are only available on Audioscan Verifit equipment and are therefore widely used in the USA and Canada. Signals are analysed in 1/3 octave bands over several seconds to provide the LTASS. Fitting targets for DSL, Speech Intelligibility Index calculation, and NAL- NL1 and 2 prescriptive rationales assume an LTASS obtained by averaging 1/3 octave bands of speech over time and these signals live up to those requirements.
Composite signalICRA: This speech spectrum shaped composite signal has the same LTASS as speech signals but it is more stable and without significant variation in inten-sity and frequency in the short-term. ICRA can be used to perform reliable measurements on non-linear digital hearing aids. Even though ICRA is a type of speech noise, a noise cancellation system in a hearing aid will identify it as speech due to its spectral and temporal properties. The disadvantage is that it is not a phonetically and phonemically balanced representation of speech. ICRA was the preferred signal before ISTS and Standard Speech 1&2 became widely used, however it is no longer the signal of choice for REM because the other options more closely resemble speech.
Terminology
Position of equipment
Otoscopic examination
Calibrating probe tube
Client placement
Signal types and levels
Test of openness of fitting
MPO and on-ear measurements
Coupler verification
Consistency above all
Conclusion
References
December 4, 2015 08:55am
Speechm11p/NAL-NL2 audio� Max TM SPL 120 lli)140 I On-ear _J 11 Open �
I Single view _J I Audiometry I130 I Graph _J UCL Average Age I Adult
120 Transducer I Headphone RECD Average BCT N/A
Scale I SPL 110 REDD Average
100 I Loss simulator I 90
80 ..di Pink noise I NIA 3 1 I 65 d
70
60 GI Pink noise I NIA 3
50 2 I 65 d 40
30 _d lspeech-std(F) 3 3 I Soft (55) I SIi a 20
10 _d lspeech-std(F)
0 4 I Soft (55) I SIi a
·10 250 500 1000 2000 4000 8000 16000
Speechm11p/NAL-NL2 aUOln®i"� MaxTMSPL�
R 250 500 750 lk lk5 2k 3k 4k 6k Bk lOk 12k5 I On-ear _J II Open � l5PL UCL 111111111111 I Single view _J I I EnteredUCLIIIIIIIIIIII I Table _J
Audiometry
!Targetl 111111111111 UCL Average Age I Adult
[Test l [52[52[53[54[6o[66175 [66 [63 [56 [ss [56 Transducer I Headphone RECD Average
!Target2 111111111111 BCT N/A Scale I SPL
!Test 2 [52[52[52[5s["59[69[72165 [61 [ss [56 [57 REDD Average
1Target3 111111111111 I Loss simulator I !rest 3 111111111111 trarget4 111111111111 !rest 4 111111111111 ISPL threshldflslllllllllll ..di Pink noise I NIA 3 �naided (65) [56 ["59 [ss [53[53[56[57[ssi48142138 f"48 1 I 65 d Entered HL 1°11111111111 Entered BCTIIIIIIIIIIII rittL to eHL 111111111111 �RECD l"9 r-:a 1"61"31"31"21"3 ro"""""""" GI Pink noise I NIA 3 HA·l RECD 111111111111 2 I 65 d MAP fls f1o 1919f1o113113 fis f16 fls f22 W
_d lspeech-std(F) 3 3 I Soft (55) I SIi 3
_d lspeech-std(F) d 4 I Soft (55) I SIi 3
Verifit-2 Serial number Cl744 Audioscan Software version 4.2.5
December 4, 2015 09:00am
Speechm11p/NAL-NL2 audio� Max TM SPL 120 lli)140 I On-ear _J 11 Open �
I Single view _J I Audiometry I130 I Graph _J UCL Average Age I Adult
120 Transducer I Headphone RECD Average BCT N/A
Scale I SPL 110 REDD Average
100 I Loss simulator I 90
80 ..di Pink noise I NIA 3 1 I 65 d
70
60 GI Pink noise I NIA 3
50 .� 2 I 65 d 40
30 _d lspeech-std(F) 3 3 I Soft (55) I SIi a 20
10 _d lspeech-std(F)
0 4 I Soft (55) I SIi a
·10 250 500 1000 2000 4000 8000 16000
Speechm11p/NAL-NL2 aUOl"®i"� MaxTMSPL�
R 250 500 750 lk lk5 2k 3k 4k 6k Bk lOk 12k5 I On-ear _J II Open � l5PL UCL 111111111111 I Single view _J I I EnteredUCLIIIIIIIIIIII I Table _J
Audiometry
!Targetl 111111111111 UCL Average Age I Adult
[Test l [52[52[53[54[6o[66175 [66 [63 [56 [ss [56 Transducer I Headphone RECD Average
!Target2 111111111111 BCT N/A Scale I SPL
!Test 2 fs2fs3fs3159 fs6fs6fssfs3fslr«148148 REDD Average
1Target3 111111111111 I Loss simulator I !rest 3 111111111111 trarget4 111111111111 !rest 4 111111111111 ISPL threshldflslllllllllll ..di Pink noise I NIA 3 �naided (65) [56159[ss[53[53[56157[ss148142138146 1 I 65 d Entered HL 1°11111111111 Entered BCTIIIIIIIIIIII rittL to eHL 111111111111 �RECD l"9 r-:a 1"61"31"31"21"3 ro"""""""" GI Pink noise I NIA 3 HA·l RECD 111111111111 2 I 65 d MAP fls f1o 1919f1o113113 fis f16 fls f22 W
_d lspeech-std(F) 3 3 I Soft (55) I SIi 3
_d lspeech-std(F) d 4 I Soft (55) I SIi 3
Verifit-2 Serial number Cl744 Audioscan Software version 4.2.5
9
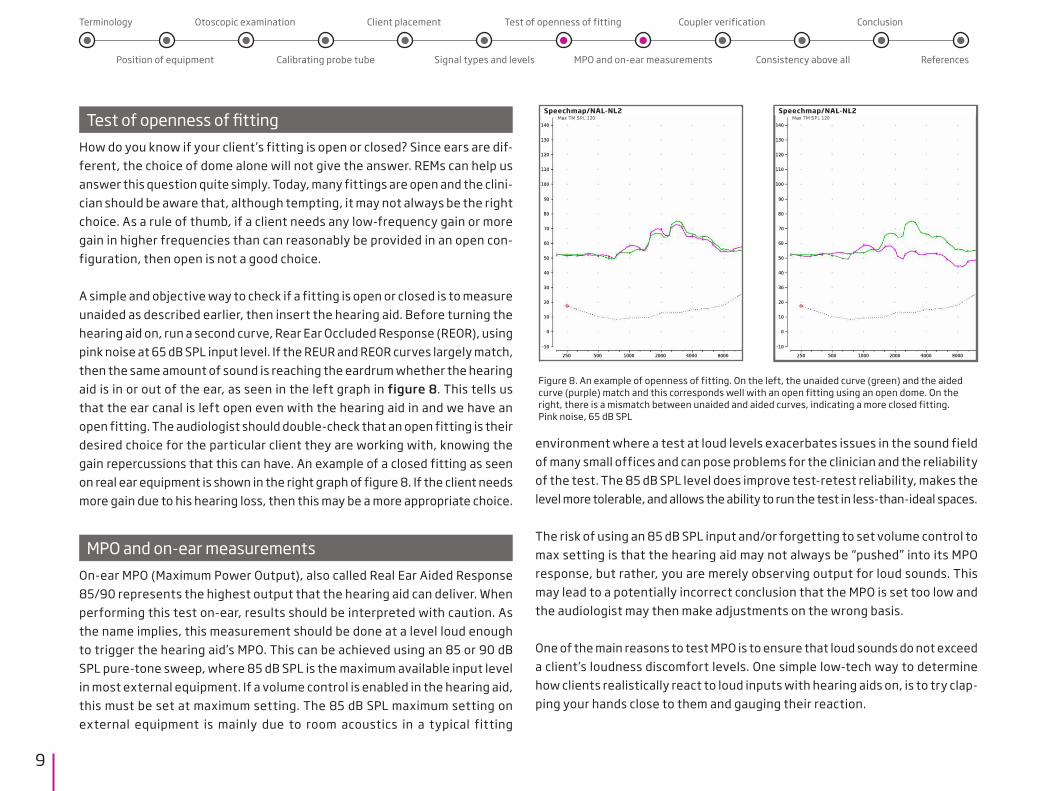
Test of openness of fittingHow do you know if your client’s fitting is open or closed? Since ears are dif-ferent, the choice of dome alone will not give the answer. REMs can help us answer this question quite simply. Today, many fittings are open and the clini-cian should be aware that, although tempting, it may not always be the right choice. As a rule of thumb, if a client needs any low-frequency gain or more gain in higher frequencies than can reasonably be provided in an open con-figuration, then open is not a good choice.
A simple and objective way to check if a fitting is open or closed is to measure unaided as described earlier, then insert the hearing aid. Before turning the hearing aid on, run a second curve, Rear Ear Occluded Response (REOR), using pink noise at 65 dB SPL input level. If the REUR and REOR curves largely match, then the same amount of sound is reaching the eardrum whether the hearing aid is in or out of the ear, as seen in the left graph in figure 8. This tells us that the ear canal is left open even with the hearing aid in and we have an open fitting. The audiologist should double-check that an open fitting is their desired choice for the particular client they are working with, knowing the gain repercussions that this can have. An example of a closed fitting as seen on real ear equipment is shown in the right graph of figure 8. If the client needs more gain due to his hearing loss, then this may be a more appropriate choice.
MPO and on-ear measurementsOn-ear MPO (Maximum Power Output), also called Real Ear Aided Response 85/90 represents the highest output that the hearing aid can deliver. When performing this test on-ear, results should be interpreted with caution. As the name implies, this measurement should be done at a level loud enough to trigger the hearing aid’s MPO. This can be achieved using an 85 or 90 dB SPL pure-tone sweep, where 85 dB SPL is the maximum available input level in most external equipment. If a volume control is enabled in the hearing aid, this must be set at maximum setting. The 85 dB SPL maximum setting on external equipment is mainly due to room acoustics in a typical fitting
environment where a test at loud levels exacerbates issues in the sound field of many small offices and can pose problems for the clinician and the reliability of the test. The 85 dB SPL level does improve test-retest reliability, makes the level more tolerable, and allows the ability to run the test in less-than-ideal spaces.
The risk of using an 85 dB SPL input and/or forgetting to set volume control to max setting is that the hearing aid may not always be “pushed” into its MPO response, but rather, you are merely observing output for loud sounds. This may lead to a potentially incorrect conclusion that the MPO is set too low and the audiologist may then make adjustments on the wrong basis.
One of the main reasons to test MPO is to ensure that loud sounds do not exceed a client’s loudness discomfort levels. One simple low-tech way to determine how clients realistically react to loud inputs with hearing aids on, is to try clap-ping your hands close to them and gauging their reaction.
Figure 8. An example of openness of fitting. On the left, the unaided curve (green) and the aided curve (purple) match and this corresponds well with an open fitting using an open dome. On the right, there is a mismatch between unaided and aided curves, indicating a more closed fitting. Pink noise, 65 dB SPL
Terminology
Position of equipment
Otoscopic examination
Calibrating probe tube
Client placement
Signal types and levels
Test of openness of fitting
MPO and on-ear measurements
Coupler verification
Consistency above all
Conclusion
References
Speechmap/NAL-NL2 Speechmap/NAL-NL2
10
A word on coupler verification for open fittingsThere is currently no reliable way to predict open fitting hearing aid perfor-mance on the ear from simulated REMs performed in a test box with any cou-pler. Open fittings are based on open ear acoustics or large vent sizes, and without this information, an estimate of the maximum stable gain is not pre-dictive. Attempts have been made to make an open coupler that could help clinicians in this regard, but this type of coupler has not been shown to accu-rately predict performance on ear. This is an area where investigations are ongoing, and until there is more clarity on which direction to go, it is not recommended that you verify open fittings in a test box. Closed fittings and fittings with a pressure vent (0.8 mm) can be verified in a test box and the recommended coupler and settings will vary depending on the REM equip-ment brand.
Referring to the MPO measurement in the previous section, it is possible to measure MPO with a 90 dB SPL input level in the test box, but the hearing aid must be measured occluded.
Consistency above allAny clinician can inadvertently make mistakes that affect the results and the interpretation of the measurements. This section lists some of the most com-mon pitfalls related to working with manufacturer’s fitting software on the one hand and external equipment on the other hand.
RationalesThe prescriptive rationale chosen in the manufacturer’s fitting software must match the prescriptive rationale chosen in the REM module. If the manufacturer’s proprietary rationale is chosen (Oticon VAC+), then it cannot be compared to
a generic target prescription (NAL-NL1, NAL-NL2, etc) shown in the REM equip-ment. Targets will not match. If you would like to determine how well a manu-facturer’s rationale targets are met, then these targets have to be manually entered into the REM equipment. This is not possible on all REM equipment. Check with the individual manufacturer for available option.
Be aware that rationales can be implemented in various ways that are open to interpretation because some implementation factors may not have been specified in detail by the rationale authors. Unfortunately, this means that targets can vary across manufacturer and equipment software and this makes it more difficult to compare them.
REM software If the client’s hearing aid is a Behind-The-Ear (BTE) style, then this style must be selected in the external REM equipment as well. The Receiver-In-The-Ear (RITE) style is not the same as a BTE in REM equipment. Determine from the external equipment manufacturer’s manual when to choose BTE, RITE, Open, or other options given.
The most important difference between BTE, RITE and ITE when measuring REM on ear is the microphone location effect (MLE). MLE refers to the differ-ences in microphone location for the different styles. BTE and RITE have very similar microphone locations behind the helix of the outer ear. The microphone for ITE is placed lower, at concha level, and deeper in the ear canal. The dis-tance from the reference microphone varies therefore depending on the style. MLE is limited to high frequencies only, where the wavelength of the sound is similar in size to the head and pinna, which create the diffraction effect. In order to compensate for MLE, certain correction factors need to be applied, depending on the hearing aid style (Dillon, 2012).
Terminology
Position of equipment
Otoscopic examination
Calibrating probe tube
Client placement
Signal types and levels
Test of openness of fitting
MPO and on-ear measurements
Coupler verification
Consistency above all
Conclusion
References

11
Hearing aids and fitting softwareFollow the hearing aid manufacturer’s guidelines on what settings and features to activate/deactivate during a REM. Using a dynamic speech signal and performing REMs with the client facing the REM equipment should eliminate effects of directionality and noise reduction, but there may still be reasons to deactivate or change settings in some cases.
Select correct style, coupling, and venting choices across equipment, if prompted.
Audiogram and client informationThe audiogram must be identical across equipment. Do not let the difference in display between dB HL and dB SPL confuse you.
Make sure you enter the transducer (headphones versus inserts) used during audiometric testing correctly across equipment.
Information about age, gender, language, experience level, and hearing loss type and configuration can affect targets for different fitting rationales. Bear this in mind and enter all pertinent information when prompted.
Graph viewsCompare apples to apples. You may or may not have the same view options in your fitting software as in your REM equipment when it comes to the type of signal used for testing (ISTS versus ICRA) and input signal levels (50 dB SPL? 55? 65? 75? 80? Etc). If signal types and levels are not comparable, then take this into consideration when interpreting the results.
Terminology
Position of equipment
Otoscopic examination
Calibrating probe tube
Client placement
Signal types and levels
Test of openness of fitting
MPO and on-ear measurements
Coupler verification
Consistency above all
Conclusion
What is good target match?As hearing care professionals, we are used to looking at graphs, curves, and numbers every day. We rely on them to tell us what our clients are hearing and what we can expect the hearing aid to be doing. It is important to under-stand that a perfect match to target is nice, but not realistic. Gatehouse et al (2001) have suggested a range as guidance on how closely hearing aid gain and rationale targets should match. They recommend a tolerance of +/- 5 dB at 250, 500, 1000 and 2000 Hz and a tolerance of +/- 8 dB at 3000 and 4000 Hz. Furthermore, they recommend that the slope in each octave should be within +/- 5 dB/octave of the target. Figure 9 illustrates the suggested range of good target match. In real ears, many factors determine how closely gain curves match targets, such as ear canal volume and shape, hearing aid inser-tion depth, position on the ear (BTE and RITE), venting, and so forth. Using a target range rather than individual target numbers is a good rule of thumb for successful fittings where adequate gain as well as sound quality are taken into account.
References
70
60
50
40
30
20
10
100 1000 10000
0
80Simulated CurveTarget Curve
Inse
rtio
n Ga
in (d
B)Frequency (Hz)
Figure 9. Suggested range of good target match. The shaded area around the target curve (dotted line) shows the range within which gain should be provided. A curve above this range would indicate excessive gain, while a curve that falls under this range would indi-cate insufficient gain.
12
Terminology
Position of equipment
Otoscopic examination
Calibrating probe tube
Client placement
Signal types and levels
Test of openness of fitting
MPO and on-ear measurements
Coupler verification
Consistency above all
Conclusion
References
ConclusionWhen REMs do not produce the expected results, there are many factors to check before assuming that results are related to hearing aid function. Of course, there are times where the hearing aid is the very reason why the curves do not look as expected. That is, after all, one of the reasons we carry out the measurements in the first place. That said, it is important to be mind-ful of best practice guidelines, not only when it comes to verification of hearing aids, but also earlier in the process when client lifestyle, hearing aid style and most importantly, hearing aid acoustics are considered. This will help save time and frustration when verifying the hearing aids later in the process.
Common sense goes a long way and therefore, here is a gentle reminder to always be diligent and detail-oriented when performing REMs. Be mindful of your acoustic surroundings, follow consistent steps to achieve proper probe insertion and then verify your placement by running an unaided measurement. Check that the hearing aids are set up as desired and that all hearing aid information and client information is entered correctly into fitting software and REM equipment and that the information is the same. If the manufacturer recommends certain settings for REM, then respect and follow these recommendations, since there are good reasons why they are in place. REMs are a reliable and wonderful tool available to clinicians, and ensuring best practice procedures benefits clinicians and clients alike.

13
Aarts, N.L. & Caffee, C.S. The Accuracy And Clinical Usefulness of Manufacturer-Predicted REAR Values in Adult Hearing Aid Fittings. International Journal of Audiology. Vol 44, no. 5 (2005) pp. 293-301
Aazh, H. & Moore, B. C. J. The Value of Routine Real Ear Measurement of Gain of Digital Hearing aids. Journal of the American Academy of Audiology. Vol. 18, no. 8 (2007) pp. 653 – 664.
British Society of Audiology. (2007). Guidance on the Use of Real Ear Measurement to Verify the Fitting of Digital Signal Processing Hearing Aids.
Dillon, H. (2012). Hearing Aids. New York, New York. Thieme.
Fabry D. (2004) Real Ear Measurements and Digital Hearing Aids: Realities, Myths, and Measurement Techniques. Phonak Focus no. 32. (http://www.phonak.com).
Hawkins, D. B., & Cook, J. A. (2003). Hearing aid software predictive gain values: How accurate are they?. The Hearing Journal, 56(7), 26-28.
Hawkins, D. B., & Mueller, H. G. (1992). Procedural considerations in probe-micro-phone measurements. Mueller HG, Hawkins DB, Northern JL. Probe microphone measurements: hearing aid selection and assessment. San Diego: Singular, 67-90.
Holube, I & EHIMA-ISMADHA working group (2007). Short description of the International Speech Test Signal (ISTS). Center of Competence HörTech and Institute of Hearing Technology and Audiology, Oldenburg, Germany.
Humes, L. E. (2012). Cover story: Verification and Validation: The Chasm between protocol and Practice. The Hearing Journal, 65(3), 8-10.
Jespersen, C. T., & Møller, K. N. (2013). Reliability of real ear insertion gain in behind-the-ear hearing aids with different coupling systems to the ear canal. International journal of audiology, 52(3), 169-176.
Kochkin, S. (2011). MarkeTrak VIII: Reducing patient visits through verification & val-idation. Hearing Review, 18(6), 10-12.
Kuk, F., Keenan, D., & Ludvigsen, C. (2005). Efficacy of an open fitting hearing aid. Hearing Review, 12(2), 26-32.
Mueller, H. G. (2001). Probe Microphone measurements: 20 years of progress. Trends in amplification, 5(2), 35.
Pumford, J., & Sinclair, S. (2001). Real-ear measurement: Basic terminology and pro-cedures. Audiology Online.
Taylor, B., & Mueller, H. G. (2011). Fitting and dispensing hearing aids. Plural Publishing.
Tecca, J. E. (1990). Clinical application of real ear probe tube measurement. Handbook of hearing aid amplification, 2, 225-255.
References
Terminology
Position of equipment
Otoscopic examination
Calibrating probe tube
Client placement
Signal types and levels
Test of openness of fitting
MPO and on-ear measurements
Coupler verification
Consistency above all
Conclusion
References

www.oticon.com
1224
1
1555
5-10
026
/ 12.
16