the reliability of musculoskeletal ultrasound video ... · the reliability of musculoskeletal...
TRANSCRIPT

International Journal of Scientific and Research Publications, Volume 4, Issue 10, October 2014 1 ISSN 2250-3153
www.ijsrp.org
The Reliability of Musculoskeletal Ultrasound Video
Tracking of Muscle and Tendon Displacement
Dones VCIII1,5
, Thomas J2, Lesniewski P
3, Thoirs K
4, Grimmer K
1, Suarez C
5
1 International Centre for Allied Health Evidence, University of South Australia
2 Group Scientific Pty Ltd, Australia 3 School of Engineering, University of South Australia
4 School of Health Sciences, University of South Australia 5 College of Rehabilitation Sciences, University of Santo Tomas
Abstract- Introduction: Lateral epicondylalgia [LE] is most
common cause of elbow pain attributed to abnormalities in the
extensor carpi radialis and extensor digitorum communis [EDC].
Quantifying the linear displacement using musculoskeletal
ultrasound and the Motion Tracking Analysis Program [MTAP]
may be useful in characterizing the abnormalities found in
elbows with LE. This study investigated the reliability of the
operators [i.e. sonologist and sonographer] and the reader [i.e.
physiotherapist] in procuring and analyzing ultrasound videos
using MTAP.
Methods: Participants were recruited from private
physiotherapy clinics in Adelaide between October 2010 and
November 2010. To be included in the study, participants had to
be referred to the clinic for symptoms of pain on, or within 3 cm
of, the lateral epicondyle and have literacy in the English
language. Both elbows of participants were scanned
independently by two operators. The videos were analyzed by
reader using MTAP.
Results: Fifty two and 60 videos from 12 elbows of six
participants were procured by the sonographer and sinologist,
respectively. Intra-tester reliability was found to be most
acceptable in location 2 [EDC; sonographer: intraclass
correlation [ICC]=0.88, 95 percent confidence interval [95% CI]
=0.46-0.98 and sonologist: ICC=0.92, 95% CI=0.42-1.00].
Considering all 53 videos, there was an almost perfect agreement
in the tracking analysis of the reader [ICC=0.93, 95% CI=0.89-
0.96] with most of agreements occurring in location 2 [EDC].
Conclusion: The acceptable reliability of the sonographer,
sinologist, and reader in scanning and analyzing ultrasound
videos of the EDC suggests they may be used in characterizing
EDC movement in elbows with LE and thus, understanding the
role of the EDC in the production of pain in elbows with LE.
Index Terms- TENNIS ELBOW, LATERAL
EPICONDYLALGIA, TRACKING, ULTRASOUND,
RELIABILITY
I. INTRODUCTION
ateral epicondylalgia [LE] is the most common clinical
condition causing lateral elbow pain (1). It is secondary to
repetitive and forceful activities of the upper extremities (2) and
is common in cooks and automobile assembly line workers (3,4).
It typically occurs in individuals aged 35 to 60 years (5-7).
Elbow pain in LE is associated with the mechanical stresses on
the tendinous origins of forearm extensors, specifically of the
extensor carpi radialis brevis [ECRB], extensor carpi radialis
longus [ECRL], and extensor digitorum communis [EDC] (8-10).
The ECRB is most commonly cited as the cause of LE.9
Only one study used musculoskeletal ultrasound [MSUS] to
investigate the movement of the forearm extensor muscles in
elbows with LE. Liu et al. observed the decreased movement of
the extensor carpi radialis of two participants with LE after
application of elastic tape using a motion tracking program (11).
This study did not specifically report testing of the ECRL.
However, the figure in the paper points to this part of the
extensor carpi radialis. The study did not determine the reliability
of the process used in measuring the movement of the ECRL.
Although the ECRB is commonly reported as a cause for LE
(8,9,12-14), no one has investigated its linear displacement using
a motion tracking program. This may be due to the challenge of
sonographically delineating the borders of the ECRB. The
ECRB near the lateral epicondyle has a small cross-sectional area
and is found deep under the EDC (15). This makes it difficult to
measure.
The reliability of tracking movement in the ECRB and EDC
using MSUS depends on the MSUS machine and the motion
tracking program used. The MSUS videos have to be clear so
the muscle or tendon can be followed. The clarity of MSUS
videos depends on the skill of the operator and the imaging
protocol used. The anatomical site, equipment settings, scanning,
and interpretation procedures used all influence the quality of the
images obtained (16). The sensitivity also varies between MSUS
machines. It is influenced by gain, probe frequency, filtering and
pulse repetition rate (16).
Challenges in the use of a motion tracking program are two-
fold, namely: 1. difficulty in determining a landmark and 2. non-
trackable feature of interest in the moving muscle or tendon (11).
The landmark is a relatively fixed structure within the body such
as bone. The feature of interest is the part of the muscle or
tendon being tracked during body movement (17,18). Without an
observable landmark, it may be difficult to locate the feature of
interest (11). Once the feature of interest is identified, tracking its
movement within the MSUS video is complicated by poor
contrast, low signal-to-noise ratio, and typical blur common in
MSUS videos (17-18).
Given the many factors influencing the measurement of
moving muscle and tendons, the reliability of using a motion
L
International Journal of Scientific and Research Publications, Volume 4, Issue 10, October 2014 2
ISSN 2250-3153
www.ijsrp.org
tracking program in quantifying the linear displacement of the
ECRL and EDC in MSUS videos has to be evaluated. This aims
of study are to determine the:
1. standard error of measurement [SEM] of the reader in
using the Motion Tracking Analysis Program [MTAP]
in quantifying the linear displacement of the ECRL
[muscle] and EDC [muscle and tendons]
2. intra-tester and inter-tester reliability of the
sonographer1 and sonologist
2 in scanning the ECRL and
EDC in the elbows of participants with LE.
II. METHODS AND MATERIALS
Oversight
This study was approved by the Human Research Ethics
Committee of the University of * *** [ethics application protocol
number 21929]. Informed consent was obtained from the
participants.
Study Population
The study was conducted at the University of * *** School
of Health Sciences [Physiotherapy] Clinic. Participants were
recruited from private physiotherapy clinics in Adelaide between
October 2010 and November 2010. To be included in the study,
participants had to be referred to the clinic for symptoms of pain
on, or within 3 cm of, the lateral epicondyle in at least one elbow
and have literacy in the English language.
Patients were ineligible for inclusion if they had current
general body malaise [which may be indicative of systemic
illness], current diagnosis of cancer, previous or current fractures
in the upper limb, osteoarthritis of the elbow, recent blunt trauma
to the elbow, or previous surgery to the elbow.
Testers
The sonographer had postgraduate qualifications and 20
years of experience in musculoskeletal ultrasound. The
sonologist had 20 years of practice in rehabilitation medicine,
and had been using MSUS for the past three years. The reader
had 10 years of physiotherapy practice and had contributed to the
design of the MTAP software particularly used in this study.
Equipment
Musculoskeletal Ultrasound Instrument: Ultrasound
measurements were made with a Siemens Antares Sonoline
Ultrasound machine [Siemens Medical Solutions, USA, Inc,
Ultrasound Group Issaquah, WA] with a 5-13 MHz linear array
broadband transducer.
Mechanical Test Jig: Figure 1 shows the mechanical test jig
used to control the movement of the elbow and wrist during the
MSUS scan. The jig consisted of a wooden plank that positioned
1 Sonographers are diagnostic medical professionals who
perform ultrasonic imaging, 2 Sonologists are medical doctors
who perform ultrasonic imaging.
1 Sonologists are medical doctors who perform ultrasonic
imaging.
the forearm in pronation and supported the elbow in extension.
A universal goniometer was used to measure wrist flexion.

International Journal of Scientific and Research Publications, Volume 4, Issue 10, October 2014 3
ISSN 2250-3153
www.ijsrp.org
Figure 1. The mechanical test jig
Software: The MTAP in MatLabTM
was developed at the
Laser Light Scattering and Materials Science Laboratory of the
University of South Australia (17-18). The program uses
normalized cross-correlation to track a rectangular area known as
a template from frame-to-frame in the video (19). The initial
template is a region selected by the reader enclosing the feature
of interest in the first video frame. The template is cross-
correlated with the second frame of the video and the region of
best match generates the next version of the template which is
tracked in the subsequent frame and so on until the last frame is
processed. This adaptive template approach accommodates the
small changes which occur in the feature being tracked over
several frames and improves the tracking greatly (17-18).
Figure 2 shows a map of a typical cross-correlation matrix. The
location of the maximum is the best match between the template
and the video frame. This gives the new position and thus
displacement of the template.
Figure 2. Cross-correlation matrix shown as surface plot
The motion of physiological structures during movement is
complex and will usually consist of translational and rotational
displacement and deformation. In addition the displacement may
be perpendicular to the imaging plane so that, in MSUS videos,
structures will apparently change shape and orientation.17
This
makes them difficult to track throughout the video sequence
unless an adaptive template is used as is done here.

International Journal of Scientific and Research Publications, Volume 4, Issue 10, October 2014 4
ISSN 2250-3153
www.ijsrp.org
Even with the adaptive template, for some MSUS videos,
the correlation output matrix of the MTAP may contain multiple
maxima of similar magnitude resulting in ambiguous tracking as
shown in Figure 3. This may occur when the feature of interest
is ubiquitous or nondescript. The MTAP addresses this problem
by allowing the user to limit the template displacement between
max] and reduce the likelihood of jumping to
a different feature during tracking. This is a legitimate and
practical restriction given that the features can be observed to
move only small distances between adjacent frames and the
feature would be expected to be found in the neighborhood of its
position in the previous frame.
Figure 3. Cross-correlation matrix with multiple maxima
Provided that the template contains a pattern with sufficient
variance and that it correlates properly [i.e. maxima in the
correlation matrix exceeds 0.5, which is half of the perfect
match], the accuracy of the MTAP in determining template
displacement is one pixel. This determines the accuracy of the
template velocity.
Study Method
Initial Screening: A research assistant with four years of
clinical musculoskeletal experience oriented the participants to
the study, performed screening tests to determine their eligibility
and recorded the presence or absence of symptoms in both
elbows of the participants included in the study. Both elbows
were evaluated by the research assistant using the Mill test as a
screening test for LE (20).
Standard Musculoskeletal Protocol: Both elbows of
participants were scanned independently with the right elbow
initially investigated by the two operators. The right elbow was
imaged first to standardize the evaluation.
A stopwatch set at four seconds was used to coordinate the
timing of the participant’s active wrist flexion and start of MSUS
scan. During wrist flexion, the movement of the EDC and ECRL
were recorded using MSUS. Three locations were consecutively
scanned under a high frequency linear transducer head as
follows:
Location 1: Dorsal distal half of forearm. Here the upper
edge of the transducer head was placed on the distal 1/3 of the
forearm as shown in Figure 4. The transducer head was
positioned parallel to the long axis of the ulna. The EDC was
scanned at 1cm skin depth.

International Journal of Scientific and Research Publications, Volume 4, Issue 10, October 2014 5
ISSN 2250-3153
www.ijsrp.org
Figure 4. Placement of the transducer head on the dorsal distal half of the forearm (location 1)
Location 2: Dorsal proximal half of forearm. Here the
upper edge of the transducer head was placed at the level of the
upper end of the head of the radius on the proximal third of the
forearm as shown in Figure 5. The transducer head was
positioned parallel to the long axis of the radius. The EDC was
scanned at 1 cm skin depth.

International Journal of Scientific and Research Publications, Volume 4, Issue 10, October 2014 6
ISSN 2250-3153
www.ijsrp.org
Figure 5. Placement of the transducer head on dorsal proximal half of the forearm (location 2)
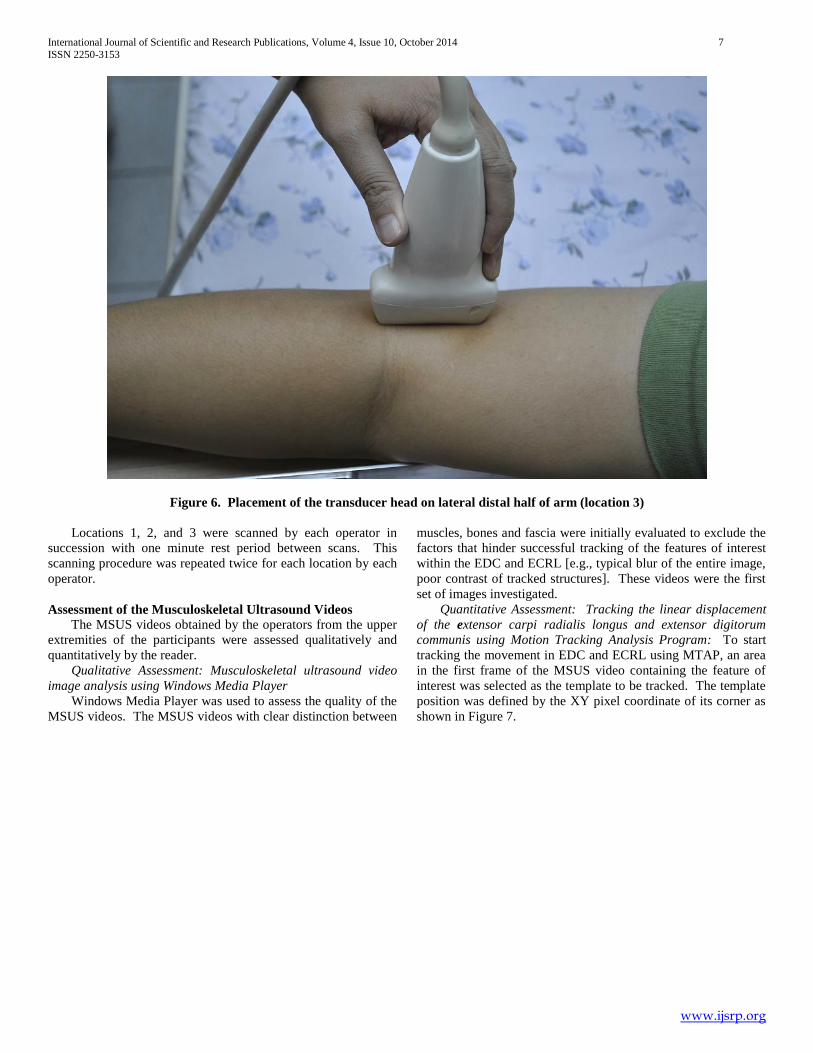
Location 3: Lateral distal half of arm. Here the lower
edge of the transducer head was placed immediately above the
lateral epicondyle on the distal third of the arm as shown in
Figure 6. The transducer head was positioned parallel to the
distal aspect of the humerus. The ECRL muscle was scanned at
2.5cm skin depth.
International Journal of Scientific and Research Publications, Volume 4, Issue 10, October 2014 7
ISSN 2250-3153
www.ijsrp.org
Figure 6. Placement of the transducer head on lateral distal half of arm (location 3)
Locations 1, 2, and 3 were scanned by each operator in
succession with one minute rest period between scans. This
scanning procedure was repeated twice for each location by each
operator.
Assessment of the Musculoskeletal Ultrasound Videos
The MSUS videos obtained by the operators from the upper
extremities of the participants were assessed qualitatively and
quantitatively by the reader.
Qualitative Assessment: Musculoskeletal ultrasound video
image analysis using Windows Media Player
Windows Media Player was used to assess the quality of the
MSUS videos. The MSUS videos with clear distinction between
muscles, bones and fascia were initially evaluated to exclude the
factors that hinder successful tracking of the features of interest
within the EDC and ECRL [e.g., typical blur of the entire image,
poor contrast of tracked structures]. These videos were the first
set of images investigated.
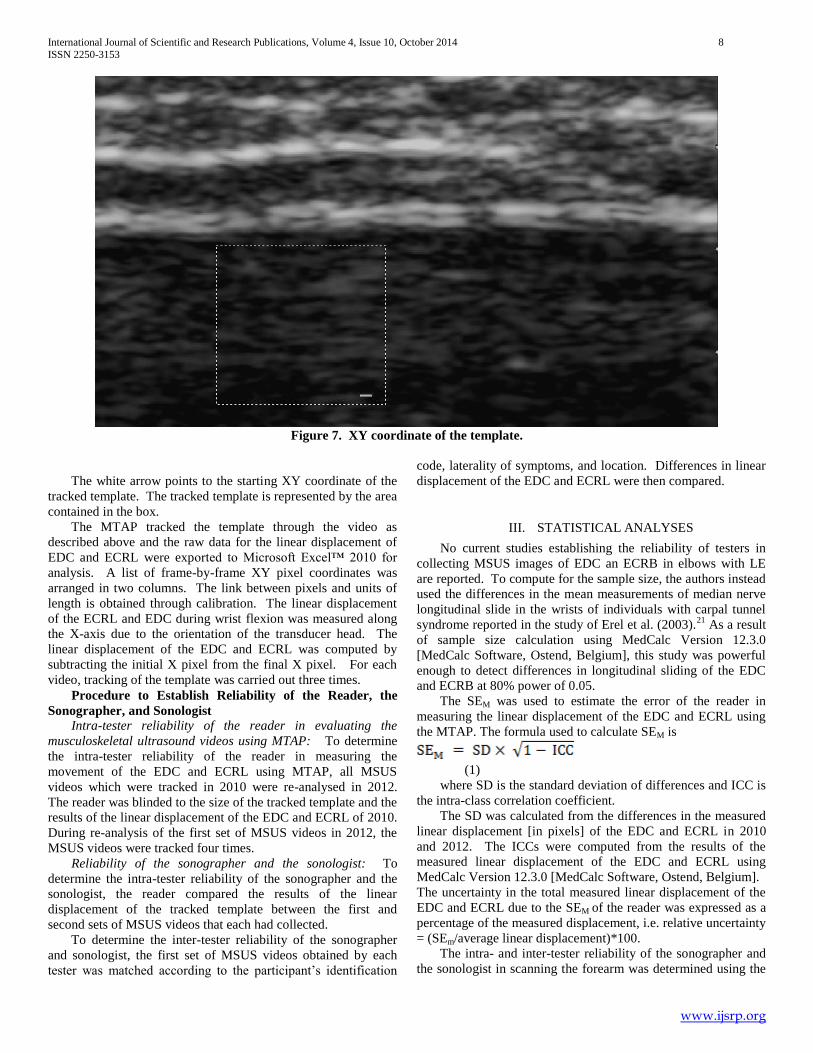
Quantitative Assessment: Tracking the linear displacement
of the extensor carpi radialis longus and extensor digitorum
communis using Motion Tracking Analysis Program: To start
tracking the movement in EDC and ECRL using MTAP, an area
in the first frame of the MSUS video containing the feature of
interest was selected as the template to be tracked. The template
position was defined by the XY pixel coordinate of its corner as
shown in Figure 7.
International Journal of Scientific and Research Publications, Volume 4, Issue 10, October 2014 8
ISSN 2250-3153
www.ijsrp.org
Figure 7. XY coordinate of the template.
The white arrow points to the starting XY coordinate of the
tracked template. The tracked template is represented by the area
contained in the box.
The MTAP tracked the template through the video as
described above and the raw data for the linear displacement of
EDC and ECRL were exported to Microsoft Excel™ 2010 for
analysis. A list of frame-by-frame XY pixel coordinates was
arranged in two columns. The link between pixels and units of
length is obtained through calibration. The linear displacement
of the ECRL and EDC during wrist flexion was measured along
the X-axis due to the orientation of the transducer head. The
linear displacement of the EDC and ECRL was computed by
subtracting the initial X pixel from the final X pixel. For each
video, tracking of the template was carried out three times.
Procedure to Establish Reliability of the Reader, the
Sonographer, and Sonologist
Intra-tester reliability of the reader in evaluating the
musculoskeletal ultrasound videos using MTAP: To determine
the intra-tester reliability of the reader in measuring the
movement of the EDC and ECRL using MTAP, all MSUS
videos which were tracked in 2010 were re-analysed in 2012.
The reader was blinded to the size of the tracked template and the
results of the linear displacement of the EDC and ECRL of 2010.
During re-analysis of the first set of MSUS videos in 2012, the
MSUS videos were tracked four times.
Reliability of the sonographer and the sonologist: To
determine the intra-tester reliability of the sonographer and the
sonologist, the reader compared the results of the linear
displacement of the tracked template between the first and
second sets of MSUS videos that each had collected.
To determine the inter-tester reliability of the sonographer
and sonologist, the first set of MSUS videos obtained by each
tester was matched according to the participant’s identification
code, laterality of symptoms, and location. Differences in linear
displacement of the EDC and ECRL were then compared.
III. STATISTICAL ANALYSES
No current studies establishing the reliability of testers in
collecting MSUS images of EDC an ECRB in elbows with LE
are reported. To compute for the sample size, the authors instead
used the differences in the mean measurements of median nerve
longitudinal slide in the wrists of individuals with carpal tunnel
syndrome reported in the study of Erel et al. (2003).21
As a result
of sample size calculation using MedCalc Version 12.3.0
[MedCalc Software, Ostend, Belgium], this study was powerful
enough to detect differences in longitudinal sliding of the EDC
and ECRB at 80% power of 0.05.
The SEM was used to estimate the error of the reader in
measuring the linear displacement of the EDC and ECRL using
the MTAP. The formula used to calculate SEM is
(1)
where SD is the standard deviation of differences and ICC is
the intra-class correlation coefficient.
The SD was calculated from the differences in the measured
linear displacement [in pixels] of the EDC and ECRL in 2010
and 2012. The ICCs were computed from the results of the
measured linear displacement of the EDC and ECRL using
MedCalc Version 12.3.0 [MedCalc Software, Ostend, Belgium].
The uncertainty in the total measured linear displacement of the
EDC and ECRL due to the SEM of the reader was expressed as a
percentage of the measured displacement, i.e. relative uncertainty
= (SEm/average linear displacement)*100.
The intra- and inter-tester reliability of the sonographer and
the sonologist in scanning the forearm was determined using the
International Journal of Scientific and Research Publications, Volume 4, Issue 10, October 2014 9
ISSN 2250-3153
www.ijsrp.org
ICC obtained using MedCalc. The ICC coefficient is a
commonly used statistical measure in determining the intra-tester
reliability of measurements of the same tester and inter-tester
reliability of measurements obtained by two different testers.
Single measures in ICC were used to obtain the intra-tester
reliability of each sonographer and sonologist in scanning the
linear displacement of the EDC and ECRL following a standard
scanning protocol. Moreover, the average measures of the linear
displacement of the EDC and ECRL of the sonographer and
sonologist were determined to obtain the inter-tester reliability of
both testers.
Intra-class correlation coefficients were interpreted as 0-0.2
= poor agreement, 0.3-0.4 = fair agreement, 0.5-0.6 = moderate
agreement, 0.7-0.8 = strong agreement, and >0.8 almost perfect
agreement.
IV. RESULTS
Participants
Six participants [three females, three males] aged 46 to 52
years [mean±SD: 49±2] with a mean duration of symptoms of
nine months [minimum to maximum: 2.5 to 14 months] were
included in the study. Among the 12 elbows of the six
participants, only eight elbows of four participants (three with
unilateral LE, one with bilateral LE) were scanned by both
sonographer and sonologist due to scheduling difficulties. Both
elbows of one participant were only scanned by the sonologist.
Number of Musculoskeletal Ultrasound Videos
As shown in Figure 8 there were a total of 112 MSUS video
scans recorded. The sonographer scanned a total of 52 MSUS
videos including 48 from eight elbows scanned twice for three
locations, and four from one elbow which were discarded by the
sonographer due to perceived image blurring but were viewed
clearly using the Windows Media Player by the reader, and thus
included in the tracking analysis. The sonologist scanned a total
of 60 MSUS videos including 48 from eight elbows scanned
twice for three locations and 12 from both elbows of one
participant [two elbows scanned twice for three locations].

International Journal of Scientific and Research Publications, Volume 4, Issue 10, October 2014 10
ISSN 2250-3153
www.ijsrp.org
Figure 8. Flowchart of scanned MSUS images. Key: MSUS, musculoskeletal ultrasound
Sonographe
r Sonologist
8 elbows 8 elbows 2 elbows
X 3 scans
corresponding
to the three
locations
X 3 scans
corresponding
to the three
locations
X 3 scans
corresponding
to the three
locations
24 MSUS
video
images
24 MSUS
video
images
6 MSUS
video
images
+ 2 MSUS
video
images
+ 24 MSUS
video
images
+ 2 MSUS
video
images
+ 24 MSUS
video
images
+ 6 MSUS
video
images
52 MSUS video images 60 MSUS video images
112 MSUS video
images
International Journal of Scientific and Research Publications, Volume 4, Issue 10, October 2014 11
ISSN 2250-3153
www.ijsrp.org
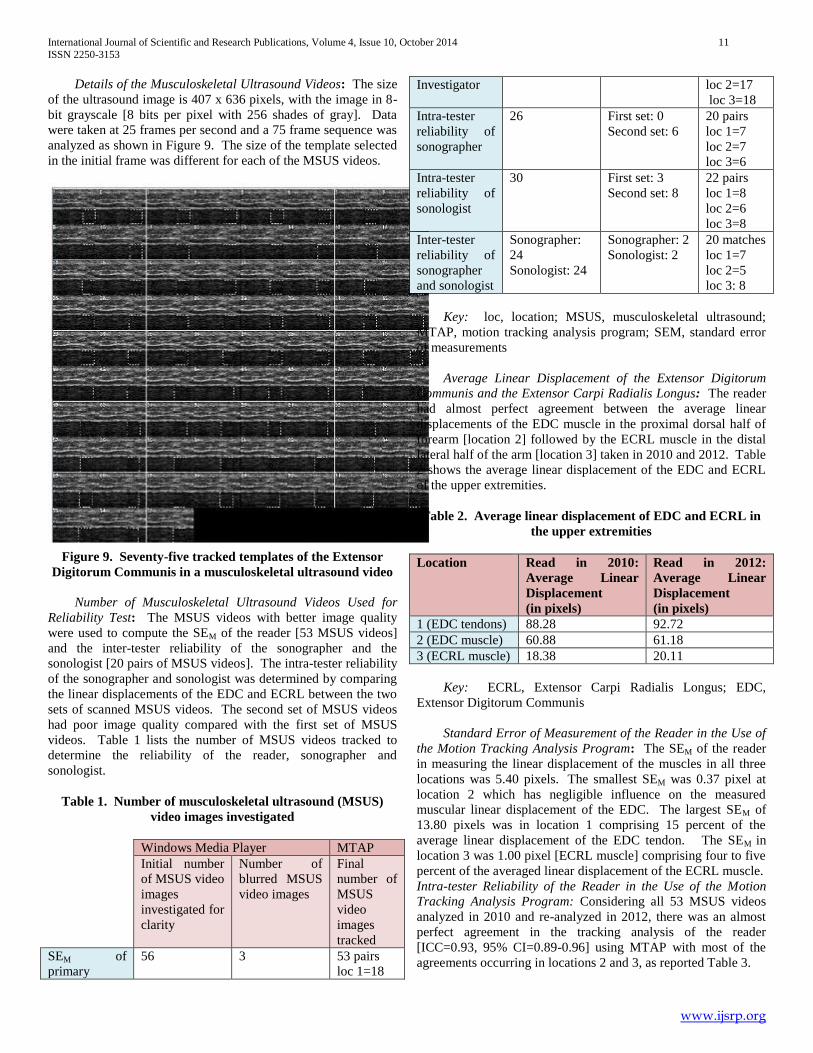
Details of the Musculoskeletal Ultrasound Videos: The size
of the ultrasound image is 407 x 636 pixels, with the image in 8-
bit grayscale [8 bits per pixel with 256 shades of gray]. Data
were taken at 25 frames per second and a 75 frame sequence was
analyzed as shown in Figure 9. The size of the template selected
in the initial frame was different for each of the MSUS videos.
Figure 9. Seventy-five tracked templates of the Extensor
Digitorum Communis in a musculoskeletal ultrasound video
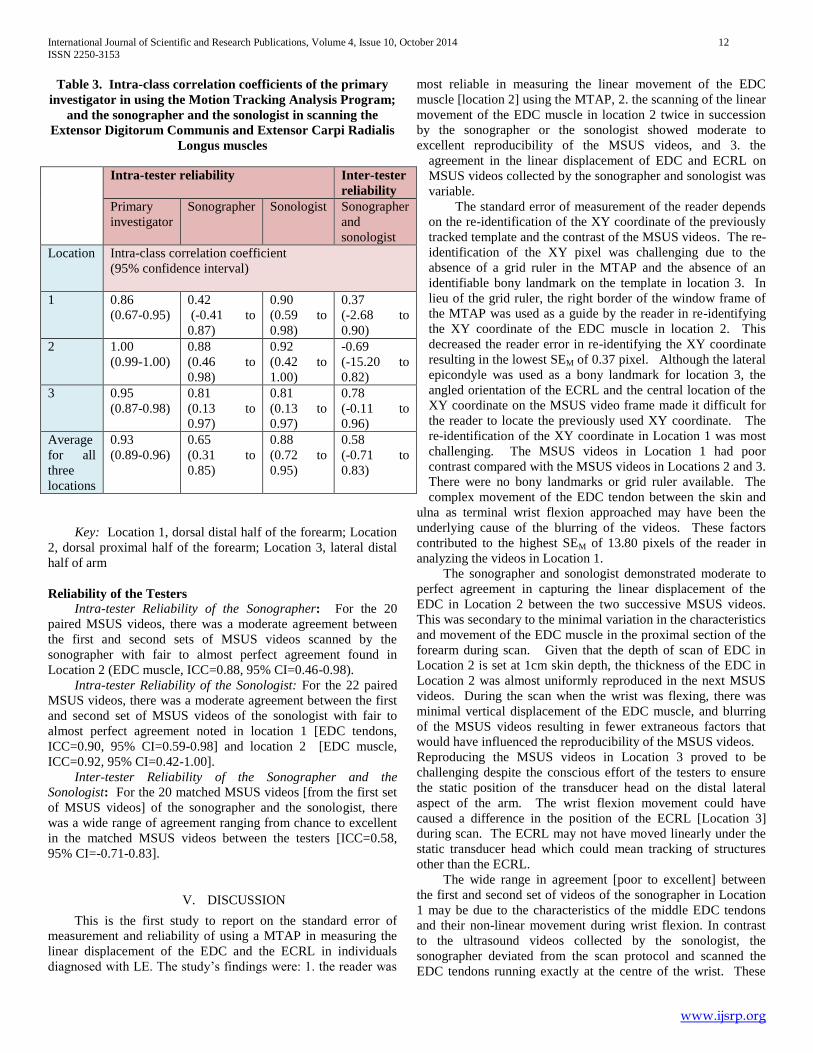
Number of Musculoskeletal Ultrasound Videos Used for
Reliability Test: The MSUS videos with better image quality
were used to compute the SEM of the reader [53 MSUS videos]
and the inter-tester reliability of the sonographer and the
sonologist [20 pairs of MSUS videos]. The intra-tester reliability
of the sonographer and sonologist was determined by comparing
the linear displacements of the EDC and ECRL between the two
sets of scanned MSUS videos. The second set of MSUS videos
had poor image quality compared with the first set of MSUS
videos. Table 1 lists the number of MSUS videos tracked to
determine the reliability of the reader, sonographer and
sonologist.
Table 1. Number of musculoskeletal ultrasound (MSUS)
video images investigated
Windows Media Player MTAP
Initial number
of MSUS video
images
investigated for
clarity
Number of
blurred MSUS
video images
Final
number of
MSUS
video
images
tracked
SEM of
primary
56 3 53 pairs
loc 1=18
Investigator loc 2=17
loc 3=18
Intra-tester
reliability of
sonographer
26 First set: 0
Second set: 6
20 pairs
loc 1=7
loc 2=7
loc 3=6
Intra-tester
reliability of
sonologist
30 First set: 3
Second set: 8
22 pairs
loc 1=8
loc 2=6
loc 3=8
Inter-tester
reliability of
sonographer
and sonologist
Sonographer:
24
Sonologist: 24
Sonographer: 2
Sonologist: 2
20 matches
loc 1=7
loc 2=5
loc 3: 8
Key: loc, location; MSUS, musculoskeletal ultrasound;
MTAP, motion tracking analysis program; SEM, standard error
of measurements
Average Linear Displacement of the Extensor Digitorum
Communis and the Extensor Carpi Radialis Longus: The reader
had almost perfect agreement between the average linear
displacements of the EDC muscle in the proximal dorsal half of
forearm [location 2] followed by the ECRL muscle in the distal
lateral half of the arm [location 3] taken in 2010 and 2012. Table
2 shows the average linear displacement of the EDC and ECRL
of the upper extremities.
Table 2. Average linear displacement of EDC and ECRL in
the upper extremities
Location Read in 2010:
Average Linear
Displacement
(in pixels)
Read in 2012:
Average Linear
Displacement
(in pixels)
1 (EDC tendons) 88.28 92.72
2 (EDC muscle) 60.88 61.18
3 (ECRL muscle) 18.38 20.11
Key: ECRL, Extensor Carpi Radialis Longus; EDC,
Extensor Digitorum Communis
Standard Error of Measurement of the Reader in the Use of
the Motion Tracking Analysis Program: The SEM of the reader
in measuring the linear displacement of the muscles in all three
locations was 5.40 pixels. The smallest SEM was 0.37 pixel at
location 2 which has negligible influence on the measured
muscular linear displacement of the EDC. The largest SEM of
13.80 pixels was in location 1 comprising 15 percent of the
average linear displacement of the EDC tendon. The SEM in
location 3 was 1.00 pixel [ECRL muscle] comprising four to five
percent of the averaged linear displacement of the ECRL muscle.
Intra-tester Reliability of the Reader in the Use of the Motion
Tracking Analysis Program: Considering all 53 MSUS videos
analyzed in 2010 and re-analyzed in 2012, there was an almost
perfect agreement in the tracking analysis of the reader
[ICC=0.93, 95% CI=0.89-0.96] using MTAP with most of the
agreements occurring in locations 2 and 3, as reported Table 3.
International Journal of Scientific and Research Publications, Volume 4, Issue 10, October 2014 12
ISSN 2250-3153
www.ijsrp.org
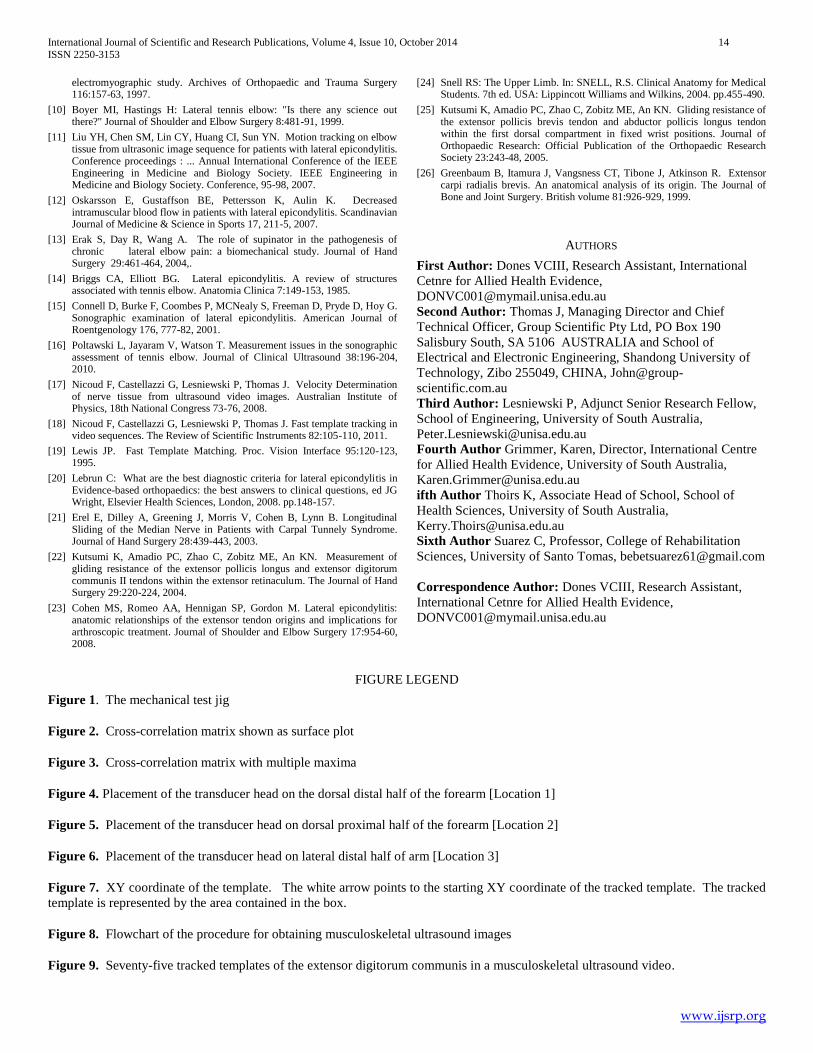
Table 3. Intra-class correlation coefficients of the primary
investigator in using the Motion Tracking Analysis Program;
and the sonographer and the sonologist in scanning the
Extensor Digitorum Communis and Extensor Carpi Radialis
Longus muscles
Key: Location 1, dorsal distal half of the forearm; Location
2, dorsal proximal half of the forearm; Location 3, lateral distal
half of arm
Reliability of the Testers
Intra-tester Reliability of the Sonographer: For the 20
paired MSUS videos, there was a moderate agreement between
the first and second sets of MSUS videos scanned by the
sonographer with fair to almost perfect agreement found in
Location 2 (EDC muscle, ICC=0.88, 95% CI=0.46-0.98).
Intra-tester Reliability of the Sonologist: For the 22 paired
MSUS videos, there was a moderate agreement between the first
and second set of MSUS videos of the sonologist with fair to
almost perfect agreement noted in location 1 [EDC tendons,
ICC=0.90, 95% CI=0.59-0.98] and location 2 [EDC muscle,
ICC=0.92, 95% CI=0.42-1.00].
Inter-tester Reliability of the Sonographer and the
Sonologist: For the 20 matched MSUS videos [from the first set
of MSUS videos] of the sonographer and the sonologist, there
was a wide range of agreement ranging from chance to excellent
in the matched MSUS videos between the testers [ICC=0.58,
95% CI=-0.71-0.83].
V. DISCUSSION
This is the first study to report on the standard error of
measurement and reliability of using a MTAP in measuring the
linear displacement of the EDC and the ECRL in individuals
diagnosed with LE. The study’s findings were: 1. the reader was
most reliable in measuring the linear movement of the EDC
muscle [location 2] using the MTAP, 2. the scanning of the linear
movement of the EDC muscle in location 2 twice in succession
by the sonographer or the sonologist showed moderate to
excellent reproducibility of the MSUS videos, and 3. the
agreement in the linear displacement of EDC and ECRL on
MSUS videos collected by the sonographer and sonologist was
variable.
The standard error of measurement of the reader depends
on the re-identification of the XY coordinate of the previously
tracked template and the contrast of the MSUS videos. The re-
identification of the XY pixel was challenging due to the
absence of a grid ruler in the MTAP and the absence of an
identifiable bony landmark on the template in location 3. In
lieu of the grid ruler, the right border of the window frame of
the MTAP was used as a guide by the reader in re-identifying
the XY coordinate of the EDC muscle in location 2. This
decreased the reader error in re-identifying the XY coordinate
resulting in the lowest SEM of 0.37 pixel. Although the lateral
epicondyle was used as a bony landmark for location 3, the
angled orientation of the ECRL and the central location of the
XY coordinate on the MSUS video frame made it difficult for
the reader to locate the previously used XY coordinate. The
re-identification of the XY coordinate in Location 1 was most
challenging. The MSUS videos in Location 1 had poor
contrast compared with the MSUS videos in Locations 2 and 3.
There were no bony landmarks or grid ruler available. The
complex movement of the EDC tendon between the skin and
ulna as terminal wrist flexion approached may have been the
underlying cause of the blurring of the videos. These factors
contributed to the highest SEM of 13.80 pixels of the reader in
analyzing the videos in Location 1.
The sonographer and sonologist demonstrated moderate to
perfect agreement in capturing the linear displacement of the
EDC in Location 2 between the two successive MSUS videos.
This was secondary to the minimal variation in the characteristics
and movement of the EDC muscle in the proximal section of the
forearm during scan. Given that the depth of scan of EDC in
Location 2 is set at 1cm skin depth, the thickness of the EDC in
Location 2 was almost uniformly reproduced in the next MSUS
videos. During the scan when the wrist was flexing, there was
minimal vertical displacement of the EDC muscle, and blurring
of the MSUS videos resulting in fewer extraneous factors that
would have influenced the reproducibility of the MSUS videos.
Reproducing the MSUS videos in Location 3 proved to be
challenging despite the conscious effort of the testers to ensure
the static position of the transducer head on the distal lateral
aspect of the arm. The wrist flexion movement could have
caused a difference in the position of the ECRL [Location 3]
during scan. The ECRL may not have moved linearly under the
static transducer head which could mean tracking of structures
other than the ECRL.
The wide range in agreement [poor to excellent] between
the first and second set of videos of the sonographer in Location
1 may be due to the characteristics of the middle EDC tendons
and their non-linear movement during wrist flexion. In contrast
to the ultrasound videos collected by the sonologist, the
sonographer deviated from the scan protocol and scanned the
EDC tendons running exactly at the centre of the wrist. These
Intra-tester reliability Inter-tester
reliability
Primary
investigator
Sonographer Sonologist Sonographer
and
sonologist
Location Intra-class correlation coefficient
(95% confidence interval)
1 0.86
(0.67-0.95)
0.42
(-0.41 to
0.87)
0.90
(0.59 to
0.98)
0.37
(-2.68 to
0.90)
2 1.00
(0.99-1.00)
0.88
(0.46 to
0.98)
0.92
(0.42 to
1.00)
-0.69
(-15.20 to
0.82)
3 0.95
(0.87-0.98)
0.81
(0.13 to
0.97)
0.81
(0.13 to
0.97)
0.78
(-0.11 to
0.96)
Average
for all
three
locations
0.93
(0.89-0.96)
0.65
(0.31 to
0.85)
0.88
(0.72 to
0.95)
0.58
(-0.71 to
0.83)

International Journal of Scientific and Research Publications, Volume 4, Issue 10, October 2014 13
ISSN 2250-3153
www.ijsrp.org
EDC tendons were more mobile than the tendons found at the
borders of the wrist (22). Moreover, the middle EDC tendon
movement could have been influenced by the repetitive wrist
flexion movement during scans releasing them and thus yielding
greater variations in the linear displacement of the EDC tendons.
Despite the use of a standard scanning protocol for EDC and
ECRL, there was a possibility of obtaining two significantly
different linear muscular displacements from two different
testers. Although our study controlled for variables such as
MSUS machine and mechanical test jig used, time of day of
scan, and standard protocol, factors such as differences in the
experience in MSUS use of the sonographer and sonologist,
number and timing of execution of wrist flexion, time in between
MSUS scans, differences in the angle of tilt and pressure used on
the transducer head, difference in the placement of the transducer
head and mechanical characteristics of the muscles and tendons
to movement caused varying agreement in the MSUS videos
obtained by the sonographer and the sonologist.
The MTAP can be a reliable tool in measuring the linear
displacement of EDC muscles in the proximal dorsal half of the
forearm. The uniform characteristics of the structures under
investigation during movement, such as found in the EDC
muscle in Location 2, and scanning twice in succession are likely
to increase the reproducibility of the MSUS videos. The MSUS
scan procedures which are open to varying interpretation [such as
that used in scanning the ECRL in Location 3] should be
clarified prior to the implementation of the study.
Implications for Research
There is a need to standardise the protocol in scanning for
the movement of the EDC tendon in Location 1. A specific point
on the dorsum of the wrist to place the transducer head to scan
the EDC tendon should be agreed prior to scanning.
A modern system which automatically puts the MSUS
machine in scan mode once wrist flexion starts addresses the
time lag that occurs in a manual and operator dependent system.
A visual display of wrist flexion will provide an additional cue to
verbal promptings, thus, improving the timing for initiation of
wrist flexion.
Limitations of the Study
The study did not trace the scanned EDC and ECRL from
their origin which could have further enabled the sonographer
and sonologist in identifying these structures. Instead, the guide
used by the testers in identifying the EDC and ECRL was based
on descriptions of the muscles origin and insertion as found in
the studies by Bunata et al. (8), Cohen et al. (23), Snell (24),
Kutsumi et al. (22,25), and Greenbaum et al. (26).
The study used a system where the reader coordinated the
synchronous initiation of wrist flexion movement and pressing of
the scan button by the tester. The time lag between the verbal
prompting of the reader and the initiation of the wrist flexion
movement, the verbal prompting of the reader and the pressing of
the scan button by the tester, and the initiation of the wrist
flexion movement and the pressing of the scan button by the
tester could have influenced the reproducibility of the MSUS
videos. This time lag was not quantified in this study. The
extent to which time lag affected the reliability of the testers was
not determined in this study. Moreover, the non-fixed shoulder
and elbow joints could have influenced the reliability of the
testers and was not assessed in this study.
Due to unavoidable errors in scanning such as the
transducer head slipping off the skin while the wrist was flexing,
a number of patients had to repeat the wrist flexion movement
more than six times per limb. This could have influenced the
extensibility of the forearm extensor muscles thus affecting the
linear displacement of the EDC [muscle and tendon] and ECRL
[muscle].
VI. CONCLUSION
Using the MTAP, the reader was most reliable in
determining the linear muscular displacement of the EDC in the
proximal dorsal half of the forearm of participants with at least
one upper extremity with LE. Additionally, each of the
sonographer and sonologist was reliable in scanning the EDC in
the proximal forearm scanned twice in succession. This
established reliability of the reader and the testers is important in
characterising the mobility of the EDC muscles which may
potentially clarify its role in the genesis of pain in elbows with
LE.
CONFLICT OF INTEREST
We certify that no party having a direct interest in the
results of the research supporting this article has or will confer a
benefit on us or on any organization with which we are
associated and, if applicable, we certify that all financial and
material support for this research and work are clearly identified
in the manuscript.
REFERENCES
[1] otnis NA, Chiavaras MM, Harish S. Lateral epicondylitis and beyond: imaging of lateral elbow pain with clinical-radiologic correlation. Skeletal Radiology 41:369-86, 2012.
[2] Shiri R, Viikari-Juntura E, Varonen H, Heliovaara M. Prevalence and determinants of lateral and medial epicondylitis: a population study. American Journal of Epidemiology 164, 1065-74, 2006.
[3] Ono Y, Nakamura R, Shimaoka M, Hiruta S, Hattori Y, Ichihara G, Kamijima M, Takeuchi Y. Epicondylitis among cooks in nursery schools. Occupational and Environmental Medicine 55:172-179, 1998.
[4] Bystrom S, Hall C, Welander T, Kilbom A. Clinical disorders and pressure-pain threshold of the forearm and hand among automobile assembly line workers. Journal of Hand Surgery 20:782-90, 1995.
[5] Shiri R, Viikari-Juntura E. Lateral and medial epicondylitis: role of occupational factors. Best practice & research. Clinical Rheumatology 25:43-57, 2011.
[6] Fan JZ, Silverstein BA, Bao S, Bonauto DK, Howard NL, Spielholz PO, Smith CK, Polissar NL, Viikari-Juntura E. Quantitative Exposure-Response Relations Between Physical Workload and Prevalence of Lateral Epicondylitis in a Working Population. American Journal of Industrial Medicine 52:479-490, 2009.
[7] Hamilton PG. The prevalence of humeral epicondylitis: a survey in general practice. The Journal of the Royal College of General Practitioners 36:464-465, 1986.
[8] Bunata RE, Brown DS, Capelo R. Anatomic factors related to the cause of tennis elbow. The Journal of Bone and Joint Surgery. American volume 89:1955-63, 2007.
[9] Albrecht S, Cordis R, Kleihues H, Noack W. Pathoanatomic findings in radiohumeral epicondylopathy. A combined anatomic and
International Journal of Scientific and Research Publications, Volume 4, Issue 10, October 2014 14
ISSN 2250-3153
www.ijsrp.org
electromyographic study. Archives of Orthopaedic and Trauma Surgery 116:157-63, 1997.
[10] Boyer MI, Hastings H: Lateral tennis elbow: "Is there any science out there?" Journal of Shoulder and Elbow Surgery 8:481-91, 1999.
[11] Liu YH, Chen SM, Lin CY, Huang CI, Sun YN. Motion tracking on elbow tissue from ultrasonic image sequence for patients with lateral epicondylitis. Conference proceedings : ... Annual International Conference of the IEEE Engineering in Medicine and Biology Society. IEEE Engineering in Medicine and Biology Society. Conference, 95-98, 2007.
[12] Oskarsson E, Gustaffson BE, Pettersson K, Aulin K. Decreased intramuscular blood flow in patients with lateral epicondylitis. Scandinavian Journal of Medicine & Science in Sports 17, 211-5, 2007.
[13] Erak S, Day R, Wang A. The role of supinator in the pathogenesis of chronic lateral elbow pain: a biomechanical study. Journal of Hand Surgery 29:461-464, 2004,.
[14] Briggs CA, Elliott BG. Lateral epicondylitis. A review of structures associated with tennis elbow. Anatomia Clinica 7:149-153, 1985.
[15] Connell D, Burke F, Coombes P, MCNealy S, Freeman D, Pryde D, Hoy G. Sonographic examination of lateral epicondylitis. American Journal of Roentgenology 176, 777-82, 2001.
[16] Poltawski L, Jayaram V, Watson T. Measurement issues in the sonographic assessment of tennis elbow. Journal of Clinical Ultrasound 38:196-204, 2010.
[17] Nicoud F, Castellazzi G, Lesniewski P, Thomas J. Velocity Determination of nerve tissue from ultrasound video images. Australian Institute of Physics, 18th National Congress 73-76, 2008.
[18] Nicoud F, Castellazzi G, Lesniewski P, Thomas J. Fast template tracking in video sequences. The Review of Scientific Instruments 82:105-110, 2011.
[19] Lewis JP. Fast Template Matching. Proc. Vision Interface 95:120-123, 1995.
[20] Lebrun C: What are the best diagnostic criteria for lateral epicondylitis in Evidence-based orthopaedics: the best answers to clinical questions, ed JG Wright, Elsevier Health Sciences, London, 2008. pp.148-157.
[21] Erel E, Dilley A, Greening J, Morris V, Cohen B, Lynn B. Longitudinal Sliding of the Median Nerve in Patients with Carpal Tunnely Syndrome. Journal of Hand Surgery 28:439-443, 2003.
[22] Kutsumi K, Amadio PC, Zhao C, Zobitz ME, An KN. Measurement of gliding resistance of the extensor pollicis longus and extensor digitorum communis II tendons within the extensor retinaculum. The Journal of Hand Surgery 29:220-224, 2004.
[23] Cohen MS, Romeo AA, Hennigan SP, Gordon M. Lateral epicondylitis: anatomic relationships of the extensor tendon origins and implications for arthroscopic treatment. Journal of Shoulder and Elbow Surgery 17:954-60, 2008.
[24] Snell RS: The Upper Limb. In: SNELL, R.S. Clinical Anatomy for Medical Students. 7th ed. USA: Lippincott Williams and Wilkins, 2004. pp.455-490.
[25] Kutsumi K, Amadio PC, Zhao C, Zobitz ME, An KN. Gliding resistance of the extensor pollicis brevis tendon and abductor pollicis longus tendon within the first dorsal compartment in fixed wrist positions. Journal of Orthopaedic Research: Official Publication of the Orthopaedic Research Society 23:243-48, 2005.
[26] Greenbaum B, Itamura J, Vangsness CT, Tibone J, Atkinson R. Extensor carpi radialis brevis. An anatomical analysis of its origin. The Journal of Bone and Joint Surgery. British volume 81:926-929, 1999.
AUTHORS
First Author: Dones VCIII, Research Assistant, International
Cetnre for Allied Health Evidence,
Second Author: Thomas J, Managing Director and Chief
Technical Officer, Group Scientific Pty Ltd, PO Box 190
Salisbury South, SA 5106 AUSTRALIA and School of
Electrical and Electronic Engineering, Shandong University of
Technology, Zibo 255049, CHINA, John@group-
scientific.com.au
Third Author: Lesniewski P, Adjunct Senior Research Fellow,
School of Engineering, University of South Australia,
Fourth Author Grimmer, Karen, Director, International Centre
for Allied Health Evidence, University of South Australia,
ifth Author Thoirs K, Associate Head of School, School of
Health Sciences, University of South Australia,
Sixth Author Suarez C, Professor, College of Rehabilitation
Sciences, University of Santo Tomas, [email protected]
Correspondence Author: Dones VCIII, Research Assistant,
International Cetnre for Allied Health Evidence,
FIGURE LEGEND
Figure 1. The mechanical test jig
Figure 2. Cross-correlation matrix shown as surface plot
Figure 3. Cross-correlation matrix with multiple maxima
Figure 4. Placement of the transducer head on the dorsal distal half of the forearm [Location 1]
Figure 5. Placement of the transducer head on dorsal proximal half of the forearm [Location 2]
Figure 6. Placement of the transducer head on lateral distal half of arm [Location 3]
Figure 7. XY coordinate of the template. The white arrow points to the starting XY coordinate of the tracked template. The tracked
template is represented by the area contained in the box.
Figure 8. Flowchart of the procedure for obtaining musculoskeletal ultrasound images
Figure 9. Seventy-five tracked templates of the extensor digitorum communis in a musculoskeletal ultrasound video.