the relationship between the firing rate of a single neuron and
TRANSCRIPT

The Relationship between the Firing
Rate of a Single Neuron and the Level of
Activity in a Population of Neurons
Experimental evidence for resonant
enhancement in the population response
BRUCE W. KNIGHT
From The Rockefeller University, New York 10021
ABSTRACT A quantitative comparison is made between experiment and thetheoretically predicted dynamics of a neuron population. The experimentconfirms the theoretical prediction that under appropriate conditions an en-larged resonant response should appear in the activity of the neuron popula-tion, near the frequency at which there is minimum modulation in the instan-taneous rate of a single neuron. These findings bear on the relationship be-tween the firing rate of a single neuron and the firing rate of a population ofneurons.
INTRODUCTION AND RESULTS
The experiment reported here was performed with three objectives. Thefirst was to investigate experimentally the relationship between firing rateof a single neuron and the activity level in a whole population of similarneurons. The second objective was to seek evidence of a "resonant" enhance-ment in the responsiveness of a neuron population, which was theoreticallypredicted under specified circumstances, and which might be of some directphysiological interest. The third objective was to attempt a quantitativecomparison between data gathered from a real neuron, and several theo-retical predictions of a general nature which have been presented in a pre-ceding paper (Knight, 1972). This experiment was done with a single neuron:the response of a homogeneous neuron population to a single cycle of stim-ulus has been inferred by observing the response pattern of the single neuronagain and again over many repeated stimulus cycles.
When one deals with a neuron whose firing is both rapid and regular, it iscustomary to characterize that neuron's activity by its "instantaneous fre-
THE JOURNAL OF GENERAL PHYSIOLOGY - VOLUME 59, 1972 pages 767-778 767
on April 11, 2019jgp.rupress.org Downloaded from http://doi.org/10.1085/jgp.59.6.767Published Online: 1 June, 1972 | Supp Info:

768 THE JOURNAL OF GENERAL PHYSIOLOGY VOLUME 59 1972
quency" or "single unit instantaneous firing rate," which is the reciprocal ofthe interval between impulses. However, if that neuron is firing in responseto a periodic input, the period of which is not much longer than the intervalsbetween the impulses with which the neuron responds, then the significanceof the single unit instantaneous firing rate becomes less clear. The measure ofneural activity which is of direct relevance to physiological effects of thatactivity not only concerns the time since last firing of a single neuron, but alsoshould be a measure of how many similar neurons are firing at any givenphase of the input cycle. If there is convergence upon the next higher orderneuron, it will be the momentary level of impulse activity in the entire popu-lation which determines the postsynaptic potential in that higher orderneuron. In this experiment the single unit rate (measured directly) and thepopulation rate (as inferred from many cycles) in response to a periodicinput have been measured simultaneously from a single neuron. Majorqualitative differences are found between the two measures of neural activity.
When a neuron fires in response to a periodic input, two important fre-quencies are involved. One is the frequency of the stimulus input and theother is the "carrier rate" or "center frequency" of the responding neuron,which is the reciprocal of the long-time average of the single unit interpulseinterval. The periodic input to the neuron consists of a mean value plus amodulation. In the limit of vanishingly small modulation, the center fre-quency will be independent of the input modulation frequency, and willdepend only on the mean input level and upon the characteristics of theneuron itself. In this limit of small modulation, the response of a homo-geneous population of neurons may be analyzed theoretically, in an approxi-mate way that does not require detailed assumptions concerning the under-lying machinery of the neurons. A theoretical prediction results: If the in-put modulation frequency is set close to the center frequency of a singleunit, the pooled firing of the neuron population will show an enhanced'resonant" response-a particularly strong modulation in the population'sresponse over the stimulus cycle. This predicted resonant response is spe-cifically a property of the pooled activity of the whole population. The theorypredicts that the modulation in the instantaneous rate of a single unit willshow the opposite effect: it will drop to a minimum near the point wheremodulation frequency is equal to center frequency. The experiment bearsout these two predictions.
To within experimental error, the frequency responses, of the single unitand population rates, may be measured quantitatively. Theory also predictswhat these numbers should be. In its most reduced form, the approximate
The word resonance is used in its technical sense here. In technical terms, there exists a real "reso-nant" frequency (the center frequency) near which there lies a formal complex frequency whichmakes a denominator vanish in a frequency response expression.

B. W. KNIGHT Firing Rate and Level of Activity in Neurons 79
theory compresses all the characteristics of a neuron to two parameters:the "forgetting rate" (y), and the "coefficient of variation" (c). The for-getting rate y essentially defines a time scale for discounting old input, in thedetermination of when the neuron will fire again. The coefficient of variationc is a measure of the fractional random scatter in interpulse interval times.The phenomenon of population resonance is directly related to the processof forgetting: in the limit of no forgetting (y = 0) no resonance should ap-pear. In the theory forgetting is included as a simple exponential discountingof old input with the passage of time. The random variability of interpulseintervals (as characterized by the coefficient of variation) has the effect oflimiting the height of the resonance, and of increasing its width. In the pres-ent experiment the coefficient of variation was measured directly. The choiceof forgetting rate was dictated by the data: an attempt was made to obtain areasonable fit. The comparison of the experiment and the theory is shown inFig. 1.
Since the experiment yielded frequency responses for both single unitrate and population rate, the data are sufficient to find an empirical transferfunction from population rate to single unit rate. The data points in Fig. 2give this empirical result. Theory also yields an expression, with the interest-ing feature that it depends only on the coefficient of variation (which wasmeasured) and not on the forgetting rate (which was fitted). Thus the theorymakes a prediction which contains no free parameters, and is shown by thecurves in Fig. 2.
METHODS AND DISCUSSION OF METHODS
A visual neuron, the eccentric cell in the compound lateral eye of the horse-shoe crab Limulus polyphemus, was chosen for this experiment. The choice wasdictated by the sizable body of quantitative information available concerningthis neuron (Dodge et al., 1970; Hartline and Ratliff, 1972) and by personalfamiliarity with the preparation procedures.
The general setup was usual: the excised eye served as the fourth sideof a covered moist chamber. Light was led to a single facet of the eye by anarrow (0.4 mm) glass fiber optic bundle, mounted on a micromanipulator.The light came from a glow modulator system. The moist chamber was filledwith previously filtered and aerated Limulus blood, and a small bundle ofnerve fibers, dissected from the optic nerve, was lifted through the air/bloodinterface and mounted on a cotton wick recording electrode. A single unitwas isolated optically, by using the micromanipulator. The signal from thewick electrode went to an AC preamplifier and thence to the amplifier of anoscilloscope. The oscilloscope output drove an audio monitor system andalso fed a pulse-height discriminator which interfaced with a small computer(CDC- 1 60A). The glow modulator tube was pulsed at a high frequency

770 THE JOURNAL OF GENERAL PHYSIOLOGY · VOLUME 59 I972
10.0
0)
= 10E
0.9 1.0 1.1
f/fo
0 -2=
-
00
-4
-77
Z).8 0.9 1.0 1.1 1.2 1.3 1.4
f/foFIGURE 1. Amplitude and phase of the frequency response of a single unit (filledcircles) and of the population (open circles). The left-hand ordinate is for the experi-mental measurements. The solid curves are from the theory, and correspond to theright-hand ordinate. The difference between left-hand and right-hand ordinates re-flects the unknown amplitude and phase in the generator potential (see text).
(center frequency, 400/sec). This pulse rate was frequency modulated by avoltage input, which was a constant voltage, plus a sine wave of variableamplitude drawn from a function generator. The function generator alsoput out a phase mark on another channel at the top of the sine wave, and

B. W. KNIGHT Firing Rate and Level of Activity in Neurons 771
1.0
0
E
0.010.8 0.9
0
1.0 1.! 1.2 1.3 1.4
f/fo
0
I
-
'a
-4
f/fo
FIGURE 2. Amplitude and phase of the transduction from population response tosingle unit response. The solid lines are theoretical and the filled circles are from theexperiment.
this phase mark was delivered to a second discriminator. To monitor modu-lation depth, the pulses delivered to the glow modulator tube were also fedto a factor of 16 downcount scaling circuit, the output pulses of which were inturn sent to a third discriminator which interfaced with the computer. Atthe end of each run, the nerve impulse times were classified according to

772 THE JOURNAL OF GENERAL PHYSIOLOGY ·VOLUME 59 ' 1972
which consecutive 20 msec time interval in the stimulus cycle they occupied.In this way the computer generated a cycle histogram of the populationrate, which it returned through a digital-to-analogue converter, to a secondmonitoring oscilloscope at the experimental setup. The histogram and thethree channels of impulse time information were also stored on magnetictape by the computer for later processing.
In stimulating the eye it was necessary to abandon the established proce-dure of light on for about 20 sec and off for about 100 sec per run, whichfosters the long-term stability of the preparation but leads to a continuousdownward drift in the neuron's center frequency throughout the 20 sec. Inthis experiment it was necessary to hold the neuron's center frequency at aknown level to within a per cent or two during a run, and this demanded thatthe light be left on continuously. As a result the cell's center frequency gradu-ally declined as the experiment progressed, steadily but slowly, and not appre-ciably during a 20 sec run. This slow decline proved valuable, and wasexploited in performing the experiment: in the theory which this experimentwas designed to examine, the sensitive dependence upon frequency is in facta dependence upon the ratio between modulation frequency and center fre-quency, so it was natural to set a fixed modulation frequency and allow thecenter frequency to creep past it during the course of the experiment. Pro-ceeding in this way has a particular advantage: the conversion of flickeringlight to modulated intracellular voltage (generator potential) is frequencydependent, and that frequency dependence is believed to be one of the morestable aspects of this preparation. By working at a single modulation fre-quency we confine our ignorance of what voltage the impulse encoder seesto a single unknown amplitude and a single unknown phase. The center fre-quency of the neuron was brought close to 4 impulses/sec by inserting anappropriate neutral density filter in the light path. A fine setting to 4/secwas made by adjusting the duration of the glow modulator pulses. The func-tion generator was set at 3 cps. The neuron's center frequency graduallydeclined to 2/sec, at which point the experiment was terminated. Thesefiring rates, which are an order of magnitude lower than what is usual forLimulus experiments, were chosen for the following reasons. (a) The declinein center frequency is gradual at these modest rates. (b) The simple theoryassumes that irregularities in interpulse interval are uncorrelated, and ex-periments have shown that eccentric cell impulses become uncorrelatedwhen they are separated by more than about 0.3 sec (Shapley, 1971). (c)Since the experiment relies on a stable generator potential, a frequencyshould be chosen where the generator frequency response is insensitive toparametric changes; the generator amplitude is sensitive to frequencychanges above 3 cps (Knight et al., 1970). (d) In the usual regime the eccen-tric cell behaves much like a "simple integrate-and-fire" encoder. That is,

B. W. KNIGIxT Firing Rate and Level of Activity in Neurons 773
it shows only slight memory loss between impulses, as indicated by its lackof any pronounced tendency to phase lock to periodic stimuli. Without mem-ory loss, no resonance should be anticipated. The theory indicates that alengthened interval would lead to greater memory loss, and a more pro-nounced resonance; the theoretical resonance height depends on the ratioof the forgetting rate to the center frequency. These four considerations setan upper bound on the center frequency and the following one sets a lowerbound. (e) Near the anticipated resonance, the center frequency must bedetermined without much more than 1% error, and the computer programis limited to 20 sec of data on any run. Eccentric cell interpulse intervalsvary about 10% (Ratliff et al., 1968); the coefficient of variation of thiscell was 0.09. It takes about 60 impulses, or 3/sec, to achieve the necessaryerror bound.
Because there is substantial random variability in interpulse intervals, themeasurement of output modulation faces a serious signal-to-noise problem.For the single unit rate, the problem is at its worst near resonance, wherethe output modulation drops to small values. It might seem that the problemcould be solved by means of a large input modulation. However, the theory(which is a linearized theory) only claims to work in the limit of small modu-lation. How large a modulation may be used, without causing drastic changesin response, may be estimated from the nonlinear theory without noise,which is given in section 6 of the previous paper (Knight, 1972). The con-clusion there is that a result of finite modulation is phase locking, and thatthis condition is particularly encouraged if (a) there is much forgetting be-tween impulses or (b) if the modulation frequency is close to center frequency.Of course both are preconditions of this experiment.
These considerations dictated the cycle of operations in the experiment.First, a 20 sec run was taken with no modulation, to determine the centerfrequency. Then the light modulation was turned up while the sound of theimpulse train was monitored on a loudspeaker. Either the unmodulatedor the phase-locked response is a monotonous beat on the audio monitor.In between, the beat has a notable nonperiodic texture. When this condi-tion was achieved another run was taken, at the end of which the pop-ulation cycle histogram was displayed on the monitor oscilloscope. Fromthis display a judgment was made about how to change the modulation.If signal-to-noise was poor the modulation was turned up. If the waveform seen was distorted from sinusoidal, the modulation was turned down.Sometimes no readjustment was necessary. Another run was taken. Thispair of modulated runs was followed by an unmodulated run to start thenext cycle. The center frequency, which was later related to each modulatedrun, was the average of the two values obtained before and after.
Subsequently modulation values were extracted from the data by a least-

774 THE JOURNAL OF GENERAL PHYSIOLOGY VOLUME 59 1 I972
squares fitting procedure described elsewhere (Knight et al., 1970). 2 Themodulation in population response was determined in a similar way fromthe record of the cycle histogram. The frequency responses were calculatedin the form (output modulation/mean output)/(input modulation/meaninput), which is the form convenient to compare with theory.
The experimental design anticipated discarding the earlier of each pair ofmodulated runs. This was not always necessary, and conversely sometimesboth runs were discarded. The first criterion for discarding came from notesmade immediately after each run. The second criterion came from dataprocessing: if harmonic content was excessive, or if the center frequency ofthe single unit rate was much deviated by the presence of modulation, thenthat run was rejected. The least-squares procedure also gave a "uniquenessof fit" estimate. The fit to the single unit rate becomes nonunique when phaselocking occurs, and some runs were rejected on that basis. Two runs werediscarded simply because they were in bad disagreement with all the restof the data. From a span of 50 modulated runs, 16 runs were discarded andthe rest are represented in Figs. 1 and 2. The oversize data points indicatethe averages of two consecutive runs in those cases where no modulationreadjustment was made. The averaging was done on the fitting coefficients,before reduction to amplitude and phase.
For the theoretical curves of Fig. 1, the value /fo = 0.75 (fo is centerfrequency) was chosen because agreement with the experimental pointslooked reasonable. Higher values give less agreement, but values of /f odown to 0.5 give agreement comparable to what is shown. In the upper frameof Fig. 1 the theoretical amplitude has been shifted, as shown on the right-hand vertical scale. In the lower frame the phase has been similarly shifted.These two operations adjust for the unknown amplitude and phase in thegenerator potential modulation. In Fig. 2 there are no adjustable parameters.
THEORETICAL
A detailed theory was developed in the previous paper. In brief outline,here is how the theory may be put into a form to compare with the presentexperiment. According to the simplest neuron model (integrate-and-firemodel) the single unit modulation response is given by the running averageof the input modulation:
B 1T dts(t) (1)
2 To determine the modulation in instantaneous frequency, a record was kept of the times at whichimpulses occurred. To each occurrence time was assigned an instantaneous frequency which wasthe reciprocal of the time since the previous impulse. An assumed output modulation form wasadjusted to give the best possible fit, in the least-squares sense, to the measured instantaneous fre-quencies at all the impulse occurrence times.

B. W. KNIGHT Firing Rate and Level of Activity in Neurons 775
(equation 3.12)3 where s(t) is the stimulus modulation, B is the responsemodulation at the moment t = 0, and To is the period between impulses inthe absence of modulation. If for the stimulus modulation s(t) we substitutethe sinusoid exp (iwt) the value of which is unity at the moment t = 0, wefind
1 ~0 1 - -iwT°
B = L et dt -iT o (2)
(equations 3.14 and 3.15). This is the transfer function from the stimulusto the single unit rate. For different reasons it is also the transfer function fromthe population rate to the single unit rate (equation 4.3). If, in the absence of modu-lation, the interpulse interval To shows random variations, then equation 2must be replaced by its reasonable generalization
B = 1 -(e- '
To) (3)
iw(To)
(equation 8.12), which is very nearly the theoretical expression plotted inFig. 2. If the fluctuations of To from its mean To are small4 then we maywrite
(e0-T) = (eOe~ -*(rO -so))
= et-T(1 - iw(To - T o) + .(-io)(To - To)2 + .*. )
(equation 8.19). The means of the first two terms in the pointed bracketsare evidently unity and zero, whence
(e - ' TO) e-i T° {1 { - ((To - To))} (5)
(equation 8.20), and equation 3 becomes approximately
- {- 2 ((To -- o)2)} (6)iwT
the amplitude and phase of which are the curves plotted in Fig. 2. The fluc-tuation term in equation 6 is related to the coefficient of variation c by
((To - To)2) = cTo2 (7)
3 Equation numbers with decimal points will refer to corresponding equations in the previouspaper (Knight, 1972).4 We indicate mean either by pointed brackets or by an overhead bar depending on typographicalconvenience.

776 THE JOURNAL OF GENERAL PHYSIOLOGY · VOLUME 59 I972
(equation 8.12). The value c = 0.09, which persisted throughout the ex-periment, was used in the calculation. (Fig. 4 of the previous paper [Knight,1972] shows the analogous result when c = 0.)
On rather general theoretical grounds, the behavior of a broad class ofreal neurons should be typified by the "forgetful integrate-and-fire neuronmodel." As in equation 2 the single unit frequency response in this modelhas a numerator containing two terms which represent the present and pastlimits of an averaging integral. However, in the forgetful model the numer-ator term representing the present is favored by a weighting factor exp (y To).The full expression is
F _ -iT(8)
(i + )To
(equation 5. 10). If the interpulse interval has random scatter, this generalizesto
F (eY TO) - (e'wTo) (9)
(iw + Y) )(To)
(equation 8.17). If again the scatter about the mean is small, this may beapproximated by
eTo{l + 2 ((To - To)2 -e {1 - 2 ((To -T))} (10)
(ic + y)T
in exactly the same way that equation 6 was derived. The value y To = 0.75was substituted into equation 10, which then yielded the theoretical ampli-tude and phase that are plotted as curves along with the single-unit data inFig. 1. Finally, the theoretical population response was obtained from
P = FIB (11)
(equation 8.18), the amplitude and phase of which are plotted along withthe population data in Fig. 1. The result should also be compared withFig. 6 of the previous paper (Knight, 1972) (in that figure the coefficient ofvariation is given by rfo = c).
In conclusion, here is how B and F are expressed in terms of the modula-tion frequency f, the center frequency f , the forgetting rate -y, and the coef-ficient of variation c. The expressions are
B = - e- 2Tiffo (1 - I(c.2rf/fo) 2) ~~~~2B w(12)2rif/fo
B. W. KIGHT Firing Rate and Level of Activity in Neurons 777
and
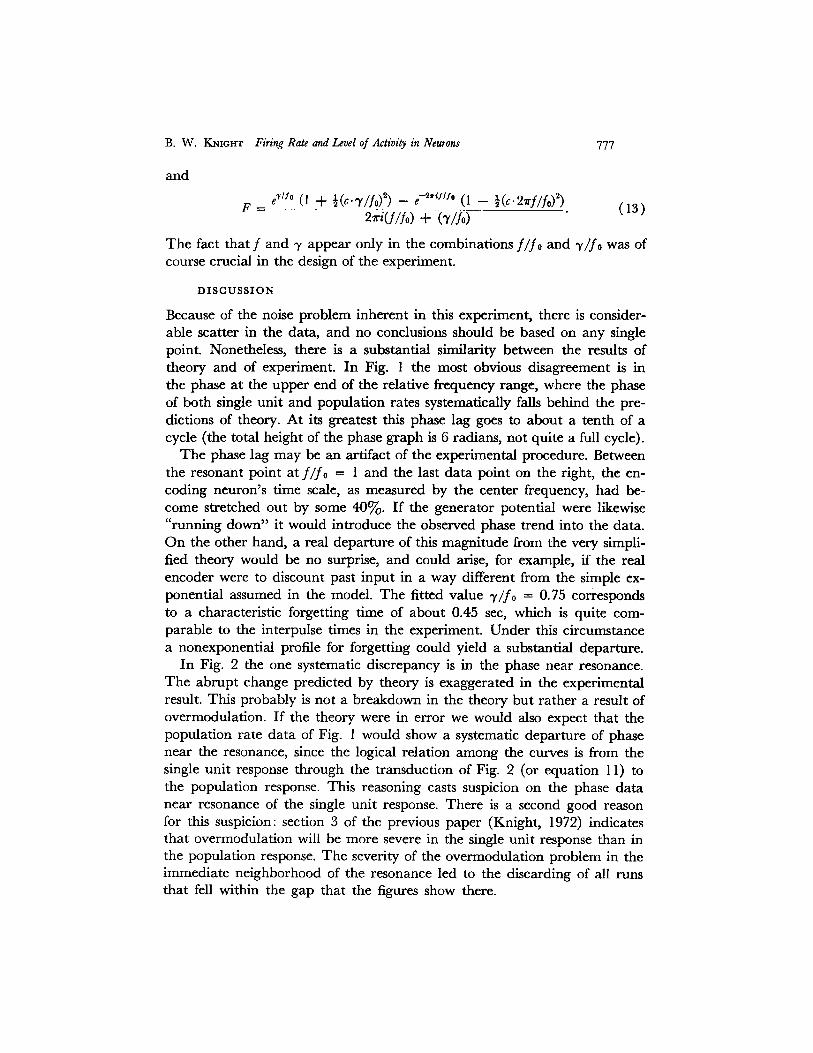
e 1o° (1 + (co./fo)2 ) - e- 21if/fO (I - ½(C.27rf/fo)2)F = (13)2iri(f/fo) + (/o)
The fact that f and y appear only in the combinations f/fo and /f o was ofcourse crucial in the design of the experiment.
DISCUSSION
Because of the noise problem inherent in this experiment, there is consider-able scatter in the data, and no conclusions should be based on any singlepoint. Nonetheless, there is a substantial similarity between the results oftheory and of experiment. In Fig. 1 the most obvious disagreement is inthe phase at the upper end of the relative frequency range, where the phaseof both single unit and population rates systematically falls behind the pre-dictions of theory. At its greatest this phase lag goes to about a tenth of acycle (the total height of the phase graph is 6 radians, not quite a full cycle).
The phase lag may be an artifact of the experimental procedure. Betweenthe resonant point at f/fo = 1 and the last data point on the right, the en-coding neuron's time scale, as measured by the center frequency, had be-come stretched out by some 40%. If the generator potential were likewise"running down" it would introduce the observed phase trend into the data.On the other hand, a real departure of this magnitude from the very simpli-fied theory would be no surprise, and could arise, for example, if the realencoder were to discount past input in a way different from the simple ex-ponential assumed in the model. The fitted value y/fo = 0.75 correspondsto a characteristic forgetting time of about 0.45 sec, which is quite com-parable to the interpulse times in the experiment. Under this circumstancea nonexponential profile for forgetting could yield a substantial departure.
In Fig. 2 the one systematic discrepancy is in the phase near resonance.The abrupt change predicted by theory is exaggerated in the experimentalresult. This probably is not a breakdown in the theory but rather a result ofovermodulation. If the theory were in error we would also expect that thepopulation rate data of Fig. 1 would show a systematic departure of phasenear the resonance, since the logical relation among the curves is from thesingle unit response through the transduction of Fig. 2 (or equation 11) tothe population response. This reasoning casts suspicion on the phase datanear resonance of the single unit response. There is a second good reasonfor this suspicion: section 3 of the previous paper (Knight, 1972) indicatesthat overmodulation will be more severe in the single unit response than inthe population response. The severity of the overmodulation problem in theimmediate neighborhood of the resonance led to the discarding of all runsthat fell within the gap that the figures show there.

778 THE JOURNAL OF GENERAL PHYSIOLOGY VOLUME 59 1972
Presumably the population resonance does not play a significant role inthe normal functioning of the Limulus eye. Under normal conditions theeccentric cell center frequency is not far below the flicker-fusion thresholdfrequency.5 However, one may speculate how evolution may have exploitedthe effect in other systems. The population resonance is uniquely suited tothe task of frequency discrimination, and one might look for its application inauditory systems, or in the frequency-sensitive electrical sense of certainfish. If the effect were utilized at more than one neuronal level, sharperfrequency tuning should be found the farther one went along the sensorypathway.
The data of Fig. 1 show that a population of neurons may carry signalswhich contain frequencies well beyond the center frequency of any singleneuron. These data also show that, as the center frequency is approached orexceeded, the single unit instantaneous frequency if it is used naively becomesan altogether misleading indicator of what the population are doing. Wherethe population show a maximum response the single unit rate shows a mini-mum. The results of the experiment were reasonably fit by a simple encodermodel: the stochastic and forgetful integrate-and-fire model. This indicatesthat more detailed knowledge of neuronal impulse encoding may be un-necessary in the further exploration of some aspects of the dynamics ofnerve populations.
For their assistance and encouragement I am indebted to H. K. Hartline, to Floyd Ratliff, and tonumerous other friends in our laboratory and around The Rockefeller University.This research was supported in part by Grants EY 188 from the National Eye Institute, GM 1789from the National Institute of General Medical Sciences, and GB-6540 from the National ScienceFoundation.
Received for publication 30 December 1971.
REFERENCES
DODGE, F. A., R. M. SHAPLEY, and B. W. KNIGHT. 1970. Linear systems analysis of the Limu-lus retina. Behav. Sci. 15:24.
HARTLINE, H. K., and F. RATLIFF. 1972. Inhibitory interaction in the retina of Limulus.In Handbook of Sensory Physiology. Springer-Verlag, Berlin. 7(IB).
KNIGHT, B. W. 1972. Dynamics of encoding in a population of neurons. J. Gen. Physiol. 59:734.KNIGHT, B. W., J.-I. TOYODA, and F. A. DODGE. 1970. A quantitative description of the dy-
namics of excitation and inhibition in the eye of Limulus. J. Gen. Physiol. 56:421.RATLIFF, F., H. K. HARTLINE, and D. LANGE. 1968. Variability of interspike intervals in
optic nerve fibers of Limulus: effect of light and dark adaptation. Proc. Nat. Acad. Sci. U.S.A.60:464.
SHAPLEY, R. M. 1971. Fluctuations of the impulse rate in Limulus eccentric cells. J. Gen.Physiol. 57:539.
5 Unpublished observations of F. A. Dodge, recording from nerve fiber bundles of intact animalsin the field, give a center frequency of 6/sec or more. The flicker-fusion frequency is at about 10 cps.