the relationship between students’ applied mathematics
TRANSCRIPT

The University of Southern MississippiThe Aquila Digital Community
Dissertations
Spring 5-2015
The Relationship Between Students’ AppliedMathematics Skills and Students’ AttitudesTowards MathematicsTaylor Andrew KilmanUniversity of Southern Mississippi
Follow this and additional works at: https://aquila.usm.edu/dissertations
Part of the Science and Mathematics Education Commons
This Dissertation is brought to you for free and open access by The Aquila Digital Community. It has been accepted for inclusion in Dissertations by anauthorized administrator of The Aquila Digital Community. For more information, please contact [email protected].
Recommended CitationKilman, Taylor Andrew, "The Relationship Between Students’ Applied Mathematics Skills and Students’ Attitudes TowardsMathematics" (2015). Dissertations. 54.https://aquila.usm.edu/dissertations/54

The University of Southern Mississippi
THE RELATIONSHIP BETWEEN STUDENTS’ APPLIED MATHEMATICS
SKILLS AND STUDENTS’ ATTITUDES TOWARDS MATHEMATICS
by
Taylor Andrew Kilman
A Dissertation Submitted to the Graduate School
of The University of Southern Mississippi in Partial Fulfillment of the Requirements
for the Degree of Doctor of Philosophy
May 2015

ii
ABSTRACT
THE RELATIONSHIP BETWEEN STUDENTS’ APPLIED MATHEMATICS
SKILLS AND STUDENTS’ ATTITUDES TOWARDS MATHEMATICS
by Taylor Andrew Kilman
May 2015
Mathematics is a subject with which many students struggle. It has been noted
that students’ attitudes towards mathematics can often affect their performance in related
courses. The goal of this research is to explore the relationship between students’ basic
applied mathematics skills and students’ attitudes towards mathematics. That is, do
students, as they learn how to use mathematics in the real world, tend to develop a more
favorable outlook towards mathematics? Or, on the other hand, do the attitudes towards
mathematics of students remain unaffected as their ability to use mathematics in the real
world increases? The current research seeks to clarify these propositions in an effort to
improve mathematics instruction by providing educators with a better understanding of
students’ attitudes towards mathematics.
Multiple linear regression analysis found that attitude toward mathematics was
indeed significantly related to students’ basic applied mathematics skill. Attitude toward
mathematics explained 29.7% of the variance observed in basic applied mathematics
skill. Attitudinal subscales were also analyzed. Student self-confidence and motivation
were both significant predictors of basic applied mathematics skill. In a separate analysis,
attitude toward mathematics was found not to be significantly related to mathematical
achievement in the college classroom.

COPYRIGHT BY
TAYLOR ANDREW KILMAN
2015

The University of Southern Mississippi
THE RELATIONSHIP BETWEEN STUDENTS’ APPLIED MATHEMATICS
SKILLS AND STUDENTS’ ATTITUDES TOWARDS MATHEMATICS
by
Taylor Andrew Kilman
A Dissertation Submitted to the Graduate School
of The University of Southern Mississippi in Partial Fulfillment of the Requirements
for the Degree of Doctor of Philosophy Approved: Dr. Sherry Herron_____________________ Committee Chair Dr. Melinda Gann_____________________ Dr. Kyna Shelley______________________ Dr. Richard Mohn_____________________
Dr. Karen S. Coats____________________ Dean of the Graduate School
May 2015

iii
DEDICATION
To FSM, whom without, this would not have been possible.

iv
ACKNOWLEDGMENTS
The writer would like to thank the dissertation director, Dr. Sherry Herron, and
the other committee members, Dr. Kyna Shelley, Dr. Melinda Gann, and Dr. Richard
Mohn, for their advice and support throughout the duration of this project.

v
TABLE OF CONTENTS
ABSTRACT ....................................................................................................................... ii
DEDICATION ................................................................................................................... iii
ACKNOWLEDGMENTS ................................................................................................. iv
LIST OF TABLES ............................................................................................................ vii
CHAPTER
I. INTRODUCTION .......................................................................................1
Statement of the Problem Purpose of the Study Rationale Definition of Terms
II. REVIEW OF THE LITERATURE ..............................................................5 A Brief History of Problem-based Mathematics Education Problem-based Mathematics Curriculum General Research Regarding Problem-based Mathematics Students’ Attitudes Toward Mathematics
Summary III. METHODOLOGY ....................................................................................29 Data Collection Participants Instrumentation Procedures Data Analysis Summary IV. ANALYSIS OF THE DATA......................................................................35 Descriptive Statistics Inferential Statistics Summary V. CONCLUSIONS AND DISCUSSION .....................................................46

vi
Summary of Procedures and Results Discussion of Results Summary Limitations Recommendations for Further Research APPENDIXES ...................................................................................................................58 REFERENCES ..................................................................................................................76

vii
LIST OF TABLES Table 1. Sample demographic information…………………………………………..........37
2. Descriptive statistics of the ATMI……………………………………………….40
3. Descriptive Statistics of BAMS and Final Course Grade………………………..41
4. Boxplot of ATMI results………………………………..………………………..75

1
CHAPTER I
INTRODUCTION
Mathematics is omnipresent in our modern day world. Paradoxically, however, it
is not seen nearly as much as it is used. Instead, it usually exists in the background,
providing a foundation for all of the technology that drives our modern day world.
Without mathematics, we could not enjoy our I-phones, tablets, televisions - not to
mention the internet. It seems odd, then, that mathematics would be a subject with which
many students struggle. But year after year, this reality remains unchanged. A recent
national survey of college transcripts found that mathematics classes had twice as many F
and D final course grades when compared to other courses (Hacker, 2012). The latest
results from the Program for International Student Assessment (PISA) revealed that the
United States scored below average when compared to other developed countries and
placed behind 26 others in the ranking (OECD, 2012). Even though the United States
scored below average on the PISA assessment, mathematics is a very important part of
our everyday lives. A functional knowledge of mathematics and a corresponding positive
disposition toward the use of mathematics is imperative for citizens to make informed
decisions about their daily lives (Wilkins & Ma, 2002). Many researchers have found a
relationship between students’ attitudes towards mathematics and student achievement in
mathematics (Ma & Kishor, 1997). One possible way to improve students’ attitudes
towards mathematics may be to provide authentic instruction. That is, teach mathematics
in the context of everyday life. If students understand the usefulness and importance of
mathematics in our modern world, their attitudes towards mathematics may in turn
improve, which could ultimately lead to better achievement outcomes.

2
Statement of the Problem
The goal of this study is to explore the relationship between students’ knowledge
of applied mathematics and students’ attitudes towards mathematics. This would in turn
inform educators on ways in which instruction and curriculum can be modified to
favorably affect students’ attitudes towards mathematics. Since a positive link between
students’ attitudes toward mathematics and students’ achievement in mathematics has
already been demonstrated (Ma & Kishor, 1997), changes in curriculum that positively
affect students’’ attitudes may in fact increase academic performance.
Purpose of the Study
The purpose of the study is to answer the following research questions:
1. What is the relationship between student’s knowledge of applied mathematics
and students’ attitudes towards mathematics?
2. If a significant relationship does indeed exist between students’ applied
knowledge of mathematics and students’ attitudes towards mathematics, does
this relationship affect student achievement in mathematics?
Rationale
The improvement of students’ attitudes towards mathematics is one of the keys to
improving student achievement in mathematics. Unfortunately, negative attitudes towards
mathematics abound. Phrases such as “I hate math” and “I am terrible at math” are
frequently heard in mathematics classrooms and beyond. But what if this was not the
case? Suppose for a moment that the majority of students understood the great utility of
mathematics and perhaps had a more favorable outlook towards mathematics as a result.
The purpose of this study is to see if there is any link between students’ applied

3
mathematical skills and their attitudes towards mathematics. If these two constructs are
seen to be tethered, then mathematics educators may in turn focus more attention on the
applied side of mathematics instruction in an effort to have some effect on the attitudes of
students towards mathematics. Furthermore, another goal of this study is to see if either
of these constructs are related to achievement in mathematics. If applied mathematics
skill can be linked to attitude towards mathematics, and if attitude towards mathematics is
linked to achievement, a path to increasing mathematical achievement may arise.
The subject of mathematical problem solving is especially timely considering the
fact that 46 states and the District of Columbia have adopted the Common Core State
Standards (CCSS). These are standards that outline goals for students across grade levels
and subjects. The mathematics standards place heavy emphasis on problem solving.
Referred to as “modeling,” this process links everyday situations to appropriate
mathematical analyses. Modeling lessons are dispersed throughout all topics, showing
students how to use mathematics outside of the classroom.
Since the goal of this research is to examine the relationship between students’
problem solving skills and students’ attitudes towards mathematics, the results of this
research are particularly pertinent. If it turns out that there indeed exists a positive
relationship between the two aforementioned variables, then one would expect to see a
rise in positive student attitudes towards mathematics, considering problem solving is
such as large emphasis of the CCSS. This research could bolster the position of the CCSS
by showing that its emphasis on problem solving is not only useful for student
enrichment but also for improving students’ attitudes towards mathematics. Furthermore,

4
as outlined by Ma and Kishor (1997), improved student attitudes generally lead to higher
achievement in the mathematics classroom.
Definition of Terms
Key phrases used throughout the current research are defined as follows:
1. Attitude: Opinions, thoughts, and feelings towards mathematics
2. Achievement: The overall average earned by a student in a mathematics
course
3. Basic applied mathematics skill: The ability to use mathematics to solve
common problems encountered in everyday life
4. Real-world mathematics: Mathematical concepts that are used to solve
problems in everyday life
5. Problem solving: The process of solving a problem where the solution method
is not known in advance (NCTM, 2000)
6. Authentic mathematics: An umbrella-term for describing a category of
teaching methods, the goal of which is to explicitly give in-class instruction
targeted meaningful, and relevant real-world context in order to provide the
possibility of a deeper level of understanding for students.

5
CHAPTER II
REVIEW OF THE LITERATURE
The purpose of this study is to explore the relationship between students’ attitudes
towards mathematics and students’ basic applied mathematics skill. To this end, several
different arenas of relevant literature will be investigated in order to provide context for
the current study. First, a brief history of mathematics education in the United States will
be outlined. Second, several examples of problem-based curriculum and research into
these curriculum will be examined. Next, general educational research dealing with
problem-based instruction will be reviewed. Lastly, the current literature regarding
students’ attitudes toward mathematics will be outlined.
A Brief History of Problem-Based Mathematics Education
Mathematics education in the United States has been in flux for some time now.
For over a century there has been a fight between progressives and traditionalists
regarding how mathematics should be taught to American children. The traditionalists
contend that systematic teaching and practice are the keys to students’ success in
mathematics, while the progressives promote a more child-centric and problem based
approach (Klein, 2007). The longstanding controversy received the label “math wars”
and even garnered attention from the United States cabinet when the Secretary of
Education Richard Riley asked both sides for calm at the annual Joint Mathematics
Meeting of the Mathematical Association of America and the American Mathematical
Society (Schoenfeld, 2004).
One major tenet of the progressive mathematics education camp is authentic
instruction. Authentic instruction is education that provides students with feasible, real

6
world applications of the covered material similar to situations that students may
encounter in their everyday lives (Ormrod, 2006). Authentic instruction is problem-
based. That is, the material is taught via real world examples.
In 1980, the National Council of Teachers of Mathematics (NTCM) released its
Agenda for Action, a game plan for mathematics in the coming decade, which declared
that problem solving “should direct the effort of mathematics educators,” and the
mathematical competence of the nation is measured on how well citizens can use
mathematics in their everyday lives (Davison & Mitchell, 2008). The group went on to
explain that this concept should not be taken to the extreme so that mathematics is taught
and seen as simply a complement to applications. Mathematics still needs to be taught as
a cohesive and unified field of knowledge. This new plan, however, placed less emphasis
on rote memorization of simple facts and placed more emphasis on problem solving and
inquiry.
But change is slow to happen. Schoenfeld, (2004) comments that although
mathematical problem solving was vehemently called for in the early 1980s, little was
actually changed in the mathematics textbooks. For instance, students, instead of being
presented with a set of typical addition problems, would be presented with a set of
problems that read along the lines of “Sue had 8 oranges. She gave 3 to Bill. How many
oranges does Sue now have?” Problem solving sections were also added to textbooks, but
mainly as an afterthought to an existing curriculum. Schoenfeld (2004) states that this
superficial change was due mainly to the realities to the textbook adoption process –
where Texas, New York, and California, because of their extreme share of the textbook
market, dictate which books are used in the American classroom.

7
After yet another decade of gloomy performance by American mathematics
students in the 1980s, the National Research Council published two reports in an effort to
bring light to the dismal situation. Everybody Counts (1989) essentially called for the
reform of mathematics education in the United States, stating that “America needs to
reach a consensus on national standards for school mathematics” (p. 46). A Challenge of
Numbers detailed some of the more troubling statistics regarding students’
underachievement in mathematics (Madison & Hart, 1990). The low rankings of the
United States in regard to worldwide mathematics education had been known at least
since 1967 when the first International Evaluation of Achievement report was released
(Davison & Mitchell, 2008). Perhaps the most notable fact of A Challenge of Numbers
was the failure rate of mathematics students. Madison and Hart (1990) calculated the
failure rate of mathematics students at over fifty percent for the general student
population grade nine and above and much higher for certain minority sub-populations.
In 1989, NCTM released its Curriculum and Evaluation Standards for School
Mathematics (NCTM, 1989). The main goal of this document was to “create a coherent
vision of what it means to be mathematically literate” in our modern world and lay a
foundation for the reformation of school mathematics in the United States (NCTM, 1989,
p. 1). The authors outlined broad societal goals such as a mathematically literate
workforce, lifelong learning, and an informed electorate (NCTM, 1989). The Standards
also listed mathematical reasoning and problem solving as main goals for mathematics
education moving forward. The overarching theme of the report was constructivism –
that is, student centered instruction that actively involves the student in the educational
process.

8
The 1990s proved to be a period of strife in the world of school mathematics
curriculum. This conflict between traditional mathematics educators and progressive
mathematics educators has come to be known as the “math wars” (Schoenfeld, 2004).
Problem solving is not the central tenet of the progressive mathematics education agenda,
but it is a very important corollary. Therefore problem solving in the mathematics
classroom was dependent on the outcome of these “math wars.” Textbooks began to be
written with the Standards in mind to include more items to encourage a holistic
understanding of mathematics at the expense, as critics charged, of basic skills practice
(Klein, 2007). Major markets, such as California, adopted new textbooks which followed
the Standards and, as previously discussed, the rest of the states followed.
In 2000, NCTM released a major update to their original Standards. This
document, Principles and Standards for School Mathematics, again set forth a framework
for mathematics education reform. It outlined standards for each grade level and fairly
specific expectations for what each standard meant in the classroom. Two of the ten
standards dealt with problem based instruction. Problem solving itself is a standard
promoted by NCTM which, according to the Principles and Standards, should be taught
at all grade levels. NCTM also recommends that reasoning and mathematical proof, a
topic closely related to problem solving, be stressed at all grade levels.
The National Commission on Mathematics and Science (2000), appointed by
Secretary of Education Richard Riley and led by John Glenn found that mathematics
instruction had not evolved into what many reformers had envisioned. Unfortunately,
American Education remained essentially the same as it had been for the past several
generations. In the report Before It’s Too Late, the authors also remarked that United

9
States is still remarkably far from the lead position in the world as far as mathematics
achievement is concerned. The authors suggested on many occasions that inquiry-type
instruction is the prudent instruction method to use in the mathematics classroom instead
of the repetitive, predictable mathematics of prior generations.
In the 2000s, much of the educational debate centered about the legislation No
Child Left Behind (NCLB). The improvement of student mathematical performance in
the United States was one of the main goals of NCLB. The era of high-stakes testing
shifted much of the debate about mathematics curriculum to the topic of testing. After a
decade of much controversy, the Obama administration began to allow states exemptions
from the most onerous requirements of NCLB in exchange for states creating a detailed
and coherent plan for improving student performance (Rich, 2012). By January 2013,
forty-six states had voluntarily adopted the Common Core State Standards (CCSS).
Somewhat similar to the Principles and Standards, the CCSS outline specific topics to be
discussed in the classroom at different grade levels. The CCSS, however, are not
textbook specific. Rather, the CCSS enumerate standards for mathematical practice for
all grade levels. The standards greatly support problem solving in the classroom. These
include the ideas that students should reason abstractly and quantitatively, model with
mathematics, and use appropriate tools strategically. The jury is still out on how effective
the CCSS will be in the classroom. With the majority of states onboard, results regarding
the efficacy of the CCSS should begin to flow in over the next several years.
Problem-Based Mathematics Curriculum
Constructivism is a learning theory that proposes that students construct
knowledge by connecting new knowledge to prior knowledge through new individual or

10
social experiences. A major tenet of constructivism is that students are curious and
natural learners if placed in a conducive environment. Furthermore, the learning process
has been described as a highly social process (Vygotsky, 1978). In the classroom, this
translates into the notion that students should be actively involved in the learning process
– not just passively listening as a lesson is being taught. Direct instruction, on the other
hand, imagines students as passive bystanders in the classroom. That is, teachers have a
knowledge which they simply pass along to learners.
Problem-based instruction is a teaching technique that stems from the
constructivist learning theory. It is a form of teaching where students are presented with a
real-world problem and then given the time and opportunity to solve that problem in
order to discover a new concept or practice a newly learned concept. The process of
solving an authentic, real-world problem is the avenue for new mathematical concepts to
be presented. Hiebert et al. (1996) proposed that the mathematics classroom should be
“problematic.” That is, based on problem solving. Students should be allowed to inquire
– to wonder why things are the way they are – and to resolve the incongruities they
encounter (Hiebert et al., 1996). Those same authors argue that a “problematic”
mathematics classroom is well suited to engage students, shows students how
mathematicians solve mathematics, and makes mathematics useful and relevant to
students. This problem-based process can be completed with varying degrees of guidance
from the teacher. The role of the teacher is to help students along their own paths to find
solutions to posed problems. With this type of instruction, the correct mathematical
solution is not the only goal. Students also learn valuable skills such as critical thinking,
estimation, and mathematical communication (Petric, 2011).

11
One of the most successful reform curricula is the Connected Mathematics
Project – the CMP. The CMP is a middle school curriculum developed by the University
of Michigan. The key characteristic of the CMP is that student learning is facilitated via a
problem-based approach. That is, students discover mathematical concepts primarily
through examining real world problems (Clarkson, 2001). The CMP was first developed
in 1995 – with the latest revision published in 2014.
Several researchers have examined the effects of the CMP on general
mathematical achievement, specific mathematical problem solving, and the achievement
gap between minority and majority students. Clarkson (2001) examined 700 students and
found that there was no significant difference on state achievement tests between students
who completed three years of Connected Mathematics and those students who were
enrolled in traditional mathematics courses over the same three years. However, other
differences between the groups were observed. For instance, the students in in CMP fared
better on problem solving assessments – not surprising since this was a mainstay of their
mathematics classroom (Clarkson, 2001). The author also noted a reduction in the
achievement gap between white students and African American students in the CMP –
when compared to similar students in traditional mathematics classrooms. Finally,
through qualitative analysis, Clarkson (2001) observed that students in the CMP
expressed higher levels of satisfaction with their mathematics curriculum than did the
students with traditional curriculum. In summary, while the Connected Mathematics
Project did not lead to significant gains in overall mathematical achievement as measured
by state achievement tests, the reform curricula did lead to several other worthwhile gains
in the mathematics classroom.

12
Lappan, Fey, Fitzgerald, Friel, and Phillips (1999) drew conclusions similar to
Clarkson (2001). The authors examined a one year window of Connected Mathematics
implementation and compared that to a control group which used a traditional
mathematical curriculum. The authors found that no significant differences in overall
achievement existed between the group exposed to Connected Mathematics and the
group using traditional mathematics curriculum. Just as with Clarkson (2001), however,
significant differences were observed on problem-solving evaluations. This of course is
logical since problem solving is the major tenet of Connected Mathematics.
Cain (2002) examined the effects of the CMP on middle schools in Lafayette
Parish school district in Louisiana. The author considered the 1998-1999 and 1999-2000
school years and compared the performance of schools that used the CMP versus schools
that used the status quo, traditional mathematics curriculum. Only some of the schools
had implemented the CMP curricula, so performance could be compared to other similar
schools in the district that had not implemented the CMP curricula. Both quantitative and
qualitative data were collected by the researcher. The researcher found that on average,
scores on the Iowa Test of Basic Skills (ITBS) were higher in schools that implemented
the CMP when compared to school that used traditional curriculum. In the first year of
the study, sixth grade students who used the CMP curricula score on average 16% higher
than their counterparts in non-CMP classrooms. Seventh grade students in CMP
classrooms also scored higher than their peers in non-CMP classrooms in the first year –
to the tune of 9% higher. The differences also existed during the second year of the study,
although the differences did decrease slightly. The researcher also considered differences
between groups in regard to the Louisiana Educational Assessment Program (LEAP) test.

13
Similar to his previous findings, the author found that passing rates on the LEAP test
were much higher for CMP students when compared to non-CMP students. For the first
year studied, the passing rate on the LEAP test of CMP students was 86% while the
passing rate of non-CMP students 70%. A 10% difference was found between the groups
(in favor of the CMP curricula) during the second year of the study.
Cain (2002) also collected data regarding the experiences of both students and
teachers in the CMP-oriented classrooms. Twenty-eight teachers and 300 students were
surveyed as a part of the study. Overwhelmingly, the teachers responded positively to the
CMP curricula. The teachers expressed opinions that on average students were becoming
better problem solvers, that they in general favored the CMP over past traditional
curriculum, and that the CMP had led to the teachers themselves having a deeper
understanding of the mathematical subject matter they taught (Cain, 2002). Many
instructors also expressed that the CMP curricula was more challenging that the old,
traditional curriculum and that the CMP training they received was essential to the
success of the program (Cain, 2002). Students also reacted favorably to the advent of the
CMP curricula. The researcher asked students questions regarding their preference of
curriculum (traditional vs. CMP), if the CMP curricula was helping them become better
problem solvers, if the CMP curricula helped them understand mathematics better, and if
the CMP curricula made them “think more” than their old curriculum. As with the
surveyed teachers, the majority of students indicated that the CMP was indeed better
overall than their previous math curriculum, that the CMP was helping to make them
better problem solvers, and the CMP curriculum made them “think more” (Cain, 2002).

14
The researcher demonstrated that from both attitudinal and performance perspectives, the
CMP was a success for the Lafayette Parish school district.
In 2003, the developers of Connected Mathematics released the CMP Research
and Evaluation Summary. This document outlined many success stories of Connected
Mathematics curriculum having a positive impact on school districts across the United
States. Significant increases in student achievement on state tests were seen public school
districts such as Plano, Texas, Ann Arbor, Michigan, and many more (Bray, 2005).
Sometimes statewide achievement scores were similar between students enrolled in
traditional mathematics and students enrolled in Connected Mathematics, but it was
commonly the case that students’ problem solving skills were boosted by being exposed
to the Connected Mathematics curriculum (Bray, 2005).
Another reform curriculum to emerge after the NCTM released its Curriculum
and Evaluation Standards for School Mathematics (NCTM, 1989) was Core-Plus
mathematics. Core-plus is a National Science Foundation supported mathematics
curriculum for high school students that embraces the NCTM’s Principles and Standards.
This particular curriculum is a great departure from traditional high school mathematics
in that each grade is not taught one specific subject (e.g. algebra or geometry or pre-
calculus). Instead, Core-plus mathematics integrates many different subjects into each
grade level. Each level includes topics from algebra, geometry, probability and statistics,
and discrete mathematics. Furthermore, the curriculum places a strong emphasis on real
world mathematics problem solving and authentic mathematics education - therefore
deemphasizes algorithmic manipulation (Harwell, Medhanie, Post, Norman, & Dupuis,
2012).

15
As with any new curricula, there are proponents and opponents. Proponents of
integrated curricula such as Core-Plus mathematics point out that integrated curricula
emphasizes connections between different areas of mathematics, fosters much needed
problem solving skills, and generally underscores how mathematics can be used in
everyday life (Grouws et al., 2013). On the other hand, detractors of this type of reform
mathematics often complain that this type of curriculum wastes too much time reviewing
past material, lacks a proper emphasis on basic mathematical skills, and is a burden to
students who transition to and from another district which uses traditional mathematics
curriculum (House, 2003; Usiskin, 2003). Of course, further complaints are often made
regarding teacher training and preparedness for the implementation of new curriculum.
As with any reform effort in the mathematics classroom, there are people on both sides
who vehemently support or oppose the implementation of change. Fortunately, enough
time has passed and several researchers have examined the effectiveness of integrated
curriculum such as Core-Plus which may help to settle the debate between traditional
curriculum and reform-type curriculum.
Harwell et al. (2012) conducted a research study to examine the preparedness of
students who were enrolled in at least three years of Core-Plus mathematics versus
students who had been enrolled in a traditional high school mathematics curriculum over
the same time period. The researchers sample consisted of 1,588 students at a large,
Midwestern public university who had taken at least two college mathematics courses of
difficulty beyond pre-calculus. The authors concluded that there were no significant
differences in college mathematical achievement between students who had taken
traditional mathematics courses in high school versus those students who had taken Core-

16
Plus mathematics courses in high school. In addition, the authors examined if there were
any significant differences when students were STEM majors in college. The authors
found that even when students were committed to mathematically intense college majors
in STEM fields, there were no statistically significant differences in mathematical
achievement between students who had previously been enrolled in Core-plus
mathematics and traditional mathematics. Although not necessarily positive for Core-Plus
curriculum, these results demonstrate that reform mathematics such as Core-Plus do
indeed adequately prepare students for college mathematics.
Grouws et al. (2013) conducted a research study which aimed to examine the
differences between students who were taught mathematics in a classroom which used
integrated curriculum and those students who were taught mathematics in a classroom
which used traditional curriculum. Specifically, researchers compared students using
Core-plus Course 1 with students who studied strictly Algebra 1. Most of the traditional
classrooms used Glencoe Algebra 1. The researchers compiled a sample of 2,162 students
from 10 schools across five states. The researchers made sure to accounts for
demographics such as socio-economic status, student tracking policies, class length,
technology policies, and other school characteristics. The researchers used three different
measures of student achievement at the end of year. The first was a tool developed by the
researchers that tested concepts common to both the traditional mathematics curriculum
and Core-plus curricula. The second instrument was a researcher-generated scale that
measured students’ problem solving abilities. The third instrument was the Iowa Test of
Educational Development - Mathematics: Concepts and Problem Solving. The
researchers used hierarchical linear modeling and found that students enrolled in the

17
classrooms which used Core-Plus score significantly higher on all three instruments when
compared to students enrolled in classrooms which used traditional mathematics
curriculum. The researchers observed effect sizes of 0.38, 0.45, and 0.17 on the first,
second, and third scales, respectively. The authors conclude that their research
demonstrates both the value of integrated mathematics curriculum such as Core-Plus and
also that curriculum choices make profound differences in the ways students learn and
achieve in the mathematics classroom.
The aforementioned curricula have been used in mathematics classrooms around
the country since the mid-1990s, with varying degrees of success. As outlined earlier,
some samples demonstrated both quantitative and qualitative student gains. On the other
hand, some researcher found that the new reform curriculum did not alter student
performance. Admittedly, there are many different variables in play here and more
comprehensive, long-term studies will be required to completely evaluate the
effectiveness of such programs.
General Research Regarding Problem-Based Mathematics
Since the advent of the mathematics reform movement in the early 1990s,
researchers attempted to document and quantify the effects that reform mathematics has
had in the classroom. As previously discussed, much of the mathematics reform
movement has generally centered around constructivism and specifically led to problem-
based, student centered mathematics instruction. These practices have been implemented
with varying levels of success in elementary, middle, high schools across the nation. To a
lesser extent, these practices have been adopted in the post-high school educational
setting.

18
Wood and Sellers (1996) followed a group of second and third graders during the
early days of the 1990s mathematics reform movement. Six classrooms implemented a
problem-based mathematics curriculum. The study took place over the span of two years
and performance was compared between students who were enrolled in the reform class
for one year with the students who were enrolled in the reform class for two years.
Performance of these students was also compared to their counterparts who were not
enrolled in a reform-oriented classroom, but were enrolled in a traditional textbook-based
classroom. The researchers found that after two years in the problem-based mathematics
classroom, reform students outperformed their non-reform counterparts on both an
arithmetic test and the Indiana Sequential Test of Educational Progress (mathematics sub-
test). These two instruments measured computational fluency and conceptual
understanding, respectively. An attitudinal questionnaire administered by the researchers
also found that students in the reform-oriented classrooms developed significantly more
positive beliefs regarding mathematical problem solving, when compared to non-reform
students. The authors comment that these results demonstrate the dichotomy that exists
between the main beliefs regarding mathematics education. One tradition is that
mathematics is a static discipline that is mastered by students following directions from
their instructors while the other tradition (inquiry or problem based mathematics) views
learning mathematics as a creative task where solutions are devised by the students
themselves (Wood & Sellers, 1996).
Randhawa, Beamer, and Lundberg (1993) reached the conclusion that
mathematics classroom needs “explicit links to everyday application of mathematics. The
authors used structural equation modeling to help explain mathematical achievement. In

19
their model, students’ attitudes towards mathematics and students self-efficacy in
mathematics were the latent variables. The authors found that both students’ attitudes
toward mathematics and’ self-efficacy were directly linked to mathematical achievement.
Furthermore, students’ mathematical self-efficacy was also a mediating variable between
students’ attitudes toward mathematics and students’ mathematical achievement. The
authors suggest that students’ self-confidence (and consequently, self-efficacy) may
indeed be boosted by creating a classroom environment rich with strong ties to everyday
mathematical applications where students can learn to transfer their classroom learning to
the real world. This suggestion echoes the contemporaneous Curriculum and Evaluation
Standards for School Mathematics which also calls for a heavy emphasis on learning
mathematics which is useful students’ everyday lives (NCTM, 1989).
Portal and Sampson (2001) explored how problem-based instruction was related
to students’ motivation and achievement in the high school mathematics classroom. The
study was conducted at a suburban, middle class high school and the sample consisted of
1460 students and 76 teachers. The authors found that when teachers used a problem-
based instructional strategy that students exhibited more positive behaviors and that
achievement was modestly increased.
Ziegler and Yan (2001) explored how different instructional methods affected
student achievement using data from the National Education Longitudinal Study.
Specifically, they examined how different instructional strategies affect students’
achievement in respect to problem solving. The authors found that a constructivist
approach in the mathematics classroom was the most effective way to teach problem
solving skills and had the greatest effect on students’ problem solving achievement.

20
Constructivist teaching strategies like inquiry-based instruction and group work fostered
students’ problem solving skills to a greater extent than did traditional teaching strategies
such as direct instruction.
Zahorik (1996) explored how teachers attempt to make the classroom an engaging
environment for students. The sample consisted of 65 elementary and secondary school
teachers who were enrolled in a graduate course emphasizing constructivist learning. The
researcher searched for commonalities among the various ways teachers attempted to
create a rich learning experience for their students. Two of the themes the researcher
found related to problem-based instruction. First, the author found that hands-on
activities were a good way to engage students. The author gives the example of having
students in a classroom determine the sugar content of a pack of chewing gum. The
author also lists the use of practical tasks as a way of stimulating student interest.
Practical tasks refer classroom activities that have utility outside of the school classroom
(Zahorik, 1996). Using problem-based instruction to show students how to use
mathematics in their everyday life is an example of a practical task, according to
Zahorik’s definition. One example of such an exercise is an activity where the goal is for
students to discover how to compute the unit price of a food item. This is a mathematical
task which has great utility outside of the mathematics classroom – especially in the
grocery store!
Boaler (1998) conducted a three-year longitudinal study that explored the
relationship between instructional strategy and student achievement. The author studied
two high schools in working class areas of the United Kingdom. The study consisted of
approximately 300 students who were followed over the course of three years. One of the

21
schools used traditional teaching methods in the mathematics classroom. That is, direct
instruction (lecture) was the sole instructional strategy employed by teachers. The second
school used a constructivist approach in the mathematics classroom where open-ended
projects were a main staple. Authentic activities, those which mimic real-world
situations, were used heavily and always in the introduction of new material. The author
used qualitative methods such as case studies but also used a variety of quantitative
assessments to gauge student achievement and attitudes. Boaler found that the traditional
instructional methods of one school were “completely ineffective in preparing students
for the real world” (Boaler, 1998 p. 60). Students who experienced the problem-based
instruction, on the other hand, were able to achieve higher grades in both applied and
regular assessments. The students who completed the problem-based curriculum also
reported markedly higher attitudes towards mathematics, when compared to the students
enrolled in the traditional curriculum.
Riordan and Noyce (2001) compared the mathematical achievement of students
enrolled in reform, inquiry-based mathematics classes with their counterparts enrolled in
traditional mathematics courses. The sample included both eighth and fourth grade
students enrolled in Massachusetts public schools. The researchers collected data from
schools that used reform curricula such as Everyday Mathematics and Connected
Mathematics and schools that used traditional mathematics curricula. The schools and
classes were similar on a demographic level. The researchers found that students in
mathematics classrooms that employed reform curricula scored on average several points
higher on the state standardized tests than did students in traditional mathematics
classrooms. The authors also investigated the topic for different strands of the
22
Massachusetts mathematics standards and different student subpopulations. In both
instances, the researchers found significant gains in the scores of the students who used
the reform, inquiry-based curricula.
Curtis (2006) found qualitative evidence that college algebra students in a reform-
oriented classroom reported greatly improved attitudes towards mathematics. The author
found that instructional strategies like group activities, classroom discussions, and
problem-based learning help to relieve classroom anxiety, improve mathematical
confidence, and increased student enjoyment. The author also used quantitative methods
and found a statistically significant relationship between the aforementioned reform-type
activities (group discourse, group activities, problem-based learning) and students
enjoyment of mathematics.
Students’ Attitudes Toward Mathematics
A fair amount of past educational research has dealt with the issue of students’
attitudes towards mathematics. Many authors have examined how attitudes towards
mathematics are affected by demographic constructs such as race or gender. Others, as
previously outlined, have examined the effects of different instructional methods on
students’ attitudes towards mathematics. The focus of this section will be on the general
relationship between students’ achievement and students’ attitudes toward mathematics.
Schiefele and Csikszentmihalyi (1995) conducted a study in two Chicago
suburban high schools which examined the effect among several different variables on
mathematical achievement. They considered mathematical interest, motivation,
mathematical ability, and the quality of the experience while doing mathematics. While
the researchers never explicitly considered students’ attitudes toward mathematics, three

23
of the four independent variables were indeed very closely related to students’ attitudes
toward mathematics (motivation, mathematical interest, and quality of experience). The
sample consisted of 108 students who had been selected by their teachers as being
talented in one of several subject areas (athletics, art, music, science, or mathematics).
Using regression analysis, the researchers found that mathematical interest was a
significant predictor or mathematical achievement. Furthermore, the authors point out
that, although it cannot be completely determined in there study, it does not appear to be
the case that past mathematical achievement is solely responsible for higher student
interest in mathematics. This was due to the fact that the researchers had access to each
participant’s prior year PSAT mathematics scores. The researchers also found that
mathematical interest was significantly related to the quality of the experience in the
mathematics classroom. That is, higher levels of mathematical interest were correlated
with qualities such as better student moods in the mathematics classroom, higher levels of
achievement motivation, self-esteem, and other positive constructs. The researchers note
the importance of a positive classroom experience and remark that a positive classroom
experience is a desired outcome in its own right, alongside other desirable outcomes such
as high levels of achievement (Schiefele & Csikszentmihalyi, 1995). It follows that a
worthwhile endeavor would be to aim to increase levels of student interest in
mathematics so that an overall higher quality student experience may be achieved in the
mathematics classroom.
The Longitudinal Study of American Youth is a treasure trove of nationwide
student data regarding students’ science and mathematical growth and achievement. It
was collected over six years beginning in 1987. Wilkins and Ma (2002) used these data

24
and hierarchical linear modeling to devise a model of students’ mathematical growth in
middle and high school. At the student level, the researcher tested both students’
mathematics self-concept and students’ educational aspirations as predictors of
mathematical achievement. The authors defined mathematics self-concept as a construct
similar to attitude toward mathematics. Mathematics self-concept aimed to capture how
students felt towards mathematics and their ability to understand and use mathematics
(Wilkins & Ma, 2002). The authors found that at the middle school level, students with a
higher math self-concept experienced statistically significant higher rate of academic
growth than their counterparts with a lower math self-concept. At the middle school
level, educational aspirations was not a significant predictor of student achievement
growth. At the high school level, however, the significance of the predictors was
reversed. Math self-concept was no longer a significant predictor of mathematical
achievement growth whereas educational aspiration was a statistically significant
predictor. The authors theorize that this is likely due to the fact that college or
employment aspirations are greatly stressed at that age so mathematics is seen as an
important tool for those goals, not for personal enrichment reasons (Wilkins & Ma,
2002).
Other researchers have used factor analysis to demonstrate that student’ attitudes
towards mathematics affect student achievement in mathematics. Singh, Granville, and
Dika (2002) created a structural model to help explain the relationship between students’
attitudes towards mathematics and achievement. Their sample consisted of a nationally
representative sample of over 3,000 eighth grade students. The authors used students’
attitudes, motivation, and time spend on task to predict mathematical achievement.

25
Although time spent on task was the greatest predictor, motivation and attitudes towards
mathematics also proved to be statistically significant indicators of student achievement
in mathematics. Attitude toward mathematics was shown to have both direct and
mediating effects on mathematical achievement. For instance, attitude toward
mathematics affected time spent on academic tasks, which in turn affected mathematical
achievement.
Reynolds and Walberg (1992) devised a structural equation model as well to help
explain student achievement in mathematics. Their model took a more holistic, inclusive
approach – including variables in their model such as home environment, peer group
pressures, exposure to mass media, and instructional time. The authors used a sample of
2,553 tenth grade students from the Longitudinal Study of American Youth data set. The
researchers discovered several interesting results. First, mathematical achievement and
students’ attitudes towards mathematics had a reciprocal relationship. That is, students’
attitudes towards mathematics led to higher achievement but it is also the case that higher
levels of achievement precipitated more positive student attitudes. The researchers did
note, however, that the evidence seems to indicate that the achievement has a stronger
influence on attitudes rather than the reverse situation. This indicated that as students tend
to have a more positive attitude towards learning and using mathematics as they perform
better in their respective mathematics course. The researchers found that instructional
quality, instructional time, and prior achievement had direct effects on students’ attitudes
towards mathematics. A very interesting result from this research was the fact that
motivation and home environment had significant indirect effects on students’ attitudes.
The authors surmise that home environment and motivation play a larger role in

26
attitudinal development of high school student than other factors such as instructional
time or course content.
Oftentimes researchers view the relationship between attitude towards
mathematics and mathematical achievement in a unilateral manner. That is, attitudes are
usually thought to affect achievement outcomes. Ma (1997) devised a structural equation
model to examine the reciprocal relationship between attitude toward mathematics and
achievement in mathematics. The sample consisted of 1,044 Dominican high school
seniors. Two national achievement tests were used to measure mathematical
achievement. One test measured mathematical problem solving and critical thinking. The
other evaluated computational fluency. The researcher used an instrument that measured
attitude toward mathematics in a three-dimensional way: enjoyment of, difficulty of, and
perceived importance of mathematics. Several key findings were revealed. For instance,
the importance of mathematics to students was seen to be independent of the other
attitudinal variables. Ma (1997) drew two conclusions: efforts to make students
understand the importance of mathematics may not necessarily increase other positive
attitudinal traits and frustrations or enjoyment in learning or using mathematics are
unlikely to affect students’ views on the importance of mathematics. Bi-directional
relationships were observed between each of the three attitudinal variables and
achievement in mathematics. The greater effect was from the attitudinal measures toward
achievement; but achievement did exert a lesser feedback effect on the attitudinal
variables (Ma, 1997). Difficulty was also shown to be significantly related enjoyment in
the mathematics classroom, although it did not have a direct effect on achievement (only
indirectly through enjoyment). The researcher recommends that math content be

27
presented in an “interesting and attractive way” in order to ensure this relationship does
not negatively affect classroom outcomes (Ma, 1997, p. 227). A very important
conclusion is that it is student enjoyment in the mathematics classroom, not perceived
difficulty, which has a bearing on mathematical achievement.
Schreiber (2002) examined both institutional and student factors and their effects
on student mathematical achievement. The author used hierarchical linear modeling for
analysis. The sample for this research consisted of 1,839 American high school seniors –
a subset cohort of the Trends in International Mathematics and Science Study. These
were students who had studied advanced high school mathematics but had not studied
physics. Of interest here are some of the factors the author used to help predict
mathematical outcomes. Namely, student level factors such as general attitude toward
mathematics, natural talent belief, and hard work belief were used in the model. The
author found that all three of these factors were statistically significant predictors of
mathematical achievement. The instrument that measured students’ attitudes towards
mathematics was negatively worded, so the interpretation was that as students attitudes
towards mathematics grew more negative, achievement in mathematics was likewise
lowered. Schreiber (2002) also found that as students’ belief that their success was due to
natural talent increased so did mathematical achievement. Another closely related
predictor was students’ belief that hard work leads to success. The author found that as
students’ belief that hard work is the key to success decreased, so did mathematical
achievement. These latter two results were surprising and the author notes that that his
results are not in line with past research (Schommer, 1990). Furthermore, the author
speculates that the latter two abnormal results may be the product of the cohort’s

28
demographics. That is, the cohort was comprised of high-achieving mathematics
students, many of whom have done exceedingly well in their studies and therefore tend to
attribute much of their success to natural talent.
Summary
Mathematics education in the United States is always in flux. Whether it was
post-Sputnik era of “New Math” or the “back to basics” movement of the 1970s, one
group is always trying to improve mathematics education while another group attempts to
cling to the past. After several negative education reports in the 1980s and the publication
of Curriculum and Evaluation Standards for School Mathematics (NCTM, 1989),
problem-based mathematics reforms were called for and implemented in the 1990s and
2000s. This is evidenced by curricula such as the Connected Mathematics Project and
Core-Plus mathematics. Curricula like these and others have been demonstrated to be
effective in the mathematics classroom and positively affect students’ attitudes towards
mathematics. Similar research effort has been spent over the past two decades examining
the effect of students’ attitudes towards mathematics on students’ achievement toward
mathematics. Most research indicates that positive student attitudes toward mathematics
on average result in positive academic outcomes in mathematics. Some research also
points to a reciprocal relationship between mathematical achievement and aspects
students’ attitudes towards mathematics.

29
CHAPTER III
METHODOLOGY
The purpose of this study is the exploration of the relationship between students’
knowledge of basic applied mathematics and students’ attitudes towards mathematics.
Furthermore, a model will be developed using multiple regression techniques in an
attempt to quantify the relationship among students’ attitudes towards mathematics and
student achievement in mathematics.
Data Collection
Survey methodology was used to gather students’ information in this study.
Included in the questionnaire distributed to students was an attitudinal measure, a
measure of students’ knowledge of basic applied mathematics, as well as other items to
gather demographic information such as gender, age, and college major. The following
procedure was implemented during the data collection process:
1. Permission was sought and gained from the Human Subjects Review
Committee of the University of Southern Mississippi Institutional Review
Board before any data was collected.
2. Written permission to collect data was sought and gained from the chair of the
mathematics department at Mississippi College and the Human Subjects
Review Committee of the Mississippi College Institutional Review Board.
3. Permission to recruit students during class time was sought and gained from
individual instructors in the mathematics department at Mississippi College.
4. The researcher attended various class meetings and presented the oral
recruitment speech to students.

30
5. Students made appointments with the researcher to complete the
questionnaires and mathematics quiz.
6. Questionnaires were distributed and collected in the Fall 2014 semester over a
two-week period.
7. Final course grades were collected from instructors at the end of the Fall 2014
semester
8. Data was analyzed and prepared for presentation following data collection.
Participants
Participation in this study was open to any student currently enrolled at
Mississippi College. Specifically, the researcher targeted for recruitment students who
were enrolled at Mississippi College and were taking a mathematics course in the Fall
2014 semester. Undergraduate, non-mathematics majors were the primary target
demographic, but participation was open to all undergraduate students. The researcher
arranged times with instructors to give a brief description of the study and recruit
participants at the end of class periods. Students were then given the opportunity to sign
up for a specific date and time to participate in the research study. The researcher also
scheduled large blocks of time over several days for students to come and to participate
in the research study without an appointment. The researcher originally aimed to recruit
at least 125 participants with a sample that is representative of a typical undergraduate
mathematics class at Mississippi College. After data collection was complete, a total of
205 students had participated fully. All of the participants were undergraduate students.
Nearly all of the participants were non-mathematics majors. Six of the students were not

31
enrolled in any mathematics course. Those six participants heard of the research through
word of mouth and decided to participate.
Instrumentation
The attitudinal scale used in this study is the Attitudes Toward Mathematics
Inventory (ATMI) which was developed by Tapia and Marsh (2002). The instrument
consists of 40 five-point Likert-type items with responses ranging from Strongly
Disagree (1) to Strongly Agree (5). The inventory consists of four sub-scales: self-
confidence, value, motivation, and enjoyment. Some items gauge positive attitudes using
statements such as “Mathematics does not scare me at all” whereas other items gauge
negative attitudes using items like “Mathematics is dull and boring.” Eleven of the 40
items are worded in the negative and the remaining 29 items are formulated in a positive
manner. In addition, the questionnaire also contained items which sought to gather certain
demographic information of students. Specifically, the researcher collected additional
data regarding each respondent’s age, sex, college major, and the number of times each
student had taken college algebra.
The ATMI was originally developed by Tapia (1996) to measure attitudes toward
mathematics using a sample of high school students. Tapia and Marsh (2002) later
explored how the scale might be used with a sample of college students. The authors
tested the instrument using a sample consisting of 134 college students at a Southeastern,
public university. The authors used confirmatory factor analysis to test the model. The
authors tested reliability of each sub-scale. Cronbach’s alpha coefficient was found to be
.96 for self-confidence, .88 for enjoyment, .87 for motivation, and .93 for value (Tapia &
Marsh, 2002). The model as a whole was found to have a root mean square error of

32
approximation value of 0.056, a goodness of fit index of 0.99, and an adjusted goodness
of fit index of 0.94. These values indicate that the model in its entirety was indeed
reliable for the 134 college students sampled. The ATMI was also validated by a team of
researchers in Australia using a sample of 699 middle school students (Majeed,
Darmawan, & Lynch, 2013).
An instrument was also used to measure students’ ability to solve basic applied
mathematics problems – the Basic Applied Mathematics Scale (BAMS). This scale was
developed by the researcher in the Fall of 2012 and the Spring of 2013. The scale consists
of 17 items, each of which illustrates a common application of mathematics in the real
world. The instrument contains exercises pertaining to concepts such as the distance
formula, determining store sale prices, or break-even analysis. Each question can be
solved using arithmetic and algebra covered in junior high and high school mathematics
courses. See Appendix B for details. Content validity of the scale was established via
meetings with local mathematics instructors and professors in which applied arithmetic
and algebra were thoroughly discussed in order to compose a scale which covered the
most common real-world applications of algebra and arithmetic. The instrument was
piloted in the Spring of 2013 to test for internal consistency. With a pilot sample of 45
students representative of future total sample, the BAMS was found to have a Cronbach’s
alpha of 0.778. This indicates that the BAMS had an acceptable level of internal
consistency – meaning that all of the individual items on the BAMS theoretically
measures the construct – students’ applied mathematics skill level.

33
Procedures
After gaining IRB approval during the summer of 2014, data were collected in the
Fall semester of 2014. Both the attitudinal scale and the BAMS were administered in
pencil and paper form. Data collection took place in the Math, Chemistry, and Computer
Science Building (MCC) on the campus of Mississippi College – room MCC 117A.
Participants were given the opportunity to sign up for a specific time slot to participate in
the study or come at their convenience. Data collection took place over a two-week
period beginning September 8, 2014. All students were given informed consent before
participating in the study. Students were also screened in order to ensure that each
participant was of at least 18 years of age. The researcher also verbally described the
study to all participants and answered any student questions regarding the research.
In addition to collecting data via the two questionnaires, the researcher gained
each participant’s written permission to use the final grade of the mathematics class in
which each participant is currently enrolled. After final grades were posted, the
researcher contacted mathematics instructors and gained this information regarding each
participant. Twenty-four of the original participants had dropped their respective
mathematics course and were therefore not included in any analysis that required the use
of participants’ final course grades.
Data Analysis
Correlation techniques, specifically multiple regression analysis, was the
predominate method used during data analysis. Descriptive statistics were also used to
gather an overall summary of the sample. Descriptive statistics and frequencies such as
age, sex, and college major were compiled. Multiple regression was then used to explore

34
the relationship between students’ basic applied mathematics skills and students’ attitudes
towards mathematics. Furthermore, the researcher used final course grades to examine
the effect of attitude on student mathematical achievement in general. It has been
demonstrated that past research supports the proposition that students’ attitudes towards
mathematics affect achievement in mathematics (Ma, 1997). The researcher intends to
clarify the relationship between basic applied mathematics skill and student attitudes
towards mathematics in this study. Furthermore, it stands to reason that basic applied
mathematics skill will directly influence overall mathematical achievement since solving
applied math problems is typically a subset of measuring mathematical achievement in its
entirety.
Summary
The methodology for this study consists of an attitudinal questionnaire, a
questionnaire which measures students’ basic applied mathematics skills, and students’
final semester grades. Using these data, the researcher explored the relationship between
students’ attitudes towards mathematics and students’ basic applied mathematics skills –
therefore answering the research questions posed in Chapter I.

35
CHAPTER IV
ANALYSIS OF THE DATA
This research aimed to examine the relationship between students’ ability to use
mathematics in an applied setting with students’ attitudes towards mathematics. As a
result of these analyses, other educators and education researchers may be able to better
understand methods to foster positive student attitudes towards mathematics and
ultimately promote increased achievement in the mathematics classroom.
The ATMI was the tool used to measure students’ attitudes towards mathematics
in this research. The scale was developed by Tapia and Marsh in 2002. It was originally
developed by Tapia and Marsh using a sample of high school students but was later
validated using a sample of college students. The scale consists of 40 Likert-style items –
each with possible responses: strongly disagree, disagree, neutral, agree, or strongly
agree. Some of the items are stated positively and some are stated negatively. Each of the
responses is given a value one through five for the positively stated items and a five
through one for the negatively stated items. The instrument is divided into four subscales:
value, enjoyment, self-confidence, and motivation. The value and enjoyment subscales
consist of 10 items each. All of the items measuring value are positively stated. One of
the items measuring enjoyment is negatively stated. The self-confidence subscale consists
of 15 items, nine of which are negatively stated. The motivation subscale consists of five
items. One of the motivation subscale items is stated negatively.
The BAMS was the tool used to measure students’ basic applied mathematics
skill. The BAMS was developed and pilot tested during the 2012-2013 school year. It

36
consists of 17 exercises that mimic real world situations where mathematics can be used.
The score was recorded as a percentage of points out of 100. No partial credit was given.
A total of 214 students participated in the research. Of those participants, several
had to cease participation prematurely to make scheduled appointments such as sporting
practice or class. Therefore 205 (N=205) records were able to be used in the analyses.
Descriptive Statistics
Sample
Demographic data were collected from all participants. These data include each
participant’s age, sex, and college major, and whether or not the participant had taken
college algebra in the past. Of the 205 participants, 53.7% were female while 46.3% were
male. In regard to age, 35.1% of the sample were 18 years old, 21.5% were 19 years old,
18% were 20 years old, 11.2% were 21 years old, 6.3% were 22 years old, and the
remaining 7.9% ranged in age from 23 to 39.
Each participant also indicated their elected college major. These data were very
diverse given the number of possible college majors. The most common major for
students participating in this research was biology (21.5% of participants). Business
majors followed with 11.2% of the sample. The majors of computer science, chemistry,
nursing, kinesiology each represented between five and 10 percent of the sample. The
remaining college majors each had less than 5 percent representation in the study sample.
See Table 1 for a summary of the demographic information of the sample.
Data were collected regarding the mathematics course in which each participant
was enrolled in during the Fall 2014 semester. Non-mathematics-majors enrolled in non-
mathematics-major courses were the primary target population. This certainly was the

37
case with the research sample. Calculus I, a very common course for non-majors and
common pre-requisite for other courses, was the course with the highest representation
among the sample (31.7%). Finite Mathematics was the current course of 17.2% of the
sample whereas College Algebra was the current course of 13.2% of the sample. Students
enrolled in Elementary Statistics comprised 10.2% of the sample. Six participants were
not enrolled in any mathematics course. The remaining 24.4% of the research sample was
enrolled in courses such as Trigonometry, Contemporary Mathematics, Developmental
Mathematics, Calculus III, Mathematics for Teachers, Probability and Statistics, or
Foundations of Mathematics.
Table 1 Sample Demographic Information (Age, Sex, Popular Majors, and Current Math Course)
Frequency Percent
Age
18 72 35.1
19 44 21.5
20 37 18.0
21 23 11.2
22 13 6.3 23 and over 16 7.9
Sex
Male 95
Female 110 53.7
Popular Majors Biology 44 21.5
Business 23 11.2
Chemistry 17 8.3
Nursing 16 7.8
Computer Science 13 6.3
Current Course
Calculus I 65 31.7
College Algebra 27 13.2
Finite Mathematics 36 17.6
Elementary Stats 21 10.2
Various Other courses 50 24.4
No Math Course 6 2.9

38
Data were also collected regarding the past coursework taken by each participant
while in college. Since college algebra is the sole college mathematics course many
students must take and many students often struggle with it, data were gathered
pertaining to the number of times each participant had attempted to take the course. It
was found that 50.2% of the sample was currently enrolled in a mathematics course but
had never enrolled in college algebra before. The remaining 49.8% of the sample had
either taken college algebra and then moved on to another mathematics course required
for their major or had repeatedly taken college algebra. In fact, 4.5% of the sample had
taken college algebra at least two times.
Descriptive Analysis of the Data
Data were collected in the Fall semester of 2014. The two main components of
this research study were an attitudinal measure and an applied mathematics quiz. The
Attitudes Towards Mathematics Inventory (ATMI) was used to measure students’
attitudes towards mathematics while the Basic Applied Mathematics Scale (BAMS) was
used to measure students’ basic applied mathematics skill. The BAMS consists of 17
applied mathematics exercises. A student’s score is calculated simply by taking the ratio
of total points earned to total points possible. There was no partial credit given.
Therefore, the possible scores for the BAMS range from zero to 100. The ATMI consists
of 40 5-point Likert items. This yields a minimum possible total score of 40 and a
maximum total score of 200. A score of 40 would indicate an extremely unfavorable
outlook towards mathematics while a score of 200 would indicate an extremely positive
outlook towards mathematics. Furthermore, the ATMI consists of four subscales: value,
enjoyment, self-confidence, and motivation. The value subscale is comprised of 10 items,

39
yielding a possible minimum score of 10 and a possible maximum score of 50. The
enjoyment subscale is comprised of 10 items, yielding a possible minimum score of 10
and a possible maximum score of 50. The self-confidence subscale consists of 15 items,
yielding a possible minimum score of 15 and a possible maximum score of 75. The final
subscale, motivation, consists of five items, yielding a possible minimum score of five
and a possible maximum score of 25. See Appendix L for a summary graph of the ATMI
data.
The mean for the value subscale was 40.53. The value subscale had the mean
most close to its maximum (50). On average, the data indicate that most participants
placed a relatively high value on learning and using mathematics. Participants often
indicated a high value of mathematics while at the same time expressing low self-
confidence towards or enjoyment of mathematics. The value subscale was the only
subscale not to have a reported minimum value at the possible lowest value (or extremely
close). The minimum response on the value subscale was 20 whereas the lowest possible
score for the value subscale was 10. All other subscales had reported values at their
minimum possible value or very close to the minimum possible value.
The enjoyment subscale mean was 33.92. An average neutral Likert-type response
would be 30 for this subscale. Therefore a mean of 33.92 indicates that participants on
average had a slightly positive response to the enjoyment of mathematics items on the
questionnaire – just 3.92 points above a mean neutral response. Students’ enjoyment,
although slightly positive, was much weaker than students’ value of mathematics.
The self-confidence subscale had a mean of 52. With a maximum of 75 and a
minimum of 15, this mean fell at about 69.3% of the highest possible average score. The

40
data indicate that more students than not have a fairly high level of self-confidence when
doing mathematics. Individual questionnaires and quizzes reveal that a high level of self-
confidence, however, does not necessarily translate into higher scores on actual
assignments.
The motivation subscale had a mean of 14.4 with a minimum of 5 and a
maximum of 25. The sample mean was therefore about two points above an average
neutral response. The data indicate a marginally positive motivation statistic for the
sample.
In total, the mean ATMI score for the sample was 140.7. The lowest reported
score on the ATMI was 61 while the highest reported score was 197. Consistent neutral
responses across each of the 40 items would yield a score of 120. The sample mean was
therefore 20.7 points above an average neutral attitude towards mathematics. The data
indicate that the sample on average had a favorable outlook toward learning and using
mathematics. See Table 2 for a summary of descriptive statistics pertaining to the
Attitudes Toward Mathematics Inventory.
Table 2
Descriptive Statistics of the ATMI
Minimum Maximum Mean SD
Value Subscale 20 50 40.53 5.83
Enjoyment Subscale 11 50 33.92 9.11
Self-confidence Subscale 15 75 52.01 13.71
Motivation Subscale 5 25 14.40 4.36
Total ATMI Score 61 197 140.72 29.56
The BAMS had a mean score of 73.5. The scores ranged from 17.6 to 100. The
lowest score of 17.6 translated into achieving three correct answers out of a possible 17.

41
The maximum score of 100 was achieved by a perfect score – solving 17 out of 17
exercises correctly. The median score of the sample was 76.5. The first quartile was
61.75 and the third quartile was 88.2.
Final mathematics course grades for each participant were also collected at the
end of the semester. Each participant gave the researcher permission to contact their
mathematics instructor at the end of the semester in order to gather their final course
grade. Grades were reported in numerical form. Of the original 205 participants, 24
students dropped the mathematics course they were enrolled in during the Fall 2014
semester. Six of the participants were not enrolled in any mathematics course during the
semester. Those six students simply responded to flyers and decided to participate in the
research. For those participants who were enrolled in and completed a mathematics
course in the Fall 2014 semester, there was a mean final grade of 88.3. The median final
mathematics course grade was an 84.8. The first quartile was equal to 77 while the third
quartile was equal to 91.1. See Table 3 for summary statistics of the final course grades
and BAMS scores.
Table 3
Descriptive Statistics of BAMS and Final Course Grade
N Minimum Maximum Mean SD
BAMS Score 205 17.6 100.0 73.52 18.00
Final Grade 175 18.0 102.7 83.02 12.48
Inferential Statistics
The purpose of this research was to examine the relationship between students’
applied mathematics skill and students’ attitudes towards mathematics. Two statistical
analyses were conducted. For both analyses, the predictor variables consisted of the four

42
subscales that comprised the Attitudes Toward Mathematics Inventory: value, enjoyment,
self-confidence, and motivation. The dependent variable for the first analysis was the
BAMS – the instrument that measures how well students are able to use basic
mathematics in everyday situations. For the second analysis, the BAMS score was
replaced by the actual final mathematics course grade for each participant. Multiple
regression was the statistical technique used for both analyses.
Assumptions of Multiple Regression
There are several main assumptions associated with multiple regression:
independent observations, homoscedasticity, normal distribution of the residuals, and
linearity. The independence of observations can be assumed because of the research
methods by which data was collected. The remaining three assumptions were tested
statistically, graphically, or in both manners. Both dependent variables (BAMS score and
final course grade) were graphically tested for homoscedasticity. Both scatter plots
demonstrated that the error variance was indeed consistent across varying values of the
predictor variables. No funneling was observed. Both sets of residuals were also check
for normality. The first residuals (with dependent variable BAMS) were normally
distributed with skewness and kurtosis well within the acceptable ranges. The second set
of residuals (with dependent variable final course grade) had a kurtosis of 4.58 – outside
the range of acceptability. Scatterplots were used to check for linearity. In both separate
regressions, all predictors were graphically observed to have a linear relationship with
their respective dependent variables. Both sets of tolerance values were examined to
screen for issues with multicollinearity – no problems were detected (all tolerance values
were greater than 0.1). Studentized residuals, standardized DFFITS, and leverage values

43
were calculated and examined. Several records were flagged as outliers according to
these diagnostic tests. When the data were double-checked, it was confirmed that all
records were entered correctly. It was simply the case that these records represented true
outliers – participants who scored very low or high on certain instruments. Those
identified records were removed and both regression analyses were re-run. In both cases,
the regression outcomes were the same. Therefore the outlier records were placed back
into the data set. With the one exception noted, all other assumptions of multiple
regression were satisfied.
Results of Inferential Statistics
The goal of the first research question was to establish the nature of the
relationship between students’ applied mathematics skill and students’ attitudes towards
mathematics. In the context of multiple regression, this research question was aiming to
determine if any of the predictor variables (ATMI subscales) are useful in explaining the
behavior of the dependent variable: BAMS score.
Hypothesis 1: At least one of the predictors (value, enjoyment, self-confidence,
and motivation) is statistically significant in explaining variability in the BAMS
and has a standardized regression coefficient not equal to zero.
The results of this analysis found that the overall model was indeed significant,
F(4,200) = 21.13, p < .001. Hypothesis 1 was supported. The model produced an R2 value
of 0.297, implying that 29.7% of the variance in the BAMS can be explained by the set of
predictor variables. Only two of the four predictor variables had a statistically significant
relationship with the dependent variable. Self-confidence was shown to be statistically
significant, t(200) = 4.18, p < 0.001. Motivation was also shown to be a statistically

44
significant predictor, t(200) = 2.22, p = .028. The self-confidence predictor had a Beta
value of 0.45, implying that for every one standard deviation increase on the self-
confidence subscale, a 0.45 standard deviation increase would be observed on the BAMS,
controlling for all other variables. Similarly, the motivation independent variable
produced a Beta value of 0.25, which indicated that for every one standard deviation
increase in motivation, a 0.25 standard deviation increase would be observed on the
BAMS, controlling for all other variables.
The second goal of this research was to see whether or not students’ attitudes
towards mathematics had any bearing on students’ final semester mathematics course
grade. Multiple regression was also used for this analysis.
Hypothesis 2: At least one of the predictors (value, enjoyment, self-confidence,
and motivation) is statistically significant in explaining variability in students’
final semester mathematics course grade and has a standardized regression
coefficient not equal to zero.
The second model failed to adequately explain variability in the dependent
variable, final course grade, F(4,170) = 2.06, p = .089. The hypothesis that all of the
predictors’ standardized regression coefficients are not equal to zero was therefore not
supported. It is the case therefore, with the current sample, that none of the attitudinal
independent variables significantly predict mathematical achievement as represented by
students’ final mathematics course grade.
Finally, the relationship between the BAMS and students’ final course grades was
examined. Linear regression was used with the BAMS as a predictor and final course
grade as the dependent variable. It was found using linear regression that the relationship

45
between these two variables was indeed statistically significant, F (1,173) = 10.98,
p=.001. This model had an R2 value equal to .06, which indicated that 6% of the
variability in final course grades was explained by the BAMS. The model produced a
Beta value of 0.244, which indicated that for every one standard deviation increase on the
BAMS, a 0.244 standard deviation increase should be observed in final course grade.
Furthermore, the relationship between the two measures of student achievement were
found to be statistically correlated (r=0.244).
Summary
Two potential statistical models were tested. The first model examined the
statistical relationship between students’ attitudes toward mathematics and student basic
applied mathematics skill. This model was found to be statistically significant. The
second model looked at the relationship between students’ attitudes toward mathematics
and students’ final mathematics course grade. This relationship was not shown to be
statistically significant for the observed sample. Lastly, the analyses showed that a
statistically significant relationship does indeed exist between students’ basic applied
mathematics skill and students’ final mathematics course grade.

46
CHAPTER V
CONCLUSIONS AND DISCUSSION
The purpose of this research was to determine if a relationship exists between
students’ attitudes toward mathematics and students’ ability to use basic mathematics in
their everyday lives. Furthermore, the research aimed to see if either of these constructs
had any relationship to students’ achievement in mathematics courses. This chapter will
provide a brief summary of the research procedures and results, a discussion of the
results, limitations of the study, and recommendations for further research in the subject
area.
Summary of Procedures and Results
Institutional Review Boards’ approvals were sought and gained during the
summer of 2014. Data were collected during the Fall 2014 semester at Mississippi
College – a small, religiously-oriented, private college in Clinton, Mississippi. The
researcher contacted instructors in the mathematics department before the fall semester
began and made arrangements to recruit students at the end of certain class periods during
the first few weeks of the semester. Students were allowed to make appointments to meet
with the researcher. Data collection took place over the second and third week of
September, 2014. Participants spent approximately 30 minutes completing an attitudinal
questionnaire and basic applied mathematics quiz. The research sample consisted of 205
students, the overwhelming majority of whom were non-mathematics majors enrolled in
non-mathematics courses. The final mathematics course grade was then collected for
each participant after the completion of the Fall 2014 semester. Each participant signed a
form allowing the researcher to contact their mathematics instructor after the end of the

47
semester in order to gather their grade. Numerical grades were collected from the
mathematics instructors for all but 24 participants. Those 24 students had dropped their
respective mathematics course.
Descriptive analyses of the sample revealed that most participants placed a
relatively high value on learning and using mathematics. The mean sample score for the
value subscale was 40.53 out of a maximum score of 50. The median was 41. This result
is interesting because the negative skew indicates that most participants placed a high
value on learning and using mathematics regardless of how they responded to other
subscale items or how well they did on the basic applied mathematics quiz.
It was also observed that most students expressed high levels of self-confidence in
their mathematical abilities. The mean value for the self-confidence scale was 52, while
the median was 55. The reported self-confidence levels were much higher than a neutral
response of 30 points. Again, these high levels of self-confidence did not necessarily
translate into higher scores on the BAMS or final course grade for all students.
The enjoyment subscale had the lowest reported attitudinal score. The mean
reported score was 33.92 while the median was 35. This resulted in a slight negative
skew of -0.38 for the subscale. A neutral response would have been a 30. Therefore the
sample as a whole expressed enjoyment with math levels just slightly above neutral.
The final subscale was motivation and reported values resulted in a mean of 14.4
and a median of 14. A complete neutral response would have been 12.5.Therefore
motivation levels for the sample were about two points in the positive direction.
The first hypothesis to be tested dealt with the relationship between students’
attitudes toward mathematics and students’ ability to use basic applied mathematics in

48
their everyday lives. As a measure of the latter, the Basic Applied Mathematics Scale was
used. The Attitudes Toward Mathematics Inventory was used as a measure of students’
attitudes and opinions. It was found using multiple regression analysis that there was
indeed a statistically significant relationship between the two constructs. Specifically, two
subscales of the ATMI were revealed to be significant predictors of students’ basic
applied mathematics skill, accounting for 29.7% of the variance in BAMS scores.
The second hypothesis tested dealt with students’ attitudes toward mathematics
and whether or not this affected students’ final mathematics course grade. Multiple
regression analysis did not reveal a statistically significant relationship between these two
constructs with the given research sample.
Discussion of Results
Much past research has been conducted to examine the link between students’
attitudes and opinions toward mathematics and students’ achievement in mathematics.
Conflicting evidence has been demonstrated. Some researchers have found a statistically
significant link between students’ attitudes towards mathematics and students’
achievement in mathematics (Ma, 1997; Mriano, 2005; Singh et al., 2002). Others,
however, have found that either the relationship is non-significant or the relationship is so
weak as to have little to no practical significance (Ma & Kishor, 1997). Ma and Kishor
(1997) conducted a meta-analysis of 113 primary research studies that examined this
exact relationship and found that although a statistically significant relationship did
indeed exist, the mean effect size was .012.
The purpose of this research was more specific than simply looking at students’
attitudes toward mathematics and students’ achievement in mathematics. The aim of this

49
study was to examine students’ attitudes towards mathematics as it relates to their level of
competence to use mathematics in their everyday lives. Mathematical achievement in
general was a secondary relationship to be examined. As outlined in the results, the
researcher found that there did indeed exist a statistically significant relationship between
students’ ability to use mathematics in their everyday lives (approximated by the BAMS)
and students’ attitudes toward mathematics (approximated by the ATMI). The result is,
however, tempered by the fact that not all of the subscales of the ATMI were significant
predictors.
The first subscale, students’ professed value of mathematics was found not to be a
significant predictor of students’ ability to perform daily, applied mathematics. This
result was completely expected, considering the descriptive analysis of the same
subscale. Descriptive analysis of the value subscale found that the average reported value
for the subscale was 40.53. This indicated that most students placed a high value on
learning and using mathematics. The other side of this result, however, is that this
variable was non-significant in predicting BAMS scores. This is because the
overwhelming majority of participants rated their value of mathematics very high,
regardless of their achievement on the BAMS.
This result appears to indicate that, at least for the research sample, students, on
average, have bought in to the importance of learning and using mathematics. This result
was surprising to the researcher. Anecdotal evidence from teachers and parents often
point to more prevalent negative student views towards the value of learning and using
mathematics. Teachers and parents often hear students say things such as “I hate math.”
or “Math is boring.” This result seems to indicate that although those opinions are

50
commonly expressed; most students actually place a high value on learning and using
mathematics. A similar conclusion was reported by Ma (1997) where it was found that
students’ perceived importance of mathematics was found to be independent of other
attitudinal measures and not a statistically significant predictor of achievement in
mathematics.
The second subscale on the ATMI was enjoyment. This subscale also was found
to be a non-significant predictor of student achievement on the BAMS. The median for
the enjoyment subscale was 35 while the mean reported score was 33.92. There was a
slight negative skew, indicating that slightly more students had positive responses to the
enjoyment items than had a negative response. The fact that enjoyment of mathematics
did not have a significant relationship to achievement on the BAMS was surprising to the
researcher. One would surmise that students who enjoy mathematics would also tend to
do well on mathematical assignments. Furthermore, it is logical that the relationship
might be reciprocated. For instance, it may be the case that doing well in mathematics
contributes to a higher level of enjoyment in mathematics. From the evidence presented
here, it is not necessarily the case with the current sample.
One possible explanation for this unexpected discrepancy could depend on what
students view as mathematics. That is, students may be referring here to the fact that they
enjoy solving equations, derivatives, or integrals (typically easy mathematical exercises
without much context). The mathematics on the BAMS, however, was fully applied, real-
world mathematics. Typically referred to as “world problems,” these are oftentimes the
type of mathematics students struggle with the most since students must devise their own
formulas from the text. Consequently, the disconnect here could be explained by the fact

51
that when students say they enjoy mathematics, they are really saying that they enjoy
another area of mathematics where they perform, on average, much better. A similar
research study could use an attitudinal scale in conjunction with both an applied measure
of mathematical achievement and a non-applied (computational fluency oriented)
measure of mathematical achievement. Perhaps a stronger relationship between students’
enjoyment of mathematics and achievement would be present if the achievement was in
the context of non-applied mathematics.
The third subscale to be evaluated was self-confidence. This subscale did prove to
be a statistically significant predictor of students’ basic applied mathematics skill. This
result is in line with past research dealing with self-confidence and self-efficacy and
mathematical achievement in general. Liu and Koirala (2009) found, using regression
analysis, that mathematical achievement could be statistically predicted by students’
levels of self-confidence. Similar conclusions were drawn by Aryana (2010) and Hamid,
Sharill, Matzin, Mahalle, and Mundia (2013). These results make perfect sense. It is
intuitive that one’s self-confidence would lead to higher performance in a given area.
However, others have argued that this relationship may not be so clear-cut. Baumeister,
Campbell, Kruger, and Kohs (2003) theorized that the relationship between these two
constructs is oftentimes proposed in the wrong direction. For instance, the authors assert
that self-confidence (or the lack thereof) stems from success (or failure) in a particular
subject area. So it is perhaps not the self-confidence that leads to success, according to
the authors of the research. Rather, it is the success that leads to self-confidence. This was
the idea that the researcher was considering here in the present study. Does a student’s
ability to use mathematics effectively affect a student’s outlook towards mathematics?

52
Multiple regression analysis only allowed for the directionality to be formally tested in
one direction. That is, the statistical tests only pertained to self-confidence affecting
achievement – not vice versa. However, the relationship may indeed be bi-directional in
reality, especially considering the fact that the ATMI in its entirety was shown to have a
statistically significant, positive correlation with the BAMS. More research is needed in
this area – both specific to mathematics and self-confidence theory in general.
The fourth subscale of the ATMI was motivation. This construct was shown to
have a positive relationship with students’ performance on the Basic Applied
Mathematics Scale. This result confirms and expands research regarding student
motivation and student achievement in mathematics. Singh et al. (2002) found that two
different dimensions of motivation were significantly related to achievement in
mathematics. Reynolds and Walberg (1992) devised a similar structural model that
demonstrated motivation having both direct and mediating effects on mathematical
achievement and students’ attitudes towards mathematics in general. These data confirm
that motivation is positively related to mathematical outcomes, but also that mathematical
outcomes are positively related to student motivation.
As with the self-confidence subscale, the bi-directional relationship between the
BAMS and motivation is of interest. The researcher suspects that exists a feedback effect
between the two variables. That is, it may be the case that motivation affects achievement
but also that achievement affects motivation. As students receive positive feedback (in
the form of good grades) in the mathematics classroom, it may be the case that they
experience higher levels of motivation. The research design did not allow for this
relationship to be tested explicitly. However, since the ATMI and BAMS were overall

53
statistically significantly correlated, one could presume that the relationship between
motivation and achievement on the BAMS was indeed bi-directional.
One disappointing aspect of this research was the fact that students’ attitudes
towards mathematics in general was not found to have a statistically significant
relationship with students’ final mathematics course grade. In their meta-analysis, Ma
and Kishor (1997) found that there was an overall net positive relationship between
students’ attitudes toward mathematics and students’ achievement in mathematics. That
result was not replicated in this sample. The researcher expects the reason is because
most students reported quite positive attitudes towards mathematics – even when their
BAMS score and final course grade were quite low. On the other hand, it is certainly a
desired result, in the sense that positive attitudes toward mathematics are a good thing –
regardless of how students actually perform academically. As previously speculated, the
disconnect may be related the fact that most of what students consider “doing
mathematics” entails solving rote, non-contextual exercises – not applied “word
problems.”
Worthy of note, however, is the fact that a positive, significant relationship was
demonstrated between students’ final course grade and students’ scores on the BAMS
using both linear regression and examining Pearson’s r. Although a significant statistical
link was not demonstrated between students’ attitudes towards mathematics and students’
final mathematics course grade, separate significant correlations were demonstrated here
between students’ attitudes towards mathematics and the BAMS and between the BAMS
and students’ final course grade. Further research and a larger research sample may be
necessary to tease out the relationship amongst these three constructs.

54
The main model in its entirety was demonstrated that, for the sample at hand, a
significant relationship existed between students’ attitude toward mathematics and
students’ ability to use basic applied mathematics. This was the overarching aim of the
study. Many researchers have examined the effects of teaching from an applied
standpoint and how student achievement is either increased or decreased (Boaler, 1998;
Riordan & Noyce, 2001; Ziegler & Yan, 2001). The goal of this research was more
nuanced. The researcher in this study was not interested in instructional methods. The
researcher was looking at students after they learned mathematical concepts in class
(regardless of instructional method) to see if once students learned a skill and were able
to use it, did this have any relationship with their attitudes towards mathematics. This
result is of importance, for it leads to a possible avenue for affecting student achievement
in general. Much research has shown that positive attitudes towards mathematics are
positively linked to better outcomes in the mathematics classroom (Ma & Kishor, 1997).
But again, this research was more specific. The research at hand demonstrated that
positive, significant relationship exists between students’ ability to use mathematics in
the real world and students’ attitudes towards mathematics. Therefore, fostering students’
attitudes towards mathematics may be achievable through showing students how the
mathematics they learn in the classroom is useful to them in their everyday lives in the
real world. This may, in turn, result in increased student performance in the mathematics
classroom.
Summary
Mathematics is important for everyday life. From evaluating sales at the grocery
store to making informed decisions regarding taxes, student loans, or retirement savings,

55
mathematics is necessary and commanding knowledge of it yields a distinct advantage in
life. It is imperative that educators continually strive to improve the outcomes of their
students’ – the very same citizens who need mathematical skills to adeptly navigate their
day-to-day lives. This research has demonstrated a possible way to improve students’
outcomes via increased positive attitudes toward mathematics. If educators can
effectively show students not only how to use mathematics in the classroom, but how to
use that same mathematics to their advantage in their everyday lives, students’ attitudes
towards mathematics may be increased and consequently achievement toward
mathematics may be increased as well.
Limitations
1. This study was conducted at a private, religiously-oriented college in the
Southeastern United States. The research sample therefore may not represent the
college-age population as a whole in the United States.
2. This research relied on self-selection. That is, students strictly volunteered for the
study. Participants could have had many different motivations for participation –
anything from altruism to increasing their standing in the eyes of their peers or
professors. More importantly, those students who did not participate may on
average possess more extreme attitudes towards mathematics – be it negative or
positive.
3. This study also relied on self-report. As with any questionnaire, participants could
purposefully mislead the researcher or rush through the questionnaire without
paying it proper attention. Some students participated in the research between

56
classes or other appointments, so time was an issue for them when completing the
quiz and questionnaire.
4. Due to research design, analyses were only conducted in “one direction.” That is,
the researcher was able to examine how “a” affects “b,” but could not specifically
examine the reverse relationship where “b” affects “a.” In some cases, this reverse
analysis might possibly have yielded interesting results.
Recommendations for Further Research
1. Self-confidence and motivation were the two significant predictors of
achievement on the BAMS. These two constructs and their relationship toward
achievement in mathematics should be investigated in greater detail. Furthermore,
if the results regarding these two constructs are replicated, mathematics
instructors should find ways to foster these constructs to in turn bolster the
achievement of their students.
2. Research should be conducted with the statistical analyses that allow bi-
directional tests between the attitudinal scale and the BAMS. Bi-directional
relationships were not allowed in the current study due to its research design.
Further research should explicitly look at these reverse relationships.
3. The relationship between students’ overall mathematical achievement and
students’ attitudes toward mathematics should be examined in more detail. On
average, the relationship between students’ attitudes and students’ mathematical
achievement is positive, though sometimes small. That was not observed in this
sample. Perhaps a larger and more diverse cohort would make a difference.

57
4. Further research should be conducted that relates students’ applied mathematics
skill, students’ attitudes towards mathematics, and students’ overall achievement
towards mathematics. This perhaps could be accomplished by using structural
equation modeling or other appropriate techniques.

58
APPENDIX A
ATTITUDES TOWARD MATHEMATICS INVENTORY (ATMI)
Demographic Information Age:_____ Sex: ____Male ____Female Have you taken college algebra before? _____
If so, how many times? _____
Directions: This inventory consists of statements about your attitude toward mathematics. There are no correct or incorrect responses. Read each item carefully. Please think about how you feel about each item. Circle the choice that most closely corresponds to how the statements best describe your feelings. Complete your responses for all 40 statements. 1. Mathematics is a very worthwhile and necessary subject.
Strongly Disagree Disagree Neutral Agree Strongly Agree
2. I want to develop my mathematical skills.
Strongly Disagree Disagree Neutral Agree Strongly Agree
3. Mathematics helps develop the mind and teaches a person to think.
Strongly Disagree Disagree Neutral Agree Strongly Agree
4. Mathematics is important in everyday life.
Strongly Disagree Disagree Neutral Agree Strongly Agree
5. Mathematics is one of the most important subjects for people to study.
Strongly Disagree Disagree Neutral Agree Strongly Agree
6. Math courses would be very helpful no matter what grade level I teach.
Strongly Disagree Disagree Neutral Agree Strongly Agree
7. I can think of many ways that I use math outside of school.

59
Strongly Disagree Disagree Neutral Agree Strongly Agree
8. I think studying advanced mathematics is useful.
Strongly Disagree Disagree Neutral Agree Strongly Agree
9. I believe studying math helps me with problem solving in other areas.
Strongly Disagree Disagree Neutral Agree Strongly Agree
10. A strong math background could help me in my professional life.
Strongly Disagree Disagree Neutral Agree Strongly Agree
11. I get a great deal of satisfaction out of solving a mathematics problem.
Strongly Disagree Disagree Neutral Agree Strongly Agree
12. I have usually enjoyed studying mathematics in school.
Strongly Disagree Disagree Neutral Agree Strongly Agree
13. I like to solve new problems in mathematics.
Strongly Disagree Disagree Neutral Agree Strongly Agree
14. I would prefer to do an assignment in math than to write an essay.
Strongly Disagree Disagree Neutral Agree Strongly Agree
15. I really like mathematics.
Strongly Disagree Disagree Neutral Agree Strongly Agree
16. I am happier in a math class than in any other class.
Strongly Disagree Disagree Neutral Agree Strongly Agree
17. Mathematics is a very interesting subject.
Strongly Disagree Disagree Neutral Agree Strongly Agree
18. I am comfortable expressing my own ideas on how to look for solutions to a
difficult

60
problem in math.
Strongly Disagree Disagree Neutral Agree Strongly Agree
19. I am comfortable answering questions in math class.
Strongly Disagree Disagree Neutral Agree Strongly Agree
20. Mathematics is dull and boring.
Strongly Disagree Disagree Neutral Agree Strongly Agree
21. Mathematics is one of my most dreaded subjects.
Strongly Disagree Disagree Neutral Agree Strongly Agree
22. When I hear the word mathematics, I have a feeling of dislike.
Strongly Disagree Disagree Neutral Agree Strongly Agree
23. My mind goes blank and I am unable to think clearly when working with
mathematics.
Strongly Disagree Disagree Neutral Agree Strongly Agree
24. Studying mathematics makes me feel nervous.
Strongly Disagree Disagree Neutral Agree Strongly Agree
25. Mathematics makes me feel uncomfortable.
Strongly Disagree Disagree Neutral Agree Strongly Agree
26. I am always under a terrible strain in a math class.
Strongly Disagree Disagree Neutral Agree Strongly Agree
27. It makes me nervous to even think about having to do a mathematics problem.
Strongly Disagree Disagree Neutral Agree Strongly Agree
28. I am always confused in my mathematics class.
Strongly Disagree Disagree Neutral Agree Strongly Agree

61
29. I feel a sense of insecurity when attempting mathematics.
Strongly Disagree Disagree Neutral Agree Strongly Agree
30. Mathematics does not scare me at all.
Strongly Disagree Disagree Neutral Agree Strongly Agree
31. I have a lot of self-confidence when it comes to mathematics.
Strongly Disagree Disagree Neutral Agree Strongly Agree
32. I am able to solve mathematics problems without too much difficulty.
Strongly Disagree Disagree Neutral Agree Strongly Agree
33. I expect to do fairly well in any math class I take.
Strongly Disagree Disagree Neutral Agree Strongly Agree
34. I learn mathematics easily.
Strongly Disagree Disagree Neutral Agree Strongly Agree
35. I believe I am good at solving math problems.
Strongly Disagree Disagree Neutral Agree Strongly Agree
36. I am confident that I could learn advanced mathematics.
Strongly Disagree Disagree Neutral Agree Strongly Agree
37. I plan to take as much mathematics as I can during my education.
Strongly Disagree Disagree Neutral Agree Strongly Agree
38. The challenge of math appeals to me.
Strongly Disagree Disagree Neutral Agree Strongly Agree
39. I am willing to take more than the required amount of mathematics.
Strongly Disagree Disagree Neutral Agree Strongly Agree
40. I would like to avoid teaching mathematics.

62
Strongly Disagree Disagree Neutral Agree Strongly Agree
Do you have any thoughts or opinions regarding mathematics that were not covered in the questionnaire you just completed? If so, you may discuss those ideas in the space provided below.

63
APPENDIX B
BASIC APPLIED MATHEMATICS SCALE (BAMS)
1. On a long road trip, you travel 260 miles in 4 hours. If you continue at the same rate, how long will the next 650 miles take? 2. Dave has $1.72 in his pocket and wants to buy a soda which costs $1.59 plus tax. If sales tax is 9%, can he afford the soda? 3. Mary wants to buy a new printer. The model she wants is available on Amazon.com from a dealer in the United Kingdom for £30 plus £5 shipping. A domestic seller has the same model available for $55 with free shipping. Should Mary buy the printer from the seller in the United Kingdom or the United States, assuming that £1 will buy $1.61? 4. A Big Mac contains 550 calories. If you can burn 114 calories per mile running, how many miles must you run to burn off the calories from the Big Mac? 5. Your favorite brand of shampoo is sold in two different sizes. The regular size is 14 oz. and costs $2.29 whereas the large size is 17 oz. and costs $3.38. Which size is the better deal? 6. You need to buy two pairs of socks. Target is running a buy one get one half off sale. At Wal-Mart, the sale is 30% off. The non-sale price is the same at both stores. At which store would they be cheaper? 7. I tuned in midgame to the Yankees-Red Sox game the other day and the announcer said that a total of 25 runs had been scored so far and the Red Sox were down by 9. What was the score? 8. Carla needs to make an A in College Algebra. The only grades in the class are 5 tests, and each test is counted equally. If she has made a 95, 86, 97, and 83 on the first 4 tests, what does Carla need to make on her final test to make a 90 in the course?

64
9. You are planning to make a big batch of homemade cookies. The recipe calls for 2.5 pounds of chocolate. The grocery store sells chocolate in 10 oz. bags. How many bags do you need to buy to make the cookies? Remember, 16 oz. = 1 lbs. 10. An empty truck and driver weigh a total of 4,327 pounds. The truck needs to be loaded with corn, weighing 31 pounds per bag. The truck must cross over a bridge with a 10,000 pound load limit. How many bags of corn can the truck legally carry? 11. John makes and sells crafts at local craft fairs. John spends $2 for each craft he creates and sells each one for $10. If it costs $104 to rent a booth at a local craft fair, how many crafts must John sell to at least break even? 12. The manager of a restaurant prices a glass of wine as follows: divide the bottle price by 4 then add 75 cents. If you know that a glass of wine costs $11, then how much will a bottle of that wine cost? 13. Josh has $65 and wants to rent a Jet Ski while he is at the beach. It costs $25 base rate plus $10 per hour to rent the jet ski. How long can he rent the Jet Ski? 14. Brittany lives in the US and was talking to her friend Elizabeth in Europe. Elizabeth commented that it was a nice warm day since it was 25 degrees outside. Brittany was confused at first, but then realized that Elizabeth was expressing the temperature in
Celsius. Express the temperature in Fahrenheit. Use the formula: �� �������
� , where TC
is the temperature in Celsius and TF is the temperature in Fahrenheit. 15. You own a company and give each of your employees a holiday bonus of $250. You want the bonus to be a full $250 after deducting 15% for federal tax, 10% for state tax, and 7.5% for social security. What must the gross (before tax) amount of the bonus be?

65
16. Sue lives 2 miles from her school. She typically averages 30 MPH on the way to school. One morning Sue is running late and averages 45 MPH on the way to school. How much faster does Sue arrive at school? 17. A city council has proposed the following two methods for calculating property taxes: Method #1 – $2,200 + 4% of the property’s value, or Method #2 – $1,200 + 6% of the property’s value. If you own property that is worth $60,000, what method of taxation should you prefer?

66
APPENDIX C
PERMISSION LETTER TO COLLECT DATA AT MISSISSIPPI COLLEGE

67
APPENDIX D
ORAL PRESENTATION SCRIPT FOR RECRUITMENT
Hello, my name is Taylor Kilman. I am a doctoral student at The University of Southern Mississippi. I am currently conducting a research project and would love to tell you about it. This study is designed to gather data regarding students’ attitudes towards mathematics. This research has the potential to benefit individual participants since the data collected may influence how and what topics are taught in undergraduate math courses. The results may benefit administrators and math educators by providing a better understanding of how students experience introductory mathematics courses. This research could inform educators and help them provide the best possible classroom experience to college algebra students. Since college algebra is a “gateway” course, improved student engagement may result in many student benefits such as lower drop-out and fail rates.
As a part of the research study, I will be distributing questionnaires. The
questionnaires will take approximately 30-45 minutes to complete. There are no known or anticipated risks associated with participating in this study. Any information that is obtained during the study about a particular individual will be kept entirely confidential. Participation is optional. The decision to participate is yours and yours alone. You will not be penalized in any way for not participating. You may discontinue participation at any time during this study. The data gathered from the interviews will be aggregated, analyzed, and described in my dissertation. The final paper may be presented at academic conferences or in peer-reviewed journals. Three years after the data from the interviews are analyzed, the data will be destroyed by shredding or deletion. This research is supervised by Sherry Herron, PhD.
This project has been reviewed by the Institutional Review board, which ensures
that research projects involving human subjects follow federal regulations. Any questions or concerns about your rights as a research participant should be directed to the Chair of the Institutional Review Board, The University of Southern Mississippi, 118 College Drive #5147, Hattiesburg, MS 39406-0001, (601)-266-6820.
I appreciate your time and attention with this project. Thank you very much. I look forward to working with you soon.

68
APPENDIX E
PERMISSION FORM TO COLLECT STUDENTS’ FINAL COURSE GRADE I, ____________________________, hereby give my consent to allow Taylor Kilman to contact student’s name
______________________________, the instructor of mathematics course instructor’s name
___________________________ in which I am currently enrolled and collect my final grade. I course name and meeting time
understand that this will be completed for research purposes and will be completed such that the confidentiality of each student will be ensured. I also understand that participation in this aspect or any other aspect of this study is strictly voluntary and I may withdraw my participation at any time by contacting the researcher. __________________________________ ____________ Signature of the Participant Date __________________________________ ____________ Signature of the Researcher Date
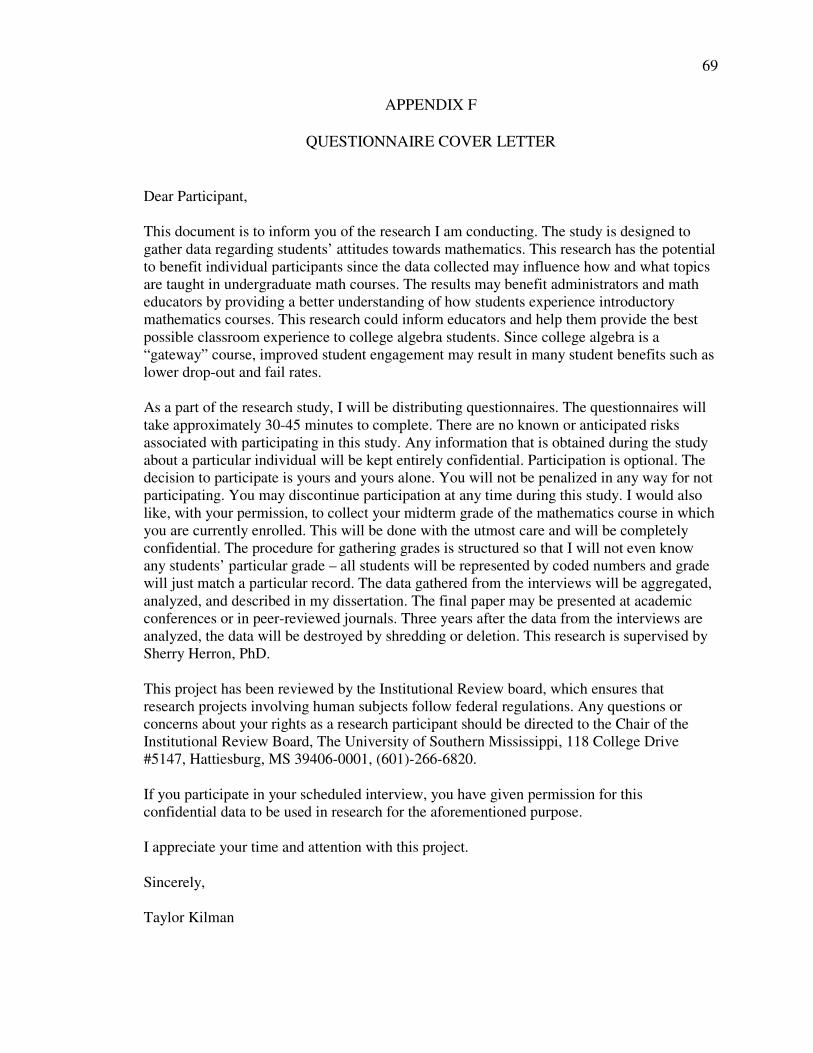
69
APPENDIX F
QUESTIONNAIRE COVER LETTER
Dear Participant, This document is to inform you of the research I am conducting. The study is designed to gather data regarding students’ attitudes towards mathematics. This research has the potential to benefit individual participants since the data collected may influence how and what topics are taught in undergraduate math courses. The results may benefit administrators and math educators by providing a better understanding of how students experience introductory mathematics courses. This research could inform educators and help them provide the best possible classroom experience to college algebra students. Since college algebra is a “gateway” course, improved student engagement may result in many student benefits such as lower drop-out and fail rates. As a part of the research study, I will be distributing questionnaires. The questionnaires will take approximately 30-45 minutes to complete. There are no known or anticipated risks associated with participating in this study. Any information that is obtained during the study about a particular individual will be kept entirely confidential. Participation is optional. The decision to participate is yours and yours alone. You will not be penalized in any way for not participating. You may discontinue participation at any time during this study. I would also like, with your permission, to collect your midterm grade of the mathematics course in which you are currently enrolled. This will be done with the utmost care and will be completely confidential. The procedure for gathering grades is structured so that I will not even know any students’ particular grade – all students will be represented by coded numbers and grade will just match a particular record. The data gathered from the interviews will be aggregated, analyzed, and described in my dissertation. The final paper may be presented at academic conferences or in peer-reviewed journals. Three years after the data from the interviews are analyzed, the data will be destroyed by shredding or deletion. This research is supervised by Sherry Herron, PhD. This project has been reviewed by the Institutional Review board, which ensures that research projects involving human subjects follow federal regulations. Any questions or concerns about your rights as a research participant should be directed to the Chair of the Institutional Review Board, The University of Southern Mississippi, 118 College Drive #5147, Hattiesburg, MS 39406-0001, (601)-266-6820. If you participate in your scheduled interview, you have given permission for this confidential data to be used in research for the aforementioned purpose. I appreciate your time and attention with this project. Sincerely, Taylor Kilman

70
APPENDIX G
INFORMED CONSENT

71
APPENDIX H
THE UNIVERSITY OF SOUTHERN MISSISSIPPI IRB ARRPOVAL FORM

72
APPENDIX I
MISSISSIPPI COLLEGE IRB APPROVAL FORM

73
APPENDIX J
LETTER OF PERMISSION TO UTLIZE THE ATMI
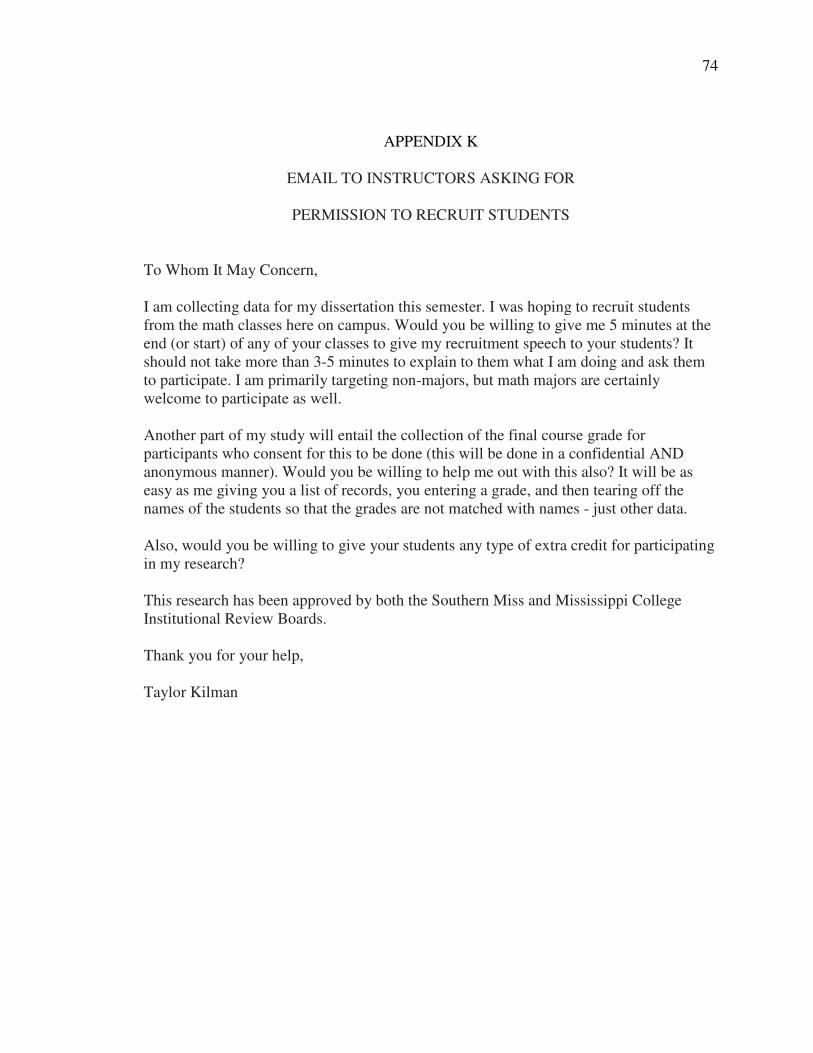
74
APPENDIX K
EMAIL TO INSTRUCTORS ASKING FOR
PERMISSION TO RECRUIT STUDENTS
To Whom It May Concern, I am collecting data for my dissertation this semester. I was hoping to recruit students from the math classes here on campus. Would you be willing to give me 5 minutes at the end (or start) of any of your classes to give my recruitment speech to your students? It should not take more than 3-5 minutes to explain to them what I am doing and ask them to participate. I am primarily targeting non-majors, but math majors are certainly welcome to participate as well. Another part of my study will entail the collection of the final course grade for participants who consent for this to be done (this will be done in a confidential AND anonymous manner). Would you be willing to help me out with this also? It will be as easy as me giving you a list of records, you entering a grade, and then tearing off the names of the students so that the grades are not matched with names - just other data. Also, would you be willing to give your students any type of extra credit for participating in my research? This research has been approved by both the Southern Miss and Mississippi College Institutional Review Boards. Thank you for your help, Taylor Kilman

75
APPENDIX L
BOXPLOT OF ATMI RESULTS

76
REFERENCES
Aryana, M. (2010). Relationship between self-esteem and academic achievement
amongst pre-university students. Journal of Applied Sciences, 10, 2474-2477.
Baumeister, R.F., Campbell, J.D., Krueger, J.I., & Kohs, K.D. (2003). Does high self-
esteem cause better performance, interpersonal success, happiness, or a healthier
lifestyle? Psychological Science in the Public Interest, 4, 1-44.
Boaler, J. (1998). Open and closed mathematics: Student experiences and understandings.
Journal for the Research in Mathematics Education, 29, 41-62.
Bray, M.S. (2005). Achievement of eighth grade students in mathematics after completing
three years of the Connected Mathematics Project. (Doctoral dissertation).
ProQuest Dissertations and Theses. (UMI No. 3197596)
Cain, J.S. (2002). An evaluation of the Connected Mathematics Project. The Journal of
Educational Research, 95, 224-233.
Clarkson, L.M. (2001). The effects of the Connected Mathematics Project on middle
school mathematics achievement. (Doctoral dissertation). ProQuest Dissertations
and Theses. (UMI No. 9997642)
Curtis, K.M. (2006). Improving students’ attitudes: A study of mathematics curriculum
innovation. (Doctoral dissertation). ProQuest Dissertations and Theses. (UMI No.
3215071)
Davison, D.M., & Mitchell, J.E. (2008). How is mathematics education philosophy
reflected in the math wars? The Montana Mathematics Enthusiast, 5, 143-154.
Grouws, D.A., Tarr, J.E., Chavez, O., Sears, R., Soria, V.M., & Taylan, R.D. (2013). Curriculum and implementation effects on high school students’ mathematics

77
learning from curricula representing subject-specific and integrated content organizations. Journal for Research in Mathematics Education, 44, 416-463.
Hacker, A. (2012, July 28). Is algebra necessary? New York Times. Retrieved from
http://www.nytimes.com/2012/07/29/opinion/sunday/is-algebra-
necessary.html?pagewanted=all&_r=0
Hamid, M., Sharill, M., Matzin, R., Mahalle, S., & Mundia, L. (2013). Barriers to
mathematics achievement in Brunei secondary school students: Insights into the
roles of mathematics anxiety, self-esteem, proactive coping, and test stress.
International Education Studies, 6. Retrieved from
http://www.ccsenet.org/journal/index.php/ies/article/view/31183
Harwell, M.R., Medhanie, A., Post, T.R., Norman, K., & Dupuis, D.N. (2012).
Preparation of students completing a Core-Plus or commercially developed high
school mathematics curriculum for intense mathematics coursework. The Journal
of Experimental Education, 80, 96-112. Hiebert, J., Carpenter, T.P., Fennama, E., Fuson, K., Human, P., Murray, H., Oliver, A., & Wearne, D. (1996). Problem solving as a basis for reform in curriculum and instruction: The case of mathematics. Educational Researcher, 25, 12-21. House, P.A. (2003). Integrated mathematics: An introduction. In S. A. McGraw (Ed.),
Integrated mathematics: Choices and challenges (pp. 3–11). Reston, VA: National Council of Teachers of Mathematics.
Klein, D. (2007). A quarter century of US ‘math wars’ and political partisanship. Journal
of the British Society for the History of Mathematics, 22, 22-33.
Lappan, G., Fey, J., Fitzgerald, W., Friel, S., & Phillips, E. (1999). Getting to know
Connected Mathematics: A guide to the Connected Mathematics curriculum. Dale
Seymour Publications.

78
Liu, X. & Kiorala, H. (2009). The effect of mathematics self-efficacy on mathematical
achievement of high school students. Paper presented at the Annual Conference of the Northeastern Educational Research Association, Rocky Hill, CT.
Ma, X., & Kishor, N. (1997). Assessing the relationship between attitude toward
mathematics and achievement in mathematics: A meta-analysis. Journal for
Research in Mathematics Education, 28, 26-47.
Ma, X. (1997). Reciprocal relationships between attitude toward mathematics and
achievement in mathematics. Journal of Educational Research, 90, 221-229.
Madison, B. L., & Hart, T. A. (1990). A Challenge of Numbers: People in the
Mathematical Sciences. Committee on Mathematical Sciences in the Year 2000,
National Research Council.
Majeed, A.A., Darmawan, G.N., & Lynch, P. (2013). A confirmatory factor analysis of the Attitudes Toward Mathematics Inventory (ATMI). The Mathematics
Educator, 15, 121-135.
Mohammad A. (2010). Relationship between self-esteem and academic achievement amongst pre-university students. Journal of Applied Sciences, 10, 2474-2477.
Mriano, S. (2005). An investigation of the relationship between students’ attitude toward
learning mathematics and mathematics achievement with respect to gender
among tenth grade public school students in Amman, Jordan. (Doctoral
dissertation). ProQuest Dissertations and Theses. (UMI No. 3186960)
National Commission on Mathematics and Science. (2000). Before it’s too late. Washington, DC: U.S. Government Printing Office.
National Council of Teachers of Mathematics. (1980). Agenda for action. Reston, VA:

79
Author. National Council of Teachers of Mathematics. (1989). Curriculum and evaluation
standards for school mathematics. Reston, VA: Author. National Council of Teachers of Mathematics. (2000). Principles and standards for
school mathematics. Reston, VA: Author. National Research Council. (1989). Everybody counts: A report on the future of
mathematics education. Washington, DC: National Academy Press. Organization For Economic Cooperation and Development. (2012). United States –
country note – results from PISA 2012. Paris, France: Author. Ormrod, J.E. (2006). Educational psychology: Developing learners. Upper Saddle River,
NJ: Pearson Education.
Petric, M. (2011). Reform in mathematics education: What do we teach for and against?
(Doctoral dissertation). ProQuest Dissertations and Theses. (UMI No. 3445816)
Portal, J. & Sampson, L. (2001). Improving high school students’ mathematics
achievement through the use of motivational strategies. (Master’s thesis). ERIC
Full Text. (UMI No. 460854)
Randhawa, B.S., Beamer, J.E., & Lundberg, I. (1993). Role of mathematics self-efficacy
in the structural model of mathematics achievement. Journal of Educational
Psychology, 85, 41-48.
Reynolds, A.J., & Walberg, H.J. (1992). A structural model of high school mathematics
outcomes. The Journal of Educational Research, 85, 150-158.
Rich, M. (2012, July 6). “No child” law whittled down by White House. New York Times.
Retrieved from http://www.nytimes.com/2012/07/06/education/no-child-left-
behind-whittled-down-under-obama.html?pagewanted=all&_r=0

80
Riordan, J.E., & Noyce, P.E. (2001). The impact of two standards-based curricula on
student achievement in Massachusetts. Journal for Research in Mathematics
Education, 32, 368-398.
Schiefele, U. & Csikszentmihalyi, M. (1995). Motivation and ability as factors in
mathematics experience and achievement. Journal for Research in Mathematics
Education, 26, 163-181.
Schoenfeld, A.H. (2004). The math wars. Educational Policy, (18), 253-286.
Schreiber, J.B. (2002). Institutional and student factors and their influence on
mathematical achievement. The Journal of Educational Research, 95, 274-286.
Schommer, M. (1990). The effects of the beliefs about the nature of knowledge on
comprehension. Journal of Educational Psychology, 82, 498-504.
Singh, K., Granville, M., & Dika, S. (2002). Mathematics and science achievement:
Effects of motivation, interest and academic achievement. The Journal of
Education Research, 95, 323-332.
Tapia, M. (1996). The attitudes towards mathematics instrument. Paper presented at the
Annual Meeting of the Mid-South Educational Research Association, Tuscaloosa,
AL.
Tapia, M., & Marsh, G. (2000). Attitudes toward mathematics instrument: An
investigation with middle school students. Paper presented at the Annual Meeting
of the Mid-South Educational Research Association, Bowling Green, KY.
Tapia, M., & Marsh, G. (2002). Confirmatory factor analysis of the Attitudes Toward
Mathematics Inventory. Paper presented at the Annual Meeting of the Mid-South
Educational Research Association, Chattanooga, TN.

81
U.S. Department of Education. (2000). Before it's too late: A report to the nation from
the National Commission on Mathematics and Science Teaching for the 21st
Century. Education Publications Center, 2000.
Usiskin, Z. (2003). The integration of the school mathematics curriculum in the United States: History and meaning. In S. A. McGraw (Ed.), Integrated mathematics:
Choices and challenges (pp. 13–31). Reston, VA: National Council of Teachers of Mathematics.
Vygotsky, L.S. (1978). Mind in society: The development of higher psychological
processes. Cambridge, MA: Harvard University Press.
Wilkins, J.L., & Ma, X. (2002). Predicting student growth in mathematical content
knowledge. The Journal of Educational Research, 95, 288-298.
Wood, T., & Sellers, P. (1996). Assessment of a problem-centered mathematics program:
Third grade. Journal for Research in Mathematics Education, 27, 337-353.
Zahorik, J.A. (1996). Elementary and secondary teachers’ report of how they make
learning interesting. The Elementary School Journal, 96, 551-564.
Ziegler, J.F., & Yan, W. (2001). Relationships of teaching, learning, and supervision:
Their influence on student achievement in mathematics. Paper presented at the
Annual Meeting of the American Education Research Association, Seattle, WA.