the relationship between road infrastructure …the relationship between road infrastructure...
TRANSCRIPT

THE RELATIONSHIP BETWEEN ROAD INFRASTRUCTURE
INVESTMENT AND ECONOMIC GROWTH IN SOUTH
AFRICA.
AKW Moeketsi
16244303
Dissertation submitted in fulfilment of the requirements for the
degree of Masters in economics in the faculty of Commerce of the
North West University (Mafikeng Campus)
Supervisor: Prof. O.D Daw
APRIL 2017

i
DECLARATIONS
I, August Moeketsi, declare that this dissertation for the Degree of Masters in economics,
submitted at the North West University, Mafikeng campus, has not been submitted by me at this
or any other university. This work has been done by me and all other materials included have been
acknowledged.
..........................................

ii
ACKNOWLEDGEMENTS
I would like to take this opportunity to thank these people who have been there for me in every
aspects of my life
To God Almighty, thank you for never giving up on me, for the knowledge and wisdom
and most of all for giving me another opportunity.
To my beloved wife, Angie your support will always be appreciated. I have done this
because of your never ending support.
To my kids, Puleng and Kaone. You mean a world to me, your presence loudest voice
make me to complete. May God with His blessings direct you to your dreams and
aspirations.
To my fathers Modisaotsile and Mongane, to my mothers Motshabi and Emily, I thank you
for your encouragement towards books. May the Heavenly Father give you many more
years.
To my sisters and brothers, you have given me hope, courage and the attitude of never to
surrender. May God bless you all.
To my supervisor and lecturer Dr David Daw, thank you very much for guiding me through
my postgraduate studies. May God continue showering you with His blessings.
To my grandmother Mamaki with your continuous prayers, May God give you many more
years.

iii
ABSTRACT
The aims of this dissertation is to investigate the relationship between road infrastructure
investment and economic growth and other macro-economic variables such as ICT investment and
labour input. Annual time series data between 1960 and 2013 are employed in this dissertation.
The gross domestic product, road infrastructure investment, ICT investment and labour input are
from the South African Reserve Bank.
The quality of road infrastructure and ICT investment results in different decisions that influence
business establishments and employment. The enhancement of economic growth requires
upgrading, routine, preventative and emergency infrastructure maintenance.
The Vector Auto regression (VAR) model was used for the implementation and forecasting of
time series data. It was also used to examine the dynamic shock in one variable to another. The
Cobb-Douglas production function was also used to test the relationship between infrastructure
capital, labour input and ICT investment, whereas gross domestic product is considered as an
output.
The findings of the study shows the impact of road infrastructure investment, ICT stock and labour
input that continues to have positive relation to economic growth.
KEYWORDS: Road Infrastructure investment, ICT investment, labour input, economic growth
and VAR

iv
LIST OF ABBREVIATIONS
1. BRT : Bus Rapid Transport
2. CBO : Community Based Organisation
3. EPWP : Expanded Public Works Programme
4. FAO : Food and Agriculture Organisation of United Nation
5. GDP : Gross Domestic Product
6. GNI : Gross National Income
7. ICT : Information Communication Technology
8. ILO : International Labour Organisations
9. MDG : Millenium Development Goal
10. NEDLAC : National Economic Development and Labour Council
11. NEPAD : New Partnership for Africa's Development
12. PRMG : Provincial Road Maintenance Grant
13. SAICE : South African Institute of Civil Engineering
14. SANRAL : South Africa National Road Agency Limited
15. UN : United Nations
16. UNCTAD : United Nations Conference on Trade and Development
17. UIF : Unemployment Insurance Funds
18. WB : World Bank
19. N : National road or street or paved network

v
TABLE OF CONTENTS
Contents
DECLARATION ..................................................................................................................... i.
ACKNOWLEDGEMENTS ................................................................................................... ii.
ABSTRACT ........................................................................................................................... iii.
TABLE OF CONTENTS ...................................................................................................... iv.
CHAPTER 1 ............................................................................................................................ 1
INTRODUCTION ................................................................................................................... 1
1.1 INTRODUCTION ............................................................................................................. 1
1.2 BACKGROUND OF THE STUDY ................................................................................. 3
1.3 PROBLEM STATEMENT............................................................................................... 6
1.4 RESEARCH AIM AND OBJECTIVES ......................................................................... 7
1.5 HYPOTHESES OF THE STUDY........................................................................... 8
1.6 IMPORTANCE OR BENEFIT OF THE STUDY ................................................ 8
1.7 LIMITATIONS AND CONSTRAINTS OF THE STUDY................................... 9
1.8 RESEARCH METHODOLOGY .......................................................................... 10
1.9 DEPLOYMENT AND PLAN OF THE STUDY ................................................. 10
1.10 DEFINITION OF TERMS .................................................................................... 11
CHAPTER 2 .......................................................................................................................... 12
LITERATURE REVIEW ..................................................................................................... 12
2.1 INTRODUCTION ......................................................................................................... 13

vi
2.2 THE IMPORTANCE OF ROAD INFRASTRUCTURE INVESTMENT:
THEORETICAL DISCUSSIONS ................................................................ 15
2.2.1 Theoretical role of Road Infrastructure Investment .......................................... 15
2.2.2 Neo Classical growth model ............................................................................. 17
2.2.3 Road infrastructure financing in South Africa .................................................. 18
2.2.4 Experience of road infrastructure funding across the world ............................. 22
2.2.5 Road Infrastructure and Economic Growth ...................................................... 23
2.2.6 The role of Information communication technology and economic growth ..... 32
2.2.7 Expanded Public Works Programme and Roads infrastructure ........................ 33
2.2.8 Infrastructure development and current situation in China: L Y U ................... 35
2.2.9 Role of road infrastructure in poverty alleviation in South Africa ................................ 37
2. 3 CONCLUSION ............................................................................................................... 40
CHAPTER 3 .......................................................................................................................... 41
RESEARCH METHODOLOGY ANDDESIGN ................................................................ 41
3.1 INTRODUCTION ........................................................................................................... 41
3.2 DEFINITIONS ................................................................................................................ 42
3.2.1 Gross Domestic Product (GDP) ..................................................................................... 42
3.2.2 Road Infrastructure Investments .................................................................................... 42
3.2.3 ICT Investments ............................................................................................................. 42
3.3 DATA EXPLORATORY ANALYSIS ............................................................................. 42
3.3 1 Vector Auto regression Model (VAR) .............................................................. 43
3.4 Cobb-Douglas Production Function ..................................................................... 43

vii
3.5 Jarque -Bera Tests .......................................................................................................... 44
3.6 Augmented Dickey Fuller Unit Root Test ..................................................................... 44
3.7 Econometric and Statistical Software ........................................................................... 44
3.8 SUMMARY ...................................................................................................................... 45
CHAPTER 4 .......................................................................................................................... 45
STUDY OUTCOME ANALYSIS AND RESULTS ........................................................... 45
4.1 INTRODUCTION .................................................................................................. 45
4.2 EXPLORATORY DATA ANALYSIS.................................................................. 46
4.3 Stationarity Tests .................................................................................................... 48
4.3 ECONOMIC GROWTH DYNAMICS USING THE COBB-DOUGLAS
PRODUCTION FUNCTION ........................................................................ 51
4.3.1 Significance of Road Infrastructure Investment in Economic Growth ............. 51
4.3.2 Dynamics of Economic Growth ........................................................................ 55
4.3.3 Dynamics of Economic Growth with Increasing Return to Scale Constraint ... 58
4.3.4 Dynamics of Economic Growth with Constant Return to Scale Constraint ..... 60
4.3.5 Total Factor Productivity .................................................................................. 62
4.3.6 Output, Potential Output and Output Gap ......................................................... 64
4.3.7 Potential Growth Accounting ............................................................................ 66
4.4 ANALYSIS OF LONG-RUN DYNAMICS .......................................................... 67
4.4.1 VAR Analysis at Levels .................................................................................... 68
4.4.2 Deterministic Term Specification in the Cointegration Relationships .............. 77
4.4.3 Assessment of Long-Run Relationships ........................................................... 79

viii
4.5 ASSESSMENT OF SHORT-RUN DYNAMICS ................................................. 81
4.5.1 Analysis of First-Differenced VAR System ...................................................... 81
4.5.3 Causal Relationships in the System .................................................................. 90
4.5.4 Impulse Response Functions ............................................................................. 91
4.5.5 Forecast Error Variance Decomposition Analysis ............................................ 95
4.6 CONCLUSION ....................................................................................................... 97
CHAPTER 5 .......................................................................................................................... 98
CONCLUSION AND RECOMMENDATIONS ................................................................ 98
5.1 INTRODUCTION .................................................................................................. 98
REFERENCES .................................................................................................................... 101

ix

1
CHAPTER 1
1.1 INTRODUCTION
South Africa's national and provincial roads are classified into various operational frameworks,
practical classes and geometric sorts. These orders are essential for connecting people and
goods to various places. The aggregate South African road system comprises of around 754
600 kilometres, which are proclaimed as national, provincial and district roads, with a 16,7 per
cent been tar and remainder been not tarred (South Africa: State of Economic Infrastructure,
2012).
The National Department of Transport through the South African National Road Agency
Limited (SANRAL) is responsible of all national road system, which comprises of 11 per cent
of the aggregate national tarred road system. Provincial government departments which control
and regulate provincial roads networks are responsible for 31 per cent of the total network. The
fundamental function of these networks, is to give access and safer movement within the
country, provinces and districts.
The conditions of the provincial and municipal roads are waning due to poor routine and
preventative road network maintenance and repairs and it vastly compromises economic
growth and development. The study related to NEPAD and reflected that African countries
excluding, North of Africa, have road networks which are generally in apoor state, with the
lowest rate of tarred road compared to any country in the rest of the world (United Nation,
2002).
One of the main obstacles holding back the capital upgrading and replacement of road networks
is the decreased or non infrastructure budget. This results to declining or stagnation in
economic growth and development. The Food and Agriculture Organization (FAO) of the
United Nations (2002) mention that foreign direct investment in economic improvement and
growth from 1990-1996 for Sub-Saharan Africa was in the range of US$ 26.7 billion in
comparison with US$ 41.4 billion for Latin America and the Caribbean and US$ 101.9 billion
for Asia.

2
Taking into cognisance the above analysis, the financing needs for network development and
improvement is very crucial. The problem lies in the determination of South Arica's roads
financing requirements, through the execution and analysis of the accurate evaluation of the
nature and degree of the nation's network system, which are network asset value and its
condition.
The deficient investment results in the road infrastructure network not being upgraded,
rehabilitated or replaced timeously. The waning of the infrastructure road network is not only
limiting accessibility, movements of goods and commuting to different destinations, but also
results in the increased prices of transport cost, spares and fuel costs which adversely affect the
economy.
1.2 BACKGROUND OF THE STUDY
The report on SANRAL indicates that South Africa has the aggregate length of the
infrastructure road network of 754 600 kilometers which makes it the widest network in Africa.
The drive from Beitbrige in Limpopo which is the Zimbabwean border post to Cape Town in
the south covers a 2 000 kilometers journey alone on a well tarred road (SANRAL). The
National Department of Transport is in charge of overall policy documentation and
interpretation as well as funding of national and provincial road networks in the form of grants.
Provincial preventative and routine road maintenance is within the provincial spheres of
government.
SANRAL was formed to be a statutory organ, working as a government parastatal along the
commercial lines, regulated through the Act of Parliament in April 1998. The motive wasto
maintain and grow South Africa's national road network infrastructure system and to oversee
resources with a depreciable replacement value estimated to 238 billion rand, barring land,
working within the terms of its established Act, the South African National Roads Agency
Limited and National Roads Act (Act No. 7, 1998). SANRAL is represented by a leading group
of eight individuals, with a clear mandate of ensuring the road network system is in good and

3
driveable condition covering 16 200km radius. According to SAICE (2010), there are around
185 000km of provincial road and 66 000km of municipal road networks in South Africa.
National networks in South Africa are a class of highways, national roads and freeways which
joins main cities and metropolitans. They are categorised in South Africa route numbering
scheme and noted with numbers beginning with 'N', which is from N1 to N18. Around 19 per
cent of the national road network system istolls, a large portion of which is kept up by
SANRAL, while the rest has been offered admission to privately owned businesses to create,
work and keep up. A multi-billion rand expressway change plan has altogether facilitated clog
on the streets in Gauteng province, the nation's busiest region (South Africa.Info).
Transportation through road networks as a major aspect of development is fundamental for all
conveyances from field to grain storages at silos. The grains are conveyed through paved and
unpaved network systems, delivering using different types of deliveries such as tractors, trailers
combinations, trucks and sophisticated vehicles combinations determined by the scale and size
of farming. It is however basic and economic to keep up the paved network system is in good
condition to ensure the economic spin offs. Verifiably the business has been substantial scale
client of rail transport and actually all storehouses are arranged along the rail lines and the
offices at the silos are intended for paved network conveyances from farms and rail for longer
and more destinations.
In the course of recent years, the volume of grain transported by rail has lessened continuously
because of diminishing administration level and increasing expenses that have made the rail
mode not competitive in connection to road network transport. The present utilization of road
infrastructure network transport for grains is 80 per cent moving from storehouses to processes,
both for the creation of maize meal and for use in animal feed (Freight Transport Databank,
2004).
The mining business is another primary monetary area in South Africa representing roughly 33
per cent of the GDP, and 50 per cent of outside trade profit. Mining is one of the key parts in
South Africa, which delivers 70 per cent of the platinum in Rustenburg (Freight Transport

4
Databank, 2004). Road network system is an integral part to convey to platinum and different
valuable metals smelter for finish product.
South Africa has gigantic gold metal stores, evaluated at 40 000 tons which speak to 40 percent
of worldwide stores. The gold mines in the North West Province were created in the twentieth
century in the Potchefstroom and further west along the Vaal waterway close Carletonville,
Klerksdorp and Okney. There are 7 mines in the Klerksdorp - Orkney complex. A portion of
the wealthiest mines are found in these ranges and in this manner, the vast majority of the
related mechanical exercises and convergences of individuals happen in these parts of the
region. Gold mines in the North West are more youthful than gold mines in Gauteng and they
have long period of operations (Freight Transport Databank, 2004).
The mining operations make utilization of the paved and unpaved network systems, both inside
of the mining operations and also transportation of minerals as well as different finished and
raw commodities to neighbouring nations through road transport network and rail transport.
Farm and game animal movements over long distance are part of road transport system in South
Africa.
S'hamba Sonke ("walking together") was presented by the National Department of Transport
with massive funding to ensure that maintenance of paved and unpaved networks and lessen
backlogs over abundances on common street framework upkeep and repairs the system is a
work escalated proposed for group improvement through extended open works program. South
Africa's Public Transport Strategy presented in 2009/10 was expected to incorporate rail, taxi
and transport administrations in conjunction with private transport operators, both
operationally and through ownership. The grouping was for modernizing the vehicle operation
and formalizing it professionally.
According to South Africa.Info, the success case study of the Johannesburg bus rapid transport
framework (BRT) has prompted it being adjusted and actualized in other South African urban
areas, which include major metropolitan cities such as Cape Town, Nelson Mandela Bay,
Rustenburg, Tshwane and Ekurhuleni. The major part of the South African populace use taxis
as their prime mode of transport. The legislature has presented obligatory wellbeing guidelines

5
and a taxi recapitalisation program, which was meant for disposing of hazardous taxi through
scrapping remittances. This was to guarantee that the road framework system is protected and
secure every one of the vehicles are roadworthy, keeping in mind the end goal of bringing
economic spinoffs and economic growth.
South African paved networks are generally assembled and kept up by funds gathered from a
devoted duty on fuel deals. The duty was, however abrogated in 1988 (State of South Africa's
Economic Infrastructure, 2012). Since that point forward, the paved network development and
upkeep has depended yearly grant from the central government. This grant was allotted for a
longer period of time, and it diminished relentlessly. However over the following year it has
become the quickest growing in the national budget. The allotment far surpasses what is
collected through the fuel levy. It is assessed that at present a large portion of the sum required
for street construction and development is given by government through Provincial Road
Maintenance Grant (PRMG) (State of South Africa's Economic Infrastructure, 2012).
The grant for provincial road upkeep was made to support shortages of the provincial road
network system. These funding were observed through the system called S'hamba Sonke which
is the new programme by the Department of Transport to address the weakening on provincial
streets. It includes a street development and upkeep approach that are both labour intensive and
construction related, carried through the Expanded Public Works Program (EPWP) and meets
the criteria of coordinated Transport Sector Code and the Construction segment code
(Department of Transport, 2011).
The broad aim was to make three year Medium Term Expenditure Framework (MTEF)
experimental run program with the provinces targeting to:
• Benchmark value for money in the development and upkeep spending on road;
• Oversee the presentation of uniform best practice systems; and
• Create new employments and opportunities where individuals reside.

6
The system is necessary to the enhancements of country rural commonplace streets system.
Basically, it has the potential not just to enhance the state of rustic streets and extend the country
system by upgrading work portability, additionally to make direct job in zones with abnormal
amounts of destitution and unemployment. Commonplace street systems, if looked after
legitimately, can possibly upgrade financial development.
1.3 PROBLEM STATEMENT
Road Infrastructure Network is a primary mode of transport in South Africa for both freight
and passenger deliveries. It comprises of paved and unpaved roads. It carries over 80 percent
of goods and services (Pinard, 2004).The road network is characterised by several constraints
that limit economic growth and development in the South Africa. One of the major constraints
confronting the development of roads is the availability of funds. Despite increased funding for
roads by three spheres of government, resources allocated to roads infrastructure remain
inadequate to eliminate the huge backlogs in maintenance and construction of roads. These
constraints adversely affect economic growth and development.
The deterioration of the road network does not only limits accessibility, mobility and regional
connectivity of the country, but it also results in the increased production and transportation
costs (Lombard & Coetzer, 2007). Rural and urban households spend a large amount of time
on road transport to fulfil their basic needs. They are very often severely hampered by lack of
an adequate road networks. This results in a significant limitation of growth and development
of rural communities that is still experienced today. Poverty is far worse in rural areas than in
urban centres due to lack of adequate accessibility and mobility of road networks. Rural local
roads are often impassable making it difficult for rural families to have access to the means of
economy.
Poverty alleviation through the Expanded Public Works Programme introduced by the
Department of Public Works, Road and Transport intended to provide rural communities with
seasonal work such as pothole patching, road markings, fencing and bush cutting. It was also
realised that this would help in terms of poverty alleviation and enhances economic growth,

7
However, inadequate technical skills such as those of civil and structural engineers in South
Africa have a significant effect to the current status of the road network.
1.4 RESEARCH AIM AND OBJECTIVES
The aim of the study is to assess the relationship between road infrastructure investment and
economic growth as well as ICT investment and labour input focussing in South Africa as a
case study. The discussion brings a clearer picture on what should be done for road
infrastructure improvements in order to stimulate economic growth. The deployment of enough
resources to road infrastructure network is crucial as it is a prerequisite for the provision of
accessibility and mobility for both freight and passenger road transport. The results of the study
may be used by the public sector, private sector and communities to enhance economy growth
and alleviate poverty.
The objectives of the study are:
To investigate the strength and direction of the relationship between road
infrastructure investment and economic growth.
To investigate the growth impact of road infrastructure investment on
economic growth.
To investigate the impact of road infrastructure investment and economic
growth with increasing returns to scale.
To investigate the impact of road infrastructure investment and economic
growth with constant returns to scale.
To examine the contribution of road infrastructure investment in realizing the
full potential of the economy.
To investigate the long run relationship of road infrastructure investment and
economic growth.
To investigate the short run relationship of road infrastructure investment and
economic growth.
To investigate the response of road infrastructure investment to shocks in the
system.

8
1.5 HYPOTHESES OF THE STUDY
This study is intended to survey the relationship between infrastructure frameworks and
monetary development, and to evaluate the effect of very much kept up streets to financial
development in South Africa.
The invalid speculation of the study is based on that:
H0: There is no noteworthy relationship between infrastructure framework and monetary
development in South Africa.
The option speculation of the study is:
Ha: There is a relationship between infrastructure framework and financial development in
South Africa.
1.6 IMPORTANCE OR BENEFIT OF THE STUDY
The significant part of network base in financial development has been all around
acknowledged, such that the provincial rural linkages and the force impacts of urban centres
focuses have for some time been perceived to be basically dependant on street development.
Street infrastructure is extremely thorough and brings components, for example, data
correspondence innovations and technological work information (Chaudhary 2012). Cross
nation examinations of the levels of traveller and cargo with per capita pay have shown that
the level of portability in a nation generally mirrored the level of a nation's riches. The interest
for portability in South African streets by vehicles is expanding for both business and joy.
Base improvement, for example, the redesigning, restoration and repairs of streets base helps
the groups to drive to work and go to occupations where wages are generally higher at the
decreased expenses. It helps little and peripheral agriculturists and in addition financially
dynamic individuals to move far from their towns where manual work is looked downward on,
to places where job and costs are high.
9
Linkages push the wealthier segment to occupy their venture from constrained credit business
sector to non-rural exercises in provincial ranges and towns. This likewise helps in giving extra
vocation to rustic work. The lessening of showcasing edges has expansive results for the near
point of preference enchanted by nation and for its focused quality of strength for the overall
economy (Ahmed & Hossain, 1990).
The street base is for the most part used to transport cargo including the greatest size vehicles
in the mining zones around the nation. The transportation of valuable assets additionally creates
additional substantial transport development to upgrade monetary development.
The overview done by Freight Transport databank demonstrates that more than 500 millions
huge amounts of cargo are proceeding onward the street base yearly (Freight Transport
Databank, 2004).
The presentation of the manual work concentrated system for the street network infrastructure
called the Expanded Public Works Program (EPWP) is significant to the changes of country
streets. It also aims at decreasing unemployment and neediness rate among the young females
and impaired persons. The handiness of street network base speculation is valuable to upgrade
financial development and draw in equipped gifted workforce.
1.7 LIMITATIONS AND CONSTRAINTS OF THE STUDY
The impact of the roads infrastructure investment cannot be easily quantified in the economy.
However, only the freight and passengers from the production site that are transported can be
accounted and the impact can be easily measured in terms of real Gross Domestic Product.
Although the movement as a result of traffic flow and the investment on road infrastructure can
be accounted for, it is not as significant as actual goods and services.

10
1.8 RESEARCH METHODOLOGY
The study covers the road infrastructure investment issues such as the construction and
maintenance of roads, both paved and unpaved, from 1960 to 2013. Data was obtained from
the South African Reserve Bank. Employment creation through Expanded Public Works
Programme and Emerging Contractors Development, focus was on the youth, females and
disabled persons, with the intention to alleviate poverty. Other data was sought from the
Department of Public Works and Transport. For the infrastructure budget allocation for the
medium term expenditure framework (MTEF) 2009/10, 2010/11 and 2011/12 financial years,
the data was obtained from the Estimates of Provincial Revenue and Expenditure (EPRE).
Technical personnel employed by the Department and the vacancy rate experienced in the Road
Infrastructure programme, information was obtained from the Departmental Human Resource
Management, for the MTEF period. In this study, ADF [Augmented Dickey Fuller] unit-root
tests, co-integration tests, Granger causality analysis, and the error correction model will be
used. The methodology is appropriate because it examines road infrastructure conditions to
enhance economic growth. Computer programme (EViews) was utilised for statistical data
analysis.
1.9 DEPLOYMENT AND PLAN OF THE STUDY
Chapter 1 presents the background of the study and problem statement. This chapter explains
the aim and objective of the study, hypothesis of the study, importance of the study, limitation
of the study, and research methodology.
Chapter 2 is the literature review. This chapter provides both theoretical and practical
frameworks in relation to the study. It includes all conceptual and operational definitions of all
the key concepts that are relevant to the study. It also includes a critical evaluation of all
previous research involving the concepts of current literature. This study uses secondary data
or existing literature as part of methodology techniques.
Chapter 3 discusses the research design and analysis. This is done by using econometric and
statistical tools to compute the data of independent and dependent variable.

11
Chapter 4 presents the research methodology which includes research design and the data
collection. Under this chapter, Augmented Dickey-Fuller unit root test is employed to examine
the causal relationship between road infrastructure investment, ICT investment and labour
input.
Chapter 5 is the conclusion and recommendation of the study.
1.10 DEFINITION OF TERMS
Relationship: This is a causation between an event (the cause) and the second event (the effect)
where the second event is understood as a consequence of the first event, though the cause and
effects are typically related to changes and events.
Road: A road is a thoroughfare, route, or way on land between two places, which has been
paved or otherwise improved to allow travel by some conveyance, including different mode of
transport. Roads consist of one, or sometimes two, roadways each with one or more lanes and
also any associated sidewalks and road verges. Roads that are available for use by the public
may be referred to as public roads or highways.
Infrastructure: Infrastructure is basic physical and organizational structures needed for the
operation of a society or enterprise, and or the services and facilities necessary for an economy
to function. It can be generally defined as the set of interconnected structural elements that
provide framework supporting an entire structure of economic development.
Investment: Investment is a capital formation acquisition or creation of resources to be used
in production. It is also undertaken by government, non-profit institutions, households and it
includes the acquisition of human and intangible capital as well as physical capital (Coen &
Eisher, 1992). According to the United Nations (UN, 2005), investment can be explained as
access to basic physical infrastructure such as electricity, telephones, water and roads, access
to information and advisory services, higher labour productivity.

12
Economy: Economy consists of the economic system of a certain country or region, which
comprises the production, distribution or trade, and consumption of goods and services in that
country or area.
Paved: Pave is the durable surface material laid down on an area intended to sustain vehicular
or foot traffic, such as a road or walkway. Such surfaces are frequently marked to guide traffic.
Unpaved: A road other than paved.
South Africa: Republic of South Africa which has nine provinces.

13
CHAPTER 2
LITERATURE REVIEW
2.1 INTRODUCTION
This chapter firstly discusses the theoretical and conceptual background of the relationship
between road infrastructure investment and economic growth. Road infrastructure plays a
strategic and indirect role in the economic development process of a country. It does not
directly increase output, but it makes a significant contribution towards growth by increasing
the factor productivities such as land and capital in the production process. The profitable
economic activities require efficient and functioning systems of transport infrastructural
systems.
Road infrastructure in South Africa is a specific area of concern as the development of such
infrastructure in the country has been neglected to a large extent in some provinces, thereby
imposing significant limitations on growth and development in rural communities. An
increased interest in road investment potential has developed recently mainly due to the
economic development as well as the positive impact that the road investment could generate
on rural communities, should they have an adequate support roads infrastructure network that
is sustained over the long term. It is however a huge task to establish the impact of road
investment on economic growth, particularly when the benefit received through this
infrastructure is extremely difficult to be quantified (Lombaard & Coetzer, 2007).
In general, for the infrastructure to be efficiently and cost effectively managed, there should be
proper and effective systems in place. The budget allocation of construction and maintenance
is with very exceptions simply not sufficient, especially where the allocation had to deal with
the backlog as a result of neglect (State of South Africa's Economic Infrastructure, 2012). All
too frequently the inadequacy of the allocation is compounded by poor management which
results to this meagre budget allocation going unspent.

14
The construction and maintenance of road infrastructure generate more jobs per rand spent than
most other sector of the economy. This investment appears to satisfy national development
needs as well as driving the priority of our developing country, the creation of much needed
jobs (Department of Transport, 2011). This provision has too often been made in a flawed,
through an isolated focus on capital expenditure than through life cycle costing model.
Innovation and creative procurement is a specialised process essential to sustain infrastructure
especially in the province beset with skills and financial constraints ( SAICE Infrastructure
Report Card, 2011).
Road infrastructure is at the heart of the society. Individual mobility is essential for most
working and leisure activities. Modern mobility is an expression of lifestyle and social form
and is essential for the economy. Road infrastructure is synonymous with the essential to
develop and has a significant impact in term of poverty alleviation as they provide the poor
with the better physical access to employment (Papi & Attane, 2001).
The Expanded Public Works Programme (EPWP) is one of the arrays of government strategies
aimed and addressing unemployment and infrastructure improvements through labour
intensive methods. It was first introduced in April 2004 with a goal of creating 1 million jobs
(EPWP Infrastructure Sector, 2009). Although the impact of EPWP in terms of sustainable
employment cannot be quantified, temporary jobs were created for a period not exceeding two
years. Youth, women and disabled persons were part of the beneficiaries, they were also skilled
in the different field including road infrastructure construction field.
South Africa skilled labour by proportion of population has up to twenty times fewer engineers
than Australia, America, Western Europe and even India and China. Furthermore, the racial
and gender balances are still overwhelmed by whites and males who are ageing. Increasing the
number of engineers is a recognised government priority, which will need a multifaceted
approach starting with mathematics and physical science at lower school (SAICE Infrastructure
Report Card, 2011). Training and mentorship of artisan and young engineering professionals
is also essential at all levels including public sector. Although indications are that the
remunerations at the public sector have improved noticeable through occupational specific
dispensation process, this has not addressed the skills constraints in civil, structural and

15
electrical engineering. The problem is further exacerbated by the deployment of unskilled,
unqualified and in-experienced personnel in positions that require technical abilities (SAICE
Infrastructure Report Card, 2011).
The above discussion theory applies to road infrastructure investment and the impact it creates
to economy. Road infrastructure investment and labour inputs are often mentioned as a key to
promoting growth and development. The aim of the chapter is to review the available literature
and highlight the findings from different studies, especially past and current data. It further
reviews the impact of infrastructure investment or budget, the employment created on road
infrastructure to alleviate poverty as well as communication technology enhancing economic
growth.
2.2 THE IMPORTANCE OF ROAD INFRASTRUCTURE INVESTMENT:
THEORETICAL DISCUSSIONS
2.2.1 Theoretical role of Road Infrastructure Investment
Roads infrastructure is a long term investment which may take several years to be completed
and is regarded as a multi-years project. As a result, the instant and longer-term implications
of road infrastructure improvements may differ significantly. Time may be required for markets
to develop around new roads, and the benefits to in terms of employment and usage may not
appear until several years after the project has been fully completed, as such some studies find
that the causality direction is from GDP to infrastructure rather than the other way around
(Gramlich, 1994; Munell, 1992).
Initial spikes in investment and consumption opportunities may occur in areas with better
access to market and other public facilities, but may fall back over time as increased migration
and labour supply catch up with demand (Almirall, Bergada &Ros, 2008). Price fluctuations
and changes in transport costs that emerge in the short run may also revert after a few years.
Many studies, however, have examined how impacts of these types of public infrastructure

16
programs evolve over several years, this debate has cause major controversies as such many
studies have found very high returns to investment including the one by (Auscher, 1989).
The significance of interest in the framework to the financial progression of a country cannot
be over clarified. Lacking or poor base breaking points open an entrance to possibilities, and
additionally better life opportunities and administrations, for example, clean water, training,
wellbeing, solid transport and correspondence. The ILO report (2010) indicates that in spite of
the fact that framework advancement is not distinguished as an immediate Millennium
Development Goal (MDG) target or pointer, without it large portions of the objectives won't
be met and that maintainable foundation is not just a fundamental part in enhancing the
occupations of poor people, it additionally gives chances to making employments amid
development, operation and upkeep.
Framework advancement is an essential for neediness easing and business creation in immature
nations. Be that as it may, vigorous and quick modernization of transport foundation and others
are keys for supportable improvement and a propelled economy. Nations with all around
created framework guarantees better living conditions for the general resident and the
progression of intensity private organizations (ILO, 2010).
Euractiv (2010) contended that without the making of good fundamental foundation, for
example, information transfers, postal administrations, transport framework and waste transfer,
the vision of the current Europe with great living conditions in all areas will just remain a
fantasy. Numerous analysts view framework speculation as the embodiment of monetary
development and improvement. Aschauer (1989) began the examination on the effect of the
foundation venture and efficiency development in the United States. He advances that generally
slower development in the open foundation capital that was expereinced in the United States
amid the 1970s and 1980s was to a great extent because of private area profitability log jam.
One of his discoveries is that the private yield flexibility concerning open framework capital
was around 0.42 for every penny, thus demonstrating a level of affectability. In connection to
Africa, the framework improvement all around has been disregarded for quite a while. This is
related to moderate financial development which results to high work, neediness and in the
long run common wars.

17
Aschauer (1989), Lynde and Richmond (1993) likewise concentrated on the foundations for
the decrease in the US yield and profitability development since the mid-1970s. They found
that the administrations of people and in general capital are a huge part of the creation process
and that around 40 for every penny of the efficiency decrease in the United States was clarified
by the fall in broad daylight capital-work proportion. Moreover, Ford and Poret (1991)
recommend that cross-country contrasts in monetary development may likewise be clarified
halfway by contrasts in levels of framework capital consumption.
Aschauer (1993) contends that the general population base, for example, streets and parkways,
information transfers, water and sewer frameworks ought to be considered as an element of
creation alongside work inputs. With a specific end goal to build efficiency development,
nations must help the rate of capital aggregation on the substantial capital, for example, base,
plant and hardware, or elusive capital, for example, abnormal state of talented staff.
2.2.2 Neo Classical growth model
Economic theory proposed by Adam Smith1 identifies channels through which infrastructure
can positively impact on economic growth using neo classical growth theory, which sometimes
called a Solow growth model. This is an expansion of Harrod - Domar growth (1946). Neo
classical model assumes infrastructure capital as subjected to diminishing returns to scale in
the long run economic growth.
According to Kim (2012), many countries have common elements to grow and develop their
infrastructure economy, which they have stable governments that pursue prudent economic
policies, provide essential infrastructure and services and take a long-term economic
perspective. They use the opportunities provided by global markets and have a dynamic and
competitive private sector economy. Neo classical growth model stated in this chapter
influenced infrastructure accumulation by saving and depreciation rates in the short run
economic growth. However, in the long run it is determined by the population growth.
1 A Scottish moral philosopher pioneer political economy : According to Smith, output is correlated with
labour, capital and land inputs. He argue further that, growth (gY) was determined by population growth (gL), investment (gK) and land growth (gT) and results in a overall productivity (gF). He depicted the production function : Y = ƒ (L,K,T )

18
The notion that long run growth in the model is also influenced by the technological progress
and labour force growth due to population changes, shocks in infrastructure investments can
only have temporary effects on income. According to Sahoo et al. (2010), infrastructure
influence output in the long run. Endogenous growth theory allows increasing or decreasing
returns to scale raising a steady income per capita.
Solow model2 believes that a sustained rise in Infrastructure investment increases the growth
rate only temporarily because the ratio of capital to labour inputs goes up. However, the
marginal products of additional units of infrastructure capital may decline in the long-term
economic growth with real GDP growing at the same rate as the growth of the workforce plus
a factor to reflect improving productivity.
Neo-classical economists believe that the increase in economic growth requires an increase in
the labour input supply and increased level of labour input and infrastructure.
2.2.3 Road infrastructure financing in South Africa
Economic theory as put forward by the 20th century revolutionary economist John Maynard
Keynes3 advocated strong support for government spending to create jobs and allow utilization
of infrastructure capital at a time of economic downturn when the employment of capital and
labour is high. Keynes also believes that there is a need for government intervention on public
infrastructure to activate and regulate the economy.
Foundation financing is one of the fundamental preconditions for empowering creating nations
to quicken or maintain the pace of their development and accomplish the Millennium
Development Goals (MDGs) set by the United Nations in 2000. Besides, the future venture
needs of creating nations in base far surpasses the sum being spent by the administrations, the
private division and different partners, bringing about an imperative financing crevice.
South Africa's monetary foundation venture has expanded somewhat to GDP in 2008 and 2009.
2 An American economist . His works shows capital accumulation and output for an economy over time. 3 John Maynard Keynes famous 20th century British economics, develop the idea of total output and
income are determined by spending.

19
Hypothetical and experimental writing proposes the presence of causal connections between
street foundation speculation, destitution diminishment, livelihood creation and supportable
development and monetary advancement. Work on serious foundation and formative projects,
especially in country ranges regularly prompt short and medium term occupation opportunities
by diminishing rustic destitution (UNCTAD, 2008).
The International Labour Organization (2010) states that around the globe more than 1 billion
individuals need access to streets foundation with about 1 billion without access to an all-
climate street, while 884 million don't have safe drinking water, 1.6 billion have no dependable
wellsprings of vitality, 2.4 billion need sanitation offices and 4 billion are without current
correspondence administrations. In many examples nations with poor framework advancement
are unrealistic to develop the economy and individuals are subjective to neediness and
hardship.
Contemplates have demonstrated that making more prominent utilization of nearby work inputs
and assets is typically 20 for each penny less exorbitant and recovery as much as 50 for each
penny of remote cash necessities, notwithstanding making three to five times more
employments with a multiplier impact of backhanded advantages of 1.6 to 2.0 more
occupations. Be that as it may, few studies researched the causal relationship between these
variables and the bearings of the causality utilizing both Granger-causality test and limits test
approaches.
Among the constrained examination around there, Canning and Pedroni (1999) directed
Granger causality test between interests in three sorts of financial framework that is, kilometers
of cleared street, kilowatts of power creating limit, and number of phones in light of
information from a board of 67 nations for the period 1960-1990. They discovered solid sign
for causality running in both headings between each of the three framework variables and GDP
among a critical number of the nations researched. The examination study put accentuation and
affirms that there is a causal relationship between foundation speculation and monetary
development, including different variables, for example, information transfers and work data.
Fedderke and Bogeti (2006) analyzed the immediate effect of foundation venture on work

20
efficiency and the roundabout effect of framework on aggregate variable profitability utilizing
the board information examination strategy and Pooled Mean Group (PMG) estimator. Pesaran,
Shin and Smith (1999) utilized unlimited blunder amendment ARDL 8 model. They contend
that financial development and efficiency effects of framework have been portrayed by
questionable results with little life. They propose various clarifications for the conflicting
discoveries including conceivable swarming out of private by open division speculation, non-
linearity creating the likelihood of foundation overprovision, concurrence between framework
procurement and development, and the likelihood of numerous channels of impact in the
middle of base and profitability upgrades.
The diagnostic effect of base venture on Spanish monetary development somewhere around
1850 and 1935, utilizing new foundation information and vector autoregression (VAR)
strategies exhibits the positive development effect of neighborhood framework speculation,
however comes back to interest in substantial across the nation systems were irrelevantly
distinctive to zero as per Herranz-Loncan (2007). This likewise gives two adjusting
clarifications to the last results. On the same breath, open base intercession and the use of non-
proficiency venture criteria were exceptionally serious in vast foundation development while
then again, comes back to new base speculation systems may have diminished significantly
once the fundamental connections were built.
Moreover, measurable affirmation for the contextual analysis of the United States
demonstrated that there is an immediate positive connection between framework venture and
GDP for the period 1950-79 during in which development out in the open foundation
contributed the proportion of around one is to one to financial development. Amid the specified
period, base interest in key zones, for example, street transportation, correspondence, water
administration and power era developed at a normal rate of 4 for every penny, while the general
monetary or GDP development found the middle value of 4.1 for every penny amid the same
period (Heintz et al., 2009). For street base speculation to impact on monetary development, it
requires other variable components keeping in mind the end goal to affect absolutely.
Notwithstanding the yield and profitability impacts and framework speculation is accepted as
being able to make a larger number of employments than different sorts of venture through

21
immediate, roundabout and prompted occupations. Be that as it may, the extent of circuitous
and instigated impacts relies on upon the size of the foundation venture multiplier.
A comparative study was led in South Africa by Perkins, Fedderke and Luiz(2005). Utilizing
Pesaran, Shin and Smith's, 1996, 2001, these creators perceived bearings of relationship
between monetary foundation and financial development. They recognized long-run
compelling connections from open division monetary framework venture and altered capital
stock to total national output, from streets to GDP and from GDP to a scope of different sorts
of base. They additionally found that there is an easy going relationship between monetary
framework and financial development and the relationship keeps running in both bearings,
which infers positive connections.
The present study varies from the past ones in three regards:
To begin with, the Fedderke and Bogeti (2006) and Perkins et al.'s (2005) examination utilized
the information from pre-2005 period, of which their time arrangement did not consolidate the
expanded monetary foundation speculation time of 2005-2009. In these cases, the present study
overhauls results.
Secondly, their study excluded the causal relationships between economic infrastructure
investment and public and private sector employment. Given the impacts of infrastructure
investment on private sector employment, the investigation of the existence and the direction
of causality among these variables is of importance. The present study makes an exclusive
contribution by investigating these causal relationships. Moreover, the main objective of the
study was to measure the elasticity of the various infrastructure investments with respect to
labour productivity and total factor productivity, instead of economic growth only and as such
our approaches are different (Fedderke & Bogeti, 2006).
Thirdly, the current study extends the pair wise Granger causality tests to the analysis of the
short-and long-run causality between gross domestic product and economic infrastructure
investment in an ARDL or bounds test framework from which the long term elasticity of
economic infrastructure investment was projected. The projected outcomes elasticity are found

22
to be much smaller than those obtained by previous empirical studies that used data of before
2005.
2.2.4 Experience of road infrastructure funding across the world
2.2.4.1 Transport infrastructure investment in China: Case study
Before the change time of China, street ventures were subsidized prevalently by household
sources in China. These sources included government appointments, benefits from state
possessed ventures, and neighbourhood government demands. The focal government was in
charge of the improvement of national streets, while the common and nearby governments were
for the commonplace and neighbourhood street systems (Démurger 2001). Under the halfway
arranged framework, commonplace and neighbourhood governments typically got stores for
foundation development from the focal government.
Taking after the financial changes, the wellsprings of assets for streets have progressively
extended and now incorporate assets from focal and nearby governments, as well as advances
from universal associations and banks, and additionally outside capital. Another vital
modification has been the issuance of long haul open bonds to back foundation ventures.
Somewhere around 1998 and 2002, the government provided more than 660 billion yuan in
bonds. These bonds were issued to state-claimed banks, for example, the Industrial and
Commercial Bank of China and the Agricultural Bank of China, and were doled out to extends
went for:
I. Infrastructure interest in horticulture, woods, water conservancy, and the earth.
II. Construction of expressways, railroads, landing strips, ports, and telecom ventures.
III. Environmental security.
IV. Upgrading rustic and urban electric and correspondence systems.

23
As nearby governments were given more self-rule in the post-change period, they got to be in
charge of the majority of the base activities financed by bonds. Nearby governments applying
for express way development undertakings are presently required to raise 35 percent of the cost
themselves from their own income which incorporates tolls this was through offers of
securities. The remaining 65 percent of the expense is financed through bank advances.
Previously, banks were hesitant to give advances to street ventures (Démurger, 2001).
Financing in streets, particularly in thruways and turnpikes, has ended up being useful as of
late, notwithstanding, banks are currently more anxious to store street ventures; be that as it
may, in the eastern area and in western district the bank are as yet opposing subsidizing street
ventures. The more noteworthy self-rule given to neighbourhood governments additionally
added to extending provincial disparity as the ability to raise assets to fund framework ventures
relied on upon nearby government income (which thus relied on upon the level of nearby
monetary movement) and the capacity of nearby governments to arrange higher commitments
from the focal government (Démurger, 1999). The developing uniqueness in street
procurement crosswise over areas drove the focal government to dispatch significant street
development improvements in the focal and western districts. Thus, the offer of expressway
interest in eastern China declined from 54.8 percent in 1998 to 45.2 percent in 2001, though
the relating offers in focal and western China expanded from 45.1 percent to 54.9 percent.
2.2.5 Road Infrastructure and Economic Growth
In the study directed by Kweka and Morrissey (1990), it was discovered that the administration
spending and financial development in Tanzania was set up in a way that open speculation on
physical framework and human capital contributed monstrously to monetary development
through venture. The related investigations of Al Yousify (2000) and Abdullah (2000) which
is autonomous of each other, uncovered that Saudi Arabia government use contributes
emphatically to monetary development. The same positive relationship upheld by Ranjan and
Sharma, (2008) on the examination of base effect of India.

24
This position did not get the endorsement of other people who contended that the despite what
might be expected, an expansion in the administration consumption instead of advancing
financial development really backs off the execution of the economy. In this gathering are
Laudau (1986), Barrow (1991), Engen and Skinner (1992) and Folsters and Henrenkson
(2001). This contention is based on the point that endeavor to expand the spending by
government will energize increments in tax collection and obtaining, which thus would
diminish pay, total request and demoralizes diligent work, advancement and inventiveness.
Higher benefit duty will make higher expense of generation which could adversely influence
speculation use and the procuring of the organizations.
Oyinlola (1993) in an experimental examination on the relationship between resistance use and
monetary advancement reasoned that a positive relationship exists. Fajingbesi and Odusola
(1999) experimentally decided the relationship between government consumption and
financial development in Nigeria where the result demonstrated genuine government capital
applying huge positive impact on genuine yield, while the genuine government intermittent use
indicated negligible impact on development.
Utilizing a disaggregated technique on government use whose segment incorporates capital,
repetitive, regulatory, financial, social, and group administrations, Akpan (2005) presumed that
a condition of immaterial relationship between most parts of government consumption and
monetary development. Comparable studies on the impacts of open consumption on base and
financial development over the world showed that by and large positive relationship as in the
investigation of the USA and Japan by Shioji (2001) which demonstrated that base capital has
beneficial outcome on long-run yield in both nations and in the Netherland where Sturm (1998)
had the same result as got in the USA and Japan.
Ghali's (1998) investigation of Tunisia showed a positive relationship between open
speculation and development. In any case, Al-Faris (2002) in his work on Public Expenditure
and Economic Growth reasoned that an unimportant relationship exists between government
utilization consumption and the rate of financial development. Barro and Sala-i-Martin (1995)
considered use as either gainful or ineffective, where beneficial consumption has direct effect
on the rate of financial development, while inefficient use has roundabout or no impact on the

25
development rate of the economy. Israel (1991) in an examination did to investigate the
monetary rate of return of World Bank budgetary undertaking from 1968-1984 indicated
transportation speculation especially on streets to be exceptionally profitable.
Subsequently, an effective street system could decrease the time and cost of development of
merchandise inside of a nation and just as empowers association among the distinctive parts of
the nation which enhances communication. Anyanwu, Adebusuyi, and Kukah (2003) in their
article on upkeep of Highway in Nigeria watched that the development of monetary exercises
in Nigeria relied on upon the level of change on the streets. Aigbokhan (1999) in his study on
base opined that, framework variables have positive relationship with private speculation and
monetary development, and that empowering venture drove development requires palatable
subsidizing on foundation to create new limits and similarly keeping up the current ones.
Streets framework upgrades the circulation of products and administrations through national
and universal markets and great transport associations diminish transport costs, while
empowering mechanical advancement. Familoni, refering to Aigbokhan (1999) in a paper
"Assessing Investment on Basic Infrastructure in Nigeria" gives samples of foundation as open
utilities, for example, power, information transfers, funneled water supply, sanitation and
sewage, strong waste accumulation and transfer and channeled gas and in addition open works
which incorporate streets, significant dams and waterways for watering system and other
transport ventures like urban and entomb urban railroads. To Aigbokhan, open base does three
things: It gives benefits that are a piece of the utilization heap of inhabitants.
Huge scale uses for open works escalates total request and give short-run boost to the economy
and it serves as an information into private area creation, in this way enlarging yield and
efficiency. The conveyance of monetary framework can grow the profitable limit of the
economy by expanding the amount and nature of such base. Upgrades in support would
enhance the nature of existing base offering ascend to financing overflow. Streets and
transportation are exceptionally basic to individual from the general public for not too bad
expectation for everyday comforts.

26
Transport is exceptionally key to monetary development it might be said that an immediate
relationship exists between a nation's financial development and flourishing (Owen, 1964,
Queiros and Gautam, 1992). Be that as it may, numerous creating nations need tasteful
transport offices. An exact examination directed by the World Bank (1992) covering ninety
eight (98) nations utilizing the time arrangement information from 1950 demonstrated a
reliable and noteworthy relationship between financial development as far according to capita
gross national item and street base, per capita as far as length of cleared street system.
2.2.5.1 Economic Development: Case Study of Estonia
There have been a few foundation information corrections to yield measurements in Estonia
amid 2009. These updates were sufficiently critical to oblige rectifications to the prior
comprehension of Estonia's potential financial development rate. The most recent information
vintage from 2009 is utilized to gauge Estonia's potential yield development and yield hole. In
any case, the creation capacity approaches have been utilized to shows that the hole changes
widely. The full scale model reproductions expect the potential development rate to diminish
later on. The abatement in the peripheral profitability inputs makes financial development
moderate to around 4-5 for each penny in the following five years, if there are no extra stuns
to the economy (Katti, 2010).
Estonia's potential development rate has changed after 2009 because of the intermittent updates
of yield framework and development insights. The anticipated imperceptibly potential GDP is
more troublesome because of the restricted time arrangement, covering just the most recent
12–13 years, perceiving just the chose variables. Albeit moderately restricted, this time
arrangement range is rich in stun scenes. From the onset the local yield was intensely affected
by the Asian and Russian emergencies. The opening of new development channels by EU
supported monetary development and later strengthened by the credit blast, which got to be
unfavourable stuns from the worldwide emergency. These procedures structure one full cycle,
inside of which potential GDP must be identified (Katti, 2010).
Utilisng the most recent information vintage accessible in Estonia, Katti (2000) shows that the
creation capacity approach returns 6 for each penny normal potential development for the

27
period 1997–2009, in spite of the fact that there are very sizeable tops, which are produced by
the unfavourable stuns recorded before and by basic changes, for example, shifts in the work
supply as an illustration. These variables have additionally created instability entirely from 8
for every penny in 1999 to above 8 for every penny in 2007. The characteristic model-based
wellsprings of high development have blur away unless an unanticipated mechanical leap
forward creates, potential development will settle on a more steady however altogether lower
way. These discoveries are obviously a contingent on the technique chose.
For this situation of creation, capacities approach figures diminish peripheral profits for
generation inputs and consequently relentlessly abating potential development. This happens
until the economy develops and achieves its strong development and advancement state.
The anticipated potential development rate lies somewhere around 4 and 5 for every penny in
the following five years and somewhere around 3 and 4 for each penny in the years there-after.
These rates are precise if there are no real stuns, negative or positive, which could twist
potential development downwards or upwards. Regardless, the present paper does not intend
to give the most exact expectation of potential yield development yet utilizes numerical model
re-enactments to consider that the wellsprings of fast development have as of now been utilized
something like a substantial degree through the span of monetary advancement, and normal
development later on will stay lower than the authentic normal (Katti, 2010).
The yield of one expanded unit of a generation data, similar to an interest in framework capital
or correspondence innovation is lower than one expanded information, suggesting the financial
development example or pattern additionally backs off. The genuine measured development
rate might withdraw from pattern development relying upon the repetitive developments. New
information demonstrates that the progressing downturn is more extreme than that of 1999.
Model re-enactments, in any case, anticipate a significant fast recuperation from the most
minimal point, at which the yield hole achieves 17 or 10 for each penny relying upon regardless
of whether the capital made in the blast times coordinates the new request structure (Katti,
2010).

28
In the main, case the negative yield crevice is more checked however the economy conforms
back to its past GDP level, yet this does not happen in the second situation when the collected
creation limits can't be completely used to take care of the new demand structure. In this second
case the negative hole is little however at the expense of a fall in the level of potential and real
GDP. It must be affirmed ex post whether the previous or last holds, once there is sufficient
information on the change of the economy (Katti, 2010).
2.2.5.2 Economic Development: Case study of China
Qian (2012) shows that since 1978 China moved to a business sector based economy from
arranged economy, it has been encountering a time of organized and quick advancement. In
any case, because of arrangement reasons, there has been imbalanced development among
areas, which has gradually turned into a difficult issue. One approach to manage this
circumstance is to help inland ranges through suitable foundation improvement, particularly
the vehicle base. A key to this issue lies on the relationship between the vehicle foundation and
monetary improvement.
In China, fast and substantial scale transport base is under development, of which numerous
are parkways, rapid railroads and transport terminals. A customary idea is "Need to be rich,
form street first"; in any case, to what degree the vehicle framework could support the monetary
development may absence of thought. Actually, in spite of the base itself as a stock, how it
ignites the economy other than the travel cost reserve funds is on talk around the world. The
present study joins the dialog on the connection between transport foundation and financial
advancement through some observational examination on China (Qian, 2012).
There has been a basic idea that vehicle base has the impact of improving monetary
development, particularly among the government officials. Be that as it may, as per Vickerman
(2001), the association between transport framework and financial development is not all that
stable. It is hard to acknowledge a solitary causal heading of these two elements, concerning
the high probability of common connection. By and Berechman (2001) mention that it is
broadly concurred that the monetary development happens mostly because of capital, work
development and just incompletely relying upon the framework change. Transport foundation

29
goes about as a key condition for the development to occur. Despite the fact that there is
undoubtedly about the immediate impact that the vehicle framework updating adds to cost
reserve funds of profitable segments, for example, efficient, whether there is overflow impact,
accordingly extra advantage produced from the base is discussable.
The colossal pattern of measured investigation of this issue could go back to the work done by
Aschauer (1989), who evaluated the full scale impact of foundation venture on American
economy. His work was trailed by numerous analysts, for example, Munnell (1990), Ford and
Poret (1991). In these first trials huge appraisal results were determined. This was investigated
by different specialists that the high versatility implies improbable rate of return of foundation
(Gramlich, 1994). Yet some elucidation was made that a first stun in base could bring about
awesome impact, in any case, after the essential base was set up, new venture would not bring
about much impact (Hulten, 1996). Seeing the larger than usual consequences of past work,
Holtz-Eakin (1994) contended that outcomes were extensively adjusted when econometrically
considering state or district level imperceptibly impacts. Suppositions were made that the
imperceptibly impacts are time invariant. Altered impacts and first distinction relapse were
utilized to re-examine the information. Positive approximations found were altogether littler
than those of Aschauer (Romp & Haan, 2005). In any case, there was a contention that the main
distinction will devastate the long haul relationship (Duggal et al., 1999).
Because of the information openness, winning studies on China are chiefly on full scale level.
An earlier study by Sylvie (2001) analyzed China information to find that the framework may
clarify the territorial abberations of monetary improvement. As of late some associated think
about have additionally approached in China. Xu et al. (2007) defined a two-stage connection
between's expressway transport and financial advancement. There are additionally numerous
different studies on this issue (Liu et al.; 2005, Zhang et al., 2007).
2.2.5.3 Economic Growth: Case study in Turkey.
The fleeting and long haul relationship between the transportation–communication capital
arrangement and genuine yield for Turkish economy were researched by An Eruygyr et al.

30
(2012). The examination utilized a Cobb–Douglas generation capacity for the Turkish
economy under the supposition of consistent comes back to scale over the three inputs of
aggregate non-private capital arrangement (K1), transportation–communication capital stock
(K2), and work (L). For effortlessness and because of degrees of flexibility concerns, the
variables were communicated as far as the powerful work all through the investigation.
The study used unit root tests and co-combination investigation by anticipating a VECM. As a
consequence of the vector mistake remedy model (VECM) estimation, one co-incorporating
relationship is seen for the Turkish economy for the period 1963–2006. By co-coordinating
vector projections, it gives the idea that a ceteris paribus 10 for every penny increment in use
in transportation–communication base would have been anticipated to build the yield in Turkey
by around 3 for each penny which is an amazing impact. Then again, from the VECM gauges,
the velocity of the conformity coefficient of the mathematical statement has observed to be -
0.3. It suggests that the Turkish genuine yield encounters sharp increments with expansions in
the aggregate capital and transport (An Eruygyr et al., 2012).
Transportation capital is ordinarily and at all times seen as a part of the aggregate open base
capital and in this manner the effects of transportation capital stock on the level of yield and
efficiency is for the most part watched together with the other open foundation capital. In the
writing, just a little number of connected studies have included transportation capital as a
different class, and just not very many studies have straightforwardly inspected the effects of
transportation capital stock on monetary development (Banister & Berechman, 2003: 145).
The generation capacity methodology is one of the two primary methodologies that have been
utilized in the observational writing to inspect the financial impacts of open capital and/or
transportation capital. The second approach is the vector autoregressive (VAR/VECM)
approach. The creation approach expected from the earlier causal linkage running from inputs
to the yield, be that as it may, the VAR/VECM methodology can be delegated an information
situated philosophy.
Some principle investigations of the creation capacity methodology can be said as Ratner
(1983), Aschauer (1989), Ram and Ramsey (1989) and Holtz-Eakin (1994). Ratner's (1983)

31
original article assesses the impact of open foundation speculation on private yield, utilizing
the US yearly information for the period 1949–1973 and finds that the flexibility of private
yield regarding open capital is 0.06. Another fundamental examination is Aschauer's (1989)
which investigated the relationship between open framework capital and total yield of private
division, utilizing the US information for the period 1949–1985. His estimation result shows
that private yield flexibility for open capital is 0.39. He then infers that a 1% point increment
in general society capital stock would advance total yield by around 0.4% focuses.
The article of Ram and Ramsey (1989), utilizing yearly information for the period 1948–1985,
records that open capital has an imperative constructive outcome on the US private business
yield. Then again, Holtz-Eakin (1994) inspecting the relationship between open division capital
amassing and private part profitability for the US economy for the period 1969–1986 found
that there is no part of open capital on private segment efficiency.
The VAR/VECM methodology is the other procedure that has been utilized in the observational
writing to consider the monetary effects of open capital and/or transportation.
Kamps (2005) emphasize that there are three points of interest of the VAR/VECM approach:
1. It permits breaking down the conceivable criticism impacts from the yield to the inputs, since
it doesn't expect a from the earlier causal linkage just running from the inputs to the yield,
2. It allows breaking down the conceivable aberrant impacts of general society capital; i.e. the
impacts that affect yield by implication through the effects on the private inputs, and
3. It does not as a matter of course concur on that there ought to be at most one co-mix
relationship.
Numerous studies have been directed utilizing this methodology, which incorporate Looney
(1997), Pereira and de Frutos (1999), Everaert and Heylen (2000) and Herranz-Lonca'n (2007).
The article of Looney (1997) examins the part of framework variables, for example, vitality
and transport in Pakistan's monetary development for the period 1973–1995, applying the

32
Granger causality tests and finds that open offices increments absolutely because of the
requirements of the private division. Pereira and de Frutos (1999) look at effects of open capital
on private area variables for the US economy for the period 1956–1989. Their observational
result recommends that a one-dollar extra in broad daylight capital builds private yield in the
long haul by 65 pennies.
The investigation of Everaert and Heylen (2000) researched the impacts of open foundation
capital on multifaceted monetary development in Belgium, utilizing yearly information for the
period 1953–1996. Their outcomes in light of a solitary mathematical statement co-
reconciliation examination point to a solid positive association with causality running from
open framework money to development. Additionally, Herranz-Lonca'n (2007) analysed the
impact of foundation venture on Spanish monetary development for the period 1850–1935. The
study highlighted that while the development effect of the nearby extension foundation venture
is certain, profits to interest in vast nation systems are not extensively not the same as zero.
Alternate studies which find that open base capital expands yield can be classified as takes
after: Ramirez (2000), Ligthart (2002), Albala-Bertrand and Mamatzakis (2001), Ramirez
(2004); Mittnik and Neumann (2001), Pereira (2001), Kawakami and Doi (2004) and Kamps
(2005). Then again, Ghali (1998) explores the effect of open base speculations on Tunisian
monetary development over the period 1963–1993, utilizing a VECM, and infers that people
in general base ventures have contributed adversely to Tunisia's financial development and
improvement. As far as anyone is concerned, among the studies that have utilized the
VAR/VECM approach, this is the main study in which open base speculations negatively affect
development.
There are likewise those studies which inspected transportation and correspondence base
speculation independently. For instance, Easterly and Rebelo (1993), utilizing pooled relapses,
examined that among the other sectoral segments of open speculation, just transportation and
correspondence foundation venture is absolutely connected with development with a high
coefficient somewhere around.
2.2.6 The role of Information communication technology and economic growth

33
There is a growing evidence linking investment in ICT to economic growth, but little
convincing evidence to labour input. Robert Solow triggered the idea of a paradox, saying "
You can see the computer age everywhere but in the productivity statistics". Waver man et al
(2005), Lee et al. (2009) and Qiang ( ) have demonstrated a clear connections between mobiles
and economic growth. Their study on ICT stocks addresses the "endogeneity" problem. There
is growing evidence in many parts of the world demonstrating the positive relationship between
ICT investment and economic growth. ICT sector
2.2.7 Expanded Public Works Programme and Roads infrastructure
Job under the EPWP is represented by the learnerhip Determination for unemployed learners
and the Code of Good Practice for Special Public Works Programs for every single other
member. The Code was gazetted by the Minister of Labour after discourses at National
Economic, Development Labour Council (NEDLAC). It takes into consideration exceptional
states of livelihood to encourage more prominent business on Public Works Programs,
specifically:
1. Employers might set rates of pay locally at self-focusing on rates to abstain from pulling
in specialists far from more perpetual occupation.
2. Reduced commitments for businesses, e.g. no Unemployment Insurance Fund (UIF)
protection instalments.
3. Task-based instalment for work serious works.
This code and the going with Ministerial Determination are accessible on the EPWP site. These
unique states of livelihood apply on condition that labourers on EPWP's have a qualification to
preparing and that specialists are utilized under these extraordinary states of work for a
restricted term of time.

34
The job conditions on EPWP undertakings are from perceived commercial ventures. This is so
as to forestall EPWPs being a vehicle for deregulation of the work market or for advancing
casualization in the work market. The Code of Good Practice additionally sets governmental
policy regarding minorities in society focuses for the livelihood of youth, ladies and individuals
living with inabilities on EPWP ventures. It likewise requires that important group based
associations (CBOs) be counselled with respect to the decision of specialists to be utilized on
activities. The Department set these principles to guarantee that the arrangement of EPWP is
managed legitimately and appropriate consistence and is inside of the structure of work
contract.
Notwithstanding working with unemployed members in the project, the EPWP will likewise
concentrate on preparing open area authorities, private division experts and other invested
individuals in labour-escalated ways to deal with the conveyance of products and
administrations. This, joined with the work attempted by the Business Trust to bolster
development and make a groundswell of backing for the reception of work based
methodologies, plans to make an empowering situation for easing unemployment.
The base arrangement is being driven by the Department of Public Works and incorporates the
Departments of Transport, Housing, Provincial and Local Government, Water Affairs and
Forestry, Public Enterprises, Minerals and Energy and Education. What is more, the
Independent Development Trust has been drawn into the arrangement. The lead at the fore by
the offices was to guarantee that the unemployment is decreased radically, of which it is based
on youth, ladies and debilitate persons.
The arrangement expands on the experience of the Zibambele program in KwaZulu-Natal,
Itirele program in the North West Province and the Gundo Lashu program in Limpopo.
Territorial business is utilized as an appropriate measure of surveying the impacts of transport
framework on neighbourhood monetary development (Bannister & Berechman, 2000). There
will be a solid accentuation on proficiency, cost-viability and nature of items when presenting
work escalated development strategies in common works under the EPWP. The work will be
done utilizing a fitting blend of work and machines. Temporary workers will be permitted to
utilize machines for development exercises where it is not actually or financially plausible to

35
utilize work. All the work will be completed by ordinary industry quality measures. The project
includes ring-fencing a segment of the current contingent framework gifts to territories and
districts. Throughout the following five years, roughly R15 billion or 33% of the aggregate
spending plan will be spent on the work serious development and upkeep ventures, for the most
part low-volume streets, storm water channels, trenching for pipelines and walkways.
Berechman (2000) mentions that transport framework changes are done incrementally, extend
by undertaking after some time. Monetary development is a persistent procedure of yearly
increments in per capita wage and business, of which vocation is utilized as most basic measure
of financial development. The project all things considered has accomplished its targets as far
as abilities advancement through preparing furthermore develops the economy through EPWP.
2.2.8 Infrastructure development and current situation in China: L Y U
During the last half century, the economic development in China has experienced three periods.
As pointed out by Liu (2003), they are highly central planned period, transformation period
and market based period. In the central planned period before the Reform and Opening up
policy had been taken in the late 1970, infrastructure in China experienced slow development
stages, but the industrial investment growth is relatively fast. In the early 1950, China was in
the extreme poverty. After three years of recovery, the first five year plan started from then,
China underwent a large-scale economic construction, of which basic industries and
infrastructure were an important composition.
According to Yu (2011), between 1954 and 1977 the total aggregated basic industries and
infrastructure investment in capital construction was 299.6 billion Yuan with annual growth
rate of 8.7 per cent. At that period the economic growth focus of the government was on the
heavy industry. Coal mining, oil and electricity industries grow fast. Also, due to the influence
of the great leap forward and Cultural Revolution, the fundamental industry grew at the lowest
annual average rate after 30 years of the reform and opening up policy. At the beginning of the
transformation period during 1978-1989, the scale of the investment of the whole society was
very small. Basic industry and infrastructure were still very weak. To change this situation,
China devoted its limited funds to several key industries, such as agriculture, transportation,

36
source of energy, education, health care etc. During that period, the total investment of basic
industries and infrastructure construction was 547.9 billion Yuan, with the average annual
increase 10.7 per cent. As a reform and opening up continued, the material production became
continuously abundant and product supply was prosperous.
The opening up also facilitated the inflow of foreign direct investment (FDI) to the
manufacturing sector. Cheap labour and better infrastructure both nourished the export led
growth strategy. However, unlike the seemingly unlimited supply of cheap labour,
infrastructure failed to grow as fast as the economy, causing the bottleneck problem. After
1990, in order to realize the second step of strategic modernization target the Chinese
government outlined the "People's Republic of China's ten year national economic and social
development planning and eighth five-year programme which proposes future development
goal of agriculture, water conservation, energy, transportation, post and telecommunications,
raw materials and other industries.
During 1990-2002, the total investment in basic industries and infrastructure construction was
8.0249 trillion Yuan, with an annual growth of 26 per cent, much higher than the average
annual rate of 15 per cent during 1979-1989. During that period Treasury funds played an
outstanding role in the basic industry and infrastructure. Since 1998, after the Asian financial
crisis, the Chinese government intended to stimulate the domestic demand by an expansionary
fiscal policy.
About 660 billion Yuan of special Treasury bonds were issued during 1998-2002 for basic
industry and infrastructure investment. These funds were mainly used in agriculture, water
conservation, transportation, communications, urban infrastructure, urban and rural network
reconstruction, the central reserve, grain depot and other infrastructure projects. The capital
investments, joined by private capital, formed the basis of rapid growth of investment in
industry and infrastructure projects. During 1998-2002 total investment in basic industries and
infrastructure construction was 7, 3380 trillion Yuan, with the average annual growth of 13.1
per cent. This investment spurred the growth of investment of the whole society and also led
the country smoothly out of difficult economic times. During the year 2003-2008, the Chinese
government one hand took measures to strengthen government investment in the basic industry

37
and the infrastructure constrauction, on the other hand, encouraged foreign and domestic
private investmentin the basic industries and the infrastructure construction projects. This
bosted China's basic industries and infrastructure and vastly improvedpeople's living
conditionin urban and rural areas. During 2003-2008, total investment in basic industries and
infrastructure was 24.667 trillion Yuanat the average growth rate of 24.5 per cent. Chinese
government has invested 4 trillion Yuan in infrastructure and public services to stimulate
economy and maintain high growth rate.
2.2.9 Role of road infrastructure in poverty alleviation in South Africa
Advancement of the vehicle segment like other framework parts prompts increment in
component efficiency in different segments by expanding openness and diminishing transport
costs. Visser states that as a rule transport advancement concentrates on expanding proficiency
and development, despite the fact that now and again like interfacing rustic connection streets
to tribal or remote territories it might straightforwardly concentrate on destitution
diminishment. It is, be that as it may, remarkable that even development arranged transport
improvement ventures make critical commitment to neediness lessening. Transport
undertakings can be isolated into:
(a) Those concentrating on neediness;
(b) Those concentrating on proficiency and development; and
(c) Proficiency cum-neediness ventures.
It is once in a while hard to quantify the effect of transport on destitution diminishment since
it includes numerous connections inside of the general harmony structure. It is perceived that
maintained financial development prompts lightening of neediness. Transport gives moderate
administrations which encourage association between beneficial exercises. Transport
improvement decreases the expense of collecting inputs, including capital and data, for creation
from various areas, consequently diminishing the expense of generation. Further, it encourages
the dispersion of innovation through expanded rate of spread of skill.

38
The yield costs likewise get lessened, along these lines prompting extra request and
advancement of provincial and universal exchange. It additionally encourages horticulture to
popularize, industry to practice and the economy to appreciate advantages of scale. It likewise
advances broadness of the economy. Accordingly, the critical part of transport advancement in
improving financial development is all things considered perceived. There is a solid
understanding that great transport is a key condition yet not an adequate condition for financial
development way. Then again, monetary development expands interest for transport base.
Interest in the vehicle segment produces salary and creating so as to win open doors for the
poor employments for untalented work in development and support of transport base.
Notwithstanding occupation, interest in country transport results in transport affected lower
costs of purchaser merchandise that convey alleviation to the shopper spending cost (Rust et
al., 2008).
Further, by bringing down costs of rural inputs, it helps poor ranchers to modernize their
generation design. It likewise prompts higher acknowledged cost for agriculturist's yield due
to diminished transportation costs. Besides, expanded availability additionally prompts
expanded prosperity through encouraging higher individual portability and enhancement in
financial exercises that outcome from expanded stream of data and expanded utilization of
transport administrations because of lessening in the expense of administration conveyance to
the provincial poor.
Interest in transport, in any case, might have contrarily effect on the poor groups through the
natural debasement that should be dealt with in transport speculation arranging stage. Toward
the end, it will bring out how the absence of access to transport offices and administrations
builds the endless loop of destitution and low salary in country ranges. Absence of transport
offices result in low farming profitability, high transport costs, low net revenues, higher waste
and loss of merchandise amid transportation and, henceforth, bring down levels of wage and
expanded destitution (Department of Transport, 2011).
2.2.10 Measurement of Economic Growth and Development.

39
Financial development is customarily characterized as the yearly rate of expansion altogether
creation or pay in the economy. Definition is qualified in two vital viewpoints being that:
• Production ought to be measured in genuine terms, suggesting that the impacts of swelling
ought to be killed.
• The figure ought to be conformed to populace development, which suggests that the
expression ought to be per capita premise.
Positive monetary development or improvement really happens just when add up to genuine
generation or pay is developing at a speedier rate than the populace. For all intents and
purposes, monetary development is measured essentially by deciding the yearly development
in genuine creation or salary.
Add up to genuine generation is typically spoken to by genuine Gross Domestic Product
(genuine GDP) or genuine gross national salary (genuine GNI). Gross domestic product
incorporate fares yet reject imports, when genuine GDP is assessed, changes in fares are thusly
considered yet changes in import costs are overlooked. Consider, when the cost of platinum
expands, it influence the GDP deflator and genuine
The relationship between aggregate demand and production output is defined perfectly by John
Maynard Keynes in his Keynesian model. He developed the idea that total output (GDP) and
income are essentially determined by total spending in the economy.
Investment spending, which is called capital formation in the national accounts is volatile in
all the components of aggregate spending, because of that it makes the economy to fluctuate.
The level of investment is regarded as independent to the level of output. It clearly indicates
that there is no systematic positive or inverse relationship between total investment and total
output. If the investment does not respond in a systematic way to the change in output, the
relationship between the investment and output can be approximated by a horizontal line.
Infrastructure investment is inherently a risky affair. The level of infrastructure spending
depend on the willingness to take chances, which in turn depends on the expectations about

40
future economic conditions of which is the economic growth (Economics for South African
Student).
2. 3 CONCLUSION
Street framework is key to financial improvement. As the economy grows, more merchandise
should be transported, more individuals will go to different destinations, more items created.
This can be conceivable if street framework systems are outlined and always kept up to can
deal with substantial volume of merchandise.
By writing study directed in this section, two presumption identified with conceded street base
upkeep that are liable to be made are that:
• The expense of working vehicle in the short run will probably increase.
• While over the long haul the restoration of cleared street each 10-20 years will be more than
three times costly for the legislature.
The position is supported by World Bank (2000) that in the occasion where the street is not
kept up, each rand saved money on street upkeep builds vehicle working expense. The
suggestion is that, by curtailing support, the expense of street framework and the net expense
to the economy is coincidentally expanded. The long haul disregard and support of street
foundation system in South Africa, general has brought about the breakdown of the
incorporated transport framework and further weakening of street system. Street framework
venture is the way to financial development and assumes a key part in the diminishment of
occupation and neediness lighten

41
CHAPTER 3
3. RESEARCH METHODOLOGY AND DESIGN
3.1 INTRODUCTION
This chapter reviews research methodology used to collect and analyse data in the relationship
between road infrastructure investment (LG), information communication technology
investment (LK), labour input (LL) and economic growth (LP) in the context of Cobb-Douglas

42
production function. Analytical frameworks outlining descriptive statistical model for data
processing with reasons were also provided and explained.
3.2 DEFINITIONS
3.2.1 Gross Domestic Product (GDP)
The term Gross Domestic Products is applied in this paper as economic growth and an
dependant variable. The data of real GDP is obtained from the South African Reserve Bank
which is annually from 1960 to 2013.
3.2.2 Road Infrastructure Investments
Road infrastructure investment in this paper is called transport equipment obtained from the
South African Reserve Bank (SARB) as an annual data from 1960 to 2013. The amount of
investment put on road infrastructure.
3.2.3 ICT Investments
Data and correspondence innovation (ICT) ventures allude to both distinctive sorts of
interchanges systems and the advancements utilized as a part of South Africa. The ICT part
consolidates assembling and administrations businesses whose items fundamentally satisfy or
empower the capacity of data handling and correspondence by electronic means. This is a
yearly information from 1960 to 2013.
3.2.4 Labour input
Labour input is the relative merits of employment, which involves hours worked by persons in
order to measure productivity. The data is obtained from the South African Revenue Services
from 1960 to 2013.
3.3 DATA EXPLORATORY ANALYSIS

43
Time series data are used to analyse the above mentioned relationship for the period 1960 -
2013. Descriptive statistics used provide a historical background for the behaviour of the data
included in the study. P -value associated with Jarque - Bera statistics suggest the departures
of all variables except employment (L). Given the kurtosis of the variables, which are all less
than three, the distribution of the variables exhibit non-normality (Stock and Watson, 2006).
3.3 1 Vector Auto regression Model (VAR)
In order to investigate the effect of road infrastructure investment and other macroeconomic
variables to enhance economic growth in South Africa, VAR model as an ideal model was used
in the implementation and forecasting of time series data set and was also used to examine the
dynamic shock in one variable to another variables. It is common that the time series model is
a structural model based on economic theory (Wadarjono, 2007). Sims (1980) built the Vector
Autoregression to solve the problem of the traditional structural simultaneous models and the
single equation models and to minimize the theory approach on the time series model. The
VAR treated set of variables in equality, no differentiation between endogenous and exogenous
variables. All variables are assumed to have interrelationship in the model.
3.4 Cobb-Douglas Production Function
Cobb-Douglas creation capacity is broadly used to analyse the mechanical relationship between
two or more variables, especially physical capital, work and a measure of other data that can
be delivered by those variables. The Cobb-Douglas creation capacity was produced and tried
against factual confirmation by Charles Cobb and Paul Douglas amid 1927-1947 Bao Hong,
Tan (2008).
The dynamic relationship between financial development and street framework venture, ICT
speculations and work info are analyzed as monetary indicator.

44
3.5 Jarque -Bera Tests
J-B test is used to ascertain whether the errors of regression are normally distributed. The
normal distribution has a skewness coefficient of zero and kurtosis coefficient of three. J-B test
is optimal in the sense that the Lagrange Multiplier test (LM) for the null hypothesis of
normality against the maintained hypothesis is generated by Pearson family of distributions.
LM test, has the maximum asymptotic power, which means that the departure of road
infrastructure investment, ICT stock and output from the normal distribution except
employment was suggested with the use of p-values associated with Jaque-Bera test statistics.
Kurtosis variables are all less than three, the distribution of variables exhibit non stationarity
(Stock and Watson, 2006). The positive signs of the skewness for all the variables are indicative
of variables with long tails.
3.6 Augmented Dickey Fuller Unit Root Test
Dickey and Fuller (1979, 1981) formulated a formal system to test for non-stationarity
(Asteriou and Hall, 2011).Their reason testing for non-stationarity is comparable for the testing
of the unit root test. Dickey Fuller test is the test for the unit root test in the time arrangement
test, which is the enlarged rendition of the Dickey Fuller test for the bigger and more muddled
arrangement of time arrangement models. The Augmented Dickey Fuller (ADF) insights,
utilized as a part of the test is the negative number. It is demonstrated that the more negative it
is the more grounded the dismissal of the theory that there is a unit root at some level of
certainty. The method of testing the ADF is the same with respect to the Dickey-Fuller test and
it is perfect on the utilization of the model.
3.7 Econometric and Statistical Software
All variables used were computed by using E-views econometric software. E-views simplify
and provide a clear interpretation of time series data used in this paper. It was used to produces
high quality graphs and tables. It was lastly used to generate forecasting and simulation. The
software is compatible to the variables used in this study.

45
3.8 SUMMARY
All techniques and tools applied in this empirical study were thoroughly motivated. The
relevancy and usefulness in the relationship between road infrastructure investment, ICT
investment, labour inputs and economic growth was perfectly tested. The next chapter analyses
data using tools and techniques specified in this chapter.
CHAPTER 4
STUDY OUTCOME ANALYSIS AND RESULTS
4.1 INTRODUCTION
This section exhibits the experimental examination of the information and additionally the
discourse of the outcomes. The rest of the section is organized as takes after. Area 4.2
behaviours an exploratory investigation of the information while Section 4.3 analyses the
dynamic connections between monetary development and work data (LL), street base venture
(LG), and ICT speculation (LK) in the setting of the Cobb-Douglas creation capacity. In

46
Section 4.4, the vector autoregressive (VAR) logical technique is utilized to fundamentally
analyse the long-run progress among the VAR framework with specific enthusiasm for the
relationship of street foundation speculation with monetary development in South Africa while
Section 4.5 looks at the short-run dynamic connections among the variables in the VAR
framework with specific enthusiasm for the way of causal connections in the VAR framework
and the impacts of stuns on the future condition of the framework.
4.2 EXPLORATORY DATA ANALYSIS
Table 4.1 reports the summary statistics of the data. These descriptive statistics provide a
historical background for the behaviour of the data included in the study. For instance, the p-
values associated with the Jarque-Bera statistics suggest departures of road infrastructure
investment (G), ICT stock (K) and output (P) departing from normality, except for employment
(L). Given that the kurtosis of the variables are all less than three, the distributions of the
variables exhibit non-normality (Stock & Watson, 2006). In addition, the positive signs of the
skewness for all the variables are indicative that the variables have long tails (Stock and
Watson, 2006).
Table 4.1: Descriptive Summary of Actual Data
Statistic G K L P
Mean 14828.61 127722.8 104.9880 671079.6
Maximum 71360.00 708357.0 167.5000 3534327.
Minimum 120.0000 1068.000 42.35000 5411.000
Std. Dev. 19711.88 188736.4 33.70966 960262.6
Skewness 1.443045 1.722429 0.003471 1.574518
Kurtosis 3.873070 4.747526 2.609351 4.377424
Jarque-Bera 20.45647 33.57202 0.343473 26.58088
Probability 0.000036 0.000000 0.842201 0.000002

47
Observations 54 54 54 54
Figure 4.1 displays the time series plots of the variables considered in the current study, all
expressed in the logarithmic form – economic growth or output (LP), proxies by gross domestic
product, employment or labour (LL), ICT stock (LK) and road infrastructure investment (LG).
As observed, the plots suggest the existence of a linear time trend in all four variables at levels
(indifference data). Visual inspection of the plots suggests none of the variables contains
structural breaks. In addition, none of the variables appears to exhibit any seasonal pattern.
Hence, the logarithmic data may be readily used for further analysis.
Figure 4.1: Time Series Plot of Logarithmic Data
LL
3.7
3.8
3.9
4.0
4.1
4.2
4.3
4.4
4.5
4.6
4.7
4.8
4.9
5.0
5.1
5.2
Year
1960 1965 1970 1975 1980 1985 1990 1995 2000 2005 2010 2015
PLOT LL
LG
4
5
6
7
8
9
10
11
12
Year
1960 1965 1970 1975 1980 1985 1990 1995 2000 2005 2010 2015
PLOT LG
LK
6
7
8
9
10
11
12
13
14
Year
1960 1965 1970 1975 1980 1985 1990 1995 2000 2005 2010 2015
PLOT LK
LP
8
9
10
11
12
13
14
15
16
Year
1960 1965 1970 1975 1980 1985 1990 1995 2000 2005 2010 2015
PLOT LP

48
4.3 Stationarity Tests
Determining the order of integration of variables in the VAR system is the first step to
understanding the long-run dynamics in the system itself. Generally speaking, most
macroeconomic time series are non-stationary, therefore, stationarity tests must be conducted
prior to the conduct of cointegration tests. Consequently, this section seeks to investigate the
order of integration of the variables in the VAR system using the Augmented Dickey-Fuller
(ADF) unit root test. Table 4.2 and Table 4.3 reports the results of the ADF tests on the model
including all three types of components – none, intercept, and intercept-trend. The results show
that all four variables are non-stationary at levels (since the p-values of the test statistics
selected by the AIC, SBC and HQC are greater than the 0.05 level) and stationary after taking
first order difference (since the p-values of the test statistics selected by the AIC, SBC and
HQC are less than the 0.05 level). It therefore means that all the variables in VAR system are
integrated of order 1. Having the same order of integration allows the conduct of cointegration
analysis among the variables.
Table 4.2: ADF Unit Root Tests of Log Data at Level
Variabl
e
Exogeno
us
Optim
al Lag
t
Value
Prob
>|t|
5%
Critica
l Value
Information Criteria
Remark
AIC SBC HQC
LP None 1
3.613
3
0.999
0
-
1.947
2
-
3.778
8
-
3.703
8
-
3.750
0
Non-
stationar
y
Intercept 1 -
1.280
1
0.632
0
-
2.918
8
-
3.794
3
-
3.681
7
-
3.751
1

49
Int.+
Trend
1 -
2.404
6
0.373
0
-
3.498
7
-
3.852
4
-
3.702
3
-
3.794
8
LL None 1
2.113
9
0.991
0
-
1.947
2
-
3.421
4
-
3.346
3
-
3.392
6
Non-
stationar
y
Intercept 1 -
2.268
8
0.185
7
-
2.918
8
-
3.499
4
-
3.386
8
-
3.456
3
Int.+
Trend
1 -
2.388
3
0.381
2
-
3.498
7
-
3.506
6
-
3.356
5
-
3.449
0
LK None 0
5.276
8
1.000
0
-
1.947
1
-
0.424
8
-
0.387
6
-
0.410
5
Non-
stationar
y
Intercept 0 -
0.197
3
0.932
1
-
2.917
7
-
0.496
8
-
0.422
5
-
0.468
3
Int.+
Trend
0 -
2.107
2
0.529
9
-
3.497
0
-
0.543
5
-
0.432
0
-
0.500
6
LG None 0
5.927
7
1.000
0
-
1.947
1
-
1.114
5
-
1.077
3
-
1.100
2
Non-
stationar
y
Intercept 0 -
1.261
9
0.640
6
-
2.917
7
-
1.219
0
-
1.144
7
-
1.190
4
Int.+
Trend
0 -
1.413
0
0.845
8
-
3.497
0
-
1.212
4
-
1.100
8
-
1.169
5
AIC, SBC and HQC values in bold and underlined are the least

50
Table 4.3: ADF Unit Root Tests of Log First-Difference Data
Variabl
e
Exogeno
us
Optim
al Lag
t
Value
Prob
>|t|
5%
Critica
l Value
Information Criteria
Remark
AIC SBC HQC
dLP None 0 -
2.888
9
0.004
7
-
1.947
2
-
3.585
3
-
3.547
7
-
3.570
9
Stationar
y
Intercept 0 -
4.993
4
0.000
1
-
2.918
8
-
3.799
8
-
3.724
8
-
3.771
1
Int.+
Trend
0 -
5.054
8
0.000
7
-
3.498
7
-
3.777
1
-
3.664
5
-
3.734
0
dLL
None 0 -
3.894
6
0.000
2
-
1.947
2
-
3.374
2
-
3.336
7
-
3.359
8
Stationar
y
Intercept 0 -
4.674
7
0.000
4
-
2.918
8
-
3.438
8
-
3.363
0
-
3.409
2
Int.+
Trend
0 -
4.875
5
0.001
2
-
3.498
7
-
3.432
8
-
3.320
2
-
3.389
6
dLK None 3 -
1.110
1
0.238
8
-
1.947
7
-
0.364
7
-
0.210
3
-
0.306
2
Stationar
y
Intercept 0 -
6.968
0
0.000
0
-
2.918
8
-
0.598
3
-
0.523
2
-
0.569
5
Int.+
Trend
0 -
6.935
1
0.000
0
-
3.498
7
-
0.565
5
-
0.452
9
-
0.522
4
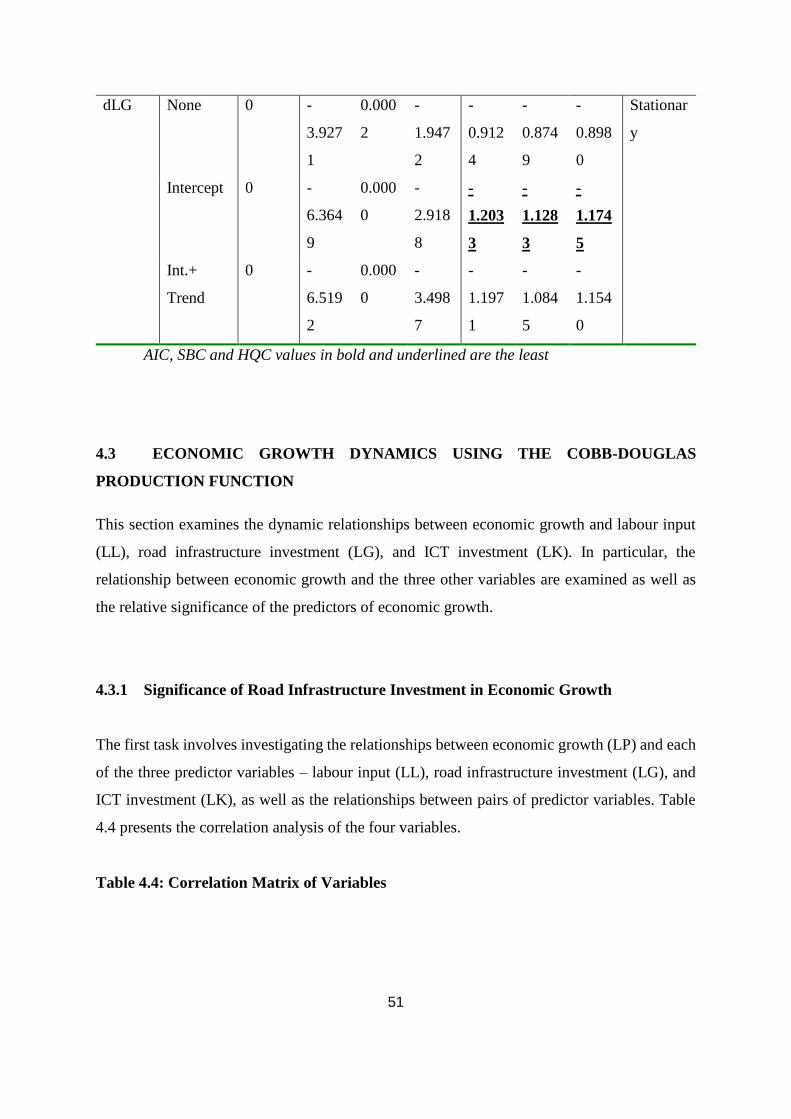
51
dLG
None 0 -
3.927
1
0.000
2
-
1.947
2
-
0.912
4
-
0.874
9
-
0.898
0
Stationar
y
Intercept 0 -
6.364
9
0.000
0
-
2.918
8
-
1.203
3
-
1.128
3
-
1.174
5
Int.+
Trend
0 -
6.519
2
0.000
0
-
3.498
7
-
1.197
1
-
1.084
5
-
1.154
0
AIC, SBC and HQC values in bold and underlined are the least
4.3 ECONOMIC GROWTH DYNAMICS USING THE COBB-DOUGLAS
PRODUCTION FUNCTION
This section examines the dynamic relationships between economic growth and labour input
(LL), road infrastructure investment (LG), and ICT investment (LK). In particular, the
relationship between economic growth and the three other variables are examined as well as
the relative significance of the predictors of economic growth.
4.3.1 Significance of Road Infrastructure Investment in Economic Growth
The first task involves investigating the relationships between economic growth (LP) and each
of the three predictor variables – labour input (LL), road infrastructure investment (LG), and
ICT investment (LK), as well as the relationships between pairs of predictor variables. Table
4.4 presents the correlation analysis of the four variables.
Table 4.4: Correlation Matrix of Variables

52
Pearson Correlation Coefficients, N = 54
Prob > |r| under H0: Rho=0
LP LL LK LG
LP 1.00000
0.94950
<.0001
0.97462
<.0001
0.98225
<.0001
LL 0.94950
<.0001
1.00000
0.89808
<.0001
0.92099
<.0001
LK 0.97462
<.0001
0.89808
<.0001
1.00000
0.99289
<.0001
LG 0.98225
<.0001
0.92099
<.0001
0.99289
<.0001
1.00000
The results show significant relationships between economic growth and each of the three
predictor variables. At the 0.05 level, the results show the existence of strong, positive and
significant correlation between economic growth and each of the three other variables.
According to the magnitudes of the correlation coefficients, road infrastructure investment LG)
is most highly correlated with economic growth followed by ICT investment (LK) and labour
input (LL). In addition, road infrastructure investment (LG), ICT investment (LK) and labour
input (LL) are significantly and positively correlated to each other. The high significant
correlations between economic growth and the three other variables point to the possibility of
multicollinearity in a regression in which road infrastructure investment, ICT investment, and
labour input are simultaneously included predictor variables. Instead, the significantly high
correlations between economic growth and the three other variables can be used to justify that
an increase in infrastructure investment will result in an increase in economic growth. Again,
the positive correlations between economic growth and each of the three other variables
indicate that the four variables are economically interrelated.
Table 4.5 displays the Cobb-Douglas production function estimation results. The results reveal
a significant model which accounts for nearly 98 percent of the total variation in the data (R-
Square = 0.9795). The three predictor variables are all significant the 0.05 or 0.10 level and the
coefficients are all positive as expected. However, the variance inflation factors (VIF) suggest

53
the presence of multicollinearity when road infrastructure investment, ICT investment, and
labour input are simultaneously included in the model as predictor variables, confirming the
earlier assertion. To assess the significance of the three predictor variables on economic
growth, a Principal Component Regression (PCR) analysis was conducted to transform the
predictor variables into non-correlated variables by creating eigenvectors from which the
problem of autocorrelation gets addressed.
Table 4.5: Estimated Cobb-Douglas Production Function

54
Dependent Variable: LP
Analysis of Variance
Source DF Sum of
Squares
Mean
Square
F Value Pr > F
Model 3 20.72809 6.90936 796.03 <.0001
Error 50 0.43399 0.00868
Corrected Total 53 21.16207
Root MSE 0.09317 R-Square 0.9795
Dependent Mean 9.24709 Adj R-Sq 0.9783
Coeff Var 1.00751 Durbin-Watson D 0.2098
Parameter Estimates
Variable DF Parameter
Estimate
Standard
Error
t Value Pr > |t| Variance
Inflation
Intercept 1 5.18025 0.30528 16.97 <.0001 0
LL 1 0.57608 0.09640 5.98 <.0001 7.52562
LK 1 0.08044 0.04325 1.86 0.0688 80.60826
LG 1 0.10805 0.06511 1.66 0.1032 102.74458
The results from the principal component regression of economic growth on the three predictor
variables are summarized in Table 4.6. From the PCR results, the principal component
regression factor accounts for nearly 96% (model effects: 95.8409) and 98% (dependent
variables: 97.9492) of the predictor and response variations, respectively. The relative
significance of the predictors of economic growth can be examined using the component
loadings. Considering the model effect loadings together, the results show that no predictor
variable appears to have less significance, although road infrastructure investment (LG:
0.585360) has the highest loading, and hence most significant predictor, among the three
predictor variables, of economic growth.
Table 4.6: PC Regression Results for Cobb-Douglas Production Function

55
Factor Extraction Method Principle Components Regression
Number of Response Variables 1
Number of Predictor Parameters 3
Percent Variation Accounted for by Principal Components
No. of Extracted
Factors
Model Effects Dependent Variables
Current Total Current Total
1 95.8409 95.8409 97.9492 97.9492
Model Effect Loadings
No. of Extracted
Factors
LL LK LG
1 0.565665 0.580841 0.585360
Parameter Estimates
LP
Intercept 5.191260904
LL 0.572846663
LK 0.080645824
LG 0.108358439
4.3.2 Dynamics of Economic Growth
This section investigates the dynamics in economic growth with no constraints. As revealed by
the results in Table 4.6, although the estimated model is significant, the existence of residual
autocorrelation, heteroskedasticity, and non-normality render the results not reliable for further
interpretation. From the results in Table 4.6, the Durbin-Watson statistic of 0.2098 is indicative
of residual serial correlation since it is nowhere near the expected value of 2. Accordingly, the
model is re-estimated and the final results summarized in Table 4.7. In the results, one
autoregressive term, AR1, has been included to eliminate residual serial correlation. The model

56
is highly significant with explanatory power of 99.6% (R-Square: 0.9960). The Durbin-Watson
statistics of 1.7183 (approximately 2) suggests no residual serial correlation. The post-model
estimation results reported in Table 4.8 reveal a residual normality (Jarque-Bera: 0.5649,
prob=0.7539 > 0.05) and homoscedastic residuals (p-values of Q and LM statistics at various
orders are greater than 0.05). The results show that economic growth elasticity of infrastructure
investment is 0.1271 (LG coefficient), suggesting that a 1% increase in the stock of
infrastructure investment increases economic growth by nearly 0.13%, which is quite
substantial for the South African economy.
Thus, in the absence of any constraint, the estimated economic growth model is:
0.4474 0.0753 0.1271
t t t tP̂ 285.7736*L K G .
The results show that economic growth elasticity of infrastructure investment is 0.1271 (LG
coefficient), suggesting that a 1% increase in the stock of infrastructure investment will
increase economic growth by nearly 0.13%, which is quite substantial for the South African
economy.
Table 4.7: Re-Estimated Cobb-Douglas Production Function

57
Dependent Variable: LP
Analysis of Variance
Source DF Sum of
Squares
Mean
Square
F Value Pr > F
Model 4 19.55768 4.88942 2964.43 <.0001
Error 48 0.07917 0.00165
Corrected Total 52 19.63685
Maximum Likelihood Estimates
Log Likelihood 96.7625761 Total R-Square 0.9960
Durbin-Watson 1.7183 Observations 54
Parameter Estimates
Variable DF Estimate Standard Error t Value Approx
Pr > |t|
Intercept 1 5.6552 0.5195 10.89 <.0001
LL 1 0.4474 0.1350 3.32 0.0017
LK 1 0.0753 0.0280 2.69 0.0098
LG 1 0.1271 0.0360 3.53 0.0009
AR1 1 -0.9176 0.0701 -13.09 <.0001
Table 4.8: Post-Model Estimation Results Economic Growth Elasticity Model

58
Test of Residual Normality
Statistic Value Prob Label
Jarque-Bera Test 0.5649 0.7539 Pr > ChiSq
Tests for ARCH Disturbances Based on OLS Residuals
Order Q Pr > Q LM Pr > LM
1 1.5847 0.2081 1.4363 0.2307
2 2.2880 0.3185 2.4842 0.2888
3 5.7468 0.1246 4.6155 0.2022
4 6.8236 0.1455 4.7913 0.3094
5 9.5316 0.0896 7.8738 0.1633
6 12.3383 0.0548 8.5771 0.1988
7 13.4043 0.0628 9.0280 0.2507
8 13.7749 0.0878 9.0280 0.3399
9 17.4994 0.0414 9.4596 0.3960
10 19.7253 0.0320 10.2895 0.4155
11 19.9384 0.0462 10.4058 0.4943
12 20.1544 0.0642 11.9068 0.4532
4.3.3 Dynamics of Economic Growth with Increasing Return to Scale Constraint
This section examines the dynamics in economic growth resulting from the constraint of
increasing return to scale of all input variables, with particular interest in road infrastructure
investment. Table 4.9 summarizes the final regression results, accompanied by a summary of
the post-model estimation results in Table 4.10. The model is highly significant with
explanatory power of about 98% (R-Square: 0.9793). The Durbin-Watson statistic of 1.6990
(approximately 2) suggests there is no residual serial correlation issue. The post-model
estimation results shown in Table 4.15 confirm a residual normality (Jarque-Bera: 8.5693,
prob=0.0751 > 0.05) and homoscedastic residuals (p-values of Q and LM statistics at various
orders are greater than 0.05). With the constraint of increasing return to scale constraint, the
estimated economic growth model is:

59
0.8478 0.0631 0.0614
t t t tP̂ 57.0427*L K G .
The results show that economic growth elasticity of infrastructure investment is 0.0614,
implying that a 1% increase in the stock of road infrastructure investment increases economic
growth by about 0.06%, which is quite substantial for the South African economy.
Table 4.9: Regression Results in the Increasing Returns to Scale Model
Dependent Variable: LP – LL
Analysis of Variance
Source DF Sum of
Squares
Mean
Square
F Value Pr > F
Model 3 4.75174 1.58391 573.51 <.0001
Error 49 0.13533 0.00276
Corrected Total 52 4.88707
Maximum Likelihood Estimates
Log Likelihood 88.9256181 Total R-Square 0.9774
Durbin-Watson 1.6900 Observations 54
Parameter Estimates
Variable DF Estimate Standard
Error
t Value Approx
Pr > |t|
Intercept 1 4.0438 0.2565 15.77 <.0001
LK - LL 1 0.0631 0.0317 1.99 0.0518
LG 1 0.0614 0.0366 1.68 0.1001
AR1 1 -0.8982 0.0619 -14.50 <.0001
Table 4.10: Post-Model Estimation Results
Increasing Returns to Scale Model

60
Test of Residual Normality
Statistic Value Prob Label
Jarque-Bera Test 8.5693 0.0751 Pr > ChiSq
Tests for ARCH Disturbances Based on OLS Residuals
Order Q Pr > Q LM Pr > LM
1 0.0371 0.8473 0.0509 0.8214
2 0.4206 0.8104 0.3529 0.8383
3 0.8330 0.8416 0.6196 0.8919
4 1.5360 0.8203 1.0979 0.8946
5 1.5365 0.9088 1.1206 0.9523
6 1.5533 0.9559 1.1256 0.9804
7 2.1432 0.9515 1.4435 0.9842
8 5.3921 0.7150 3.5126 0.8982
9 6.4488 0.6943 5.1612 0.8200
10 7.1616 0.7101 5.5779 0.8494
11 7.4239 0.7638 5.8639 0.8823
12 8.5807 0.7383 6.7078 0.8763
4.3.4 Dynamics of Economic Growth with Constant Return to Scale Constraint
This section investigates the dynamics in economic growth resulting from the constraint of
constant return to scale of all input variables, with particular interest in road infrastructure
investment. A summary of the final regression results is reported in Table 4.11, accompanied
by a summary of the post-model estimation results in Table 4.12. The model is highly
significant with explanatory power of about 98% (R-Square: 0.9793). The Durbin-Watson
statistic of 1.6674 (approximately 2) is an indication of no residual serial correlation. The post-
model estimation results reported in Table 4.12 shows a residual normality (Jarque-Bera:
4.0774, prob=0.1302 > 0.05) and homoscedastic residuals (p-values of Q and LM statistics at
various orders are greater than 0.05). Under the constraint of constant return to scale, the
estimated economic growth model is:

61
0.8478 0.0433 0.1089
t t t tP̂ 65.9238*L K G .
The results show that economic growth elasticity of infrastructure investment is 0.1089,
suggesting that a 1% increase in the stock of road infrastructure investment increases economic
growth by about 0.11%, which is quite substantial for the South African economy.
Table 4.11: Regression Results in the Constant Returns to Scale Model
Dependent Variable: LP – LL
Analysis of Variance
Source DF Sum of
Squares
Mean
Square
F Value Pr > F
Model 3 4.77739 1.59246 711.40 <.0001
Error 49 0.10969 0.00224
Corrected Total 52 4.88707
Maximum Likelihood Estimates
Log Likelihood 91.3994496 Total R-Square 0.9793
Durbin-Watson 1.6674 Observations 54
Parameter Estimates
Variable DF Estimate Standard
Error
t Value Approx
Pr > |t|
Intercept 1 4.1885 0.1145 36.57 <.0001
LK - LL 1 0.0433 0.0283 1.53 0.1326
LG - LL 1 0.1089 0.0391 2.79 0.0075
AR1 1 -0.8963 0.0629 -14.25 <.0001
Table 4.12: Post-Model Estimation Results
Constant Returns to Scale Model

62
Test of Residual Normality
Statistic Value Prob Label
Jarque-Bera Test 4.0774 0.1302 Pr > ChiSq
Tests for ARCH Disturbances Based on OLS Residuals
Order Q Pr > Q LM Pr > LM
1 0.4469 0.5038 0.4886 0.4845
2 0.8489 0.6541 0.8598 0.6506
3 1.6978 0.6374 1.3311 0.7218
4 2.1933 0.7003 1.5081 0.8252
5 2.1933 0.8218 1.5482 0.9074
6 2.3041 0.8897 1.7014 0.9450
7 2.5101 0.9263 1.7970 0.9702
8 4.9392 0.7641 3.8964 0.8663
9 7.0211 0.6349 6.4826 0.6908
10 8.4832 0.5817 6.7981 0.7444
11 8.6279 0.6562 6.8148 0.8139
12 9.7391 0.6388 7.8410 0.7974
4.3.5 Total Factor Productivity
Following a standard application in the literature, the assessment of total factor productivity
(TFP) of the South African economy is assumed to be characterized by the Cobb-Douglas
production function with a constant to scale. In that case, +β+=1, and so the estimated
production function is:
t t t t t t tlnP lnL lnA (lnK lnL ) (lnG lnL ) .
and so t t t t t t tA TFP = exp{(lnP lnL ) (lnK lnL ) (lnG lnL ) ,
Where = 0.0433 and = 0.1089. Figure 4.3 is a time series plot of TFP. Since the use of
inputs is subject to cyclical factors, economic activities tend to fluctuate over the business
cycle. Consequently, TFP estimates pro-cyclical behaviour and has to be adjusted for capacity

63
utilization. In other words, TFP estimates could be biased if capacity utilization is ignored in
productivity assessment. In the literature, adjustment for capacity utilization is done using
capital stock statistics such as inventory data, unemployment statistics, or power utilization
(Jorgenson & Griliches, 1997). The use of these statistics is based on the assumption that, given
the perpetual inventories rule, the capital stock can be regarded as indicator for the overall
capacity of the economy (Dennis et al, 2000). Using the growth accounting framework,
potential output (economic growth) is estimated. First, the total factor productivity (TFP) is
estimated using the constant return to scale relation:
t t t t t t t tTFP lnA (lnP lnL ) 0.0433(lnK lnL ) 0.1089(lnG lnL ) .
Figure 4.2 displays the overlay plot of TFP and potential TFP. As observed from the plot, over
the period 1960-2013, the TFP ranged between 53.9 and 76.8. Interestingly, the TFP
consistently declined over the period 1960-1992, only for it recover after 1993. Again the
consistent fall in the TFP can be attributed to the fact the economy was operating under the
apartheid regime during that period.
Figure 4.2: Plot of Total Factor Productivity
Over the period 1960-2013, the TFP reached its highest ever in 2001. In more recent years, the
TFP estimates show that the TFP was relatively high in 2011. The potential total factor
productivity (TFP) growth data is illustrated in Figure 4.3. It is obvious from Figure 4.3 that
50
55
60
65
70
75
80
Year
1960 1966 1972 1978 1984 1990 1996 2002 2008 2014
PLOT Total Factor Productivity Potential Total Factor Productiv

64
the period 1960-1989, which falls under the apartheid years, dramatically affected the TFP
outcomes of the South African technological development. The worst productivity
performance occurred in 1983. However, as further observed from Figure 4.5, potential TFP
values were positive, indicating progress in technological development since 1990, with the
best productivity performance occurring in 1997, just some few years the first all-inclusive
elections were held in South Africa.
Figure 4.3: Plot of TFP Growth
4.3.6 Output, Potential Output and Output Gap
Using the Hodrick-Prescott filter, the trend component of TFP is extracted as potential
technology input ( POTtlnA ) while the trend components of labour input ( POT
tlnL ), ICT stock (
POTtlnK ), and road infrastructure investment ( POT
tlnG ) are extracted as the potential employment,
potential ICT stock, and potential road infrastructure investment, respectively Then, potential
output, POTtlnP , can be estimated using the relation:
POT POT POT POT POTt t t t tlnP lnA lnL lnK lnG ,
Pote
ntia
l TFP
Gro
wth
-2
-1
0
1
2
3
Year
1960 1966 1972 1978 1984 1990 1996 2002 2008 2014

65
Using the constraint of constant return to scale, 1 , where =0.8473, β=0.0433, and
=0.1089, the above equation becomes:
POT POT POT POT POT POTt t t t t tlnP lnA (lnL lnK ) (1 )K lnG .
or POT POT POT POT POT POTt t t t t tlnP lnA 0.8478(lnL lnK ) 0.8911K 0.1089lnG .
Output and Potential Output
Figure 4.4 presents the overlay plot of output, tlnP , and potential output, POTtlnP . The level of
potential output ( POTtP ) highly correlates with that from previous one ( POT
t 1P ). The correlation
coefficient was found to be 0.9997. The potential output in South Africa has been increasing
over the study period, 1960-2013. Based on the results, the actual output was higher than
potential output in 1960, 1963-1964, 1969, 1973-1975, 1980-1985, 1988-1990, 1995-1996, and
2004-2008.
Figure 4.4: Overlay Plot of Output and Potential Output
Output Gap
Figure 4.5 displays the output gap estimates based on the production function with a constant
return to scale constraint. The output gap measure displays the fact that over the period 1960-
0
4000
8000
12000
16000
20000
24000
28000
32000
Year
1960 1966 1972 1978 1984 1990 1996 2002 2008 2014
PLOT Output Potential Output

66
2013, the South African economy was subject to several shocks. According to the output gap
plot, economic expansion periods were generally interrupted by contractions, mimicking the
excessive boom-bust cycle. In particular, over the 54-year data span, the output gap was
negative for 30 years, suggesting that over the period, even with the contribution of the
investment in road infrastructure, the actual output of South Africa was mostly lower than the
potential output. The years of negative output gap include 1961-1962, 1965-1968, 1970-1972,
1976-1979, 1986-1987, 1991-1994, 1997-2003, and 2009-2013. Output reached its peak in
1974 after which it fell consistently to its lowest level in 1978. In 2007, output was very much
close to the peak level of 1974 but declined steadily thereafter until now. A further observation
of the output gaps in the more recent years shows that the economy of South Africa had been
operating below its potential during 2009-2013. The consistent fall in the growth of potential
output can fairly be explained by the movement in TFP which also slowed during this period.
Figure 4.5: Plot of Output Gap
4.3.7 Potential Growth Accounting
In order to assess the contribution of road infrastructure investment to potential output growth
in particular, and the contributions of all factors in general, the conventional potential growth
Ou
tpu
t G
ap
-6
-4
-2
0
2
4
6
8
10
Year
1960 1966 1972 1978 1984 1990 1996 2002 2008 2014

67
accounting analysis was conducted. A summary of the average potential output growth rates
and primary factor inputs is reported in Table 4.13. According to the results in Table 4.13, TFP
growth was the main source of potential output growth over the study period, 1960-2013,
accounting for about 45.7 percent. Road infrastructure investment contribution to potential
output growth over the study period was 9.5 percent, which is quite substantial. In recent years,
the contribution of road infrastructure investment to potential output growth occurred in the
sub-period 2000-2004.
Table 4.13: Average Factor Contribution to Potential Output Growth
Sub-Period TFPPOT LPOT KPOT GPOT PPOT
1960-1964 3.41 2.62 0.08 0.44 6.56
1965-1969 3.29 2.73 0.10 0.48 6.60
1970-1974 2.89 2.58 0.12 0.48 6.06
1975-1979 2.09 1.96 0.11 0.40 4.55
1980-1984 1.33 1.29 0.08 0.28 2.99
1985-1989 0.80 0.80 0.06 0.19 1.84
1990-1994 0.95 0.94 0.08 0.24 2.21
1995-1999 1.69 1.62 0.15 0.43 3.89
2000-2004 2.48 2.37 0.23 0.65 5.74
2005-2009 2.35 2.32 0.23 0.64 5.55
2010-2013 1.85 1.87 0.19 0.52 4.43
1960-2013 2.08 1.91 0.13 0.43 4.55
4.4 ANALYSIS OF LONG-RUN DYNAMICS
This section employs vector autoregressive (VAR) models to examine the relationships of road
infrastructure investment with economic growth in South Africa. This technique is purposely
used to deal with the theoretical limitations and significant empirical controversies over the
impact of road infrastructure investment on economic growth. In particular, this section
employs the concepts of cointegration with the view to assess the existence or otherwise of any
long-run equilibrium relationship among the variables.

68
4.4.1 VAR Analysis at Levels
The first step for examining the existence or otherwise of a long-run equilibrium between
economic growth in South Africa and road infrastructure investment is to determine the optimal
lag length for the VAR system. Table 4.14 displays the results for six different information
criteria up to 7 lags. All six information criteria suggest an optimal lag length of 1, hence the
VAR(1) system. Table 4.15 displays the VAR(1) estimation model using data at levels. In order
to assess the stability and robustness of the estimated VAR(1) model, various post-model
estimation analyses were conducted and the results reported. Figure 4.6 indicates that the
VAR(1) system at levels for the data satisfies the stability condition since there are no roots
lying outside the unit circle in each model. Based on the VAR residual heteroskedasticity test
result reported in Table 4.16, there is no problem of residual heteroskedasticity since the p-
value of the joint chi-square test is greater than 0.05. At the individual level, similar conclusions
can also be derived from chi-square test results. Hence, the residuals from the estimated
VAR(1) system at levels are homoscedastic.
Table 4.14: Optimal Lag Length Determination of VAR System at Levels

69
VAR Lag Order Selection Criteria
Endogenous Variables: LP LL LK LG
Exogenous Variables: C, t
lags LogL p(LR) AIC BIC HQC
1 243.97288 -9.360548* -8.415792* -9.005030*
2 257.82373 0.03431 -9.269095 -7.694501 -8.676565
3 264.13565 0.70004 -8.856836 -6.652405 -8.027294
4 275.79519 0.10547 -8.672136 -5.837867 -7.605581
5 292.37800 0.00703 -8.696936 -5.232830 -7.393370
6 309.12457 0.00635 -8.728705 -4.634762 -7.188127
7 325.88691 0.00629 -8.761145 -4.037364 -6.983555
LogL : Log Likelihood
p(LR): P-Value of Sequential Modified LR Test Statistic
FPE : Final Prediction Error
AIC : Akaike Information Criterion
BiC : Bayesian Information Criterion
HQC : Hannan-Quinn Information Criterion
Table 4.15: VAR (1) System at Levels
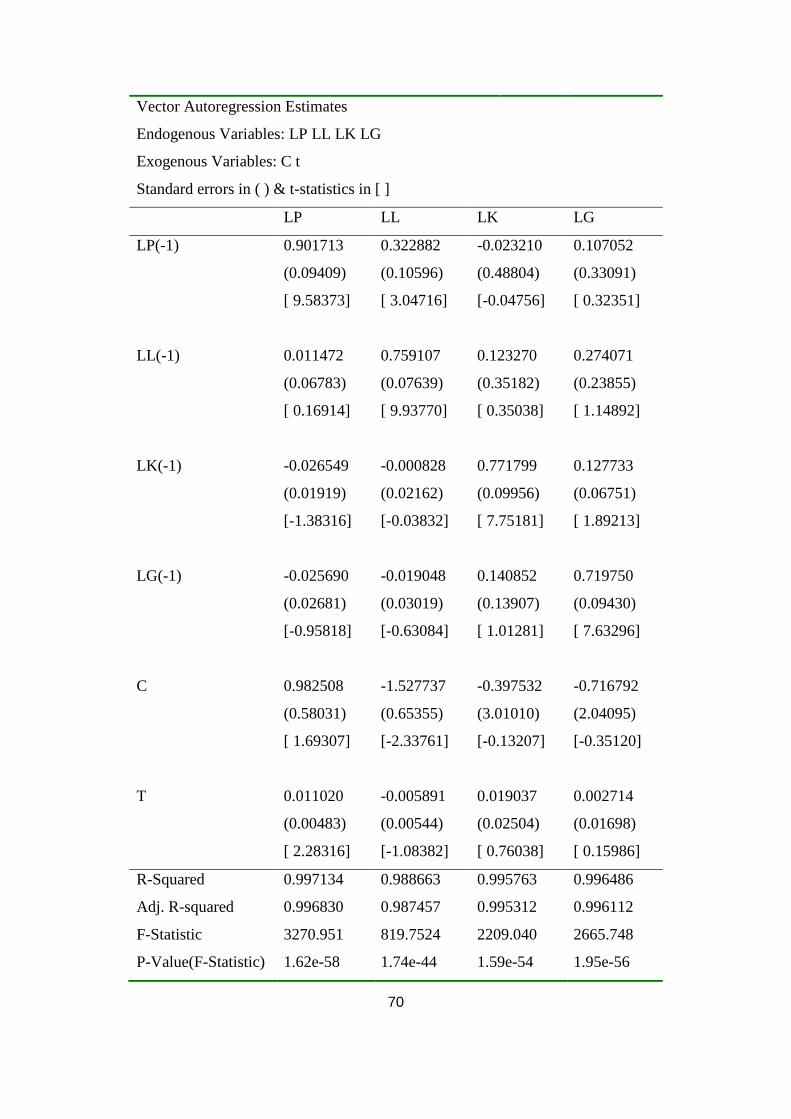
70
Vector Autoregression Estimates
Endogenous Variables: LP LL LK LG
Exogenous Variables: C t
Standard errors in ( ) & t-statistics in [ ]
LP LL LK LG
LP(-1) 0.901713 0.322882 -0.023210 0.107052
(0.09409) (0.10596) (0.48804) (0.33091)
[ 9.58373] [ 3.04716] [-0.04756] [ 0.32351]
LL(-1) 0.011472 0.759107 0.123270 0.274071
(0.06783) (0.07639) (0.35182) (0.23855)
[ 0.16914] [ 9.93770] [ 0.35038] [ 1.14892]
LK(-1) -0.026549 -0.000828 0.771799 0.127733
(0.01919) (0.02162) (0.09956) (0.06751)
[-1.38316] [-0.03832] [ 7.75181] [ 1.89213]
LG(-1) -0.025690 -0.019048 0.140852 0.719750
(0.02681) (0.03019) (0.13907) (0.09430)
[-0.95818] [-0.63084] [ 1.01281] [ 7.63296]
C 0.982508 -1.527737 -0.397532 -0.716792
(0.58031) (0.65355) (3.01010) (2.04095)
[ 1.69307] [-2.33761] [-0.13207] [-0.35120]
T 0.011020 -0.005891 0.019037 0.002714
(0.00483) (0.00544) (0.02504) (0.01698)
[ 2.28316] [-1.08382] [ 0.76038] [ 0.15986]
R-Squared 0.997134 0.988663 0.995763 0.996486
Adj. R-squared 0.996830 0.987457 0.995312 0.996112
F-Statistic 3270.951 819.7524 2209.040 2665.748
P-Value(F-Statistic) 1.62e-58 1.74e-44 1.59e-54 1.95e-56

71
Durbin-Watson 1.436656 1.481335 1.672737 1.592979
-1.5
-1.0
-0.5
0.0
0.5
1.0
1.5
-1.5 -1.0 -0.5 0.0 0.5 1.0 1.5
Inverse Roots of AR Characteristic Polynomial
Figure 4.6: Eigenvalue Stability Condition
Table 4.16: VAR Residual Heteroskedasticity Tests of VAR (1) System at Levels
VAR Residual Heteroscedasticity Tests: No Cross Terms (only levels and
squares)
Endogenous Variables: LP LL LK LG
Exogenous Variables: C t
Joint Test:
Chi-sq df Prob.
119.1440 100 0.0930
Individual Components:
Dependent R-squared F(10,42) Prob. Chi-sq(10) Prob.

72
res1*res1 0.066145 0.297487 0.9779 3.505697 0.9669
res2*res2 0.215896 1.156430 0.3462 11.44247 0.3241
res3*res3 0.226658 1.230976 0.3001 12.01289 0.2842
res4*res4 0.154146 0.765398 0.6604 8.169757 0.6123
res2*res1 0.168438 0.850734 0.5843 8.927194 0.5390
res3*res1 0.132312 0.640452 0.7708 7.012558 0.7243
res3*res2 0.166277 0.837647 0.5958 8.812704 0.5500
res4*res1 0.289652 1.712595 0.1097 15.35156 0.1198
res4*res2 0.226832 1.232193 0.2994 12.02207 0.2836
res4*res3 0.177669 0.907434 0.5351 9.416469 0.4931
The results from the VAR residual serial correlation LM tests and the VAR residual
portmanteau tests for autocorrelations reported in Table 4.17 and Table 4.18 indicate no
autocorrelation problem in the residuals from the estimated VAR(1) system at levels since the
p-values of LM statistics, Q statistics and adjusted Q statistics are greater than the 0.05 or 0.01
levels of significance. This finding is supported by the fact that the residual plots generated
from the estimated VAR(1) system at levels reported in Figure 4.7 are behaving more like a
white noise process. Lastly, the VAR residual normality test results reported in Table 4.19
indicate that residuals from the estimated VAR(1) system at levels are not normally distributed
either jointly or individually. As observed from the results, the problem mainly is in the
skewness and kurtosis of the first and second equations, in which case, the p-values of such
statistics are less than 0.05. The problem could be attributed to the relatively short sample size
used, and can be resolved with longer time periods and data.
Table 4.17: VAR Residual Serial Correlation LM Tests for VAR (1) System at Levels

73
VAR Residual Serial Correlation LM Tests
Null Hypothesis: No serial correlation at lag order h
Endogenous Variables: LP LL LK LG
Exogenous Variables: C t
Lags LM-Stat Prob
1 23.19673 0.1086
2 11.69306 0.7648
3 12.97154 0.6748
4 15.23603 0.5074
5 19.23753 0.2565
6 17.71666 0.3407
7 14.07303 0.5933
8 31.04809 0.0133
9 16.22259 0.4375
10 9.159598 0.9067
11 12.91487 0.6790
12 19.08777 0.2641
Probs from chi-square with 16 df.

74
Table 4.18: VAR Residual Autocorrelation Portmanteau Tests for VAR (1) System at
Levels
VAR Residual Portmanteau Tests for Autocorrelations
Null Hypothesis: no residual autocorrelations up to lag h
Endogenous Variables: LP LL LK
LG
Exogenous Variables:
C t
Lags Q-Stat Prob. Adj Q-Stat Prob. df
1 16.85535 NA* 17.17949 NA* NA*
2 25.60899 0.0598 26.27641 0.0503 16
3 37.69023 0.2250 39.08253 0.1816 32
4 52.83379 0.2928 55.46229 0.2140 48
5 70.83082 0.2604 75.33402 0.1571 64
6 86.89326 0.2801 93.44698 0.1444 80
7 100.6466 0.3527 109.2932 0.1670 96
8 126.0297 0.1723 139.1889 0.0417 112
9 140.1138 0.2189 156.1538 0.0459 128
10 148.7568 0.3758 166.8068 0.0938 144
11 158.9121 0.5094 179.6218 0.1374 160
12 174.6611 0.5143 199.9804 0.1039 176
*The test is valid only for lags larger than the VAR lag order.
df is degrees of freedom for (approximate) chi-square distribution
*df and Prob. may not be valid for models with exogenous

75
-.10
-.05
.00
.05
.10
.15
65 70 75 80 85 90 95 00 05 10
LP Residuals
-.08
-.04
.00
.04
.08
.12
.16
65 70 75 80 85 90 95 00 05 10
LL Residuals
-.4
-.2
.0
.2
.4
.6
65 70 75 80 85 90 95 00 05 10
LK Residuals
-.3
-.2
-.1
.0
.1
.2
.3
65 70 75 80 85 90 95 00 05 10
LG Residuals

76
Table 4.18: VAR Residual Normality Tests for VAR (1) System at Levels
VAR Residual Normality Tests
Orthogonalization: Cholesky (Lutkepohl)
Null Hypothesis: Residuals are multivariate normal
Endogenous Variables: LP LL LK LG
Exogenous Variables: C t
Component Skewness Chi-sq df Prob.
1 1.214249 13.02388 1 0.0003
2 2.282982 46.03939 1 0.0000
3 -0.302536 0.808498 1 0.3686
4 -0.230979 0.471269 1 0.4924
Joint 60.34303 4 0.0000
Component Kurtosis Chi-sq df Prob.
1 5.249355 11.17328 1 0.0008
2 12.09877 182.8227 1 0.0000
3 2.597949 0.356966 1 0.5502
4 2.632107 0.298887 1 0.5846
Joint 194.6518 4 0.0000
Component Jarque-Bera df Prob.
1 24.19715 2 0.0000
2 228.8620 2 0.0000
3 1.165464 2 0.5584
4 0.770157 2 0.6804
Joint 254.9948 8 0.0000
Notwithstanding, this issue can be ignored on the basis of the appropriate models theory which
argues that the lack of normality does not necessarily invalidate an estimated model, but only
that there are other variables which may explain this result, a reasonable assumption being that
there are many other factors that influence economic growth in general. The post-model
estimation analysis results, therefore, provide ample evidence to support the stability,

77
robustness and adequacy of the estimated VAR (1) system at levels, allowing further analysis
to be conducted on the basis of the estimated VAR (1) system at levels.
4.4.2 Deterministic Term Specification in the Cointegration Relationships
In Section 4.2.5, an optimal lag length of 1 for the VAR (1) system was found to be optimal
for various analyses. An important question when applying the Johansen cointegration method
is the deterministic term specification to be included, since results may differ from one to
another.

78
Table 4.19: Deterministic Term Determination Test Summary
Series: LP LL LK LG
Lags interval: 1 to 1
Selected (0.05 level*) Number of Cointegrating Relations by Model
Data
Trend: None None Linear Linear Quadratic
Test Type No
Intercept Intercept Intercept Intercept Intercept
No Trend No Trend No Trend Trend Trend
Trace 1 0 0 0 0
Max-Eig 1 0 0 0 0
*Critical values based on MacKinnon-Haug-Michelis (1999)
Information Criteria by Rank and Model
Data
Trend: None None Linear Linear Quadratic
Rank or No
Intercept Intercept Intercept Intercept Intercept
No. of CEs No Trend No Trend No Trend Trend Trend
Akaike Information Criteria by Rank (Rows) and Model (Columns)
0 -8.926051 -8.926051 -9.202563 -9.202563 -9.111626
1 -9.094437 -9.056061 -9.181470 -9.208385* -9.150998
2 -9.068251 -8.991528 -9.055176 -9.134182 -9.108072
3 -8.923905 -8.821979 -8.838512 -8.925348 -8.929896
4 -8.636679 -8.553690 -8.553690 -8.668640 -8.668640
Schwarz Criteria by Rank (Rows) and Model (Columns)
0 -8.325668 -8.325668 -8.452084* -8.452084* -8.211052
1 -8.193863 -8.117963 -8.130801 -8.120191 -7.950233
2 -7.867486 -7.715714 -7.704315 -7.708273 -7.607116
3 -7.422949 -7.208450 -7.187460 -7.161724 -7.128748
4 -6.835531 -6.602446 -6.602446 -6.567301 -6.567301

79
Appealing to the Pantula Principle postulated by Johansen (1992), a summary of the results
from all the five possible specifications of the cointegration relationships is reported in Table
4.19. Based on the AIC and SBC criteria, the model with intercept and trend (specification 4)
is the best assumption for the cointegration relationships
4.4.3 Assessment of Long-Run Relationships
Table 4.20 presents a summary of the Johansen cointegration test results based on the inclusion
of an intercept and trend in the VAR(1) system. At the 0.05 level of significance, both the trace
statistic and maximum eigen-value test results do not support the existence of any long-run
stable relationship among the four variables – output, labour, ICT stock, and road infrastructure
investment. This finding is supported by the results from the Phillips-Ouliaris cointegration test
results reported in Table 4.21 (p-values of tau-statistics and z-statistics are less than 0.05).
Table 4.20: Johansen Cointegration Test Results

80
Johansen Cointegration Test
Trend assumption: Linear deterministic trend (restricted)
Series: LP LL LK LG
Lags interval (in first differences): 1 to 1
Unrestricted Cointegration Rank Test (Trace)
Hypothesized Trace 0.05
No. of CE(s) Eigenvalue Statistic Critical Value Prob.**
None 0.296703 44.23603 63.87610 0.6819
At most 1 0.238108 25.93329 42.91525 0.7411
At most 2 0.128309 11.79185 25.87211 0.8262
At most 3 0.085562 4.651179 12.51798 0.6470
Trace test indicates no cointegration at the 0.05 level
* denotes rejection of the hypothesis at the 0.05 level
**MacKinnon-Haug-Michelis (1999) p-values
Unrestricted Cointegration Rank Test (Maximum Eigenvalue)
Hypothesized Max-Eigen 0.05
No. of CE(s) Eigenvalue Statistic Critical Value Prob.**
None 0.296703 18.30274 32.11832 0.7797
At most 1 0.238108 14.14144 25.82321 0.7104
At most 2 0.128309 7.140669 19.38704 0.8910
At most 3 0.085562 4.651179 12.51798 0.6470
Max-eigenvalue test indicates no cointegration at the 0.05 level
* denotes rejection of the hypothesis at the 0.05 level
**MacKinnon-Haug-Michelis (1999) p-values
Table 4.21: Phillips-Ouliaris Cointegration Test
Series: LP LL LK LG
Null hypothesis: Series are not cointegrated
Cointegrating equation deterministics: C @TREND
Long-run variance estimate (Bartlett kernel, Newey-West fixed bandwidth)

81
No d.f. adjustment for variances
Dependent tau-statistic Prob.* z-statistic Prob.*
LP -3.065460 0.5923 -16.02920 0.5978
LL -3.212603 0.5191 -17.11500 0.5347
LK -3.673861 0.3046 -21.25519 0.3157
LG -3.352244 0.4503 -20.15753 0.3686
*MacKinnon (1996) p-values.
4.5 ASSESSMENT OF SHORT-RUN DYNAMICS
Having established the non-existence of any long-run equilibrium relationship among the
variables, it is appropriate that the short-run dynamic relationships among the variables in the
system be examined. Of particular relevance is the sort of relationship that exists between
economic growth and road infrastructure investment – road infrastructure investment may
promote economic growth or vice versa. Another important aspect of the short-run dynamics
is effects of shocks on the future state of the system. This section particularly assesses the
causal relationships in the system as well as the time profile of the effect of shocks on the future
state of the system. Having established that there is no stable long-run equilibrium relationship
among the variables, the short-run dynamic relationships among the variables are assessed
based on a VAR model with first-differenced data (dLP, dLL, dLK and dLG), since all the
variables are integrated with order 1.
4.5.1 Analysis of First-Differenced VAR System
As the starting point, an optimal VAR lag determination analysis was conducted using the first-
differenced data, and the results reported in Table 4.22. On the basis of the AIC, BIC and HQC,
an optimal lag length of 1 is selected. Table 4.23 presents the estimated first-differenced
VAR(1) system. As revealed in Figure 4.8, residuals from the estimated first-differenced
VAR(1) system satisfies the stability condition since there are no roots lying outside the unit
circle in each model. The VAR residual heteroskedasticity test results presented in Table 4.24
indicate that there is no problem of residual heteroskedasticity from the estimated first-
differenced VAR(1) system since the p-value of the joint chi-square test is greater than 0.05.

82
The individual chi-square test results also indicate that the residuals from the estimated first-
differenced VAR(1) system are homoscedastic.
Table 4.22: Optimal Lag Determination in the First Difference
VAR Lag Order Selection Criteria
Endogenous variables: dLP dLL dLK dLG
Exogenous variables: C
lags LogL p(LR) AIC BIC HQC
1 240.33961 -9.792871* -8.989910* -9.493536*
2 247.25955 0.61064 -9.389313 -7.943983 -8.850509
3 253.36857 0.72884 -8.949714 -6.862015 -8.171441
4 260.77679 0.53812 -8.567857 -5.837790 -7.550116
5 271.96407 0.13150 -8.353958 -4.981522 -7.096748
6 282.94620 0.14435 -8.130942 -4.116137 -6.634263
7 296.36370 0.04335 -8.016164 -3.358990 -6.280016
* indicates lag order selected by the criterion
LogL : Log Likelihood
p(LR): P-Value of Sequential Modified LR Test Statistic
FPE : Final Prediction Error
AIC : Akaike Information Criterion
BiC : Bayesian Information Criterion
HQC : Hannan-Quinn Information Criterion
Table 4.23: First-Differenced VAR(1) System

83
Vector Autoregression Estimates
Standard errors in ( ) & t-statistics in [ ]
dLP dLL dLK dLG
dLP(-1) 0.330698 0.382136 1.111408 0.695622
(0.14232) (0.16422) (0.71664) (0.50476)
[ 2.32369] [ 2.32697] [ 1.55086] [ 1.37814]
dLL(-1) 0.100741 0.331000 -0.645418 0.521588
(0.11739) (0.13545) (0.59110) (0.41634)
[ 0.85820] [ 2.44364] [-1.09188] [ 1.25280]
dLK(-1) -0.060293 -0.065874 0.062695 0.116935
(0.02795) (0.03225) (0.14073) (0.09912)
[-2.15732] [-2.04265] [ 0.44549] [ 1.17969]
dLG(-1) 0.000189 -0.004354 -0.155128 0.069919
(0.03757) (0.04336) (0.18920) (0.13326)
[ 0.00503] [-0.10043] [-0.81990] [ 0.52467]
C 0.035257 0.011020 0.140030 0.053101
(0.00895) (0.01033) (0.04507) (0.03174)
[ 3.93961] [ 1.06713] [ 3.10728] [ 1.67293]
R-squared 0.194894 0.288288 0.068242 0.162787
Adj. R-squared 0.126374 0.227717 -0.011057 0.091534
F-Statistic 2.844351 4.759496 0.860570 2.284653
P-Value(F-Statistic) 0.034212 0.002629 0.494553 0.074164
Durbin-Watson 1.938131 2.021655 2.058211 1.910690
Figure 4.8: Eigenvalue Stability Condition

84
-1.5
-1.0
-0.5
0.0
0.5
1.0
1.5
-1.5 -1.0 -0.5 0.0 0.5 1.0 1.5
Inverse Roots of AR Characteristic PolynomialFirst-Differenced VAR(1) System
Table 4.24: VAR Residual Heteroskedasticity Tests of First-Differenced VAR (1) System
VAR Residual Heteroskedasticity Tests: No Cross Terms (only levels and squares)
Endogenous Variables: dLP dLL dLK dLG
Exogenous Variables: C
Joint Test:
Chi-Sq df Prob.
77.16801 80 0.5689
Individual Components:
Dependent R-Squared F(8,43) Prob. Chi-sq(8) Prob.
res1*res1 0.038902 0.217563 0.9860 2.022918 0.9803
res2*res2 0.107514 0.647503 0.7335 5.590726 0.6930
res3*res3 0.121164 0.741045 0.6551 6.300535 0.6136
res4*res4 0.036742 0.205023 0.9884 1.910602 0.9836
res2*res1 0.088942 0.524733 0.8312 4.624974 0.7968
res3*res1 0.186391 1.231366 0.3045 9.692320 0.2873
res3*res2 0.247260 1.765581 0.1108 12.85753 0.1168
res4*res1 0.078667 0.458941 0.8779 4.090701 0.8488
res4*res2 0.123515 0.757446 0.6413 6.422755 0.6000
res4*res3 0.057621 0.328652 0.9504 2.996306 0.9346

85
The VAR residual serial correlation LM tests and the VAR residual autocorrelation
portmanteau tests from the estimated first-differenced VAR(1) system displayed in Table 4.25
and Table 4.26 suggests that there is no autocorrelation problem since the p-values of LM
statistics, Q statistics and adjusted Q statistics are greater than the 0.05 or 0.01 levels of
significance. The residual plots generated from the estimated first-differenced VAR (1) system
and reported in Figure 4.9, behaving more like a white noise process confirms the absence of
autocorrelation in the residuals. Again, the VAR residual normality test results in Table 4.27
indicate that residuals from the estimated first-differenced VAR(1) system are not normally
distributed either jointly or individually due to the same reasons stated earlier and therefore can
be ignored on the basis of the appropriate models theory discussed earner.
Starting from the post-model estimation analysis discussions, there is, therefore, enough
evidence to conclude that the estimated first-differenced VAR(1) system is stable, robust and
adequate, and therefore, provide support for further analyses to be conducted on the basis of
the estimated first-differenced VAR(1) system.

86
Table 4.25: VAR Residual Serial Correlation LM
Tests for First-Differenced VAR (1) System
VAR Residual Serial Correlation LM Tests
Null Hypothesis: no serial correlation at lag order h
Endogenous Variables: dLP dLL dLK dLG
Exogenous Variables: C
Lags LM-Stat Prob
1 12.53965 0.7061
2 11.06960 0.8052
3 9.826235 0.8755
4 11.92211 0.7493
5 11.92997 0.7488
6 11.96282 0.7465
7 15.03160 0.5223
8 27.49903 0.0363
9 11.38818 0.7849
10 8.838760 0.9199
11 10.24374 0.8536
12 14.69624 0.5470
Probs from chi-square with 16 df.

87
Table 4.26: VAR Residual Autocorrelation Portmanteau Tests for VAR (1) System at
Levels
VAR Residual Portmanteau Tests for Autocorrelations
Null Hypothesis: no residual autocorrelations up to lag h
Endogenous Variables: dLP dLL dLK dLG
Exogenous Variables: C
Lags Q-Stat Prob. Adj Q-Stat Prob. df
1 1.496321 NA* 1.525661 NA* NA*
2 12.66093 0.6974 13.13686 0.6627 16
3 22.64891 0.8891 23.73634 0.8538 32
4 35.20256 0.9154 37.33613 0.8669 48
5 47.54701 0.9384 50.99382 0.8806 64
6 59.29471 0.9600 64.27383 0.9001 80
7 73.50371 0.9575 80.69312 0.8688 96
8 96.21580 0.8562 107.5347 0.6017 112
9 106.4986 0.9170 119.9697 0.6811 128
10 114.7867 0.9652 130.2312 0.7879 144
11 124.0824 0.9840 142.0209 0.8432 160
12 136.5510 0.9877 158.2300 0.8277 176
*The test is valid only for lags larger than the VAR lag order.
df is degrees of freedom for (approximate) chi-square distribution

88
-.10
-.05
.00
.05
.10
.15
65 70 75 80 85 90 95 00 05 10
dLP Residuals
-.10
-.05
.00
.05
.10
.15
.20
65 70 75 80 85 90 95 00 05 10
dLL Residuals
-.6
-.4
-.2
.0
.2
.4
65 70 75 80 85 90 95 00 05 10
dLK Residuals
-.4
-.3
-.2
-.1
.0
.1
.2
.3
65 70 75 80 85 90 95 00 05 10
dLG Residuals
Figure 4.10: Residual Plots from the Estimated First-Differenced VAR (1) System

89
Table 4.27: VAR Residual Normality Tests for First-Differenced VAR (1) System
VAR Residual Normality Tests
Orthogonalization: Cholesky (Lutkepohl)
Null Hypothesis: Residuals are multivariate normal
Endogenous Variables: dLP dLL dLK dLG
Exogenous Variables: C
Component Skewness Chi-sq df Prob.
1 0.583955 2.955368 1 0.0856
2 2.574102 57.42533 1 0.0000
3 -0.155924 0.210707 1 0.6462
4 -0.082629 0.059172 1 0.8078
Joint 60.65058 4 0.0000
Component Kurtosis Chi-sq df Prob.
1 4.948054 8.222316 1 0.0041
2 12.13550 180.8241 1 0.0000
3 2.947798 0.005904 1 0.9388
4 3.027470 0.001635 1 0.9677
Joint 189.0540 4 0.0000
Component Jarque-Bera df Prob.
1 11.17768 2 0.0037
2 238.2494 2 0.0000
3 0.216611 2 0.8974
4 0.060807 2 0.9701
Joint 249.7045 8 0.0000

90
4.5.3 Causal Relationships in the System
Using the VAR Granger causality method, the results are summarized in Table 4.28. At the
0.05 level of significance, the results show causal relationships from ICT stock to economic
growth (dLKdLP, p-value 0.0310 < 0.05) and from ICT stock and economic growth to labour
(dLKdLL, p-value 0.0411 < 0.05; dLPdLL, p-value 0.0200 < 0.05). To further investigate
the causal relationships among the variables, pairwise Granger causality tests were also
conducted and the results summarized in Table 4.29.
Table 4.28: VAR Granger Causality Test
VAR Granger Causality/Block Exogeneity Wald Tests
Endogenous Variables: dLP dLL dLK dLG
Exogenous Variables: C
Chi-Squared Test Statistics
Values in [ ] are p-values
Dependent
Variable
Independent Variable
dLP dLL dLK dLG
dLP - 0.7365 4.6540 2.53E-05
[0.3908] [0.0310] [0.9960]
dLL 5.4148 - 4.1724 0.0101
[0.0200] [0.0411] [0.9200]
dLK 2.4052 1.1922 - 0.6722
[0.1209] [0.2749] [0.4123]
dLG 1.8993 1.5695 1.3917 -
[0.1682] [0.2103] [0.2381]

91
Table 4.29: Pairwise Granger Causality Tests
Pairwise Granger Causality Tests
Endogenous Variables: dLP dLL dLK dLG
Exogenous Variables: C
Lags: 1
Null Hypothesis: F-Statistic Prob. Decision
dLL does not Granger Cause dLP 0.21371 0.6459 Accept
dLP does not Granger Cause dLL 4.52210 0.0385 Reject
dLK does not Granger Cause dLP 4.29701 0.0435 Reject
dLP does not Granger Cause dLK 1.42535 0.2383 Accept
dLG does not Granger Cause dLP 0.03500 0.8524 Accept
dLP does not Granger Cause dLG 4.62888 0.0364 Reject
dLK does not Granger Cause dLL 3.34696 0.0734 Reject
dLL does not Granger Cause dLK 0.35665 0.5531 Accept
dLG does not Granger Cause dLL 0.02600 0.8726 Accept
dLL does not Granger Cause dLG 4.69904 0.0351 Reject
dLG does not Granger Cause dLK 0.57067 0.4536 Accept
dLK does not Granger Cause dLG 2.79437 0.1010 Accept
* Decision at 0.05 level.
In particular, the pairwise Granger causality test results reveal that road infrastructure
investment does not Granger-cause economic growth, but rather economic growth is a Granger
cause of road infrastructure investment in South Africa. It means, therefore, that road
infrastructure investment does not predict anything about the short-run properties of economic
growth in South Africa. On the other hand, economic growth plays a role in the short-run
properties of road infrastructure investment in South Africa.
4.5.4 Impulse Response Functions
The first-difference VAR (1) system allows the study of the impulse response of endogenous
variables to one time shock of other variables in the system. Figure 4.11 and Table 4.30 display
the estimated impulse response of economic growth (dLP) to shocks observed from itself, the
employment variable (dLL), ICT stock (dLK), and road infrastructure investment (dLG) with
Cholesky ordering of variables.

92
Figure 4.12: Individual Impulse Responses of dLP to Shocks in dLL, dLK and dLG
0.034
0.036
0.038
0.040
0.042
0.044
0.046
0.048
0.050
0.052
0.054
Period
0 2 4 6 8 10 12 14 16 18 20 22
Accumulated Response of dLP to dLP
0.000
0.002
0.004
0.006
0.008
0.010
Period
0 2 4 6 8 10 12 14 16 18 20 22
Accumulated Response of dLP to dLL
-0.022
-0.020
-0.018
-0.016
-0.014
-0.012
-0.010
-0.008
-0.006
-0.004
-0.002
0.000
Period
0 2 4 6 8 10 12 14 16 18 20 22
Accumulated Response of dLP to dLK
0.0000
0.0002
0.0004
0.0006
0.0008
0.0010
0.0012
0.0014
0.0016
0.0018
0.0020
0.0022
0.0024
Period
0 2 4 6 8 10 12 14 16 18 20 22
Accumulated Response of dLP to dLG

93
Table 4.30: Impulse Responses of dLP to to Shocks in dLL, dLK and dLG
Years dLP dLL dLK dLG
1 0.034854 0.000000 0.000000 0.000000
2 0.046156 0.001680 -0.010275 2.32E-05
3 0.049353 0.004583 -0.015381 0.001128
4 0.051095 0.006696 -0.017511 0.001729
5 0.052272 0.007862 -0.018699 0.001977
6 0.052967 0.008499 -0.019432 0.002110
7 0.053355 0.008865 -0.019860 0.002192
8 0.053575 0.009077 -0.020103 0.002240
9 0.053702 0.009199 -0.020241 0.002267
10 0.053774 0.009268 -0.020320 0.002282
11 0.053816 0.009308 -0.020366 0.002291
12 0.053840 0.009331 -0.020392 0.002296
13 0.053854 0.009344 -0.020407 0.002299
14 0.053862 0.009352 -0.020416 0.002301
15 0.053866 0.009356 -0.020420 0.002302
16 0.053869 0.009358 -0.020423 0.002302
17 0.053870 0.009360 -0.020425 0.002303
18 0.053871 0.009361 -0.020426 0.002303
19 0.053871 0.009361 -0.020426 0.002303
20 0.053872 0.009361 -0.020427 0.002303
21 0.053872 0.009362 -0.020427 0.002303
22 0.053872 0.009362 -0.020427 0.002303
Cholesky Ordering: dLP dLL dLK dLG

94
Figure 4.12: Overlay Impulse Responses of dLP to Shocks in dLL, dLK and dLG
As observed, economic growth (dLP) responded positively to its own shock behaving more
like the Mitscherlich curve, stabilizing after 18 years. Economic growth responded linearly
positively to the shock in the employment variable (dLL) between the first two years, but the
behaviour changed thereafter, though positive, was also more like the Mitscherlich curve and
stabilizing after 18 years. A shock in ICT stock (dLK) led to a negative economic growth
response with a decaying pattern, but stabilized after 20 years. There was no response in
economic growth to the shock in road infrastructure investment for the first two years, but the
behaviour changed thereafter, though positive, also behaving more like the Mitscherlich curve,
stabilizing after 17 years. From the overlay plot of the impulse response functions, the
employment variable (dLL) caused the greatest shock in economic growth (dLP), ignoring the
shock from itself. This could be attributed to the large number of skilled and abundant labour
in South Africa.
-0.03
-0.02
-0.01
0.00
0.01
0.02
0.03
0.04
0.05
0.06
Period
0 10 20 30
Accumulated Responses of dLP to CholeskyOne S.D. Innovations
PLOT dLP dLL dLK dLG

95
4.5.5 Forecast Error Variance Decomposition Analysis
This section examines the relative importance of shocks from each of the variables to economic
growth using the first-differenced VAR(1) system. Table 4.31 reports the forecast error
variance decompositions (FEVD) for economic growth over 18 periods using the same
Cholesky ordering of variables that were used in the impulse response function analysis.
Table 4.31: Variance Decomposition of dLP
Years S.E. dLP dLL dLK dLG
1 0.034854 100.0000 0.000000 0.000000 0.000000
2 0.038091 92.52914 0.194424 7.276396 3.72E-05
3 0.038690 90.37178 0.751643 8.795023 0.081558
4 0.038850 89.83084 1.041226 9.023136 0.104801
5 0.038904 89.67191 1.128156 9.091338 0.108600
6 0.038922 89.61831 1.153897 9.118135 0.109660
7 0.038928 89.60021 1.162362 9.127366 0.110063
8 0.038930 89.59427 1.165207 9.130320 0.110204
9 0.038931 89.59233 1.166145 9.131276 0.110249
10 0.038931 89.59169 1.166452 9.131591 0.110264
11 0.038931 89.59148 1.166553 9.131695 0.110268
12 0.038931 89.59142 1.166586 9.131729 0.110270
13 0.038931 89.59139 1.166597 9.131740 0.110270
14 0.038931 89.59138 1.166601 9.131744 0.110271
15 0.038931 89.59138 1.166602 9.131745 0.110271
16 0.038931 89.59138 1.166602 9.131745 0.110271
17 0.038931 89.59138 1.166603 9.131745 0.110271
18 0.038931 89.59138 1.166603 9.131745 0.110271
Cholesky Ordering: dLP dLL dLK dLG

96
The results indicate that economic growth shocks were the main driver of economic growth in
South Africa, stabilizing after 14 years. It means, therefore, that South Africa’s economic
growth, in the context of VAR system used in the study, can be predicted by its previous
behaviour. Six years ahead, the strongest influence on South Africa’s economic growth was
ICT stock (dLK, accounting for nearly 9.12%), followed by employment (dLL, accounting for
nearly 1.15%) and road infrastructure investment (dLG, accounting for a mere 0.11%). The
magnitude of the contribution of road infrastructure investment in South Africa did not change
significantly after 4 years (0.10% – 0.11%), implying that road infrastructure did not have
significant effect on the South African economy over the study period, 1966-2013. This finding
supports the finding from the IRF analysis which revealed insignificant evidence for the
relationship between South Africa’s economic growth and road infrastructure investment.
Figure 4.13: Forecast Error Variance Decompositions
89
90
91
92
93
94
95
96
97
98
99
100
Years
0 2 4 6 8 10 12 14 16 18
Percent dLP variance due to dLP
0.0
0.1
0.2
0.3
0.4
0.5
0.6
0.7
0.8
0.9
1.0
1.1
1.2
Years
0 2 4 6 8 10 12 14 16 18
Percent dLP variance due to dLL
0
1
2
3
4
5
6
7
8
9
10
Years
0 2 4 6 8 10 12 14 16 18
Percent dLP variance due to dLK
0.00
0.01
0.02
0.03
0.04
0.05
0.06
0.07
0.08
0.09
0.10
0.11
0.12
Years
0 2 4 6 8 10 12 14 16 18
Percent dLP variance due to dLG

97
4.6 CONCLUSION
This chapter has presented and conducted an empirical analysis of the data with the intent to
address the research aims and objectives. Various statistical and econometric methods were
applied. All results were discussed in light of the stated research aims and objectives. The next
chapter presents a summary of the results and recommendations for future research.

98
CHAPTER 5
5. CONCLUSION AND RECOMMENDATIONS
5.1 INTRODUCTION
The role of Transport Infrastructure in the process of economic growth has received a wide
attention. This study shows the relationship between transport infrastructure investment, labour
input, ICT investment and economic growth from 1960 until 2013, data was sourced from
South African Reserve Bank. It has been argued that while transport infrastructure investment
considered as a factor input that contribute to economic growth, the way it is financed may
have to be meticulously observed.
The main criticism of government intervention in transport infrastructure is not effective in
allocation of financial resources, which eventually results in backlogs in maintenance and
repairs. However, the rationale for private intervention is based on the public good argument
that the private sector cannot provide public goods to enhance economy particularly when they
are for public consumption.
5.2 CONCLUSION
The conventional wisdom is that public investment in infrastructure, particularly infrastructure
on road, plays a crucial role in facilitating economic growth and international competitiveness.
The development practitioners tend to emphasize the importance of reliable and affordable
infrastructure for reducing poverty and its contribution in the achievement of Millennium
Development Goals.
Good road linkages reduce transport costs, road congestion and promote industrial
development throughout the country. This implies that the better infrastructure the positive
economic development and growth. Poor infrastructure facilities, especially in transport,
communications and information technologies, which is caused by the overuse and misuse even
though it has received more attention from the government at all levels since early 1960, are
regarded as one of the major impediments for investment and economic growth in South Africa.

99
Although a number of empirical studies report evidence supporting the significant contribution
of infrastructure to economic development, it is a puzzling and disputing question on whether
transport is the cause of growth or vice versa. Following the endogenous growth models,
transport infrastructure leads economic growth while the Wagner’s law regards the increase in
real GDP as a main drive in transport infrastructure investment. Under some conditions, it is
even possible to observe a negative or non-significant growth impact of transport investment,
labour input and ICT investment. It is expected that the relationship between infrastructure
investment and economic growth exhibits two-way relationship.
As the direction of relationship is theoretically unclear, the understanding and interdependency
between road infrastructure, labour input, ICT investment and economic growth is relevant as
it provides some guidance for policy actions. If the relationship is from GDP to road
infrastructure investment then it cannot be used as a policy instrument.
Road infrastructure services are used as final consumption items for households and
intermediate consumption item for firms , any wrong action taken by government that negates
the growth and development of infrastructure has both micro and macro economic effect to the
economy at large. The quality of road infrastructure has a direct effect on business productivity
and growth, and different investments to infrastructure capital from inequality between regions
and countries. The role of infrastructural development on economic is a vital issue for strategic
and development country policy management for a country with weak quality of infrastructure
base. Efficient infrastructure attracts centres of production and consumption, gives greater
access to markets and education centres and that timely access to health care, schools and other
facilities deemed essential.
5.3 RECOMMENDATIONS

100
The linkage between road infrastructural development and economic growth outcomes is one
of the most popular topics for debates in recent scientific literature and economic research. The
role is widely analysed as very vital to micro and macro-economics in the sense that the
availability and quality of road infrastructure may result in different decisions for investment
and may influence labour migration, business establishment location.
Although the result of infrastructural development has a positive linkage with the economy,
growth research studies believe that more roads should be constructed and the existing roads
adequately maintained to enhance and support economic growth. Also, the funding magnitude
of the government leaves a lot to question.
Greater funding in road transport such as upgrading, maintenance, repairs and rehabilitation
are important to enhance economic growth. These also enhance capacity building, improve
roads conditions, enforce regulations as well as putting in place traffic management control
measures in place. The support from private sector to compliment public sector investment in
the improvement of transport infrastructure should also be encouraged.
Effective coordination among the national, provincial and local government on capital
investment of road transport is essential should be strengthened. The benefit of road
infrastructure investment is immeasurable to all.
Including the fact mentioned above, the following are the recommendations of this study:
More roads should be constructed and the existing road should be sufficiently
maintained, particularly the ones from production areas such as farms and mines as they
will lead to increased in production.
The government should enhance the competition between and the efficiency in
infrastructure industries including ICT stock, which can have indirect contribution to
economy.
Demand for road transport infrastructure should expand significantly in future, due to
economic growth, ICT progress, urbanization and growing congestion.

101
The paper proposes that the government should as a matter of priority create more
favourable institutional policy and regulatory framework to meet up these challenges.
REFERENCES

102
Banerjee, A , Duflo, E and Qian, N. 2012. On the road : Access to Transportation Infrastructure
and Economic Growth in China.
Banister, D. & Berechman, Y. 2000. The Economic Development Effects of Transport
Investments.
Bosede, A (Dr), Abalaba, B and Afolabi, D. 2013. Transport Infrastructure Improvement and
Economic Growth in Nigeria.
Bryceson, D.F. 2004. Road to Poverty Reduction? Dissecting Rural Roads' Impact on Mobility
in Africa and Asia.
Conway, P and Hunt, B. 2010. Estimating the potential output of the New Zealand economy
Cheteni, P, 2013. Transport Infrastructure Investment and Transport Sector Productivity on
Economic Growth in South Africa (1975-2011).
Department of Housing, 2000. Guidelines for Human Settlements, Planning and Design : Road
Geometric and Layout Planning
Department of Public Works and Transport - North West, 2009. Needs Analysis for the North
West Road Network.
Department of Public Works - National, 2005. Guidelines for the implementation of Labour -
Intensive Infrastructure Projects under the Expanded Public Works Programme ( EPWP)
Eruygyr, A , Kaynak, M and Mert, M. 2012. Transportation–Communication Capital and
economic Growth: A VECM Analysis for Turkey

103
Fedderke, J and Garlicky,R. 2008. Infrastructure Development and Economic Growth in South
Africa: A Review of the Accumulated Evidence.
Gralich, EM. 1994. Infrastructure investment : A review essay. Journal of Economic Literature
Hine, J. 2003. Are Social Benefit the missing component of Road Appraisal?
Huang,Q. and Harata N. 2010. Role of Transport Infrastructure in Economic Development: An
Empirical Study for China
Huang, Q. Study on the impact of transport infrastructure on economic development in China.
Hulten, CR.1996. Infrastructure Capital and Economic Growth: How Well You Use It May Be
More Important Than How Much You Have.
Hulten, CR. 2005. Infrastructure Effectiveness as a Determinant of Economic Growth: How
Well You Use it May Be More Important than How Much You Have.
Jiang, B.Q 2001. A review of studies on the relationship between transport infrastructures.
Investments and Economic growth, Vancouver, British Columbia.
Khanam, BR. 1996. Highway Infrastructure Capital and Productivity Growth : Evidence from
the Canadian Goods -Producing Sector. Logistics and transportation Review.
Kayode, O, Babatunde, OA and Abiodun, F. 2013. An emperical Analysis of transport
infrastructure investment and economic growth in Nigeria.
Lau, SHP and Sin, CY. 1997. Public Infrastructure and economic growth : time series
properties and evidence. Economic Records.
Lacoono, M and D Lavinson, 2009. The economic Impact of Upgrading Roads: Draft Report.

104
Landau,DL.1985. Government expenditure and economic growth in the developed countries:
1952 -1976
Loizides, J and Vamvoukas,G. 2001. Government expenditure and economic growth :
Evidence from trivariate causality testing.
Lombard, P and Coetzer,L. 2007. The estimation of the impact of rural road investment on
socio-economic development.
Marsay, A and Seobi, M. 2010. How to achieve a sustainable increase in transport
infrastructure investment.
Milhøj, M. 2014. Multivariate Time Series Modeling Using VARMAX
Munnell, A.H (1992). Infrastructure Investment and economic growth, Journal of Economic
Perspectives.
Nedozi,FO. , Obasanmi,J.O. & Ighata, J,A .2014. Infrastructural Development and Economic
Growth in Nigeria : Using Simultaneous Equation.
North West Freight Databank. 2004. Department of Transport, Road and Community Safety.
Perkins, P. 2003. An analysis of economic infrastructure investment in South Africa. MCom
dissertations, University of Witwatersrand.
Perkins, P , Fedderke, JW and Luiz , JM 2005. An Analysis of economic infrastructure
investment in south Africa. South African Journal of Economics.
Pinard, M.I & Greening, P.A.K. 2004. Sustainable Provision of Low-Volume Sealed Roads.
Rusmus,K. 2010. Potential Output and Output gap in Estonia - A Macro Model Based
Evaluation.

105
Rust, F.C. , Van Wyk,L H, Ittmann, HW and Kistan, K 2008. The role of R & D in Transport
Infrastructure in South Africa
SAICE, 2011. Infrastructure Report Card of South Africa
SANRAL. (2012). Reports available online
Smith,A and Visser, AT. 2006. A South African road network classification based on traffic
loading.
South African Reserve Bank. Economic Reports. Various issues. online.
The World Bank Washington, DC, 1988. Road Deterioration in Developing Countries : Causes
and Remedies
The World Bank. 2000. Choosing Rural Road Investments to Help Reduce Poverty.
The World Bank. Infrastructure database and macro indicators.
Yu, L. 2011. Public Infrastructure Investment and Economic Growth in China: An Empirical
Analysis Using VAR