the relationship between dietary fiber intake and lung function in
TRANSCRIPT

1
Title: The Relationship between Dietary Fiber Intake and Lung Function in NHANES
Authors:
Corrine Hanson, PhD, RD University of Nebraska Medical Center, School of Allied Health Professions Medical Nutrition Education 984045 Nebraska Medical Center, Omaha, NE 68198-4045 [email protected]
Elizabeth Lyden, MS University of Nebraska Medical Center, College of Public Health 984375 Nebraska Medical Center, Omaha, NE 68198-4375 [email protected]
Stephen Rennard, MD Department of Internal Medicine, Division of Pulmonary, Critical Care, Sleep and Allergy University of Nebraska Medical Center [email protected]
David M. Mannino, M.D. University of Kentucky College of Public Health 111 Washington Avenue Suite 220 Lexington, KY 40536 [email protected]
Erica P.A. Rutten, PhD Program Development Centre, Centre of Expertise for Chronic Organ Failure (CRIO+) Horn, The Netherlands [email protected]
Raewyn Hopkins Department of Respiratory Services, Auckland City Hospital Auckland, New Zealand [email protected]
Robert Young BMedSc, MBChB, DPhil (Oxon), FRCP, FRACP Department of Medicine, University of Auckland Auckland, New Zealand [email protected]
Corresponding author and request for reprints:
Corrine Hanson, PhD, RD
Page 1 of 29

2
University of Nebraska Medical Center, School of Allied Health Professions Medical Nutrition Education 984045 Nebraska Medical Center, Omaha, NE 68198-4045 [email protected] Sources of Support: None
Authors’ contribution to manuscript: RY, CH, SR, RH, ER, DM and EL designed the research,
CH, RY, and EL conducted the research, EL performed statistical analysis, CH, RY, RH, SR,
DM, ER wrote the paper, and all authors read and approved the final manuscript.
Author Disclaimers: Conflict of Interest disclosure: CH, EL, DM, ER, RH, RY have nothing to
disclose. SR has received reimbursement for attending a symposium, speaking and/or
consulting from: ABIM, Able Associates, Advantage Healthcare, Align2Action, Almirall, APT,
ATS, AstraZeneca, Baxter, Boehringer-Ingelheim, Chiesi, CIPLA, ClearView Healthcare,
Cleveland Clinic, CME Incite, Complete Medical Group, COPDFoundation, Cory Paeth, CSA,
CSL, CTS Carmel, Dailchi Sankyo, Decision Resources, Dunn Group, Easton
Associates, Elevation Pharma, FirstWord, Forest, Frankel Group, Gerson, GlaxoSmithKline,
Gilead, Grifols, GroupH, Guidepoint Global, Haymarket, HealthStar, Huron Consulting, Incite,
Inthought, IntraMed (Forest), Johnson & Johnson, LEK, McKinsey, Medical Knowledge,
Mediummune, Methodist Health System, Dallas, Navigant, NCI Consulting, Novartis Nuvis,
Pearl, Penn Technology, Pfizer, PlanningShop, Prescott, Pro Ed Comm, ProiMed, PSL
FirstWord, Pulmatrix, Quadrant, Qwessential, Regeneron, Saatchi and Saatchi, Schlesinger
Associates, Strategic North, Synapse, Takeda, Theron, WebMD
Running Head: Fiber and Lung Function in NHANES
Descriptor: 6.3 Diet, Obesity, and Lung Disease
Keywords: Diet, airflow limitation, spirometry grade-undefined (SGU)
Word Count: 2,920
Page 2 of 29
3
Abstract
Purpose: Extensive research supports a protective effects of a high fiber diet in certain disease
states; however, little is known about its relationship to lung health. The National Health and
Nutrition Examination Surveys (NHANES) contain spirometry measures and dietary intake
information, allowing us to assess this relationship.
Methods: Participants included 1,921 adults who had spirometry measurements and fiber intake
available. The primary outcomes were lung function measurements, including FEV1, FVC, and
percent predicted FEV1 and FVC. We also conducted acategorical analysis of fiber intake and
airflow restriction and obstruction based on GOLD and Spirometry Grade (SG) classifications.
Multivariable regression models were used to look at the association of lung function
measurements with dietary fiber intake after adjustment for relevant confounders. All analyses
accounted for the weighted data and complex design of the NHANES sample.
Results: Subjects in the highest quartile intake of fiber had mean FEV1 and FVC measurements
that were 82 mL and 129 mL higher that the lowest quartile of intake (p=0.05 and 0.01,
respectively), and mean percent predicted FEV1 and FVC values that were 2.4 and 2.8
percentage points higher (p=0.07 and 0.02, respectively). In the categorical analysis, higher
fiber intake was associated with a higher percentage of of those with normal lung function
(p=0.001) and a significant decline in the proportion of participants with airflow restriction
(p=0.001).
Conclusion: Low fiber intake was associated with reduced measures of lung function. A diet rich
in fiber-containing foods may play a role in improving lung health.
Keywords: Diet, fiber, lung function, restrictive lung disease, obstructive lung disease
Page 3 of 29
4
Introduction Lung diseases are a major public health problem, with chronic obstructive
pulmonary disease (COPD) now the third leading cause of death in the world [1]. Lung function
is a predictor of mortality in the general population as well as in patients with lung disease [2],
making maintaining lung function an important goal in the prevention of COPD and a major
public health objective [3]. Despite this, few preventative interventions other than smoking
cessation have been identified. While smoking remains an important risk factor, it has become
clear that other factors contribute to the risk of lung disease, and evidence has revealed that
diet may be an important consideration in lung health [4-17].
There is extensive research supporting the protective effects of a high fiber diet in certain
disease states, including heart disease and cancer [18-20]. However, little is known about fiber
and its relationship to lung health. Dietary fiber has been shown to exhibit both anti-
inflammatory and anti-oxidant properties [18,21-26] which have been implicated in both the
development and progression of lung disease [27-29].
The National Health and Nutrition Examination Surveys (NHANES) include spirometry
measures and dietary intake information, allowing us to test the hypothesis that lower fiber
intake will be associated with reduced lung function in a sample of United States adults.
Therefore, the purpose of this study was to examine if intake of dietary fiber is associated with
measures of lung function and presence of airflow restriction or obstruction in a United States
adult population, and possible mediators of this relationship, including systemic inflammation
reflected in differences in C-reactive protein (CRP) measurements. Some of the results of this
study have been previously reported in the form of an abstract [30].
Methods
Subjects This analysis includes adults 40 to 79 years of age in the NHANES cycle 2009-2010
who had pre-bronchodilator spirometry measurements available. Subjects with self-reported
Page 4 of 29
5
energy intake outside a plausible range (women: <600 or >6,000 kcal/day; men: <800 or >8,000
kcal/day) were excluded. Detailed methods and protocols for the NHANES study have been
previously reported, including informed consent procedures for all participants [31]. As the data
used in our study is freely available in the public domain, the study was exempt from human
subjects review.
Lung Function Outcomes Pre-bronchodilator spirometry was offered to participants aged 6-79
years in NHANES 2007-2010. Protocols for these measurements have been summarized
elsewhere [32-25]. Only spirometry measurements conforming to the American Thoracic
Society standards were used in this analysis. Lung function was also expressed as a percent of
predicted using the spirometric reference values from the third NHANES [35].
Respiratory Phenotype Determination: The Global Initiative for Chronic Obstructive Lung
Disease (GOLD) classification of COPD was used to establish the presence and severity of
airflow obstruction according to GOLD groups [36]. Alternate classification methods for COPD
have also been proposed, including the COPD Foundation Spirometry Grade (SG) classification
where those with no airflow obstruction are sub-classified according to normal lung function and
those with submaximal spirometry (FEV1/FVC≥0.70, FEV1<80% predicted) [37]. Our analysis
therefore included three comparator groups: 1). a group with normal spirometry
(FEV1/FVC≥0.70, FEV1 ≥80%predicted); 2). a group who met the criteria for classification for a
“restrictive” spirometric pattern; (FEV1/FVC≥0.70, FEV1<80% predicted); and 3). those with
airflow obstruction (FEV1/FVC<0.70) where severity was defined according to FEV1% predicted
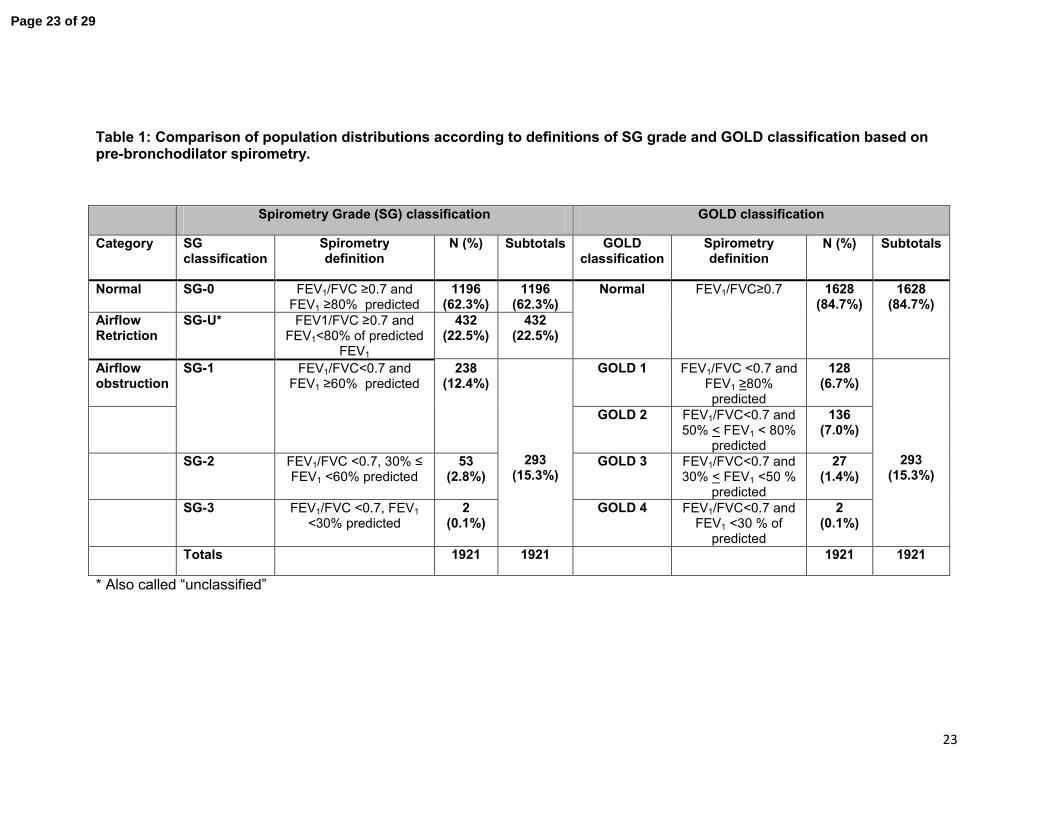
into SG 1-3 or GOLD 1-4. The definitions and distributions of these classifications are presented
in Table 1.
Dietary Assessment Dietary intake in the NHANES survey was determined from 2 interviewer
administered 24 hour recalls, developed and validated by the U.S. Department of Agriculture.
Page 5 of 29

6
Participants’ dietary intake of total fiber in grams per day was calculated [16,38]. The use of
fiber supplements was not included because of limited information.
Other Covariates To assess smoking status, survey participants were asked about current and
past tobacco use. Smoking status was defined as: never, former (smoked ˃100 cigarettes in
lifetime but does not currently smoke), and current (smoked ˃100 cigarettes in lifetime and
smokes currently). Subject height and weight were measured during the clinical examination
and were used to calculate body mass index (BMI). BMI categories were created based on the
World Health Organization BMI classifications [39] and participants were categorized as follows:
underweight: <18.5, normal range: 18.5-24.9, overweight: 25-30, and obese: >30. The ratio of
family income to poverty levels variable was used to adjust for socioeconomic status. C-reactive
protein (CRP) concentrations were included in the analysis as a biomarker of inflammation.
Statistical Analysis Mean and standard errors were used for descriptive statistics. To
incorporate the complex, multistage sampling design of the NHANES in the statistical analysis,
the SAS procedures SURVEYFREQ, SURVEYMEANS, SURVEYREG, and SURVEYLOGISTIC
were used. Univariate and multivariable regression models were used to look at the association
of lung function measurements and respiratory phenotypes with quartiles of dietary fiber intake.
The multivariable regression models were adjusted for the possible confounders of height, age,
gender, BMI, smoking, socioeconomic status, CRP, and energy intake. On the basis of other
literature, we also adjusted for the following factors: intakes of vitamin E, alpha-carotene, beta-
carotene, beta-cryptoxanthin, lycopene, lutein + zeaxanthin, vitamin C, and cured meat
[28,29,40]. Odds ratios and 95% confidence intervals were determined using PROC
SURVEYFREQ.
As smoking remains the most important cause of respiratory disease, we analyzed the
interaction between fiber intake and smoking status. A similar analysis was performed for BMI
Page 6 of 29

7
based on the BMI categories described above. In addition, recent literature has indicated that
diet may affect lung function differently based on gender [16], therefore a test for interaction
between fiber intake and gender was conducted and analysis was stratified based on gender for
variables with a positive interaction signal. All analyses accounted for the weighted data and
complex design of the NHANES sample. A p-value< 0.05 was considered statistically
significant.
Results The final number of eligible participants was 1,921. Overall, the cohort was 50.2% male
and 49.8% female. The mean age of the participants was 52.8 years with a mean BMI of 29.2.
Participants with a higher fiber intake tended to have a lower BMI, a higher intake of fruits,
vegetables, and whole grains, lower CRP, and higher energy intake than those with lower fiber
intakes. Lower intake of fiber was also associate with smoking. The demographic characteristics
of the sample by quartile of fiber intake are given in Table 2.
There was a statistically significant relationship between lung function measurements and
dietary fiber intake in both univariate models (data not shown) and multivariable models (Table
3). After adjusting for confounders (age, height, BMI, gender, energy intake, smoking status,
socioeconomic status, CRP, height and intake of other vitamins), participants in the highest
quartile intake of fiber intake (>17. 5 gms/day) had mean FEV1 and FVC measurements that
were 82 mL and 129 mL higher than the lowest quartile of intake (<10.5 gms/day) (p=0.05 and
0.01, respectively). Mean percent predicted FEV1 and FVC values were 2.4 and 2.8 percentage
points higher (respectively) in participants with the highest quartile intake when compared to
participants in the lowest fiber intake quartile (p=0.07 and 0.01, respectively). In contrast to the
other lung function parameters, where we found no gender effect with daily fiber intake, for FVC
an effect was found (p=0.003 for males but not females (p=0.84). There was no association
between fiber intake and FEV1/FVC ratio.
Page 7 of 29

8
To determine if associations differed by source of fiber, additional analysis was conducted for
servings/day of fruits/vegetables/legumes (cups/day) and daily whole grain intake (ounce
equivalents/day). Significant associations were present for intake of fruit/vegetables/legume
(Table 3), with participants who were in the highest quartile for daily fruit/vegetable/legume
intake having mean FEV1 and FVC 107 mL and 127 mL higher, respectively, than those in the
lowest quartile (p=0.001, p=0.006), and mean percent predicted FEV1 and FVC values that were
3.3% and 2.8% higher than participants in the lowest quartile intake (p=0.0009 and 0.007,
respectively). There was no association between lung function measurements and daily whole
grain intake (data not shown).
To investigate whether smoking status modified the associations of fiber with lung function,
each of the lung function outcomes were evaluated with fiber intake, smoking classification, and
the interaction between smoking and fiber intake. There was no significant interaction between
smoking and fiber for any of the outcomes (interaction terms p˃0.10). Similar results were found
for BMI, with no statistically significant interactions found between BMI and fiber intake related
to any of the lung function outcomes.
There was evidence of relationship between fiber intake, normal lung function and airflow
restriction. With increasing daily fiber intake, the percentage of those with normal lung function
increased (50.1% vs. 68.3% for Q1 vs. Q4, p=0.001) although the effect was attenuated at
quartiles 3 and 4 (Figure 1). For increasing daily fiber intake, there was a significant decline in
the proportion of participants with airflow restriction (29.8% vs. 14.8% for Q1 vs. Q4, p=0.001)
which again was attenuated at the higher quartiles (Figure 2). There was no relationship
between daily fiber intake and severity of airflow obstruction (data not shown).
Discussion
Page 8 of 29

9
In this analysis of the population-based NHANES study, we found that low fiber intake was
associated with lower lung function. These associations were consistent across sub-categories
of smoking and BMI. Of note, the beneficial association of high dietary fiber intake was
independent of antioxidant intake, intake of cured meat, and other possible dietary risks
associated with lung function decline. While we found no effect of dietary fiber on the
prevalence of airflow obstruction (SG-1-3 or GOLD 1-4) we did find a greater prevalence of
airflow restriction group in those with lowest dietary fiber intake (p=0.0001). We believe the
failure to identify an association with spirometric-defined airflow obstruction may be the
consequence of the low smoking exposure in this group and the overall low prevelance of
COPD. Our results are consistent with other cross-sectional studies showing there is a strong
fiber-smoking interaction on FEV1 that is considerably weaker when never smokers are
analyzed [9]. Our results build upon similar associations in earlier studies, including an analysis
of the Atherosclerosis Risk in Communities (ARIC) study that found participants in the highest
quintile of fiber intake had higher lung function measurements than those in the lowest quintile
[28]. Varraso and Hirayama have both reported significant, independent associations between
total fiber intake and risk of COPD [29,41]. Other studies have demonstrated that higher fiber
intakes are associated with 40-50% reduction in respiratory related deaths, compared to 25-
30% reductions for cardiovascular disease [42,43 ]. Taken together, these findings suggest
dietary fiber has considerable relevance to lung health, notably impaired lung function and
reduced respiratory mortality.
Intake of fruits, vegetables and legumes were associated with lung function in our study
independent of intake of antioxidants previously associated with lung function [44]. Several
studies have found stronger associations with intakes of whole fruit when compared to individual
fruit-related nutrients [6,11,45,46] such as vitamin C, suggesting that other compounds, or the
interaction of these compounds, may be more relevant. Dietary fiber has been one of the
Page 9 of 29
10
compounds speculated to contribute to the positive effect of fruits and vegetables on preserving
lung function [9]. Indeed adjustment for fiber has eliminated univariate associations between
fruit intake and FEV1 [47]. Interestingly, our results did not show an association between intakes
of whole grain foods and lung function, however whole grain intake may be poorly estimated in
only 2 days of diet recalls. The lack of this relationship in our study conflicts with previous
studies of fiber intake and COPD which stratified by fiber source and found the effects were due
mainly to cereal fibers [29]. The relationship between healthy diet and better lung health in
relastion to COPD was reported by Varraso and colleagues using a “Healthy Eating Index” [16].
Current evidence is not conclusive about which fiber containing foods are most beneficial for
COPD. Fiber occurs in both soluble and insoluble forms, and studies attempting to stratify by
fiber type have faced the challenge that foods usually contain a mix of both soluble and
insoluble fibers, making it difficult to determine if one type is more accountable.
There are several plausible mechanisms through which intake of fiber may impact lung function
and predispose to airflow restriction, and risk of COPD. Systemic inflammation is considered an
important sub-phenotype of COPD [48,49], and there are a growing number of studies that
show CRP is a marker of systemic inflammation, activation of the innate immune system and a
possible effector molecule in vascular disease [50-52]. Higher intakes of dietary fiber have been
associated with reduced systemic inflammation and CRP levels [53], and CRP levels have been
shown to have an inverse relationship with lung function and respiratory morbidity [50,54-60].
Consistent with other studies we did find that a higher fiber intake was associated with lower
CRP (Table 2) [61].
Attenuation of systemic inflammation may be only one of the mechanisms through which fiber
impacts lung function. Dietary fiber has been shown to change the composition of the gut
microbiome, in particular altering the ratio of Firmicutes to Bacteroidetes [61], consequently
increasing the concentrations of short-chain fatty acids (SCFA). These by-products of fiber
Page 10 of 29

11
fermentation in the gastrointestinal tract are found in the systemic circulation and have several
relevant protective functions with regard to lung function and COPD, including regulation of
neutrophils [62], and attenuating pulmonary inflammation and epithelial-based protection
against bacterial infection [63].
Our finding showing a trend toward a greater prevalence of those classified as airflow restriction
with low dietary fiber intake is novel. This airflow restrictive subgroup, which constituted 22.6%
of our older NHANES sample, includes those with a normal FEV1/FVC ratio but proportionately
reduced FVC and FEV1. This group has also been called PRISm, for Preserved Ratio Impaired
Spirometry, and has a reported prevalence of 5-18% in other studies (12% in COPDGene)
[64,65]. This group is highly heterogeneous as much as three sub-phenotypes defined in
COPDGene as “restrictive”, “early COPD” and “metabolic” [66]. Recent evidence shows that
many of the people in this subgroup have systemic inflammation, poor exercise capacity and
emphysema on computed tomography scanning, with or without airway inflammation [64]. This
group remains poorly characterized and invariably excluded from studies of COPD. It is possible
this group represents a separate and unique pulmonary phenotype which is, according to this
study, significantly over-represented in those with low dietary fiber intake. To our knowledge,
this is the first study to examine the association between dietary fiber intake and lung function
with regards to this otherwise poorly understood subgroup. As this subgroup has a high
prevalence of co-morbid conditions, and is highly symptomatic despite not meeting traditional
COPD criteria, they may represent a group that might benefit from targeted dietary interventions
to improve overall outcomes. However, it is also possible that evidence of this relationship
given was driven by residual confounding from obesity that was not well captured by BMI. BMI
is an imprecise measure of obesity and may not fully account for factors such as distribution of
fat mass. As truncal adipostity has been associated with lung function, it is possible this may
explain some of the the association between diet and a restrictive airflow pattern [66-68].
Page 11 of 29

12
Our study has several limitations. First, the NHANES data we analyzed is cross-sectional so we
cannot evaluate any temporal relationships, such as dietary fiber effects on lung function
decline, nor can we establish causality. It could be proposed that fiber is a surrogate measure
for an overall healthy lifestyle. Indeed, the recent study by Varraso and colleagues serves to
stress the importance of the overall diet quality in pulmonary health [16]. Studies have also
shown that increased intake of catechins and flavonoids are positively associated with
FEV1[69]. Improving the overall quality of the diet may drive an individual’s intake towards a
more plant-based diet, which would also be a diet rich in other beneficial nutrients such as
phytochemicals, antioxidants, flavonoids, or ligands. These nutrients may work in a synergistic
fashion and are much less likely to be accurately captured in current dietary studies where recall
over relatively short time periods are traditionally used to assess long-term intake. As lung
function reflects both maximal lung function attained in early adulthood and lung function lost
with aging [70], it is surprising we find an association at all between dietary fiber intake and
contemporaneous lung function measurements. Second, serum levels of nutritional antioxidatns
have been associated with lung function [71,72], and other studies of dietary fiber intake and
lung function have adjusted for this [73]. Serum levels of anti-oxidant nutrients were not
available for this NHANES cycle;however, we did include adjustment for intakes of these
nutrients in our models. Adjustment for physical activity, which is relevant to dietary choices,
was not adjusted for in this analysis and remains a potential sources of confounding. Third, this
study used pre-bronchodilator measurements for lung function rather than post-bronchodilator
values so it is harder to extrapolate our findings on dietary fiber intake and lung function in this
study to COPD. In this study we have used the fixed ratio (FEV1/FVC) to define the presence of
airflow limitation, consistent with other dietary studies, and found comparable results using the
lower limit of normal. Our study does have a major strength in our ability to use spirometry
measurements for identifying the presence of airflow limitation and accurately distinguish those
Page 12 of 29

13
with sub-normal lung function, as opposed to the self-reported diagnosis of COPD used in many
epidemiological studies.
Conclusions Low dietary fiber intake was associated with reduced measures of lung function,
an increased prevalence of participants with airway restriction. A diet rich in fiber-containing
foods may play a role in improving lung health.
Conflict of Interest disclosure: CH, EL, DM, ER, RH, RY have nothing to disclose. SR has
received reimbursement for attending a symposium, speaking and/or consulting from: ABIM,
Able Associates, Advantage Healthcare, Align2Action, Almirall, APT, ATS, AstraZeneca, Baxter,
Boehringer-Ingelheim, Chiesi, CIPLA, ClearView Healthcare, Cleveland Clinic, CME Incite,
Complete Medical Group, COPDFoundation, Cory Paeth, CSA, CSL, CTS Carmel, Dailchi
Sankyo, Decision Resources, Dunn Group, Easton Associates, Elevation Pharma, FirstWord,
Forest, Frankel Group, Gerson, GlaxoSmithKline, Gilead, Grifols, GroupH, Guidepoint Global,
Haymarket, HealthStar, Huron Consulting, Incite, Inthought, IntraMed (Forest), Johnson &
Johnson, LEK, McKinsey, Medical Knowledge, Mediummune, Methodist Health System, Dallas,
Navigant, NCI Consulting, Novartis Nuvis, Pearl, Penn Technology, Pfizer, PlanningShop,
Prescott, Pro Ed Comm, ProiMed, PSL FirstWord, Pulmatrix, Quadrant, Qwessential,
Regeneron, Saatchi and Saatchi, Schlesinger Associates, Strategic North, Synapse, Takeda,
Theron, WebMD
Literature Cited
1. The top 10 causes of death. World Health Organization Web site.
http://www.who.int/mediacentre/factsheets/fs310/en/. Updated 2014. Accessed 3/25, 2015.
2. Young RP, Hopkins R, Eaton TE. Forced expiratory volume in one second: Not just a lung
function test but a marker of premature death from all causes. Eur Respir J. 2007;30(4):616-
622.
Page 13 of 29

14
3. Young RP, J Hopkins R. Primary and secondary prevention of chronic obstructive pulmonary
disease: Where to next? Am J Respir Crit Care Med. 2014;190(7):839-840.
4. Hanson C, Sayles H, Rutten E, Wouters E, MacNee W, Calverley P, Meza J, Rennard S. The
association between dietary intake and the phenotypical characteristics of COPD in the
ECLIPSE cohort. Chronic Obstructive Pulmonary Diseases: The Journal of the COPD
Foundation. 2014;1(1):115-1247.
5. Grievink L, Smit HA, Ocke MC, van 't Veer P, Kromhout D. Dietary intake of antioxidant (pro)-
vitamins, respiratory symptoms and pulmonary function: The MORGEN study. Thorax.
1998;53(3):166-171.
6. Smit HA, Grievink L, Tabak C. Dietary influences on chronic obstructive lung disease and
asthma: A review of the epidemiological evidence. Proc Nutr Soc. 1999;58(2):309-319.
7. Britton JR, Pavord ID, Richards KA, et al. Dietary antioxidant vitamin intake and lung function
in the general population. Am J Respir Crit Care Med. 1995;151(5):1383-1387.
8. Hu G, Cassano PA. Antioxidant nutrients and pulmonary function: The Third National Health
and Nutrition Examination survey (NHANES III). Am J Epidemiol. 2000;151(10):975-981.
9. Tabak C, Smit HA, Heederik D, Ocke MC, Kromhout D. Diet and chronic obstructive
pulmonary disease: Independent beneficial effects of fruits, whole grains, and alcohol (the
MORGEN study). Clin Exp Allergy. 2001;31(5):747-755.
10. Tabak C, Smit HA, Rasanen L, et al. Dietary factors and pulmonary function: A cross
sectional study in middle aged men from three European countries. Thorax. 1999;54(11):1021-
1026.
Page 14 of 29

15
11. Tabak C, Feskens EJ, Heederik D, Kromhout D, Menotti A, Blackburn HW. Fruit and fish
consumption: A possible explanation for population differences in COPD mortality (the Seven
Countries Study). Eur J Clin Nutr. 1998;52(11):819-825.
12. McKeever TM, Lewis SA, Cassano PA, et al. Patterns of dietary intake and relation to
respiratory disease, forced expiratory volume in 1 s, and decline in 5-y forced expiratory volume.
Am J Clin Nutr. 2010;92(2):408-415.
13. McKeever TM, Scrivener S, Broadfield E, Jones Z, Britton J, Lewis SA. Prospective study of
diet and decline in lung function in a general population. Am J Respir Crit Care Med.
2002;165(9):1299-1303.
14. Bentley AR, Kritchevsky SB, Harris TB, et al. Dietary antioxidants and forced expiratory
volume in 1 s decline: The health, aging and body composition study. Eur Respir J.
2012;39(4):979-984.
15. Schwartz J, Weiss ST. Dietary factors and their relation to respiratory symptoms.The
second National Health and Nutrition Examination Survey. Am J Epidemiol. 1990;132(1):67-76.
16. Varraso R, Chiuve SE, Fung TT, et al. Alternate Healthy Eating Index 2010 and risk of
chronic obstructive pulmonary disease among US women and men: Prospective study. BMJ.
2015;350:h286.
17. Young RP, Hopkins RJ. TheHispanic paradox further unraveled? Thorax. 2014;69(2):184-
185.
18. Ning H, Van Horn L, Shay CM, Lloyd-Jones DM. Associations of dietary fiber intake with
long-term predicted cardiovascular disease risk and C-reactive protein levels (from the National
Health and Nutrition Examination survey data [2005-2010]). Am J Cardiol. 2014;113(2):287-291.
Page 15 of 29

16
19. Lairon D, Arnault N, Bertrais S, et al. Dietary fiber intake and risk factors for cardiovascular
disease in French adults. Am J Clin Nutr. 2005;82(6):1185-1194.
20. Ludwig DS, Pereira MA, Kroenke CH, et al. Dietary fiber, weight gain, and cardiovascular
disease risk factors in young adults. JAMA. 1999;282(16):1539-1546.
21. King DE, Mainous AG,3rd, Egan BM, Woolson RF, Geesey ME. Fiber and C-reactive
protein in diabetes, hypertension, and obesity. Diabetes Care. 2005;28(6):1487-1489.
22. Galisteo M, Duarte J, Zarzuelo A. Effects of dietary fibers on disturbances clustered in the
metabolic syndrome. J Nutr Biochem. 2008;19(2):71-84.
23. King DE, Mainous AG,3rd, Egan BM, Woolson RF, Geesey ME. Effect of psyllium fiber
supplementation on C-reactive protein: The Trial to Reduce Inflammatory Markers (TRIM). Ann
Fam Med. 2008;6(2):100-106.
24. King DE, Egan BM, Woolson RF, Mainous AG,3rd, Al-Solaiman Y, Jesri A. Effect of a high-
fiber diet vs a fiber-supplemented diet on C-reactive protein level. Arch Intern Med.
2007;167(5):502-506.
25. Ma Y, Griffith JA, Chasan-Taber L, et al. Association between dietary fiber and serum C-
reactive protein. Am J Clin Nutr. 2006;83(4):760-766.
26. Ma Y, Hebert JR, Li W, et al. Association between dietary fiber and markers of systemic
inflammation in the Women's Health Initiative Observational Study. Nutrition. 2008;24(10):941-
949.
27. Toraldo D, De Nuccio F, Scoditti E. Systemic inflammation in chronic obstructive pulmonary
disease: May diet play a theraputic role? J All Ther. 2013.
Page 16 of 29
17
28. Kan H, Stevens J, Heiss G, Rose KM, London SJ. Dietary fiber, lung function, and chronic
obstructive pulmonary disease in the Atherosclerosis Risk in Communities Study. Am J
Epidemiol. 2008;167(5):570-578.
29. Varraso R, Willett WC, Camargo CA,Jr. Prospective study of dietary fiber and risk of chronic
obstructive pulmonary disease among US women and men. Am J Epidemiol. 2010;171(7):776-
784.
30. Hanson C, Lyden E, Hopkins R, Rennard S, Mannino D, Young R. The relationship between
dietary fiber and lung function in NHANES. American Thoracic Society International Congress;
2015 May 15-20; Denver, CO AJRCC (191) 2015; abstract nr.A5405.
31. National Center for Health Statistics, National Health and Nutrition Examination Survey
(NHANES). http//www.cdc.gov/nchs/nhanes.htm. Accessed November, 2014.
32. Centers for Disease control and Prevention. Spirometry-1st test & 2nd test bronchodilator
studes. Centers for Disesae Control and Prevention website.
http://www.cdc.gov/nchs/nhanes/nhanes2009-20110/SPX_F.htm. Accessed November 1, 2014.
33. Ford ES, Mannino DM, Wheaton AG, Giles WH, Presley-Cantrell L, Croft JB. Trends in the
prevalence of obstructive and restrictive lung function among adults in the United States:
Findings from the National Health and Nutrition Examination Surveys from 1988-1994 to 2007-
2010. Chest. 2013;143(5):1395-1406.
34. Mannino DM, Ford ES, Redd SC. Obstructive and restrictive lung disease and markers of
inflammation: Data from the third National Health and Nutrition Examination. Am J Med.
2003;114(9):758-762.
35. Hankinson JL, Odencrantz JR, Fedan KB. Spirometric reference values from a sample of
the general U.S. population. Am J Respir Crit Care Med. 1999;159(1):179-187.
Page 17 of 29

18
36. Vestbo J, Hurd SS, Agusti AG, et al. Global strategy for the diagnosis, management and
prevention of chronic obstructive pulmonary disease, GOLD executive summary. Am J Respir
Crit Care Med. 2012.
37. Rennard S, Thomashow B, Crapo J, et al. Introducing the COPD foundation guide for
diagnosis and management of COPD, recommendations of the COPD foundation. COPD.
2013;10(3):378-389.
38. Anand J, Bodner-Montville J, Ahuja JKC, Goldman JD, Heendeniya KY, Moshfegh AJ. What
we eat in america, NHANES 2007-2008: Comparing day 1 and day 2 dietary data. FASEB J.
2011;25.
39. World Health Organization. Obesity and overweight. Obesity and Overweight Web site.
www.who.int/mediacentre. Updated March 2013. Accessed 12/6/2013, 2013.
40. Varraso R, Jiang R, Barr RG, Willett WC, Camargo CA,Jr. Prospective study of cured meats
consumption and risk of chronic obstructive pulmonary disease in men. Am J Epidemiol.
2007;166(12):1438-1445.
41. Hirayama F, Lee AH, Binns CW, et al. Do vegetables and fruits reduce the risk of chronic
obstructive pulmonary disease? A case-control study in Japan. Prev Med. 2009;49(2-3):184-
189.
42. Chuang SC, Norat T, Murphy N, et al. Fiber intake and total and cause-specific mortality in
the European Prospective Investigation into Cancer and Nutrition cohort. Am J Clin Nutr.
2012;96(1):164-174.
43. Park Y, Subar AF, Hollenbeck A, Schatzkin A. Dietary fiber intake and mortality in the NIH-
AARP Diet and Health study. Arch Intern Med. 2011;171(12):1061-1068.
Page 18 of 29
19
44. Hanson C, Rutten EP, Wouters EF, Rennard S. Diet and vitamin D as risk factors for lung
impairment and COPD. Transl Res. 2013;162(4):219-236.
45. Walda IC, Tabak C, Smit HA, et al. Diet and 20-year chronic obstructive pulmonary disease
mortality in middle-aged men from three European countries. Eur J Clin Nutr. 2002;56(7):638-
643.
46. Romieu I, Trenga C. Diet and obstructive lung diseases. Epidemiol Rev. 2001;23(2):268-
287.
47. Butler LM, Koh WP, Lee HP, Yu MC, London SJ. Dietary fiber and reduced cough with
phlegm: A cohort study in Singapore. Am J Respir Crit Care Med. 2004;170(3):279-287.
48. Sinden NJ, Stockley RA. Systemic inflammation and comorbidity in COPD: A result of
'overspill' of inflammatory mediators from the lungs? Review of the evidence. Thorax.
2010;65(10):930-936.
49. Broekhuizen R, Wouters EF, Creutzberg EC, Schols AM. Raised CRP levels mark metabolic
and functional impairment in advanced COPD. Thorax. 2006;61(1):17-22.
50. Gan WQ, Man SF, Senthilselvan A, Sin DD. Association between chronic obstructive
pulmonary disease and systemic inflammation: A systematic review and a meta-analysis.
Thorax. 2004;59(7):574-580.
51. Yende S, Waterer GW, Tolley EA, et al. Inflammatory markers are associated with
ventilatory limitation and muscle dysfunction in obstructive lung disease in well functioning
elderly subjects. Thorax. 2006;61(1):10-16.
52. Young RP, Hopkins R, Eaton TE. Pharmacological actions of statins: Potential utility in
COPD. Eur Respir Rev. 2009;18(114):222-232.
Page 19 of 29

20
53. Ajani UA, Ford ES, Mokdad AH. Dietary fiber and C-reactive protein: Findings from National
Health and Nutrition Examination survey data. J Nutr. 2004;134(5):1181-1185.
54. Pinto-Plata VM, Mullerova H, Toso JF, et al. C-reactive protein in patients with COPD,
control smokers and non-smokers. Thorax. 2006;61(1):23-28.
55. Rasmussen F, Mikkelsen D, Hancox RJ, et al. High-sensitive C-reactive protein is
associated with reduced lung function in young adults. Eur Respir J. 2009;33(2):382-388.
56. Ahmadi-Abhari S, Kaptoge S, Luben RN, Wareham NJ, Khaw KT. Longitudinal association
of C-reactive protein and lung function over 13 years: The EPIC-norfolk study. Am J Epidemiol.
2014;179(1):48-56.
57. Bolton CE, Schumacher W, Cockcroft JR, et al. The CRP genotype, serum levels and lung
function in men: The Caerphilly prospective study. Clin Sci (Lond). 2011;120(8):347-355.
58. Jiang R, Burke GL, Enright PL, et al. Inflammatory markers and longitudinal lung function
decline in the elderly. Am J Epidemiol. 2008;168(6):602-610.
59. Hancox RJ, Poulton R, Greene JM, et al. Systemic inflammation and lung function in young
adults. Thorax. 2007;62(12):1064-1068.
60. Shaaban R, Kony S, Driss F, et al. Change in C-reactive protein levels and FEV1 decline: A
longitudinal population-based study. Respir Med. 2006;100(12):2112-2120.
61. Trompette A, Gollwitzer ES, Yadava K, et al. Gut microbiota metabolism of dietary fiber
influences allergic airway disease and hematopoiesis. Nat Med. 2014;20(2):159-166.
62. Meijer K, de Vos P, Priebe MG. Butyrate and other short-chain fatty acids as modulators of
immunity: What relevance for health? Curr Opin Clin Nutr Metab Care. 2010;13(6):715-721.
Page 20 of 29

21
63. Fukuda S, Toh H, Hase K, et al. Bifidobacteria can protect from enteropathogenic infection
through production of acetate. Nature. 2011;469(7331):543-547.
64. Wan ES, Castaldi PJ, Cho MH, et al. Epidemiology, genetics, and subtyping of preserved
ratio impaired spirometry (PRISm) in COPDGene. Respir Res. 2014;15:89-014-0089-y.
65. Kurth L, Hnizdo E. Change in prevalence of restrictive lung impairment in the U.S.
population and associated risk factors: The National Health and Nutrition Examination Survey
(NHANES) 1988-1994 and 2007-2010. Multidiscip Respir Med. 2015;10(1):7-015-0003-6.
eCollection 2015.
66. Leone N, Courbon D, Thomas F, et al. Lung function impairment and metabolic syndrome:
The critical role of abdominal obesity. Am J Respir Crit Care Med. 2009;179(6):509-516.
67. Chen Y, Rennie D, Cormier YF, Dosman J. Waist circumference is associated with
pulmonary function in normal-weight, overweight, and obese subjects. Am J Clin Nutr.
2007;85(1):35-39.
68. Canoy D, Luben R, Welch A, et al. Abdominal obesity and respiratory function in men and
women in the EPIC-Norfolk study, United Kingdom. Am J Epidemiol. 2004;159(12):1140-1149.
69. Tabak C, Arts IC, Smit HA, Heederik D, Kromhout D. Chronic obstructive pulmonary disease
and intake of catechins, flavonols, and flavones: The MORGEN study. Am J Respir Crit Care
Med. 2001;164(1):61-64.
70. Lange P, Celli B, Agusti A, et al. Lung-function trajectories leading to chronic obstructive
pulmonary disease. N Engl J Med. 2015;373(2):111-122.
Page 21 of 29

22
71. Thyagarajan B, A Meyer K, Smith LJ, et al. Serum carotenoid concentrations predict lung
function evolution in young adults: The coronary artery risk development in young adults
(CARDIA) study. Am J Clin Nutr. 2011;94(5):1211-1218.
72. McKeever TM, Lewis SA, Smit HA, Burney P, Cassano PA, Britton J. A multivariate analysis
of serum nutrient levels and lung function. Respir Res. 2008;9:67.
73. Varraso R, Fung TT, Barr RG, Hu FB, Willett W, Camargo CA,Jr. Prospective study of
dietary patterns and chronic obstructive pulmonary disease among US women. Am J Clin Nutr.
2007;86(2):488-495.
Page 22 of 29
23
Table 1: Comparison of population distributions according to definitions of SG grade and GOLD classification based on pre-bronchodilator spirometry.
Spirometry Grade (SG) classification GOLD classification
Category SG classification
Spirometry definition
N (%) Subtotals GOLD classification
Spirometry definition
N (%) Subtotals
Normal SG-0 FEV1/FVC ≥0.7 and FEV1 ≥80% predicted
1196 (62.3%)
1196 (62.3%)
Normal FEV1/FVC≥0.7 1628 (84.7%)
1628 (84.7%)
Airflow Retriction
SG-U* FEV1/FVC ≥0.7 and FEV1<80% of predicted
FEV1
432 (22.5%)
432 (22.5%)
Airflow obstruction
SG-1 FEV1/FVC<0.7 and FEV1 ≥60% predicted
238 (12.4%)
293 (15.3%)
GOLD 1 FEV1/FVC <0.7 and FEV1 ≥80% predicted
128 (6.7%)
293 (15.3%)
GOLD 2 FEV1/FVC<0.7 and 50% < FEV1 < 80%
predicted
136 (7.0%)
SG-2 FEV1/FVC <0.7, 30% ≤ FEV1 <60% predicted
53 (2.8%)
GOLD 3 FEV1/FVC<0.7 and 30% < FEV1 <50 %
predicted
27 (1.4%)
SG-3 FEV1/FVC <0.7, FEV1 <30% predicted
2 (0.1%)
GOLD 4 FEV1/FVC<0.7 and FEV1 <30 % of
predicted
2 (0.1%)
Totals 1921 1921 1921 1921
* Also called “unclassified”
Page 23 of 29

24
Table 2: Participant characteristics stratified by energy-adjusted fiber intake quartile
Fiber Intake Quartile Mean (SE)
Characteristic: <10.75 grams/day (n=360)
10.75-<13.46 grams/day (n=461)
13.46-17.5 grams/day (n=529)
˃17.5 grams/day (n=571)
P-value
Continuous variables Mean (SD)
Age, yr 52.9 (0.5) 53.1 (0.5) 52.8 (0.5) 52.5 (0.3) 0.76
FEV1 (L) 2.6 (0.04) 3.0 (0.04) 3.1 (0.05) 3.2 (0.05) <0.0001
FEV1, %pred 80.9 (0.8) 86.6 (0.8) 89.0 (1.0) 90.6 (0.5) <0.0001
FVC (L) 3.3 (0.04) 3.9 (0.05) 4.1 (0.06) 4.3 (0.06) <0.0001
FVC, %pred 82.3 (0.7) 87.2 (0.8) 90.0 (0.9) 92.7 (0.6) <0.0001
FEV1/FVC ratio 0.76 (0.005) 0.77 (0.005) 0.76 (0.003) 0.76 (0.003) 0.079
Socioeconomic Status (income:poverty status ratio)
2.96 3.55 3.56 3.68 0.007
Fruit/vegetable/legume intake (cups/day)
1.5 (0.04) 2.1 (0.03) 2.8 (0.04) 3.6 (0.04) <0.0001
Whole grain intake (ounces/day)
0.22 (0.02) 0.47 (0.03) 0.89 (0.04) 2.4 (0.04) <0.0001
C-Reactive protein (mg/dL)
0.47 (0.5) 0.41 (0.06) 0.31 (0.04) 0.31 (0.05) 0.01
Energy intake (kcals/day) 1868.4 (48.8) 2076.7 (46.6)
2224.9 (48.5) 2368.9 (42.3) <0.0001
Cured meat intake (times per day)
0.22 (0.3) 0.25 (0.01) 0.27 (0.01) 0.26 (0.01) 0.37
Vitamin E intake (as α-tocopherol, mg)
6.7 (0.38) 7.9 (0.3) 9.2 (0.3) 9.3 (0.3) <0.0001
Αlpha-carotene intake (mcg)
325.9 (45.5) 323.3 (27.2)
505.6 (114.2) 533.8 (27.7) 0.0005
Beta-carotene intake (mcg)
1982.1 (284.5)
2053.9 (161.6)
2742.3 (312.6)
2863.5 (27.7) 0.019
Beta-cryptoxanthin intake (mcg)
55.5 (10.4) 73.4 (7.8) 77.4 (5.5) 126.9 (20.0) 0.026
Lycopene intake (mcg) 3565.7 (468.3)
5105.0 (634.2)
6331.4 (591.9)
6156.9 (653.0)
0.001
Lutein + zeaxanthin intake (mcg)
1402.5 (277.9)
1692.4 (192.5)
1972.8 (191.5) 1965.5 (241.5)
0.32
Vitamin C intake (mg) 59.0 (6.8) 87.3 (7.9) 86.0 (1.9) 106.5 (6.4) 0.002
BMI 29.8 (0.5) 29.8 (0.4) 28.9 (0.3) 28.4 (0.04) 0.035
Discrete variables N (%)
BMI Category:
Underweight: <18.5
Normal range: 18.5-24.6
Overweight: 25-30
Obese: ˃30
3 (0.6) 83 (28.1) 107 (28.7) 167 (42.6)
5 (1.1) 84 (21.0) 163 (36.1) 208 (41.8)
7 (2.3) 112 (22.8) 192 (38.0) 218 (36.9)
6 (1.6) 125 (26.5) 224 (38.7) 215 (33.2)
0.026
Gender Male Female
79 (18.4) 283 (81.6)
215 (45.2) 246 (54.8)
300 (54.9) 232 (45.1)
376 (64.9) 198 (35.1)
<0.0001
Smoking Never
162 (45.6)
239 (55.7)
275 (52.8)
313 (57.0)
0.0031
Page 24 of 29

25
Former Current
97 (27.6) 103 (26.8)
125 (29.7) 97 (14.6)
154 (30.7) 103 (16.5)
163 (28.5) 98 (14.5)
Spirometry Grade Classificaitons: Normal airflow Airflow restriction Airway obstruction
183 (50.1) 122 (29.8) 55 (20.1)
269 (50.1) 125 (29.7) 67 (16.9)
354 (67.0) 85 (14.1) 90 (18.9)
390 (68.3) 95 (14.8) 86 (17.0)
<0.0001
GOLD:
Normal
Airflow obstruction
305 (80.0)
55 (20.1)
394 (85.9)
67 (14.1)
444 (81.1)
85 (18.9)
485 (83.1)
86 (16.9)
0.35
Page 25 of 29

26
Table 3: Results of Multivariable Regression Models of Fiber Intake Quartiles and Lung Function Measurements*
*Models adjusted for age, BMI, energy intake, smoking status, height, gender, socioeconomic status, CRP, and intakes of alpha-tocopherol, alpha-carotene, beta-carotene, beta-cryptoxanthin, lycopene, luten+zeaxanthin, vitamin C, and cured meat.
Daily Fiber Intake Quartile (grms/d)
FEV1 (mL)
FVC (mL)
% Pred FEV1 % Pred FVC
β p-value β
p-value
β p-value β p-value
<10.75 Reference
10.75<13.46 36.8 0.28 25.3 0.45 1.4 0.23 0.75 0.34
13.46<17.5 82.3 0.04 115.2 0.003 2.7 0.03 2.7 0.003
>17.5 81.7 0.05 128.9 0.01 2.4 0.07 2.8 0.02
Daily Fruit/veg/ legume Intake (cups/day)
FEV1 (mL)
FVC (mL)
% Pred FEV1 % Pred FVC
β p-value β p-value β p-value β p-value
<1.69 Reference
1.69-<2.31 68.1 0.06 46.3 0.32 1.9 0.07 1.0 0.32
2.31-<3.07 28.0 0.47 75.1 0.18 0.96 0.43 1.5 0.23
>3.07 106.7 0.001 127.0 0.006 3.3 0.0009 2.8 0.007
Page 26 of 29

27
Figure Legend: Figure 1 Percent of participants with a normal airflow pattern according to the spirometry grading classification by each fiber intake quartile. Fiber intake key: Q1=<10.75 g/day, Q2=10.75-<13.46 g/day, Q3=13.46-17.5 g/day, Q4=>17.5 g/day
Figure Legend: Figure 2 Percent of participants with a restrictive airflow pattern according to the spirometry grading classification by each fiber intake quartile. Fiber intake key: Q1=<10.75 g/day, Q2=10.75-<13.46 g/day, Q3=13.46-17.5 g/day, Q4=>17.5 g/day
Page 27 of 29

Figure 1 Percent of participants with a normal airflow pattern according to the spirometry grading classification by each fiber intake quartile. Fiber intake key: Q1=<10.75 g/day, Q2=10.75-<13.46 g/day,
Q3=13.46-17.5 g/day, Q4=>17.5 g/day
152x89mm (300 x 300 DPI)
Page 28 of 29

Figure 2 Percent of participants with a restrictive airflow pattern according to the spirometry grading classification by each fiber intake quartile. Fiber intake key: Q1=<10.75 g/day, Q2=10.75-<13.46 g/day,
Q3=13.46-17.5 g/day, Q4=>17.5 g/day
152x89mm (300 x 300 DPI)
Page 29 of 29