the relation from capital structure to innovation strategy
TRANSCRIPT

1
The relation between capital structure and R&D strategy across different industries
A quantitative analysis
Danique Somhorst 920912785130 Chair-group: Management Studies
Supervisor: VC Materia Co-supervisor: S Pascucci

2
Table of contents Abstract ......................................................................................................................................................... 4
1. Introduction ........................................................................................................................................... 5
1.1 Background Information ..................................................................................................................... 5
1.2 Research objective & research questions ........................................................................................... 7
2. Methods ................................................................................................................................................ 9
2.1 Literature study ............................................................................................................................. 9
2.2 Quantitative analysis ..................................................................................................................... 9
3. Literature Study ................................................................................................................................... 10
3.1 R&D Strategies: in-house and outsourcing ................................................................................. 10
3.2 R&D Strategies; differences across industries............................................................................. 12
3.3 Combining two R&D strategies ................................................................................................... 13
3.4 Capital structure of a firm ........................................................................................................... 13
3.5 Hypotheses setting from literature review ................................................................................. 15
3.6 Control variable size .................................................................................................................... 17
4. Quantitative research .......................................................................................................................... 18
4.1 Data description .......................................................................................................................... 18
4.1.1 Origin of EFIGE and Amadeus .............................................................................................. 18
4.1.2 Description of dataset ......................................................................................................... 19
4.2 Methodology ............................................................................................................................... 21
4.3 Multicollinearity .......................................................................................................................... 23
5. Results ................................................................................................................................................. 25
5.1 Results on bivariate probit model ............................................................................................... 25
5.2 Results on bivariate probit model controlling for industries ...................................................... 26
6. Discussion ............................................................................................................................................ 29
6.1 Implication of results ......................................................................................................................... 29
7. Conclusions .......................................................................................................................................... 31
7.1 Conclusion of this research ............................................................................................................... 31
7.2 Suggestion for future research .......................................................................................................... 31
References ................................................................................................................................................... 32
Appendix I .................................................................................................................................................... 36
Appendix II ................................................................................................................................................... 37

3
List of figures
Figure 1 Research framework 8
Table 1 Hypotheses 16
Table 2 Selected industries for comparison 19
Table 3 Descriptive financials 20
Table 4 Correlation Matrix 23
Table 5 VIF table 24
Table 6 Results bivariate probit model 25/26
Table 7 Results bivariate probit model controlling for industries 26/27
Table 8 Overview hypotheses and conclusions 29
Table 9 Conclusions for differences across industries 30
4
Abstract In the last 20 years many researchers have focused on the development of innovation, the general belief
was that to come to innovation firms need to develop strong internal research & development (R&D) skills.
Nowadays more and more firms use external sources for R&D. However R&D will always have uncertain
outcomes and therefore financing can be of great interest in relation to R&D, for this research especially
the capital structure of the firm. This research focuses on the relationship from capital structure to R&D
strategy (in-house or outsourcing of R&D). Of special interest will be the relationship across different
industries. With use of a bivariate probit model, asset tangibility, leverage, liquidity, working capital, equity
and profitability will be investigated in relation to the in-house and outsourcing R&D strategy. This model
has been used because the assumption is that the two dependent variables, in-house and outsourcing
R&D are correlating. The results show that asset tangibility has a positive relationship towards the in-house
strategy of R&D. Long term leverage and liquidity show a negative relationship with the in-house strategy
of R&D. No significant results were found on the dependent variable of outsourcing R&D. In terms of
industries, 5 out of 6 industries show that being in that industry has a significant influence on the decision
for in-house R&D. For 2 out of 6 industries it is shown that being in that industries has a significant
influence on the decision to outsource R&D.

5
1. Introduction
1.1 Background Information In the last twenty years, several strands of research have focused on innovation and on the relevance of
innovation in organizations’ decision making and performances: on the one hand, organizations need to
innovate because of changing customer demands and lifestyles (Baregheh, Rowley and Sambrook, 2009);
on the other hand, they innovate to be able to exploit opportunities in technology and marketplaces,
structures and dynamics (Baregheh et al., 2009). It is also argued that innovation is essential for firms to
survive and to be competitive (Schumpeter, 1942; Zahra and Covin, 1994; Baregheh et al., 2009). What is
innovation? West and Farr (1989) have defined innovation as: ‘the intentional introduction and application
within a role, group or organization of ideas, processes, product or procedures, new to the relevant unit of
adoption, designed to significantly benefit role performance, the group, the organization or the wider
society’ (p.16). Du Plessis (2007) described innovation ‘as the creation of new knowledge and idea to
facilitate new business outcomes, aimed at improving internal business processes and structures and to
create market driven products and services’ (p.21). In the 1950’s, Solow (1957) stated that innovation and
technical progress were the main drivers for economic growth. Following this point of view, managers and
researchers believed that to come to innovation they should establish strong internal research &
development (R&D) capabilities. From the 1950’s the general belief was that inventions were generated
by researchers working in the firm, while engineers were able to turn ideas into commercial products
(Gassmann, 2006). This means that the exploitation and diffusion of innovation were driven by the firm
itself (Gassmann, 2006). However, since the 1980s the approach to innovation evolved. Stronger global
competition led to the sharing of labor and cooperation between firms for their innovation processes
(Gassmann, 2006). Consequently external sources of knowledge and innovation became increasingly
relevant (Porter and Stern, 2001). Firms became more open to cooperate in R&D projects with other
companies, internal R&D activities were more frequently replaced by contract research and external
development (Rigby and Zook, 2002; Chesbrough, 2003a). Nowadays, the biggest innovative organizations
cannot rely solely on internal sources: external knowledge is often required when developing innovation
(Rigby and Zook, 2002). This witnesses how in the last twenty years the paradigm shifted from a do-it-
yourself mentality to a more external knowledge sourcing strategy of R&D.
Whether firms decide to develop R&D capabilities internally (in-house) or externally (outsourcing), R&D
always produces uncertain outcomes. These uncertain outcomes make that financial constraints can
influence the investments made in R&D (Hall, 2002). Scientific work from Schumpeter (1942), Nelson
(1959) and Arrow (1962) first addressed the difficulties of financing R&D activities. The primary output of
resources that are allocated to the creation of innovation is knowledge, knowledge about how to create
the new goods or services. This knowledge brings the problem that it is not competing, the obtained
knowledge can also be used by other firms. In the early 2000’s Hall (2002) addressed that financing of R&D
mostly brings problems around three topic: asymmetric information, moral hazard and tax considerations
(Hall, 2002). Asymmetric information is in place when the inventor (or the firm) has better information
about the likelihood of success. In this case the investor will ask a higher risk premium compared to
ordinary project, because it will be more difficult for him to assess whether the (R&D) project is a ‘good’
project (Hall, 2002). High risks involved may cause informational frictions between internal employees like
the management and external people like investors (Bartolini, 2013). Secondly, moral hazard problems

6
arise if ownership and management of the firm are separated (Hall, 2002). Moral hazard problems can
occur when the management is spending money on projects that are benefiting them, and not necessarily
the owner(s) (for example shareholders). The opposite scenario can be that moral hazard problems arise
because the management is more risk averse then the owner(s), and therefore avoid risky R&D projects.
Last, tax considerations can bring problems because they can drive a wedge between the decision to
finance with retained earnings and external financing (Hall, 2002). R&D investments can also be influenced
because internal funds are not sufficient and access to external sources is limited because of uncertain
outcomes (Hall, 2002). The difficulties that can arise when investing in R&D make it very interesting to
investigate further in financing and R&D, especially how a firm’s financing structure is influencing its R&D
strategy. What also makes further investigation into the relationship between capital structure and
innovation interesting is the relevance of both concepts, capital structure of the firm and innovation.
Previously in this section the importance of innovation in relation for firm survival and competiveness is
discussed. But also the choice that a firm makes according their capital structure has a significant impact
on the value of the firm (Ridha and Bajka, 2010). Besides that, capital structure is not something static. It
changes constantly which makes it very difficult for managers to decide what is the optimal proportion
between debt and equity (Ridha and Bajka, 2010).
Previous research suggests that the relation between finance and innovation, runs from finance to
innovation (Bartolini, 2013). Bartolini (2013) has focused on the determinants of a firm’s capital structure
in relation to the propensity to innovate. Materia et al. (2015) have tried to explore the influence of capital
structure of firms on their innovation strategies especially for agri food firms. Still scientific literature that
is investing the relationship between capital structure and R&D, especially R&D strategy is lacking.
Therefore the interest of this thesis will be on capital structure in relation to R&D strategy. This thesis aims
at presenting an attempt to fill the knowledge gap. Special emphasize will be on the role of the industry in
which a firm is operating. Does the firms industry also makes a difference? Since an extensive dataset is
available with data of firms in different manufacturing industries, this will add knowledge.
The outcome of this research is of importance for different target groups. First business environments can
use the outcome of this research in how their capital structure can help and support their R&D strategies.
The knowledge will also help them with making choices related to investments for innovation. Authorities
involved in policies for innovation can use the outcome for better defining policies. This research will also
help in defining how innovation can be understood and influenced from a financial perspective. The final
aim of this research is to explore potential differences between industries, therefore firms can take
advantage of how other industries behave and are influenced.
7
1.2 Research objective & research questions The main objective of this thesis is to expand knowledge about the relation between capital structure of
firms and their R&D strategy. Much knowledge is available on the individual concepts, but the link between
the two is not sufficiently investigated. Since an extensive dataset of manufacturing firms is available, the
interest will be to explore the relationship between capital structure and innovation strategies across
different industries. This specific focus has not been investigated so far, by the best knowledge of the
researcher. The following research question will lead the research.
How is capital structure influencing the R&D strategy of a firm, and how is this differing across
industries?
To explore the relation and come to comprehensive conclusions, the research will be built up around
several sub-research questions. These research questions come together in the research framework in
figure 1 on page 8. The research framework gives a graphical representation of the two phases that need
to be passed through during this thesis, but also it shows how the different phases are built up. The
structure will be partly leaded by the following defined sub research questions.
a) How are capital structure and R&D strategies interrelated?
b) Which differences can be found in capital structure across different industries?
c) Which differences can be found in R&D across different industries?
The research framework will be elaborated on in the chapter 2. In this chapter the desk research and
quantitative analysis will be explained. In chapter 3, and extensive literature review (desk research) is
presented, while in chapter 4 a quantitative analyses is developed and discussed. Finally the results,
conclusions and discussion will be illustrated in chapter 5.

8
Figure 1 Research framework
Literature study Quantitative Analysis
Literature Review Quantitative analysis with use of
econometric model
b) Which differences can
be found in capital
structure across different
industries?
c) Which differences can be
found in R&D strategies
across different industries?
a) How are capital structure
and R&D strategy
interrelated?
Derive
hypotheses
Verify or reject
hypotheses and draw
final conclusions
Conclusion(s)
Identify
measurement
variables
Develop & run
bivariate probit
model

9
2. Methods
2.1 Literature study In the literature study, scientific literature will be researched extensively to define the current status quo
around R&D strategies and capital structure in relation to each other. Also an attempt will be done to
address where industries differ according capital structures and R&D strategies. In current literature little
attention has been paid to the specific relation between capital structure and R&D strategy, therefore it
may be necessary to consult a broad range of literature. For example from the fields of financial
management, R&D management, innovation management and economics. Literature that is not
specifically addressing the relation can also bring insights that lead to hypotheses, which eventually can
be tested during the quantitative analysis. At first the literature study tries to find knowledge about the
current status quo, based on this investigation hypotheses will be derived. Literature also need to be
consulted for finding the right measurement variables. Secondly once the hypotheses are derived,
literature needs to be consulted for finding the right measurement variables and how to build those
measurement variables.
2.2 Quantitative analysis After an extensive literature study, knowledge will be put into practice during the quantitative analysis.
The applicable econometric model will be explained, thereafter the model will be used. The model will test
independent measurement variables (capital structure) in relation to the dependent variable (R&D
strategy). Quantitative analysis will be used instead of qualitative research, because at the starting point
an extensive dataset seemed to be available for the research. This dataset contains rich information on a
broad range of topics from more than 15.000 European manufacturing firms. To make use of this available
information quantitative analysis seemed to be the most suitable empirical analysis.
Within the quantitative analysis of this thesis an econometric model will be used. This is the bivariate
probit model. Because of the scope of this thesis, the dependent variable innovation strategy is either in-
house or outsourcing. The bivariate probit model allows us to test for two correlated dependent variables.
This model will be introduced in more detail in chapter 4.2.

10
3. Literature Study
3.1 R&D Strategies: in-house and outsourcing Innovation is recognized as an important indicator of firm performance and competitiveness (Cruz-Cázare,
Bayona-Sáez and García-Marco, 2013; Han and Bae, 2014; Huang, Chung and Lin, 2009). To remain
competitive, firms need to strive for product innovation by considering internal and external R&D (Santoro
and Chakbrabarti, 2002). In the past, in-house R&D was favored, while more recently this has changed.
The internal R&D department is often not the only generator of innovation anymore (Howells, 1999a). The
role of in-house R&D has changed towards a more technical scanning role which is important in purchasing
and adapting (R&D) knowledge from external sources (Howells, 1999a; Santoro & Chalbrabarti, 2002). This
means that if in-house R&D is present, it can help in scanning and recognizing technological opportunities
(Howells, 1999a). Firms will also use in-house R&D to adequately evaluate, select and use external
knowledge (Howells, 1999b). Literature often refers to the decision executing in-house R&D or outsourcing
of R&D as the make or buy decision, this comes from the transactional cost approach first developed by
Coase (1937).
Literature suggests two main theories that can give an explanation behind the decision for in-house or
outsourcing strategy of R&D. These main theories are the transaction cost approach and the resource
based view on the firm. By explaining these two theories, the researcher wants to clarify what can be the
perspective behind choosing a certain R&D strategy. The transactional cost approach was first developed
by Coase (1937), in principal it suggests that everything that brings costs involves time, negotiation, writing
and enforcing of contracts. From a transactional cost approach, internalization (in-house strategy) will
minimize transaction costs if uncertainty, asset specificity and appropriability are high (Teece, 1986;
Williamson et al., 1989). If uncertainty, asset specificity and appropriability are low the outsourcing
decision will be preferred (Williamson et al., 1989). From this point of view the growth of externalization
has been driven by the decline of transaction costs involved, as compared to the costs of complete
internalization (Narula, 2001). Included in the transaction costs are: adaptation costs, safeguarding costs
and measurement costs. The adaptation costs are the costs that are involved with adjusting contracts.
Safeguarding costs are the costs to prevent opportunistic behavior from the outsourcing party once the
contract has been signed. Finally, the measurement costs are the costs for monitoring compliance to the
contract (Stanko and Calantone, 2011). The second main paradigm is the resourced based view of firms.
This basically suggests that firms will outsource their R&D if their own resources are not sufficient (Leiblein
and Miller, 2003). Related to the resourced based view, the core competences approach can explain why
a certain R&D strategy is chosen. Han & Bae (2014) state that ‘the core competences perspective
essentially means that firms conduct internal R&D or R&D outsourcing to increase their technological
competence and to supplement each other’ (p.7).
When firms choose to execute the R&D process in-house, they will carry out their own innovation process
without external sources. West (2002) stated that when firms develop R&D in-house, R&D is a unique
source of knowledge. However, the strategic advantage of internal R&D can be doubtful, since knowledge
workers are increasingly mobile. This can make it difficult for firms to appropriate and control their R&D
investments (Laursen and Salter, 2006). If firms decide to undertake R&D in-house, there must be an aim
for producing some type of proprietary innovation for the firm (Williamson, 1988). This means that if firms
want to be able to capture profits from the innovation, it should for example use legal mechanisms of
protection (Teece, 1986). Industries where products are really complex can face problems around the

11
appropiabilities and incentives. This is where in-house R&D can help solve the problems (Mol, 2005; Teece,
1986).
Besides the potential disadvantage of increasingly mobile workers, other disadvantages of choosing in-
house strategy of R&D can be the time that is needed to commercialize new products, and the less cost-
effectiveness of the strategy (West, 2002). These characteristics are riskier and less predictable and can
leave firms stuck with a single technology (Perrons and Plats, 2004). Choosing for the in-house strategy of
R&D can also bring other difficulties, as firms are path-dependent and they find it costly to break through
existing routines. Cusmano et al. (2008) suggest that there are high sunk costs involved with R&D.
Furthermore, additional costs can come along when switching in trajectories is needed. This may hinder
organizational change and increase the level of uncertainty (Nelson and Winter, 1982).
Opposite to in-house execution, external sourcing can be a strategy for R&D. The last three decades,
outsourcing became more and more common (Lonsdale & Cox, 2000). One of the main reasons for
outsourcing was the fact that remaining up to date with the supply chain activities, like assembly and
manufacturing, was costly (Lonsdale & Cox, 2000). Coffey and Bailly (1992) argue that firms have been
forced towards outsourcing because of four factors:
- Firms are subject to in-house technical limitations;
- Outsourcing firms can profit from economies of scale advantages;
- If demand for a certain service is diverse and different information is needed it may not be
economically feasible to execute it in-house;
- Firms can focus on core activities in which they excel compared to their competitors
Other reasons to start outsourcing are reduction of costs, convert fixed costs in to variable costs, improve
the time to the market and take advantage of the investments made by the supplier (Chesbrough and
Teece, 1998).
Nowadays outsourcing strategies are not only approached for specialized repetitive tasks, but also for
knowledge-intensive tasks like R&D (Howells, 2001; Leiblein, Reuer and Dalsace, 2002). The external
sourcing of these knowledge-intensive tasks is a result from the increasing speed of development of new
technologies. Firms find it not feasible to develop all these technologies internally and therefore they will
do it externally (Quinn and Hillmer, 1995). If the outsourcing strategy is compared to the in-house strategy,
outsourcing is more reliable and the outcome is more predictable, because the external sourced
technology has already been developed and tested (Kessler and Bierly, 2002). As with the in-house
strategy, also outsourcing has disadvantages. Howells (1999b) argues that outsourcing R&D is difficult
because of the high complexity that is involved in the process. Outsourcing is often suggested to be less
expensive, but on its own it does not create a competitive advantage, since the external sourced
knowledge is also available for competitors (Kessler and Bierly, 2002; West, 2002). Another issue when
considering outsourcing was already addressed in 1962 by Arrow: the problem of information asymmetry.
Information asymmetry exists when one party has more information than the other. Information
asymmetry will exist in relation to outsourcing when the client organization is not able the determine what
the quality is of the knowledge they are going to receive (Arrow, 1962).
To summarize, paragraph 3.1 first discussed the theoretical frameworks that can explain the choice for an
in-house or outsourcing strategy of R&D. The theoretical frameworks are the transaction cost approach
and the resource based view on the firm. These theories both can give a line of reasoning about when

12
firms decide to execute R&D in-house and when they want to outsource their R&D. Secondly this
paragraph gave a brief summary of the historical development of the in-house and outsourcing R&D
strategy. Last, the potential advantages and disadvantages of both strategies are discussed.
3.2 R&D Strategies; differences across industries According to the literature, outsourcing of R&D can be preferred for different reasons, and therefore
different outsourcing patterns across industries are expected. Cusmano et al. (2008) did an empirical
analysis on outsourcing of different functional categories in different industries. These functional
categories were production & assembling, R&D and design, and services. Around 75% of their sample
executed some research activities (R&D), but very few outsourced any of those activities. Firms in the
sample of Cusmano (2008) stated that the reason for this is the strategic relevance of the R&D activities.
Firms wanted to keep the R&D function close to the in-house core. Cusmano et al. (2008) concluded that
partial outsourcing is not likely to happen instead of outsourcing of R&D. If R&D outsourcing took place, it
was more likely to be outsourced completely instead of partially. In table I shown in Appendix I, it is shown
that in the sample of Cusmano et al. (2008) industries that outsource R&D activities mostly are
construction, energy & chemistry and electronics & optics (Cusmano et al. 2008). Coffey and Bailly (1992)
argue that outsourcing is most likely in highly evolving industries, which leads to the need of firms being
innovative and responsive. When industries undergo large numbers of technological changes, R&D should
be outsourced, because undertaking R&D in-house would be riskful since the market is continuously
changing (Noori, 1990). Following Cusmano et al. (2008) industries where the product life cycle is short
and strong competition is in place, also seem to outsource their R&D, because it is hard to develop all the
capabilities and competences internally. Those firms will focus on developing their core business, and
outsource non-core activities (Cusmano et al., 2008). When products in a certain industry become more
advanced and specialized technological understanding is needed for production, it is hard to develop all
the capabilities and competences that are needed to bring new products to the market internally
(Cusmano et al., 2008). Some authors state that the search for external knowledge (R&D) is influenced by
the richness of technological opportunities that are available and the extent to which other firms
undertake searching activities (Nelson and Winter, 1982; Levinthal and March, 1993). In industries where
many opportunities arise in the environment and other firms are highly investing in the search of external
knowledge, a firm will often need to undertake more extensive search to get access to critical external
knowledge. On the other hand, when the level of opportunities is low and other firms do not invest in
searching for external knowledge, the incentive to draw from external knowledge for a firm is weaker and
therefore it may rely on internal sources of knowledge (Klevorick et al, 1995). Also internal R&D can
become necessary when the technological changes are unpredictable (Shrivastava and Souder, 1987).
In this section different lines of reasoning are discussed around the choices firms in different industries
make on their R&D strategy. Cusmano et al. (2008) suggest outsourcing of R&D is not likely, because of
the strategic relevance. Others suggest that high evolving industries, with much competition and short
product lifecycles are more likely to outsource R&D, because it is not feasible to develop everything in-
house.

13
3.3 Combining two R&D strategies As stated in the introduction, authors like Rigby and Zook (2002) state that even the biggest innovative
organizations can not solely rely on internal sources. External knowledge will often be required when
developing innovation. A combination of internal and external sources of R&D can be used internal
knowledge will increase the marginal return on external knowledge (Cassiman and Veugelers, 2006). This
can be explained by using the concept of absorptive capacity. The absorptive capacity of a firm is
introduced by Cohen and Levinthal (1990) as ‘the ability of a firm to recognize the value of new
information, assimilate it and apply it to commercial ends’ (p.1). When in-house R&D is available, this
absorptive capacity will increase and this will create a better marginal return on external knowledge
(Cassiman and Veugelers, 2006). A close relationship between internal (in-house) and external supplier
(outsourcing party) will be suggested in the case of knowledge intensive activities. If internal capacity
disappears, the absorptive capacity will decrease (Mahnke, 2001). A make-buy strategy is considered to
be most common when the availability of technological resources is high. These technological resources
are conceived as the firms R&D intensity by Surroca and Santamaria (2007). Technological resources can
imply scale advantages, which makes it likely that vertical integration of R&D activities is possible. When
vertical integration of R&D activities will arise, the decrease of outsourcing R&D will be common
(Williamson, 1985; Harrigan, 1985).
3.4 Capital structure of a firm In the previous paragraphs an elaboration on R&D strategies is given. Whether firms will chose to perform
R&D in-house or to outsource R&D, R&D will have uncertain outcomes and this can lead to financial
constraints influencing the investments made in R&D (Hall, 2002). It may take years before R&D projects
start producing economic returns. If firms want to exploit opportunities in the marketplace, they can be
constrained if internal resources are limited to finance an innovative projects (Bartolini, 2013). Previous
research on the relation between capital structure and innovation suggests that the relation runs from
capital structure to innovation (Bartolini, 2013). There is also support for the opposite relation (from
innovation to capital structure), Bartolini (2013) suggests that this opposite relation can be interesting
specifically in the case of equity financing. This thesis will not specify on the subject of equity financing in
relation to R&D strategy, so no further investigation into the opposite relation will be executed. This thesis
assumes that the relation runs from capital structure to R&D strategy.
As introduced in the first chapter of this thesis, most problems in financing of R&D concern three topics:
asymmetric information, moral hazard and tax consideration (Hall, 2002). The problem of asymmetric
information can be explained by the pecking order theory of capital structure by Myers and Majluf (1984).
This theory assumes that financing can come from three sources, namely internal funds, debt and equity.
According to this view, firms prefer internal financing above external funds (debt and equity). The reason
behind this is adverse selection. Adverse selection occurs when one party has better information about
the situation then the other party, and therefore they can make decisions with more inside information
than the investor (asymmetric information). When using internal funds the problem of adverse selection
is not present, and therefore this will be more preferable (Myers and Majluf, 1984). If external funds are
needed, debt will be preferable over equity, because it has lower information costs. The adverse selection
problem also leads to investors who bring in equity will ask for higher rate of returns compared to debt
providers (Frank & Goyal, 2002). Hall (2002) suggests that debt and equity financing are a relatively
expensive form of financing, because it brings problems with asymmetric information and moral hazard.
Furthermore, external investors often have no specific knowledge to evaluate the impact of a new

14
innovation on a firm which brings high transaction costs (Williamson, 1988). Investments in R&D brings
special features, which can increase risk and reinforce information problems with external investors
(Savignac, 2006). However there are results that the pecking order theory is not always useful. Research
from Schafer, Werwatz and Zimmerman (2004) showed that high-tech firms in Germany are more likely
to use equity financing instead of debt financing for making investments in innovative projects. This implies
that there is credit rationing, where lenders limit additional credits for demanding borrowers. Also for
smaller (start-up) firms the pecking order can be questionable, since they may have less internal resources
for financing (Bartoloni, 2013).
In R&D specific assets are needed, which present a sunk cost that may have little value beyond their use
in the specific firm (Savignac, 2006). R&D creates mainly intangible assets, which cannot be used as a
collateral for external investors (Savignac, 2006). The intangible assets are embedded in human capital,
the employees of the firm. The intangible assets create the knowledge base of the firm, from which profit
will be generated in the future years (Hall, 2009). Because the knowledge is embedded in the employees
of the firm, it will be lost if the employees leave the firm (Hall, 2009). Intangible assets cannot be used as
collateral for external investors (Savignac, 2006), which Williamson (1988) calls non-redeployable assets.
Redeployable assets are those assets of which the value in alternative use is almost as high as in current
use, and they are more suitable for governance structures with more debt (Williamson, 1988). Tangible
assets can be plants, property and equipment, which are easier to value then intangible assets like goodwill
(Frank and Goyal, 2009). Following this line of reasoning, firms with more intangible assets are likely to be
less leveraged (Hall, 2002). Williamson (1988) stated that redeployable assets will be more likely to be
financed with debt, and with non-redeployable assets equity financing will become preferable.
In literature related to capital structure, profitability is often used as a proxy of capital structure of firms
(Booth et al., 2001; Graham & Harvey, 2001; Rajan & Zingales, 1995). Profitability is related to the
availability of internal funds, and therefore it may also be associated with less leverage under the pecking
order theory perspective. The general suggestion is that more profitable firms tend to invest more in R&D.
This can be a problem for younger firms, which cannot accumulate earlier profits to invest in R&D
(Czarnitzki and Binz, 2008).
Liquidity management is used in many organizations to see if a firm has enough liquid assets to meet the
current payment schedule (Saleem and Ur Rehman, 2011). Different liquidity ratios can be used such as
the current ratio, quick ratio and acid test ratio. Within these ratios cash and near-cash assets (current
assets) are compared with the current liabilities, to see the firm’s ability for payment. Firms with fewer
currents assets can have problems with continuing their daily operations, and firms with too much current
assets show that their return on investment is not optimal (Horne and Wachowicz, 2000). A higher liquidity
can suggest that a firm is in a better financial condition. In addition Madrid‐Guijarr et al. (2009) concluded
that if firms increase debt and reduce liquidity, their innovation activities will decrease.
In this section of the literature study I have discussed different aspects from capital structures that are of
special interest in relation to R&D. The pecking order theory is discussed as background for choices made
on capital structure. Then leverage and asset tangibility are discussed because of the intangible assets that
R&D creates. Profitability is discussed as it creates available internal funds and lastly, liquidity indicates
the ability of a firm to meet its payment schedule. If possible the concepts were discussed in context with
R&D.
15
3.5 Hypotheses setting from literature review In this paragraph hypotheses are derived from the literature review that has been executed in the
previous paragraphs of this chapter.
In the literature review two related concepts are discussed, asset tangibility and leverage. Asset tangibility
is often used as an indicator for leverage (Harris and Raviv, 1991; Booth et al., 2001), but in this thesis we
will discuss them separately. Asset tangibility is derived as a ratio of a firms fixed assets compared to total
assets (Savignac, 2006). This ratio indicates which proportion of total assets can serve as a collateral
(Savignac, 2006). When tangibility of assets is low, the suggestion is that a big part of the firm’s assets
consists of employees and their knowledge, which is functional for the development of R&D activities
inside the firm. This leads to following hypotheses:
Hypothesis 1: A lower asset tangibility ratio signals a higher chance of selecting the in-house strategy for
R&D.
Leverage has been discussed previously. Different definitions for leverage are used in literature, but what
they all have in common is that they measure a debt ratio. The differences arise whether book or market
values are used and whether total debt or only long term debt is used. For this research leverage will be
measured as proportion non-current liabilities of total assets. A high leverage ratio shows that there is
much debt as a proportion of total assets. When performing R&D, outcome uncertainty plays an important
role (Hall, 2002). When much debt is involved, we suggest that investors ask for results, and then
outsourcing R&D is the best option since it brings more reliable and predictable technologies (Kessler and
Bierly, 2002). From Hall (2009) the same line of reasoning can be derived: firms with low leverage are more
likely to execute R&D in-house because they have less redeployable assets that suit a governance structure
with much debt.
Hypothesis 2: A higher leverage ratio signals a higher probability of selecting the outsourcing strategy for
R&D.
In the literature review it is discussed that liquidity management is used to see whether firms have enough
liquid assets to meet the current payment schedule. It also represents how much liquid resources are
available to spend after all current liabilities are paid (Materia et al., 2015). Measurements for addressing
liquidity are the liquidity ratio and working capital. The liquidity ratio measures the ability of a firm to pay
its current liabilities and working capital is the amount of money available after current assets have payed
current liabilities. For this research the liquidity ratios is already available in the dataset and working capital
will be measured as the natural logarithm of the difference between current assets and current liabilities.
The suggestion is that firms with a better liquidity are in a better financial condition, which leads to the
following hypotheses:
Hypothesis 3: A higher liquidity ratio signals a higher probability of selecting the in-house strategy for R&D
Hypothesis 4: The availability of more working capital signals a higher probability of selecting the in-house
strategy for R&D.
From the pecking order theory perspective of Myers and Majluf (1984), equity is the least preferable
option of financing. Equity can bring problems with adverse selection and information costs. Williamson
(1988) suggests that equity financing is preferable in case asset specificity is high and assets are non-

16
redeployable (Williamson, 1988). R&D creates intangible and often highly specialized assets (Hall, 2002).
The suggestion can be made that the presence of equity makes internal R&D more preferable. To measure
the availability of equity, we will use the proportion of shareholders’ funds of total assets. The hypothesis
is:
Hypothesis 5: When the amount of equity as part of total assets becomes higher, the firm is more likely
to select an in-house strategy for R&D.
Frank and Goyal (2009) distinguish six core factors of market leverage, which they see as the firm’s capital
structure. One of these six core factors is profitability. Different input measures for profitability can be
used. Return on equity shows how much a firm earns for every euro that is invested by a shareholder and
also return on assets can be used since it shows how a firm is employing its assets to make profit. For this
research the last measurement method will be used. The hypothesis is that more profitable firms are
better able to attract external sources for financing, but also for external knowledge.
Hypothesis 6: A higher profitability of a firm signals a higher probability of selecting the outsourcing
strategy for R&D.
To summarize, in Table 1 the six different hypotheses can be found.
Table 1 Hypotheses
Variable Measurement
variable
Hypotheses
1 Asset Tangibility Asset tangibility (AT) A lower asset tangibility ratio signals a
higher change of selecting the in-house
strategy for R&D.
2 Leverage Long term leverage
(LTLEV)
A higher leverage ratio signals a higher
probability of selecting the outsourcing
strategy for R&D.
3 Liquidity Liquidity (LIQ) A higher liquidity ratio signals a higher
probability of selecting the in-house strategy
for R&D
4 Working Capital Working capital (WC) The availability of more working capital
signals a higher probability of selecting the
in-house strategy for R&D.
5 Equity Equity over total assets
(SH / TA)
When the amount of equity as part of total
assets becomes higher, the firm is more likely
to select an in-house strategy for R&D.
6 Profitability Return on assets (ROA) A higher profitability of a firm signals a
higher probability of selecting the
outsourcing strategy for R&D.
17
3.6 Control variable: firm size The six hypotheses will be included in the final econometric model. Also another control variable will be
added. This control variable will not be of main interest, but firm size will be covered. In general larger
firms have better financial means and qualified personnel so that they can develop R&D internally (Tsai &
Wang, 2009). Because of these financial means they can also undertake riskier activities compared to
smaller firms (Tsai & Wang, 2009). Research of Harhoff (1998) also suggests that smaller firms may be
constrained in undertaking R&D activities, because financial resources are lacking. Firm size will be
measured in terms of total assets. This measure will be used because it is a commonly used proxy for firm
size. Dang & Li (2015) have investigated 87 papers in corporate finance, 49 of those papers used total
assets as indicator for firm size. With measuring total assets, all resources of the firm are covered.

18
4. Quantitative research In this chapter, three paragraphs will depict different aspects of the quantitative research. First in
paragraph 4.1 a description of the data will be given. Secondly, in paragraph 4.2 the econometric model
that is the foundation of the quantitative analysis will be illustrated. And finally in paragraph 4.3 the
measurement indicators will be discussed, which will explain how the different variables derived in
literature review will be measured from the dataset.
4.1 Data description The empirical analysis of this thesis is based on a combined dataset that is derived from EFIGE and
Amadeus. First the origin of the datasets will be discussed, second a general description of the dataset will
be given.
4.1.1 Origin of EFIGE and Amadeus The EFIGE dataset is collected by the European think thank Bruegel. Bruegel is a European think thank with
a specialization in economics (Bruegel, 2015). The EFIGE data set is collected within the EFIGE project, “The
European Firms in a Global Economy; internal policies for external competitiveness”. Special of this dataset
is the combination in measuring internal-to-the-firm activities with items as R&D and innovation, labour
organization, financing and pricing (Almonte & Aquilante, 2012). The sample consists of 14.759
manufacturing firms in seven European countries (Germany, France, Italy, Hungary, Spain, United
Kingdom, Austria) (Almonte & Aquilante, 2012). Data in this dataset are collected in 2010 by surveying
firms in the seven European countries, and it covers a time span from 2007 till 2009 (Almont & Aquilante,
2012).
The EFIGE dataset is combined with data from Amadeus. Amadeus is a product from Bureau van Dijk,
which covers extensive information on around 21 million firms across Europe (Bureau van Dijk, 2015). This
combination has been made so that financial figures can be added to the EFIGE dataset. In this way the
same firms can be traced not only around the EFIGE themes, but also around their financial figures.
Amadeus contains information such as company financials, directors, financial strength indicators, market
research etcetera (Bureau van Dijk, 2015). For this thesis only for the firms listed in the EFIGE dataset
financial information is acquired, financial information covers for example the value of intangible assets,
total assets, sales and cash flow. The data acquired for the COMPETE project this thesis is part of1, cover a
time span from 2001 till 2009.
Together, EFIGE and AMADEUS create the dataset for this thesis. Information on several topics is available,
only specific information will be used for the aim of this thesis. EFIGE covers information on six different
topics:
• Structure of the firms (company ownership, domestic and foreign control, management)
• Workforce (skills, type of contracts, domestic vs. migrant workers, training)
• Investment, technological innovation, R&D (and related financing)
• Export and internationalization processes
• Market structure and competition
• Financial structure and bank-firm relationship
1 This thesis is part of the COMPETE project, supported by the European Commission’s Seventh Framework Programme (Contract No 312029).
The authors have benefited from access to the EU-EFIGE/Bruegel-UniCredit database, managed by Bruegel and funded by the European Union’s
Seventh Framework Programme ([FP7/2007-2013] under grant agreement n° 225551), as well as by UniCredit.

19
For the aim of this thesis, information on the workforce, export and internationalization will be left out.
Following the NACE Rev. 2 classification from the statistical office of the European communities (Eurostat,
2015), the majority of the combined dataset (12866 firms) falls into section C of manufacturing firms. In
section C manufacturing firms are further classified into divisions, groups and classes. In the manufacturing
section (C), 24 divisions are in place. Some examples of the divisions within the manufacturing section are:
manufactures of food products, manufacturer of paper and paper products, manufacturer of fabricated
metal products and manufacturers of rubber and plastic products. In appendix II a list can be found of the
distribution of the 24 different divisions.
For comparison across industries, six of the 24 divisions in section C will be used. These six divisions, from
now on called industries, are the industries that count most firms in the total sample. Table 2 depicts the
industries that will be explored. The six industries are chosen because the expectation is that they have
enough observations to obtain reliable results. Other industries cover a smaller range of firms. In the
current situation the six industries can be explored very deeply and a reasonable comparison due to time
constraints can be made.
Table 2 Selected industries for comparison
Division
(according to
NACE rev 2.)
Description # of firms in sample
10 Manufacture of food products 1198
22 Manufacture of rubber and plastic products 853
23 Manufacture of other non-metallic mineral
products
635
25 Manufacture of fabricated metal products, except
machinery and equipment
2852
26 Manufacture of computer, electronic and optical
products
586
28 Manufacture of machinery and equipment 1400
4.1.2 Description of dataset In the list shown in appendix II, the distribution of the total sample can be found. It shows us that most
firms in the sample are manufacturers of fabricated metal products (2852 firms), machines and equipment
(1400 firms), food products (1198 firms), rubber and plastic products (853 firms), non-metallic mineral
products (635 firms) or of computer, electronic and optical products (586 firms). Together they make up
almost 59% of the sample.
The distribution of the total sample across countries shows that the majority of the firms in the sample is
situated in Italy (23,3%), Spain (21,6%), France (21,4%) and Germany (21,2%). Together they represent
almost 88% of the sample. Hungary, Austria and the United Kingdom represent the remaining part.

20
Looking at the annual turnover (2008) of firms in the total sample, shows that almost half of the sample
(5818 firms) reported an annual turnover between 2 and 10 million euros. 2748 firms have reported an
annual turnover that is between 1 and 2 million euros, only 1% of the sample reports an annual turnover
above 250 million euros. This thesis will try to explore more about the relationship between capital
structure and R&D strategy. Therefore, it seems interesting spend some time looking at descriptive
indicators related to these two topics. if we look at the main shareholders of the firms, the majority of
firms is owned by an individual or a group of individuals, namely 9471 firms. When considering the
introduction of innovation, 4841 (37% of the sample) firms report that between 2007 and 2009 they have
introduced either a product innovation or a process innovation. 3571 (28%) firms have introduced a
product and a process innovation, and 4470 (35%) firms have not introduced any innovation.
In Table 3 descriptive information can be found on financial information that is related to the stated
variables of capital structure. In paragraph 3.5 an explanation is given on how these variables will be used
to build the indicators for the variables of capital structure (asset tangibility, long term leverage etc.). The
number observations tells us the number of firms in the total dataset that filled in the value of the variable.
The number of observations show us that less firms have filled in the value of their long term liabilities and
sales, compared to fixed assets, current assets, total assets and shareholders’ funds. All the numbers under
mean are in euros except for liquidity, liquidity gives us the ratio which indicates how the firm is able to
pay its current liabilities. The value of 1,5 tells us that on average, firms are able to pay 1,5 times their
current liabilities with their current assets.
Table 3 Descriptive financials
Variable Observations Mean Std. Dev. Min Max
Fixed Assets 9820 5.728 64.757 0,00 4.812.889
Current assets 9816 8.805 77.413 0,64 5.311.778
Total Assets 9819 14.531 138.464 0,76 10.100.000
Long term Liabilities 8024 1.675 13.033 -199.264 521.576
Current liabilities 9486 6.836 77.852 0,00 5.727.994
Sales 8113 17.379 141.516 63 6.816.284
Liquidity 8817 1,53 2,20 0,00 55
Shareholders’ funds 9821 5.306 53.647 -115.082 4.062.767
* Source: EFIGE and Amadeus dataset (Bruegel, 2015; Bureau van Dijk, 2015)

21
4.2 Methodology Before the actual testing can start , the underlying model needs to be identified. As we saw in chapter 2.2,
in the quantitative analysis we will make use of a binary choice model. The binary choice model enables
modelling a firm that can choose between two alternatives and the probability that a firm will choose one
of the alternatives. In our case, a firm choses between innovating in-house or outsourcing. The in-house
R&D strategy can take value 0 or 1 and so does the R&D outsourcing strategy. Such variables (with value
0 or 1) are called dummies, and are discrete variables. In the model we adopt 𝑦1 for R&D strategy in-house,
and it will take the value of 1 if the firm is executing R&D in-house and 0 if the firm is not executing R&D
in-house. Then 𝑦2 stands for R&D strategy outsourcing, which will take the value of 1 if the firm is
outsourcing R&D and 0 if the firm is not outsourcing R&D. When 𝑦1 and 𝑦2 both take the value of one, a
firm is executing R&D in-house and outsourcing R&D at the same time.
The binary choice model will be explained further according Verbeek (2004). Essentially the model
describes the probability that 𝑦𝑖. =1, which can be illustrated in the following function
𝑃{𝑦𝑖 = 1|𝑥𝑖} = 𝐺(𝑥𝑖, 𝛽)
The probability of 𝑦𝑖 taking value 1 depends on the individual characteristics 𝑥𝑖. Often the binary choice
model is derived from an underlying latent variable model (Verbeek, 2004). This is often used when
behavioral assumptions are not made (Verbeek, 2004). For each firm (j) we can write the utility difference
for choosing strategy s or not, as a function of observed characteristics (xj) and unobserved characteristics
𝜀𝑗. The error term 𝜀𝑗 is included to count for the variables that are not taken into account in the model.
Noted as: 𝑦𝑗𝑠∗ = 𝑥𝑗
′𝛽𝑠 + 𝜀𝑗𝑠
This 𝑦𝑗𝑠∗ is unobserved, and is called a latent variable. Here the assumption is that a firm will choose a
certain strategy if the utility difference is exceeding a certain threshold level (Verbeek, 2004). This can be
seen in the following addition to the function for 𝑦𝑠𝑗∗ :
𝑦𝑗𝑠 = 1 𝑖𝑓 𝑦𝑗𝑠∗ > 0 ∀𝑠 ∈ 𝑆
𝑦𝑗𝑠 = 0 𝑜𝑡ℎ𝑒𝑟𝑤𝑖𝑠𝑒
If 𝑥𝑗are the characteristics (capital structure) of the firm that influence the 𝑌𝑗𝑠∗ . The assumption that a firm
j will choose strategy s can be illustrated in the following equation. Where F is the distribution of the error
terms (𝜀𝑗𝑠).
𝛾𝑗𝑠 = 𝑃(𝑦𝑗𝑠 = 1) = 𝑃(𝑦𝑗𝑠∗ > 0) = 𝑃(𝑥𝑗
′𝛽𝑠 + 𝜀𝑗𝑠 > 0) = 𝑃(𝜀𝑗𝑠 > −𝑥𝑗′𝛽𝑠) = 𝐹(𝑥𝑗
′𝛽𝑠)
The underlying binary choice model is assumed to follow a cumulative normal distribution. Where the
underlying normal variables will turn into a discrete outcome (0 or 1) when a certain threshold is crossed
(𝑦𝑗𝑠∗ ). As mentioned earlier, firms can choose both R&D strategies. This means in this thesis two dependent
variables are present, so also two latent variables (𝑦𝑗𝑠∗ ) are present. The two equation model with s=1 for
in-house and s=2 for outsourcing will be:
𝑦𝑗1∗ = 𝑥𝑗
′𝛽1 + 𝜀𝑗1, 𝑦𝑗1 = 1 𝑖𝑓 𝑦𝑗1∗ > 0,
𝑦𝑗1 = 0 𝑜𝑡ℎ𝑒𝑟𝑤𝑖𝑠𝑒
𝑦𝑗2∗ = 𝑥𝑗
′𝛽2 + 𝜀𝑗2, 𝑦𝑗2 = 1 𝑖𝑓 𝑦𝑗2∗ > 0
22
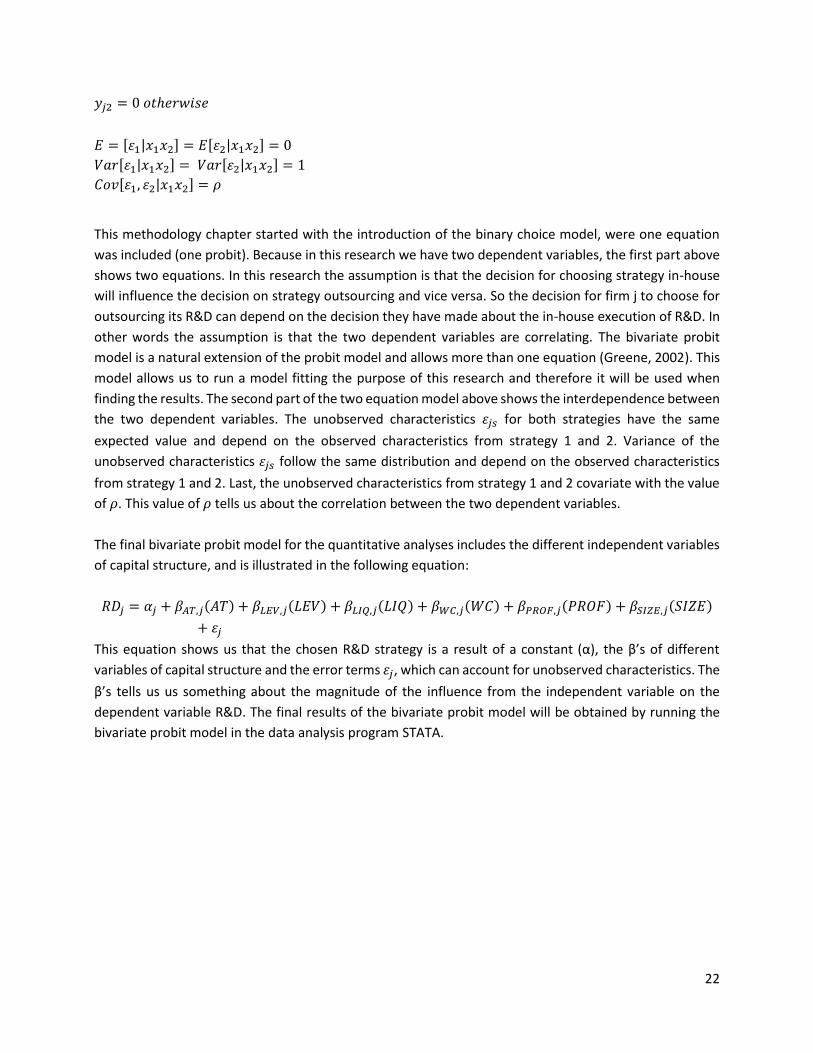
𝑦𝑗2 = 0 𝑜𝑡ℎ𝑒𝑟𝑤𝑖𝑠𝑒
𝐸 = [𝜀1|𝑥1𝑥2] = 𝐸[𝜀2|𝑥1𝑥2] = 0
𝑉𝑎𝑟[𝜀1|𝑥1𝑥2] = 𝑉𝑎𝑟[𝜀2|𝑥1𝑥2] = 1
𝐶𝑜𝑣[𝜀1, 𝜀2|𝑥1𝑥2] = 𝜌
This methodology chapter started with the introduction of the binary choice model, were one equation
was included (one probit). Because in this research we have two dependent variables, the first part above
shows two equations. In this research the assumption is that the decision for choosing strategy in-house
will influence the decision on strategy outsourcing and vice versa. So the decision for firm j to choose for
outsourcing its R&D can depend on the decision they have made about the in-house execution of R&D. In
other words the assumption is that the two dependent variables are correlating. The bivariate probit
model is a natural extension of the probit model and allows more than one equation (Greene, 2002). This
model allows us to run a model fitting the purpose of this research and therefore it will be used when
finding the results. The second part of the two equation model above shows the interdependence between
the two dependent variables. The unobserved characteristics 𝜀𝑗𝑠 for both strategies have the same
expected value and depend on the observed characteristics from strategy 1 and 2. Variance of the
unobserved characteristics 𝜀𝑗𝑠 follow the same distribution and depend on the observed characteristics
from strategy 1 and 2. Last, the unobserved characteristics from strategy 1 and 2 covariate with the value
of 𝜌. This value of 𝜌 tells us about the correlation between the two dependent variables.
The final bivariate probit model for the quantitative analyses includes the different independent variables
of capital structure, and is illustrated in the following equation:
𝑅𝐷𝑗 = 𝛼𝑗 + 𝛽𝐴𝑇,𝑗(𝐴𝑇) + 𝛽𝐿𝐸𝑉,𝑗(𝐿𝐸𝑉) + 𝛽𝐿𝐼𝑄,𝑗(𝐿𝐼𝑄) + 𝛽𝑊𝐶,𝑗(𝑊𝐶) + 𝛽𝑃𝑅𝑂𝐹,𝑗(𝑃𝑅𝑂𝐹) + 𝛽𝑆𝐼𝑍𝐸,𝑗(𝑆𝐼𝑍𝐸)
+ 𝜀𝑗
This equation shows us that the chosen R&D strategy is a result of a constant (α), the β’s of different
variables of capital structure and the error terms 𝜀𝑗, which can account for unobserved characteristics. The
β’s tells us us something about the magnitude of the influence from the independent variable on the
dependent variable R&D. The final results of the bivariate probit model will be obtained by running the
bivariate probit model in the data analysis program STATA.

23
4.3 Multicollinearity Before we can run de binary choice model, we need to test for multicollinearity. A multicollinearity
problem can exist when an approximate linear relationship among the explanatory variables leads to
results that are unreliable (Verbeek, 2004). If the correlation between two or more variables is too high,
this can lead to unreliable results. When two or more variables are highly correlated, it may be hard to
identify the individual impact of the variables in the model (Verbeek, 2004). To asses if there is a
multicollinearity problem, different methods can be used. In this thesis a combination of an correlation
matrix and the variance inflation factor (VIF) will be used (Ott and Longnecker, 2010). This combination is
used because it can be the case that only a correlation matrix is not enough to reveal the full extent of an
collinearity problem (Ott and Longnecker, 2010). The correlation matrix shows the correlations between
the independent variables and VIF shows how much of the variance of a coefficient is increased because
of collinearity (Ott and Longnecker, 2010). When the value of VIF exceeds 10, there is strong evidence of
collinearity problems (Ott and Longnecker, 2010). In Table 4 the correlation matrix can be found. The
results show us that long term leverage and asset tangibility, shareholders ‘funds over total assets and
long term leverage, shareholders’ funds over total assets and liquidity, shareholders’ funds over total
assets and working capital, shareholders’ funds over total assets and return on assets have a correlation
coefficient that is bigger then 0,3 or smaller then -0,3. To see whether this will cause problems around
multicollinearity, in Table 5 the VIF Table is shown.
Table 4 Correlation Matrix
In-house Outsourcing
AT LTLEV LIQ WC SH / TA ROA
In-house 1.000
Outsourcing 0.187 1.000
AT 0.036 0.032 1.000
LTLEV 0.055 0.025 0.356 1.000
LIQ -0.046 -0.017 -0.061 -0.083 1.000
WC 0.212 0.090 -0.032 -0.002 0.236 1.000
SH / TA -0.010 -0.006 0.148 -0.382 0.463 0.364 1.000
ROA -0.012 -0.016 -0.090 -0.183 0.176 0.158 0.353 1.000

24
Table 5 VIF table
Variable VIF 1/VIF
SH_TA 2.22 0.451
LTLEV 1.61 0.621
AT 1.42 0.702
LIQ 1.36 0.736
WC 1.23 0.815
ROA 1.17 0.854
Mean VIF 1.5
Table 5 shows us the VIF values belonging to the correlation matrix. From this VIF table we can conclude
that all VIF values are far below 10 so there is no signal of multicollinearity.

25
5. Results In this chapter the results of running the bivariate probit model will be discussed, first the full model,
second the model when controlling for industries will be addressed.
5.1 Results on bivariate probit model The first attempt of the bivariate probit model has been done without adding any dummy variables
controlling for industries. By doing this, the initial model will be researched independent of industry. The
results can be found in Table 6 below. In total 5010 observations were useful for running this model, this
means that for 5010 firms out of 12866 all variables from the model contained data and could be used.
Number of obs. = 5010 Wald chi2(14) = 392.20 Prob. > chi2 = 0.0000 Table 6 Results bivariate probit model
In-house R&D Coef. Std. Err. z P>z
AT -0.399 0.167 -2.380 0.017***
LTLEV 0.502 0.221 2.270 0.023***
LIQ -0.052 0.014 -3.760 0.000***
WC 0.024 0.027 0.890 0.375
SH_TA 0.138 0.145 0.950 0.343
ROA -0.250 0.263 -0.950 0.343
SIZE TA 0.235 0.030 7.800 0.000***
_cons -2.013 0.131 -15.320 0.000
Outsourcing
AT -0.103 0.218 -0.470 0.635
LTLEV 0.175 0.281 0.620 0.534
LIQ -0.019 0.018 -1.050 0.296
WC -0.010 0.034 -0.280 0.780
SH_TA 0.063 0.191 0.330 0.743
ROA -0.347 0.327 -1.060 0.288
SIZE TA 0.152 0.038 4.010 0.000***
_cons -2.371 0.164 -14.490 0.000
26
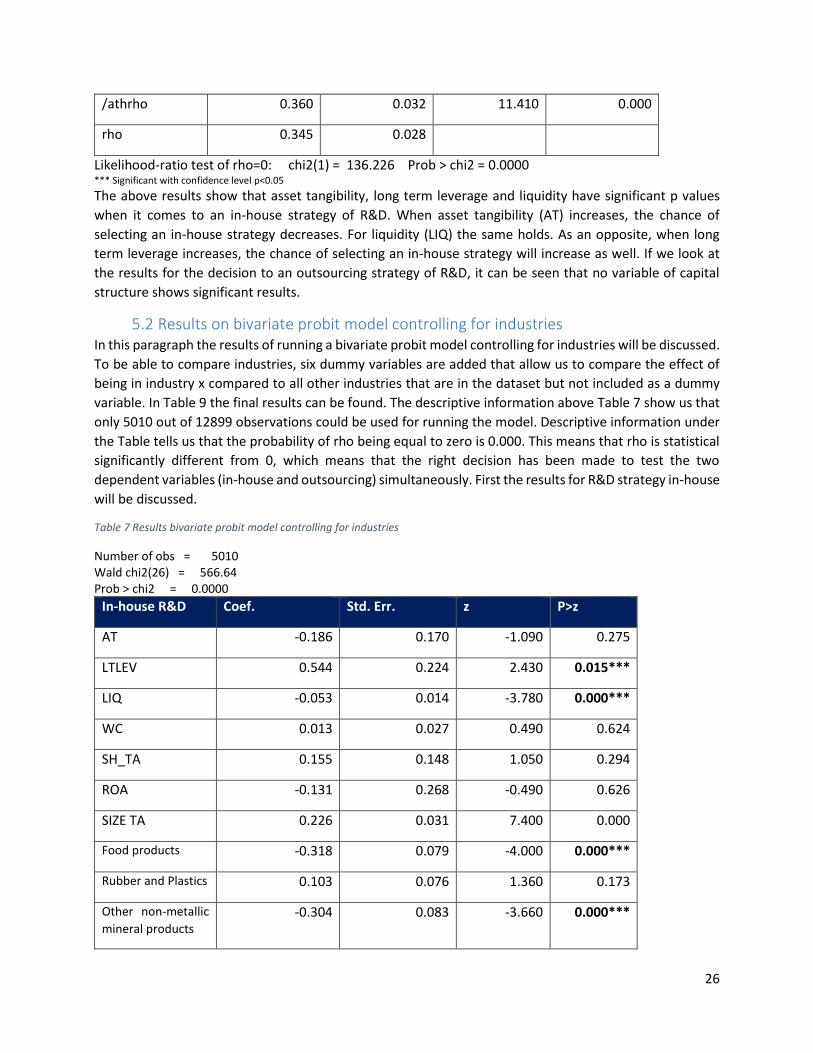
/athrho 0.360 0.032 11.410 0.000
rho 0.345 0.028
Likelihood-ratio test of rho=0: chi2(1) = 136.226 Prob > chi2 = 0.0000 *** Significant with confidence level p<0.05
The above results show that asset tangibility, long term leverage and liquidity have significant p values
when it comes to an in-house strategy of R&D. When asset tangibility (AT) increases, the chance of
selecting an in-house strategy decreases. For liquidity (LIQ) the same holds. As an opposite, when long
term leverage increases, the chance of selecting an in-house strategy will increase as well. If we look at
the results for the decision to an outsourcing strategy of R&D, it can be seen that no variable of capital
structure shows significant results.
5.2 Results on bivariate probit model controlling for industries In this paragraph the results of running a bivariate probit model controlling for industries will be discussed.
To be able to compare industries, six dummy variables are added that allow us to compare the effect of
being in industry x compared to all other industries that are in the dataset but not included as a dummy
variable. In Table 9 the final results can be found. The descriptive information above Table 7 show us that
only 5010 out of 12899 observations could be used for running the model. Descriptive information under
the Table tells us that the probability of rho being equal to zero is 0.000. This means that rho is statistical
significantly different from 0, which means that the right decision has been made to test the two
dependent variables (in-house and outsourcing) simultaneously. First the results for R&D strategy in-house
will be discussed.
Table 7 Results bivariate probit model controlling for industries
Number of obs = 5010 Wald chi2(26) = 566.64 Prob > chi2 = 0.0000
In-house R&D Coef. Std. Err. z P>z
AT -0.186 0.170 -1.090 0.275
LTLEV 0.544 0.224 2.430 0.015***
LIQ -0.053 0.014 -3.780 0.000***
WC 0.013 0.027 0.490 0.624
SH_TA 0.155 0.148 1.050 0.294
ROA -0.131 0.268 -0.490 0.626
SIZE TA 0.226 0.031 7.400 0.000
Food products -0.318 0.079 -4.000 0.000***
Rubber and Plastics 0.103 0.076 1.360 0.173
Other non-metallic
mineral products -0.304 0.083 -3.660 0.000***

27
Fabricated metal
products -0.240 0.048 -5.030 0.000***
Computer and
electronics 0.552 0.090 6.120 0.000***
Machinery &
Equipment 0.467 0.063 7.420 0.000***
_cons -1.927 0.137 -14.040 0.000
Outsourcing
AT -0.051 0.220 -0.230 0.817
LTLEV 0.165 0.283 0.580 0.560
LIQ -0.022 0.018 -1.190 0.236
WC -0.013 0.034 -0.380 0.702
SH_TA 0.063 0.192 0.330 0.745
ROA -0.301 0.329 -0.920 0.360
SIZE TA 0.151 0.038 3.960 0.000
Food products -0.174 0.103 -1.690 0.092**
Rubber and Plastics 0.037 0.095 0.380 0.701
Other non-metallic
mineral products -0.126 0.109 -1.160 0.247
Fabricated metal
products -0.095 0.063 -1.510 0.131
Computer and
electronics 0.229 0.100 2.280 0.023***
Machinery &
Equipment -0.073 0.077 -0.950 0.345
_cons -2.317 0.170 -13.660 0.000
/athrho 0.359 0.032 11.230 0.000
rho 0.344 0.028
Likelihood-ratio test of rho=0: chi2(1) = 132.206 Prob > chi2 = 0.0000 ** Significant with confidence level p<0.10 *** Significant with confidence level p<0.05

28
If we look at the upper side of Table 7, we see the results for dependent variable in-house R&D. These
results show that being in industry 10 (food products), 23 (non-metallic minerals) and 25 (fabricated metal
products) makes it less likely to select the in-house strategy for R&D compared to being in all other
industries not included in as a dummy variable. Being in industry 26 (computer, electronics, optical
products or 28 (machinery) (compared to all industries not included as a dummy), will influence the
likelihood of selecting the in-house strategy of R&D in a positive way. Furthermore long term leverage and
liquidity show a significant coefficient. Long term leverage shows a highly positive coefficient, so long term
leverage increases the chance of selecting an in-house strategy for R&D. Liquidity shows a slightly negative
coefficient, which indicates that if liquidity increases the likelihood of selecting in-house R&D decreases.
Compared to the results of the full binary model without dummy variables for industries, asset tangibility
(AT) became insignificant. This means that adding dummy variables for industries reduces the effect of
asset tangibility.
When the results of the outsourcing strategy are interpreted, it is shown that depending on the
significance level we use, being in industry 10 (food products) (compared to all industries not included as
a dummy) has a negative impact on the likelihood of selecting an outsourcing strategy of R&D. In contrast
being in industry 26 (computer, electronics, optical products)(compared to all industries not included as a
dummy) is increasing the chance of selecting an outsourcing strategy of R&D. If we look at the different
variables of capital structure in relation to outsourcing R&D we see that no variable is showing significant
results. In the next chapter the implications of the results will be discussed.

29
6. Discussion
6.1 Implication of results This thesis has investigated the relationship between capital structure and innovation strategies. The main
focus of this research was to fill the knowledge gap on the influence of capital structure on R&D strategy
across different industries. The attempt to fill this gap is done by running a bivariate probit model, where
5010 observations from firms in manufacturing industries have been used.
In this chapter it will be discussed what the implications are of the previous discussed results when it
comes to the hypotheses set at the start of this thesis. In Table 8 an overview of the hypotheses, results
an implication can be found. We will reject or verify the hypotheses. From the results that are related to
this specific dataset, one hypotheses can be verified, two can be rejected and three other hypotheses
cannot be verified or rejected, because the results are not significant. In addition, one of the main aims of
this research was to deepen the knowledge about the differences across industries. The conclusion here
is that being in a certain industry can influence the decision to execute R&D in-house or by outsourcing.
An overview can be found in Table 9.
Table 8 Overview hypotheses and conclusions
Number Variable Hypotheses Conclusion
1 AT A lower asset tangibility ratio signals a
higher change of selecting the in-house
strategy for R&D.
Verified
2 LTLEV A higher leverage ratio signals a higher
probability of selecting the outsourcing
strategy for R&D.
Rejected. A higher leverage ratio
signals a higher probability of
selecting the in-house strategy of
R&D.
3 LIQ A higher liquidity ratio signals a higher
probability of selecting the in-house
strategy for R&D.
Rejected. Small coefficient is
found, but shows: A higher
liquidity ratio signals a lower
probability of selecting the in-
house strategy for R&D.
4 WC The availability of more working capital
signals a higher probability of selecting
the in-house strategy for R&D.
No significant results are found
5 SH/TA When the amount of equity as part of
total assets becomes higher, the firm is
more likely to select an in-house
strategy for R&D.
No significant results are found
6 PROF A higher profitability of a firm signals a
higher probability of selecting the
outsourcing strategy for R&D.
No significant results are found
30
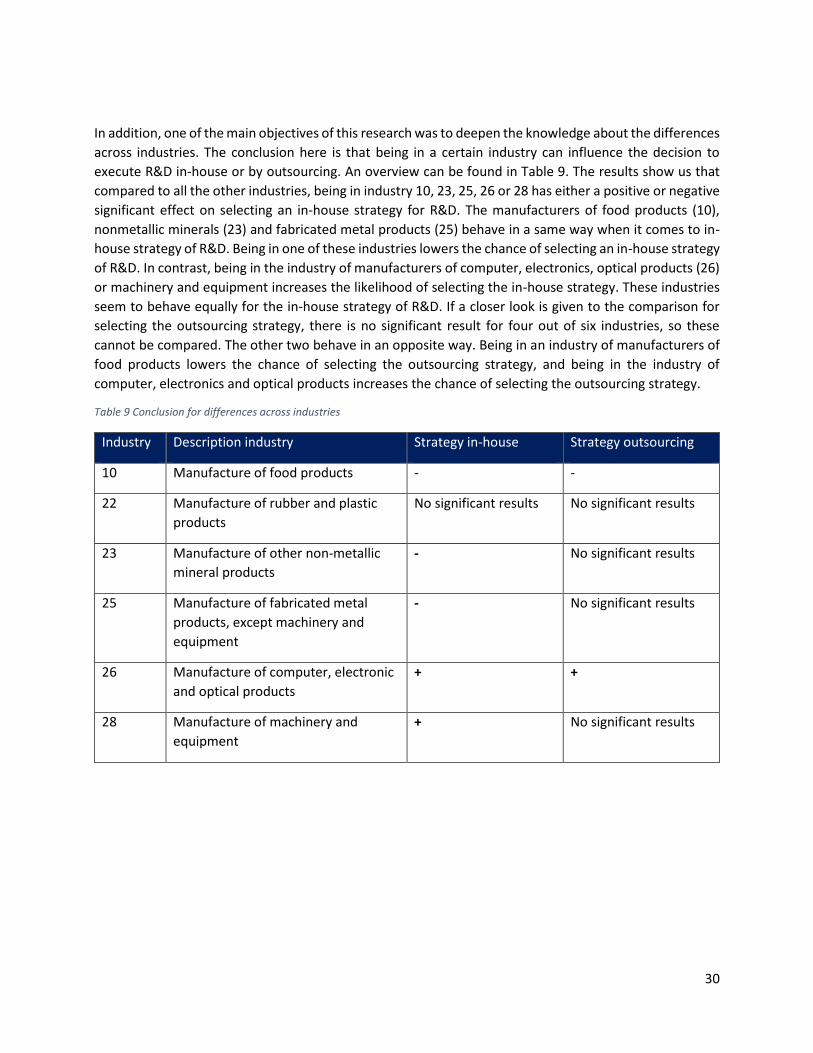
In addition, one of the main objectives of this research was to deepen the knowledge about the differences
across industries. The conclusion here is that being in a certain industry can influence the decision to
execute R&D in-house or by outsourcing. An overview can be found in Table 9. The results show us that
compared to all the other industries, being in industry 10, 23, 25, 26 or 28 has either a positive or negative
significant effect on selecting an in-house strategy for R&D. The manufacturers of food products (10),
nonmetallic minerals (23) and fabricated metal products (25) behave in a same way when it comes to in-
house strategy of R&D. Being in one of these industries lowers the chance of selecting an in-house strategy
of R&D. In contrast, being in the industry of manufacturers of computer, electronics, optical products (26)
or machinery and equipment increases the likelihood of selecting the in-house strategy. These industries
seem to behave equally for the in-house strategy of R&D. If a closer look is given to the comparison for
selecting the outsourcing strategy, there is no significant result for four out of six industries, so these
cannot be compared. The other two behave in an opposite way. Being in an industry of manufacturers of
food products lowers the chance of selecting the outsourcing strategy, and being in the industry of
computer, electronics and optical products increases the chance of selecting the outsourcing strategy.
Table 9 Conclusion for differences across industries
Industry Description industry Strategy in-house Strategy outsourcing
10 Manufacture of food products - -
22 Manufacture of rubber and plastic
products
No significant results No significant results
23 Manufacture of other non-metallic
mineral products
- No significant results
25 Manufacture of fabricated metal
products, except machinery and
equipment
- No significant results
26 Manufacture of computer, electronic
and optical products
+ +
28 Manufacture of machinery and
equipment
+ No significant results

31
7. Conclusions
7.1 Conclusion of this research The main objective of this thesis was to explore the relationship between capital structure and R&D
strategy across different industries, with special use of quantitative analysis. Combining scientific
information from an extensive literature and the rich information of the EFIGE dataset that has been used,
brought interesting results. Part of the hypotheses could be either rejected or verified, others did not
brought significant results. Still the research has added information to the scientific knowledge. The main
results are:
For asset tangibility, long term leverage and liquidity a significant relationship it can be concluded
that they have a significant effect on the decision of R&D strategy.
Industries do not behave in the same way when it comes to their R&D strategy. If we look at the
decision for in-house R&D, being in 5 out of 6 industries is influencing the decision to execute
R&D in-house.
7.2 Suggestions for future research In this thesis an extensive literature study has focused on exploring R&D strategies and capital structure.
Although many studies have analyzed these concepts individually, still the scientific literature on the
connections between them is limited. Further investigation is desirable. For this thesis, the choice has been
made to measure R&D strategy based on one question in the survey data used. This was useful and in line
with the timeframe of this thesis. For further research more indicators for in-house and outsourcing R&D
can be found, so that the reliability will increase. With more indicators, more fundamental support can be
found in whether firms make use of an in-house or outsourcing strategy. In the current situation
information is relying on the person filling in the survey, of which one can suggest that the reliability is
questionable. Next to enlargement in the number of indicators, future research can focus more on first
assessing the situation of the firm instead of relying on the information the firm gives, so that all firms are
assessed from the same perspective. This research has focused on firms that are making a decision about
either an outsourcing strategy of R&D or an in-house strategy, which are tested with use of an bivariate
probit model. This choice has been made because of time constraints and focus, but the research did not
take into account firms that choose both strategies for R&D. This would also be very interesting because
it can be the case that many firms undertake two strategies next to each other. Furthermore during this
thesis the focus was on the relation that runs from capital structure to R&D strategy, because this is most
common in literature. The result of this thesis can pop up the question whether this assumption is right.
Many variables of capital structure do not show significant results for both R&D strategies, which can be
a sign of a relation in the opposite direction. To explore this, further research is needed.
This thesis does not only have implications for the scientific knowledge base but also for policy-makers
and managers. With help of this thesis, managers can optimize their R&D strategy with looking at the
current arrangement of its capital structure. Policy-makers will now have more knowledge on how
different industries behave and can align policies to help and support firms in their decision making.

32
References Arrow, K. (1962). Economic welfare and the allocation of resources for invention. In The rate and direction
of inventive activity: Economic and social factors (pp. 609-626). Princeton University Press.
Baregheh Rowley and Sambrook et al 2009
Bartoloni, E. (2013). Capital structure and innovation: causality and determinants. Empirica, 40(1), 111-151. Booth, L., Aivazian, V., Demirguc-Kunt, A., & Maksimovic, V. (2001). Capital structures in developing countries. Journal of finance, 87-130. Bruegel (2015). Bruegel at a glance. Access on 10th of October from http://bruegel.org/about/ Cassiman, B., & Veugelers, R. (2002). Complementarity in the innovation strategy: internal R&D, external technology acquisition and cooperation. Cassiman, B., & Veugelers, R. (2006). In search of complementarity in innovation strategy: Internal R&D and external knowledge acquisition.Management science, 52(1), 68-82. Chesbrough, H. W., & Teece, D. J. (1998). When is virtual virtuous? Organizing for innovation. The
Strategic Management of Intellectual Capital, 27.
Coase, R. H. (1937). The nature of the firm. economica, 4(16), 386-405.
Coffey, W. J., & Bailly, A. S. (1992). Producer services and systems of flexible production. Urban
Studies, 29(6), 857-868.
Cohen, W. M., & Levinthal, D. A. (1990). Absorptive capacity: a new perspective on learning and
innovation. Administrative science quarterly, 128-152.
Cruz-Cázares, C., Bayona-Sáez, C., & García-Marco, T. (2013). Make, buy or both? R&D strategy
selection. Journal of Engineering and Technology Management, 30(3), 227-245.
Cusmano, L., Mancusi, M. L., & Morrison, A. (2010). Globalization of production and innovation: how
outsourcing is reshaping an advanced manufacturing area. Regional studies, 44(3), 235-252.
Czarnitzki, D., & Binz, H. (2008). R&D investment and financing constraints of small and medium-sized
firms. Small Business Economics, 36(1), 65-83.
Dang, C., & Li, F. (2015). Measuring firm size in empirical corporate finance. Working Paper University of Western Ontario. Du Plessis, M. (2007). The role of knowledge management in innovation. Journal of knowledge management, 11(4), 20-29. Frank, M. Z., & Goyal, V. K. (2002). Testing the pecking order theory of capital structure. Frank, M. Z., & Goyal, V. K. (2009). Capital structure decisions: which factors are reliably important?. Financial management, 38(1), 1-37.

33
Gassmann, O. (2006). Opening up the innovation process: towards an agenda. R&d Management, 36(3), 223-228. Graham, J. R., & Harvey, C. R. (2001). The theory and practice of corporate finance: Evidence from the
field. Journal of financial economics, 60(2), 187-243.
Greene, W. H. (2002). Econometric analysis. Upper Saddle River, N.J: Prentice Hall.
Hall, B. H. (2002). The financing of research and development. Oxford review of economic policy, 18(1),
35-51.
Hall, B. H., & Lerner, J. (2010). The financing of R&D and innovation.Handbook of the Economics of
Innovation, 1, 609-639.
Han, S. Y., & Bae, S. J. (2014). Internalization of R&D outsourcing: An empirical study. International
Journal of Production Economics, 150, 58-73.
Harrigan, K. R. (1985). Vertical integration and corporate strategy. Academy of Management
journal, 28(2), 397-425.
Harris, M., & Raviv, A. (1991). The theory of capital structure. the Journal of Finance, 46(1), 297-355.
Van Horne, J. C., & Wachowicz, J. M. (2008). Fundamentals of financial management. Pearson Education.
Howells, J. (1999a). Research and technology outsourcing. Technology Analysis & Strategic
Management, 11(1), 17-29.
Howells, J. (1999b). Research and technology outsourcing and innovation systems: an exploratory
analysis. Industry and Innovation, 6(1), 111-129.
Howells, J., Gagliardi, D., & Malik, K. (2008). The growth and management of R&D outsourcing: evidence
from UK pharmaceuticals. R&d Management,38(2), 205-219.
Huang, Y. A., Chung, H. J., & Lin, C. (2009). R&D sourcing strategies: determinants and
consequences. Technovation, 29(3), 155-169.
Kessler, E. H., & Bierly III, P. E. (2002). Is faster really better? An empirical test of the implications of
innovation speed. Engineering Management, IEEE Transactions on, 49(1), 2-12.
Klevorick, A. K., Levin, R. C., Nelson, R. R., & Winter, S. G. (1995). On the sources and significance of interindustry differences in technological opportunities. Research policy, 24(2), 185-205. Laursen, K., & Salter, A. (2006). Open for innovation: the role of openness in explaining innovation performance among UK manufacturing firms. Strategic management journal, 27(2), 131-150. Leiblein, M. J. (2003). The choice of organizational governance form and performance: Predictions from
transaction cost, resource-based, and real options theories. Journal of management, 29(6), 937-961.
Leiblein, M. J., Reuer, J. J., & Dalsace, F. (2002). Do make or buy decisions matter? The influence of organizational governance on technological performance. Strategic management journal, 23(9), 817-833.
34
Levinthal, D. A., & March, J. G. (1993). The myopia of learning. Strategic management journal, 14(S2), 95-112. Lonsdale, C., & Cox, A. (2000). The historical development of outsourcing: the latest fad?. Industrial
Management & data systems, 100(9), 444-450.
Madrid‐Guijarro, A., Garcia, D., & Van Auken, H. (2009). Barriers to innovation among Spanish
manufacturing SMEs. Journal of Small Business Management, 47(4), 465-488.
Mahnke, V. (2001). The process of vertical dis-integration: an evolutionary perspective on
outsourcing. Journal of Management and Governance, 5(3-4), 353-379.
Materia, V.C., Abduraupov, R., Dries, L., & Pascucci, S. (2015). Does the capital structure of firms influence
their innovation strategies? Evidence from the European agri-food sector. Paper for COMPETE organized
session
Mol, M. J. (2005). Does being R&D intensive still discourage outsourcing?: Evidence from Dutch
manufacturing. Research policy, 34(4), 571-582.
Myers, S.C., Majluf, N., 1984. Corporate financing and investment decisions when firms have information
that investors do not have. Journal of Financial Economics 13, 187-221.
Narula, R. (2001). Choosing between internal and non-internal R&D activities: some technological and
economic factors. Technology Analysis & Strategic Management, 13(3), 365-387.
Nelson, R. R., & Winter, S. G. (1982). An evolutionary theory of economic change. Harvard University Press. Noori, H., 1990. Managing the Dynamics of New Technology. Prentice Hall, Englewood Cliffs, NJ 383 pp. Perrons, R. K., & Platts, K. (2004). The role of clock speed in outsourcing decisions for new technologies: insights from the prisoner's dilemma. Industrial Management & Data Systems, 104(7), 624-632. Porter, M., & Stern, S. (2001). Location matters. Sloan Management Review,42(4), 28-36. Quinn, J. B., & Hillmer, F. G. (1995). Strategic outsourcing. The McKinsey Quarterly, (1), 48.
Rajan, R. G., & Zingales, L. (1996). Financial dependence and growth (No. w5758). National bureau of
economic research.
Rigby, D., & Zook, C. (2002). Open-market innovation. Harvard business review, 80(10), 80-93.
Ridha, M., & Bajka, D. (2010). The Impact of R&D Investments on The Capital Structure of Swedish Public
Life Science Companies.
Saleem, Q., & Rehman, R. U. (2011). Impacts of liquidity ratios on profitability. Interdisciplinary Journal of
Research in Business, 1(7), 95-98.
Santoro, M. D., & Chakrabarti, A. K. (2002). Firm size and technology centrality in industry–university
interactions. Research policy, 31(7), 1163-1180.
35
Savignac, F. (2006). Le financement des entreprises innovantes (Doctoral dissertation, Université
Panthéon-Sorbonne-Paris I).
Schäfer, D., Werwatz, A., & Zimmermann, V. (2004). The determinants of debt and (private) equity
financing: The case of young, innovative SMEs from Germany. Industry and Innovation, 11(3), 225-248.
Schumpeter, J. A. (2013). Capitalism, socialism and democracy. Routledge.
Shrivastava, P., & Souder, W. E. (1987). The strategic management of technological innovations: A review
and a model. Journal of Management Studies, 24(1), 25-41.
Solow, R. M. (1957). Technical change and the aggregate production function. The review of Economics
and Statistics, 312-320.
Stanko, M.A., Calantone, R.J., (2011). Controversy in innovation outsourcing research: review, synthesis
and future directions. R&D Management 41, 8-20.
Santamaria, L., & Surroca, J. (2011). Matching the goals and impacts of R&D collaboration. European
Management Review, 8(2), 95-109.
Teece, D. J. (1986). Profiting from technological innovation: Implications for integration, collaboration,
licensing and public policy. Research policy, 15(6), 285-305.
Tsai, K. H., & Wang, J. C. (2009). External technology sourcing and innovation performance in LMT
sectors: An analysis based on the Taiwanese Technological Innovation Survey. Research Policy, 38(3),
518-526.
Verbeek, M. (2004). A guide to modern econometrics. John Wiley & Sons.
West, A., 2002. Estrategia de Innovacio ´n (in Spanish). Innovation Strategy. Cla´sicos COTEC,
Madrid 342 pp.
West, M. A. and Farr, J. L. (1989). `Innovation at work: psychological perspectives', Social Behaviour, 4,
15±30.
Williamson, O. E. (1985). The economic institutions of capitalism. Simon and Schuster.
Williamson, O. E. (1989). Corporate finance and corporate governance. The journal of finance, 43(3), 567-
591.
Zahra, S. A., & Covin, J. G. (1994). The financial implications of fit between competitive strategy and
innovation types and sources. The Journal of High Technology Management Research, 5(2), 183-211.

36
Appendix I Cusmano, Mancusi and Morisson (2008)

37
Appendix II Source: extracted from excel dataset
List 1 Distribution of total dataset
Division
(according to
NACE rev 2.)
Description (according to NACE rev 2.) # of firms % of total firms
10 Manufacture of food products 1198 9.3%
11 Manufacture of beverages 194 1.5%
12 Manufacture of tobacco products 7 0.05%
13 Manufacture of textiles 414 3.2%
14 Manufacture of wearing apparel 326 2.5%
15 Manufacture of leather and related products 217 1.7%
16 Manufacture of wood and of products of wood
and cork, expect furniture; manufacture of
articles of straw and plaiting materials
557 4.3%
17 Manufacture of paper and paper products 288 2.2%
18 Printing and reproduction of recorded media 513 4.0%
19 Manufacture of coke and refined petroleum
products
18 0.1%
20 Manufacture of chemicals and chemical
products
401 3.2%
21 Manufacture of basic pharmaceutical products
and pharmaceutical preparations
82 0.6%
22 Manufacture of rubber and plastic products 853 6.6%
23 Manufacture of other non-metallic mineral
products
635 4.9%
24 Manufacture of basic metals 300 2.3%
25 Manufacture of fabricated metal products,
except machinery and equipment
2852 22.2%
26 Manufacture of computer, electronic and
optical products
586 4.6%
27 Manufacture of electrical equipment 501 3.9%
28 Manufacture of machinery and equipment 1400 10.9%
29 Manufacture of motor vehicles, trailers and
semi-trailers
270 2.1%
30 Manufacture of other transport equipment 117 0.9%
31 Manufacture of furniture 453 3.5%

38
32 Other manufacturing 371 2.9%
33 Repair and installation of machinery and
equipment
313 2.4%
Total Manufacturing 12866