the regionalization of urban natural disasters in china
TRANSCRIPT

Abstract An integrated urbanization level (CL) index and an integrated naturaldisaster intensity (QC) index were developed on the basis of Disaster SystemTheory and China Natural Disaster Database for integrated urban disaster riskassessment. Integrated quantitative assessments of the urban socio-economic sys-tem and the intensity of hazards in China were carried out by the Model-Tupu(map series) and inter-feedback process using digital map technology. On the basisof this assessment, China can be regionalized into three regions, namely, coastalurban disaster region, eastern urban disaster region and western urban disasterregion, 15 sub-regions and 22 units. These results can provide a scientific basis fordetermining a city’s disaster risk management and natural disaster relief regional-ization in China.
Keywords Integrated natural disaster intensity Æ Integrated urbanization level ÆNatural disaster regionalization Æ Urban disasters in China
1 Introduction
The implementation of the Reform and Opening Strategy by the Chinesegovernment has resulted in China, which is characterized as a developing country,experiencing an accelerated rate of urbanization in association with rapid
J. Wang Æ X. Yi Æ H. JiaKey Laboratory of Regional Geography,College of Geography and Remote Sensing Science,Beijing Normal University, Beijing, China
P. Shi (&) Æ L. ZhuKey Laboratory of Environmental Change and Natural Disaster of Ministry of Education,Beijing Normal University, Beijing 100875, Chinae-mail: [email protected]
123
Nat Hazards (2008) 44:169–179DOI 10.1007/s11069-006-9102-1
ORI GI N A L P A PE R
The regionalization of urban natural disastersin China
Jing-ai Wang Æ Pei-jun Shi Æ Xiang-sheng Yi ÆHui-cong Jia Æ Lai-yin Zhu
Received: 26 July 2006 / Accepted: 4 December 2006 / Published online: 10 May 2007� Springer Science+Business Media B.V. 2007
economic development. Within as little as 26 years—from 1978 to 2004—theurbanization level of China has increased from 18 to 41.7% (Shi 2005). Accordingto the ‘‘Urban Development Report of China’’ (2003–2004), the urbanizationlevel in China will increase to approximately 75% by the middle of the 21stcentury; this means that migration from the country to cities will occur at a meanannual rate of approximately 10–12 million people per year (China Association ofMayors 2005). However, most cities in China are located in regions that areextremely vulnerable to a wide range of natural hazards; for example, 60% ofChinese cities currently have flood control standards that are below the nationalstandard (Wang et al. 2004), and 54% of middle- and large-scale cities with morethan 500,000 inhabitants are located in earthquake-prone regions (hazard of anearthquake of a magnitude greater than VII; Xu et al. 2004). The risks of thesenatural hazards in the cities are increasing simultaneously with rapid urbanization.Consequently, regionalization of urban natural disaster provides not only animportant knowledge base for disaster risk management but also for urbandisaster mitigation, resilience building and sustainable development.
The regionalization of natural disasters generally emphasizes the public emer-gency response to a single type of disaster (such as flood, landslide, earthquake ordrought), (Fotheringham et al. 1995; Rose et al. 2004; Terlien et al. 1995; Wells1996). However, various researchers have attempted a more integrated approach.Blaikie et al. (1994) proposed a ‘‘Pressure-Release’’ model by combining hazardsand vulnerabilities to determine risks. Using multiple regression analysis, Chunget al. (1995) drew landslide disaster prediction maps for future time periods (1960–1980) using 40 data indices of the region for the period before 1960. Chinesescholars have also successively conducted research into integrated natural disasterregionalization. Zhang et al. (1992) regionalized China into 45 combinations oftypical sub-regions and seven regions according to similarities and differences interms of the main natural disasters of each typical region. Ma et al. (1994)regionalized China into four disaster regions and 12 sub-regions based on geo-tectonics and the physiognomy situation of China, while Zhang et al. (1995)regionalized China into six natural disaster regions, 26 natural disaster sub-regionsand 93 natural disaster units with the support of the China natural disaster data-base. Wang and Shi (2000) formed basic spatial units of natural disasters in Chinaby combining the pixels using a bottom-up approach, which were formed byoverlapping physical geographical map series and disaster map series. Based onthese spatial units, they regionalized China into five regions, 23 sub-regions and110 units using top-down approaches and subsequently obtained integratedregionalization plans for agricultural natural disasters in China.
The regionalization map of urban natural disaster reported here was based on thebasis of the disaster system theory (Shi 1991). The Digital-Tupu method, whichcombines quantitative and qualitative analysis, was used, assuming urbanizationlevel and integrated intensity of a natural disaster as indices. Although the urbanadministrative division was chosen as the smallest spatial unit in this research, theintegrality of county boundaries and the spatial neighboring relationship betweenurban agglomerations have been adequately taken into consideration. The result ofthis research can provide planning strategies for cities in terms of sustainabledevelopment and the scientific basis for disaster-reduction policies and reliefregionalization.
170 Nat Hazards (2008) 44:169–179
123

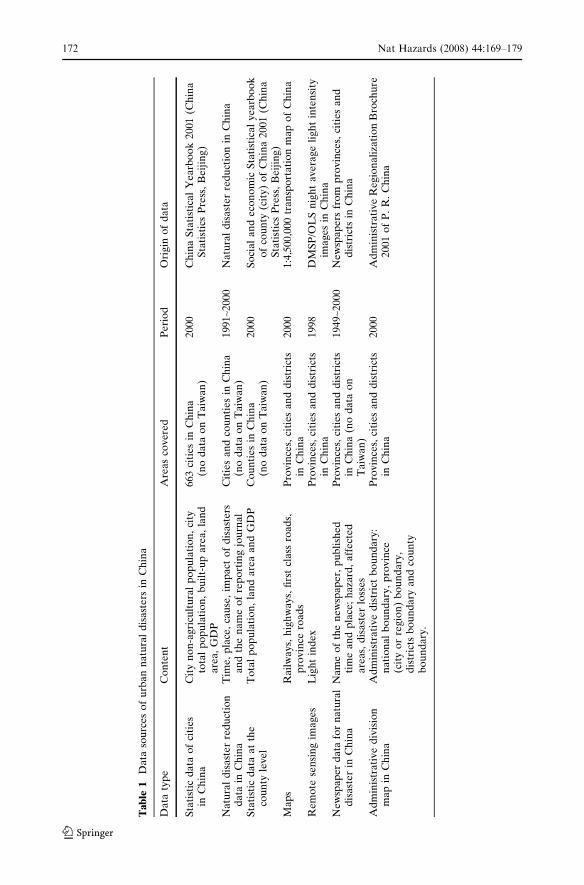
2 Data
The data used in this paper comes from the China natural disaster database, Chinaurban socioeconomic database and China administrative division map for regionalmapping analysis (Table 1). These databases were constructed by the Key Labora-tory of Environmental Change and Natural Disaster of Ministry of Education ofChina, Beijing Normal University. As data sources covering Taiwan Province areinaccessible, the assessment of urban disaster risk in Taiwan is beyond the scope ofthis paper, and will only be possible in the future when data sharing networksbetween the Mainland and Taiwan are established.
3 Method
3.1 Regionalization flow
Regionalization is this article is based on the following five principles: (1) emphasis isput on the combination of integrated urbanization level and main natural disasterintensity; (2) precinct of the city is the basic spatial unit for assessment andregionalization of urbanization level; (3) the risks of structural damage are selectedfor the assessment and regionalization of hazard intensity; (4) both microscopic andmacroscopic issues are taken into consideration, such that the east–west differenti-ation of economy and population are considered to be the primary issue, while urbanagglomerations and important traffic corridors are considered to be the subordinateones; (5) as semi-quantitative and semi-qualitative methods are used in this paper,the regionalization process is not fully digital; thus, prior knowledge has to be em-ployed because digital numbers cannot cover the whole regionalization process.
According to these principles, the process of regionalization of urban naturaldisasters in China is as illustrated in Fig. 1.
3.2 Index system
The index system consists of two parts: the first describes the integrated urbanizationlevel (CL), and the second describes the integrated urban natural disaster intensity(QC).
The integrated urbanization level consists of indices reflecting urban populationsand urban land uses. The former includes the city non-agricultural population (CP)and urban population density (CD); the latter includes city built-up areas (CB), theland integrated transportation capability index (LM) and the urban light index1
(DT) (Zhuo et al. 2003) (Table 2).The index system of urban natural disasters in China considers floods,
earthquakes, landslides and debris flows, typhoons and sandstorms to be the mainhazards in terms of inflicting the largest structural damage to cities and disruptingtransportation. Since different hazards have different quantitative indices and
1 Urban light index is a man-made index representing the spatial distribution and intensity ofnighttime lights based on DMSP/OLS data. It provides researchers with an image of lights fromsettlements at nighttime—as viewed from space. It is believed that the urban light index can be usedto demonstrate urbanization level as, generally, large cities are always more densely and intensely litup at night in comparison to less urbanized areas.
Nat Hazards (2008) 44:169–179 171
123
Tab
le1
Da
taso
urc
es
of
urb
an
na
tura
ld
isa
ste
rsin
Ch
ina
Da
taty
pe
Co
nte
nt
Are
as
cov
ere
dP
eri
od
Ori
gin
of
da
ta
Sta
tist
icd
ata
of
citi
es
inC
hin
aC
ity
no
n-a
gric
ult
ura
lp
op
ula
tio
n,
city
tota
lp
op
ula
tio
n,
bu
ilt-
up
are
a,la
nd
are
a,G
DP
66
3ci
ties
inC
hin
a(n
od
ata
on
Ta
iwa
n)
20
00
Ch
ina
Sta
tist
ica
lY
ea
rbo
ok
20
01
(Ch
ina
Sta
tist
ics
Pre
ss,
Be
ijin
g)
Nat
ura
ld
isa
ste
rre
du
ctio
nd
ata
inC
hin
aT
ime
,p
lace
,ca
use
,im
pa
cto
fd
isa
ste
rsa
nd
the
na
me
of
rep
ort
ing
jou
rna
lC
itie
sa
nd
cou
nti
es
inC
hin
a(n
od
ata
on
Ta
iwa
n)
19
91~
20
00
Na
tura
ld
isa
ste
rre
du
ctio
nin
Ch
ina
Sta
tist
icd
ata
at
the
cou
nty
leve
lT
ota
lp
op
ula
tio
n,
lan
da
rea
an
dG
DP
Co
un
tie
sin
Ch
ina
(no
da
tao
nT
aiw
an
)2000
So
cial
an
deco
no
mic
Sta
tist
ical
yearb
oo
ko
fco
un
ty(c
ity
)o
fC
hin
a2
00
1(C
hin
aS
tati
stic
sP
ress
,B
eij
ing
)M
ap
sR
ail
wa
ys,
hig
hw
ay
s,fi
rst
cla
ssro
ads,
pro
vin
cero
ads
Pro
vin
ces,
citi
esa
nd
dis
tric
tsin
Ch
ina
20
00
1:4
,50
0,0
00
tra
nsp
ort
ati
on
ma
po
fC
hin
a
Rem
ote
sen
sin
gim
age
sL
igh
tin
dex
Pro
vin
ces,
citi
esa
nd
dis
tric
tsin
Ch
ina
19
98
DM
SP
/OL
Sn
igh
ta
ve
rag
eli
gh
tin
ten
sity
ima
ges
inC
hin
aN
ewsp
ap
erd
ata
for
na
tura
ld
isa
ste
rin
Ch
ina
Na
me
of
the
ne
wsp
ape
r,p
ub
lish
ed
tim
ea
nd
pla
ce;
ha
zard
,a
ffe
cte
da
reas
,d
isa
ste
rlo
sse
s
Pro
vin
ces,
citi
esa
nd
dis
tric
tsin
Ch
ina
(no
da
tao
nT
aiw
an
)
19
49~
20
00
Ne
wsp
ape
rsfr
om
pro
vin
ces,
citi
esa
nd
dis
tric
tsin
Ch
ina
Ad
min
istr
ati
ve
div
isio
nm
ap
inC
hin
aA
dm
inis
tra
tiv
ed
istr
ict
bo
un
da
ry:
na
tio
na
lb
ou
nd
ary
,p
rov
ince
(cit
yo
rre
gio
n)
bo
un
da
ry,
dis
tric
tsb
ou
nd
ary
an
dco
un
tyb
ou
nd
ary
.
Pro
vin
ces,
citi
esa
nd
dis
tric
tsin
Ch
ina
20
00
Ad
min
istr
ati
ve
Reg
ion
ali
zati
on
Bro
chu
re2
00
1o
fP
.R
.C
hin
a
172 Nat Hazards (2008) 44:169–179
123

dimensions, their intensities are classified independently according to their ownregional differentiation revealed by a series of disaster maps (Shi 2003). Each class ofeach hazard was given a score within the same range (1–7); scores are based on theevaluation of experts (Table 3) and can therefore be used in calculation equations. Itis not the absolute values that are rigorous, but the relevant relationship among themas this relationship is needed to demonstrate the spatial differentiations of thesenatural hazards.
3.3 Assessment and regionalization of integrated urbanizationlevel in China
Due to differences in the urbanization level index dimensions (Table 2), we appliedan autocorrelation method (Haining 1990) in our assessment of integrated urban-ization level in China. The weights of the indices of urbanization level—CP, CD,CB, LM and DT—are 0.206, 0.195, 0.212, 0.170 and 0.217, respectively, throughoutthe calculations reported herein. As such, we obtained an integrated urbanizationlevel of each spatial unit and the regionalized map. Maintaining the county inte-grality in this map of integrated urbanization level index (CL), we divided theintegrated urbanization level in China into five levels: strong urbanization, highurbanization, middle urbanization, low urbanization and weak urbanization(Fig. 2).
UT
NDT
MIUL
MIIND
PK
MC
RD
NU
MFig. 1 Urban natural disaster in China regionalization process. MC Model construction, MIINDmap of integrated intensity of natural disaster, MIUL map of integrated urbanization level, MUNDRmap of urban natural disaster region, NDT natural disaster Tupu, PK prior knowledge, UTurbanization Tupu
Table 2 Assessment index system for integrated urbanization level (CL) in China
Urbanizationlevel index
Code Original datatype
Year Evaluatingmethod
Urban non-agriculturalpopulation
CP Statistic dataof 663 cities
2000 Cities are evaluated withtrue value, while countiesare evaluated with ‘‘0’’Urban population density CD
Built-up area of cities CBLand integrated
transportationcapability indexa
LM Digitized transportationvector map of China(1:4,500,000)
2000 Calculated by counties
Light Index of Cities DT DMSP/OLS raster images 1998 Calculated by counties
a Land integrated transportation capability index (LM) = [(Length of railways + highways + firstclass roads + province roads) · buffer area of the road]/unit area. The larger the value is, thestronger the transportation capability could be
Nat Hazards (2008) 44:169–179 173
123

Table 3 Index system of main urban natural hazards
Hazard Code Spatialreference
Index(Code)
Meaning andarithmetic
Classificationand evaluation
Earthquake D1 Pointlocation
Earthquakemagnitude(MS)
According to Richtermagnitude
>6 74~6 4<4 1
Flood W1 County Flood frequency(w1_pc)
Mean annual floodtimes (1949–2000)
>0.15 70.05~0.15 4<0.05 1
Landslideand debris
flow
D2 Pointlocation
Point density(d2_md)
The point locationdensity of landslideand debris flowin the district(1949–2000)
dense area 7sparse area 4few or no 1
Typhoon T County Typhoon times(t1_zc)
The total times oftyphoon happened(1949–2000)
>28 713~28 51~13 3<1 1
Sandstorm S1 Pointposition
Sandstormfrequency(s1_pc)
Mean annualsandstorm times(1951–1998)
>15 75~15 51~5 3<1 1
Fig. 2 The regional assessment of integrated urbanization level in China
174 Nat Hazards (2008) 44:169–179
123

3.4 Urban natural disaster intensity regionalization and assessment
On the basis of the five ratio classification maps for the five disaster types indices,regional maps of the intensity of the five hazards mentioned above (flood, earth-quake, landslide and debris flow, typhoon and sand storm) were separately compiledaccording to the score of disaster intensity – following unification dimensions andcharacteristics of the environment. These five maps were then overlaid together, andthe major urban natural hazard type-intensity map (L-Q) in China was obtained.Based on the map (L-Q), the integrated quantitative assessment for natural disasterintensity was conducted in following steps.
First, values were assigned to the intensity of regional disasters for use in sub-sequent calculations (Table 3). Weights were then assigned to five disasters: flooddisaster = 0.4, earthquake = 0.2, landslide and debris flow = 0.2, typhoon = 0.1 andsandstorm = 0.1. These weights were not given arbitrarily but just the approximateproportions of the direct economic losses that result from these five disasters, asmined from statistical data from Ministry of Civil Affairs. That is to say, flooding isthe first serious disaster in China, inducing mean annual losses that account forapproximately 40% of the total mean annual disaster losses; the second seriousdisaster is earthquake, and so on. Thus, the urban integrated natural disaster intensity(QC) was calculated using the following equation.
QC ¼ qdW1 � 0.4þ qdD1 � 0.2þ qdT � 0.2þ qdD2 � 0.1 + qdS � 0.1
Fig. 3 Regional assessment map of city integrated natural disaster intensity in China
Nat Hazards (2008) 44:169–179 175
123

where, qdW1 is flood intensity; qdD1 is earthquake intensity; qdT1 is typhoonintensity; qdD2 is landslide and debris flow intensity; qdS1 is sandstorm intensity.
In this manner, the assessment map of integrated urban natural hazard intensity inChina was compiled (Fig. 3). The integrated natural hazards intensity can be dividedinto five grades: strong, high, middle, low and weak.
4 Results
In order to reflect urban natural disaster intensity and integrated urbanization level,this paper established an urban natural disaster intensity (QC) and urbanizationlevel integrated index (CL) based on the calculations reported above, where Q is thecity integrated natural disaster intensity, denoted on a scale of 1 to 4, which repre-sents the range of QC in the county unit, and L is integrated urbanization level, alsodenoted on a scale of 1 to 4, which represents the range of CL in the county unit.Finally, indices of all county units in China were combined into 16 kinds (4 · 4) ofQL (Table 4).
Fig. 4 The regionalization of urban natural disaster in China
Table 4 Integrated index(QL) of urban natural disasterintensity (QC) andurbanization level (CL)
Index grade (QL) QC range CL range
1 <2.5 <0.52 2.5~3.5 0.5~2.03 3.5~4.5 2.0~8.04 >4.5 >8.0
176 Nat Hazards (2008) 44:169–179
123

Based on regional differences in 16 kinds of QL above, three regions were definedby macroscopically considering regional differences between economic developmentlevels of eastern, middle and western China. Fifteen sub-regions were defined toshow the similarities in the combination of disaster types. Twenty units were definedby specifically dividing the eastern region to show high areas of high urbanagglomeration and integrated indexes (Fig. 4, Table 5).
5 Conclusions and discussion
This paper employed an integrated method in which the Integrated Urbanized Level(CL) Index and Integrated Natural Disaster Intensity (QC) Index, representing theurban socioeconomic system and the risk of natural hazards, respectively, were usedto reveal the regional differentiation of urban natural disasters of China. Based on aModel-Tupu and inter-feedback process and according to regionalization principles,these regional differentiations of urban natural disasters were regionalized into three
Table 5 Regional characteristics of the urban natural disaster regionalization in China
ID Sub-regions’ name Area(km2)
CL Main urbanhazards (byintensity)
QC QL
I1 High urbanized disaster regionof the Bohai Surrounding area
25.7 7.21 F E T 2.73 23
I2 Middle urbanized disaster regionof the north Jiangsu area
5.4 3.93 T F E 2.91 23
I3 Strong urbanized disaster regionof the Yangtze River Delta
7.8 10.80 F T E 3.34 24
I4 High urbanized disaster regionof Zhejiang and Fujian
7.6 5.87 T F E 3.49 23
I5 High urbanized disaster regionof the Zhujiang delta
4.1 13.16 F T E 3.73 34
I6 High urbanized disaster regionof the Lei-Qiong area
6.6 4.52 T F E 3.13 23
I7 High urbanized disaster regionof Taiwan
3.6 8.35 E T F 4.00 34
II1 High urbanized disaster regionof Northeastern China
66.0 3.78 F S T 2.47 13
II2 Middle-high urbanized disasterregion of North China
48.7 4.32 F E S 2.78 23
II3 Middle-high urbanized disasterregion of Southeastern China
83.0 3.76 F T L 2.58 23
II4 Low-middle urbanized disasterregion of Southwestern China
136.2 2.18 F L E 2.74 23
III1 Low urbanized disaster regionHohhot-Baotou area
7.7 4.18 S F E 2.51 23
III2 Low-middle urbanized disasterregion of Hexi corridor
13.5 3.85 S E F 4.05 33
III3 Low-middle urbanized disasterregion of NorthernTianshan piedmont
15.4 3.81 E S F 3.63 33
III4 Weak urbanized disasterregion of Northwest-Qinghai & Tibet
517.7 0.78 E S F 2.88 22
F, Floods; E, earthquakes; T, typhoons; S, sandstorms; L, landslides and debris flow
Nat Hazards (2008) 44:169–179 177
123

regions, namely the coastal urban disaster region, eastern urban disaster region andwestern urban disaster region, 15 sub-regions and 22 units.
Urban natural disasters regionalization in China primarily indicates the differencebetween the western and eastern parts of the country, where the spatial distributionof population and economy plays a more important role. Based on this regionalperspective, the major natural disasters have occurred in the eastern and coastalareas of China, particularly along the southeast coast, whereas the occurrence ofnatural disasters was much less frequent in the western area. According to east–westdifferentiation, the risk of urban natural disasters in China shows a secondary north–south spatial differentiation. This is mainly due to the spatial differentiation ofnatural hazards, which is determined by the characteristics of Chinese physicalgeography which, in turn, is mainly affected by latitudinal zonality.
The results of this study can be helpful in the planning for national disastermitigation and spatial development. On the one hand, this regionalization mapshows the most disaster-prone areas and hotspots in China, which can be of use todisaster mitigation-related authorities; for example, the coastal region of China isboth the most highly developed area as well as the area most vulnerable to theeffects of natural hazards area. The implication, therefore, is that this coastalregion should be given priority for disaster mitigation and resilience building. Onthe other hand, this regionalization map is essential for good regional developmentplanning. If we accept the consequences of the regionalization map, regional andurban development at the national scale should avoid the high risk area as much aspossible, while at the regional scale the government should adjust its industrystructure to adapt to various regional disaster features; in addition, industries al-ready established in the high risk area should be prepared to increase their disastercoping capacity; i.e., to reduce their vulnerability.
The regionalization of urban natural disasters is a relatively complicated processbecause a disaster is a complex and coupled human-environment system. The re-searchpresented herein has tried to find a solution that will integrate these factors and indoing so provides a number of insights. However, several aspects still require furtherstudy in the future, namely, how to take into consideration resilience and adaptability ofurban socioeconomic system in the integrating process, how to quantify assess disasterrisks with more reasonable and scientific approaches and weights, among others.
Acknowledgements This paper was financially supported by the National Natural Science Foun-dation of China (NSFC) General Project Study on Assessment Method of Post-disaster Resilience ofRegional Agricultural Drought and Integrated Disaster Reduction Mechanism (ProjectNo.40671003), NSFC International Cooperation Project Study on Flood Integrated Risk AssessmentModel and Flood Reduction Strategy in Dongting Lake Region of China (Project No.40535024). Wegratefully acknowledge the thoughtful comments of the editor and reviewers.
References
Blaikie P, Cannon T, Davis I, Wisner B (1994) At risk: natural hazards, people’s vulnerabilitydisasters. Routledge, London
Chung CF, Fabbri AG, Van Westen CJ (1995) Multivariate regression analysis for landslide hazardzonation. In: Carrara A, Guzzetti F (eds) Geographical information systems in assessing naturalhazards. Kluwer, Dordrecht
178 Nat Hazards (2008) 44:169–179
123

Editor group of ‘‘Urban Development Report of China’’, China Association of Mayors (2005) 2003–2004 Urban Development Report of China (in Chinese). Electronic Industry Press, Beijing
Fotheringham AS, Densham PJ, Curtis A (1995) The zone definition problem in location-allocationmodeling. Locat Sci 3:64
Haining R (1990) Spatial data analysis in the social and environment sciences. Cambridge UniversityPress, Cambridge
Ma ZJ (1994) China main natural disaster and relief disaster mitigation and prevention method (inChinese). Science Press, Beijing
Rose WI, Bommer JJ, Sandoval C (2004) Natural hazards and risk mitigation in EI Salvador: Anintroduction. In: Rose WI, Bommer JJ, Lopez DL, Carr MJ, Major JJ (eds) Natural hazards inEI Salvador: Boulder, Colorado. Geological Society of America Special Paper 375, 1–4
Shi L (2005) Urbanized ratio of China has entered a rapid increasing period (in Chinese). http://www.chinanews.com.cn/news/2005/2005-06-02/26/581726.shtml
Shi PJ (1991) The theory of disaster research and its practice (in Chinese). J Nanjing Univ (NaturalScience) 11:37–42
Shi PJ (ed) (2003) Atlas of natural disaster system of China. Science Press, BeijingTerlien MTJ, van Asch TWJ, Van Westen CJ (1995) Deterministic modeling in GIS-based landslide
hazard assessment. In: Carrara A, Guzzetti F (eds) Geographical information systems inassessing natural hazards. Kluwer
Wang JA, Wang J, Ye T (2004) Hazard assessment of urban flood disaster and sustainable devel-opment in China (in Chinese). J Beijing Normal Univ (Social Science) 3: 138–143
Wang P, Shi PJ (2000) Comprehensive regionalization of agricultural natural disaster in China (inChinese). J Nat Disasters 9:16–23
Wells G (1996) Hazard identification and risk assessment. Institution of Chemical Engineers,Warwickshire, UK
Xu W, Wang JA, Shi PJ (2004) Hazard degree assessment of urban earthquake disaster in China (inChinese). J Nat Disaster 13:9–15
Zhang LS, Shi PJ, Wang JA (1995) Regionalization of natural disasters in China (in Chinese). JBeijing Normal Univ (Natural Science) 31:415–421
Zhang PY, Wang FH, Jiang H (1992) The geographical distribution regular and region relief disasterof main natural disaster in China. In: Geography Department of Chinese Academy of Science(ed) China natural disaster hazard analysis and disaster relief (in Chinese). Hubei ScienceTechnology Press, Wu Han
Zhuo L, Shi PJ, Chen J (2003) Application of Compound Night Light Index derived from DMSP/OLS data to urbanized analysis in China in the 1990s (in Chinese). Acta Geogr Sin 58:901–902
Nat Hazards (2008) 44:169–179 179
123