the real effects of hedge fund activism: productivity ... · overview goals data estimation...
TRANSCRIPT

Overview Goals Data Estimation Evidence Conclusions
The Real Effects of Hedge Fund Activism:Productivity, Asset Allocation, and Product Market Competition
Alon Brav1 Wei Jiang2 Hyunseob Kim3
1Fuqua School of BusinessDuke University
2Columbia Business SchoolColumbia University
3Johnson Graduate School of ManagementCornell University
Ackerman Conference on Corporate GovernanceBar-Ilan University
December 17, 2012
1 / 24
The Real Effects of Hedge Fund Activism Brav, Jiang and Kim (2012)

Overview Goals Data Estimation Evidence Conclusions
DISCLAIMER:
Any opinions and conclusions expressed herein are those of theauthor(s) and do not necessarily represent the views of the U.S. CensusBureau. All results have been reviewed to ensure that no confidentialinformation is disclosed.
2 / 24
The Real Effects of Hedge Fund Activism Brav, Jiang and Kim (2012)

Overview Goals Data Estimation Evidence Conclusions
Outline
1 Overview
2 Goals
3 Data
4 Estimation
5 Evidence
6 Conclusions
3 / 24
The Real Effects of Hedge Fund Activism Brav, Jiang and Kim (2012)
Overview Goals Data Estimation Evidence Conclusions
What do we know about institutional activism?
Informed shareholder monitoring can reduce agency problems.Institutional activism associated with a positive but insignificantimpact
Collective action problemSeveral agency problems and regulatory/liquidity constraints
Black (1998): “Best reading of currently available evidence is thatinstitutional investor activism does not importantly affect firmperformance.
Gillan and Starks (2007): “The evidence provided by empiricalstudies of the effects of shareholder activism is mixed ... There islittle evidence of improvement in the long-term operating or stockmarket performance of the targeted companies.”
4 / 24
The Real Effects of Hedge Fund Activism Brav, Jiang and Kim (2012)

Overview Goals Data Estimation Evidence Conclusions
Hedge funds vs. other institutions
1 Manager’s incentives
2 Fewer conflicts of interest
3 Not subject to heightened fiduciary standards (ERISA) or “prudentman” investing standards
4 Flexibility in using derivatives, shorting, large stakes in a fewcompanies, use of leverage, less disclosure, and the use of“lock-ups”
5 Large increase in capital allocated to hedge funds
5 / 24
The Real Effects of Hedge Fund Activism Brav, Jiang and Kim (2012)

Overview Goals Data Estimation Evidence Conclusions
Evidence to date
Objectives and tactics
Type of firms targeted
Short and long-term market reaction
Impact on long-run profitability
Impact on other firm policies (payout, leverage, governance)
Impact on other stakeholders
Return to hedge fund activists
6 / 24
The Real Effects of Hedge Fund Activism Brav, Jiang and Kim (2012)

Overview Goals Data Estimation Evidence Conclusions
Goals of this study
1 The source of fundamental improvement
Plant-level productivity before and after the interventionInteraction with product market competition
2 Efficiency gains for assets in place vs. capital reallocation
Continuing vs. sold plants
3 Extent to which the effects are causal
4 Effects on labor (on-going work)
7 / 24
The Real Effects of Hedge Fund Activism Brav, Jiang and Kim (2012)

Overview Goals Data Estimation Evidence Conclusions
Hedge fund activism data
Section 13(d) of the 1934 Securities Exchange Act requires investors who are
beneficial owners of over 5% of any class of publicly traded securities, and who
have an intention to influence corporate control, to disclose their ownership and
intent within 10 days of crossing the 5% threshold
Information on the identity of the filer, filing date, ownership and its changes,cost of purchase, and the purpose of the investment
Begin with all 13D filings over 1994-2007
Filter out banks, brokerage companies, regular corporations, foreign inst’, trusts,individuals, insurance companies, pension funds, and other misc’ categoriesExclude events in which the primary purpose of the filer is either to be involvedin (1) the bankruptcy reorganization or the financing of a distressed firm; or (2)to engage in a merger and acquisition related risk arbitrage; or (3) the target isa closed-end fund or other non-regular corporationGather information on the hedge funds motive, the targets response, and thedevelopment and resolution of the events
8 / 24
The Real Effects of Hedge Fund Activism Brav, Jiang and Kim (2012)

Overview Goals Data Estimation Evidence Conclusions
U.S. Census Bureau data
Census of Manufacturers (CMF) and the Annual Survey of Manufacturers(ASM) to compute measures of productivity, profitability, and productmarket competition
CMF covers all manufacturing plants in the U.S. (public and private) withat least one employee for years ending 2 or 7 (the Census years), includingroughly 300,000 plants in each census. ASM covers about 50,000manufacturing plants for the non-Census yearsPlant-year data on total value of shipments, capital stock and investment,labor hours, and material and energy costs
Longitudinal Business Database (LBD). Unique plant identifier andfirm-plant links
Can follow plants independent of ownership changesNumber of employees, annual payroll, industry classifications,geographical location, and ownership status
9 / 24
The Real Effects of Hedge Fund Activism Brav, Jiang and Kim (2012)
Overview Goals Data Estimation Evidence Conclusions
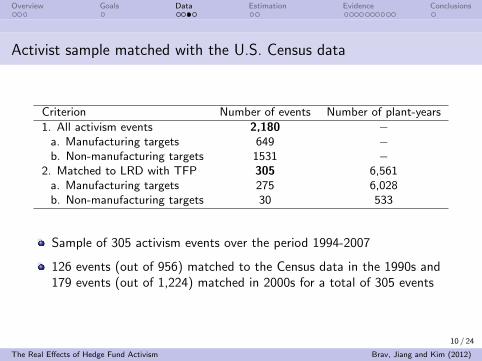
Activist sample matched with the U.S. Census data
Criterion Number of events Number of plant-years
1. All activism events 2,180 −a. Manufacturing targets 649 −b. Non-manufacturing targets 1531 −
2. Matched to LRD with TFP 305 6,561a. Manufacturing targets 275 6,028b. Non-manufacturing targets 30 533
Sample of 305 activism events over the period 1994-2007
126 events (out of 956) matched to the Census data in the 1990s and179 events (out of 1,224) matched in 2000s for a total of 305 events
10 / 24
The Real Effects of Hedge Fund Activism Brav, Jiang and Kim (2012)

Overview Goals Data Estimation Evidence Conclusions
Activist sample matched with the U.S. Census data
Activists’ objectives for events in the Census-matched sample– sample period: 2001-2007
Census sample All events
Stated Objectives N% of %
N% of %
Sample Success Sample Success1. General 107 59.8 − 646 52.8 −2. Capital Structure 24 13.4 50.0 162 13.2 52.53. Business Strategy 31 17.3 48.4 206 16.8 51.94. Sales of Target 31 17.3 48.4 254 20.8 54.35. Governance 47 26.3 53.2 333 27.2 60.7Specific Sum [2 to 5] 72 40.2 50.0 578 47.2 53.6Total Sum [1 to 5] 179 − − 1,224 − −
11 / 24
The Real Effects of Hedge Fund Activism Brav, Jiang and Kim (2012)
Overview Goals Data Estimation Evidence Conclusions
Estimation
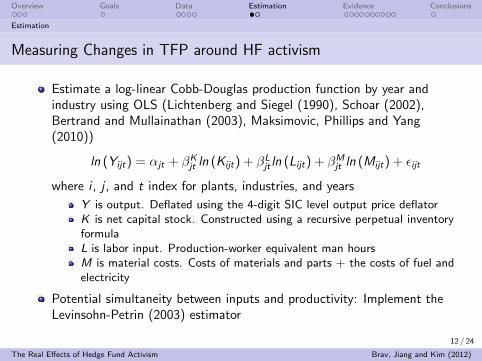
Measuring Changes in TFP around HF activism
Estimate a log-linear Cobb-Douglas production function by year andindustry using OLS (Lichtenberg and Siegel (1990), Schoar (2002),Bertrand and Mullainathan (2003), Maksimovic, Phillips and Yang(2010))
ln (Yijt) = αjt + βKjt ln (Kijt) + βL
jt ln (Lijt) + βMjt ln (Mijt) + εijt
where i , j , and t index for plants, industries, and years
Y is output. Deflated using the 4-digit SIC level output price deflatorK is net capital stock. Constructed using a recursive perpetual inventoryformulaL is labor input. Production-worker equivalent man hoursM is material costs. Costs of materials and parts + the costs of fuel andelectricity
Potential simultaneity between inputs and productivity: Implement theLevinsohn-Petrin (2003) estimator
12 / 24
The Real Effects of Hedge Fund Activism Brav, Jiang and Kim (2012)
Overview Goals Data Estimation Evidence Conclusions
Estimation
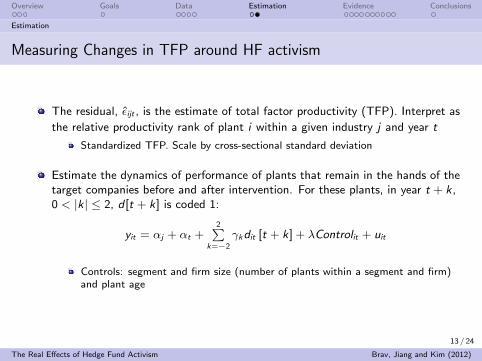
Measuring Changes in TFP around HF activism
The residual, ε̂ijt , is the estimate of total factor productivity (TFP). Interpret as
the relative productivity rank of plant i within a given industry j and year t
Standardized TFP. Scale by cross-sectional standard deviation
Estimate the dynamics of performance of plants that remain in the hands of thetarget companies before and after intervention. For these plants, in year t + k,0 < |k| ≤ 2, d [t + k] is coded 1:
yit = αj + αt +2P
k=−2
γkdit [t + k] + λControlit + uit
Controls: segment and firm size (number of plants within a segment and firm)and plant age
13 / 24
The Real Effects of Hedge Fund Activism Brav, Jiang and Kim (2012)

Overview Goals Data Estimation Evidence Conclusions
Evidence
Productivity of plants owned at each year from t-2 to t+2
Dep. Var. Plant TFP Firm TFP
d[t-2]0.074 0.106[2.92] [1.91]
d[t-1]0.042 0.070[1.62] [1.40]
d[t]0.041 -0.005[1.49] [0.11]
d[t+1]0.032 0.003[0.98] [0.05]
d[t+2]0.096 0.096[2.82] [1.42]
log(Plants per seg’)-0.001 -0.017[0.26] [1.23]
log(Plants per firm)0.057 0.069
[19.53] [7.08]
Plant age (x100)-0.700 -0.544[20.66] [14.44]
Dep. Var. Plant TFP Firm TFP
d[t+1]-d[t-1]-0.010 -0.068[0.35] [1.42]
d[t+2]-d[t]0.056 0.101[1.78] [1.72]
d[t+2]-d[t-1]0.055 0.026[1.65] [0.41]
Year FE Y YIndustry FE N NR2 1.19% 0.36%Observations 633,510 334,631
”V” shape change in TFP aroundactivism
Significance improves with recentupdates to the data
14 / 24
The Real Effects of Hedge Fund Activism Brav, Jiang and Kim (2012)
Overview Goals Data Estimation Evidence Conclusions
Evidence
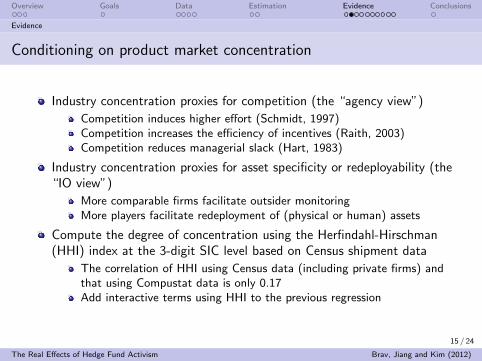
Conditioning on product market concentration
Industry concentration proxies for competition (the “agency view”)
Competition induces higher effort (Schmidt, 1997)Competition increases the efficiency of incentives (Raith, 2003)Competition reduces managerial slack (Hart, 1983)
Industry concentration proxies for asset specificity or redeployability (the“IO view”)
More comparable firms facilitate outsider monitoringMore players facilitate redeployment of (physical or human) assets
Compute the degree of concentration using the Herfindahl-Hirschman(HHI) index at the 3-digit SIC level based on Census shipment data
The correlation of HHI using Census data (including private firms) andthat using Compustat data is only 0.17Add interactive terms using HHI to the previous regression
15 / 24
The Real Effects of Hedge Fund Activism Brav, Jiang and Kim (2012)
Overview Goals Data Estimation Evidence Conclusions
Evidence
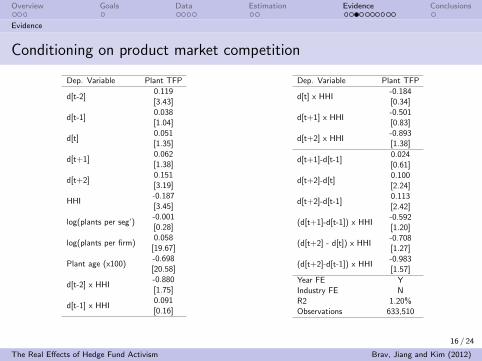
Conditioning on product market competition
Dep. Variable Plant TFP
d[t-2]0.119[3.43]
d[t-1]0.038[1.04]
d[t]0.051[1.35]
d[t+1]0.062[1.38]
d[t+2]0.151[3.19]
HHI-0.187[3.45]
log(plants per seg’)-0.001[0.28]
log(plants per firm)0.058
[19.67]
Plant age (x100)-0.698[20.58]
d[t-2] x HHI-0.880[1.75]
d[t-1] x HHI0.091[0.16]
Dep. Variable Plant TFP
d[t] x HHI-0.184[0.34]
d[t+1] x HHI-0.501[0.83]
d[t+2] x HHI-0.893[1.38]
d[t+1]-d[t-1]0.024[0.61]
d[t+2]-d[t]0.100[2.24]
d[t+2]-d[t-1]0.113[2.42]
(d[t+1]-d[t-1]) x HHI-0.592[1.20]
(d[t+2] - d[t]) x HHI-0.708[1.27]
(d[t+2]-d[t-1]) x HHI-0.983[1.57]
Year FE YIndustry FE NR2 1.20%Observations 633,510
16 / 24
The Real Effects of Hedge Fund Activism Brav, Jiang and Kim (2012)

Overview Goals Data Estimation Evidence Conclusions
Evidence
Firm policies pre and post activism
HHI quartiles:
Dep. Variable
d[t-2]
d[t-1]
d[t]
d[t+1]
d[t+2]
ln(MV)
Ln(Firm Age)
Year FEIndustry FER2Observations
Concentrated industries (HHI top quartile)
CapexDividend CEO Altman
yield turnover (Ex. Lev’)
0.166 0.246 0.003 0.260***[0.56] [0.96] [0.11] [3.00]0.039 0.174 0.012 0.108[0.14] [0.69] [0.39] [1.12]
-0.400* 0.621** 0.085*** 0.054[-1.67] [2.11] [2.70] [0.48]
-0.564** 0.776** 0.095*** 0.256**[-2.29] [2.28] [2.65] [2.40]-0.378 -0.264 0.078** 0.253***[-1.45] [-0.99] [2.26] [2.60]
0.117*** 0.263*** -0.004 0.196***[3.91] [13.34] [-1.40] [10.27]
-0.417*** 0.357*** 0.013*** 0.197***[-7.17] [9.59] [3.66] [6.14]
Y Y Y YY Y Y Y
22.3% 10.7% 3.6% 36.4%27,845 28,178 8,741 28,249
Competitive industries (HHI bottom quartile)
CapexDividend CEO Altman
yield turnover (Ex. Lev’)
-0.325 -0.210 -0.036 -0.074[-1.27] [-1.12] [-1.47] [-0.42]-0.472* 0.102 0.013 -0.068[-1.82] [0.50] [0.40] [-0.39]-0.435* 0.384 0.021 -0.075[-1.72] [1.44] [0.60] [-0.42]-0.131 0.199 0.053 -0.073[-0.45] [0.70] [1.24] [-0.35]-0.244 -0.031 -0.001 -0.104[-0.84] [-0.10] [-0.03] [-0.45]
0.269*** 0.161*** -0.003 0.161***[9.49] [8.48] [-1.41] [5.23]
-0.443*** 0.329*** 0.011** 0.346***-7.91 9.46 2.41 6.43
Y Y Y YY Y Y Y
40.2% 25.7% 1.6% 48.8%30,116 37,488 8,557 37,550
17 / 24
The Real Effects of Hedge Fund Activism Brav, Jiang and Kim (2012)

Overview Goals Data Estimation Evidence Conclusions
Evidence
Evidence on capital reallocation
Redeployment of capital is a common stated goal of activist hedge funds
Push for the sale of the entire target company in about 20% of events. Inanother 15% push for the divestiture of under-performing or non-coreassets.
Indeed, the “sale of the company” objective category experiences thehighest attrition rate (31%)
Abnormal returns upon announcement of a sale are the highest
Constraints using CRSP/Compustat: Cannot separate productivity gainsfrom existing assets from gains due to reallocation.
The Census data is recorded at the plant level, and therefore survivesownership changes
18 / 24
The Real Effects of Hedge Fund Activism Brav, Jiang and Kim (2012)

Overview Goals Data Estimation Evidence Conclusions
Evidence
Performance of plants sold post-activism:Step 1. Conditioning on ownership only at the event-year
Dep. Variable Plant TFP
d[t-2]0.124[4.65]
d[t-1]0.061[2.35]
d[t]0.043[1.58]
d[t+1]0.002[0.07]
d[t+2]0.023[0.75]
log(plants per seg’)-0.001[0.24]
log(plants per firm)0.057
[19.51]
Plant age (x100)-0.700[20.65]
Dep. Variable Plant TFP
d[t+1]-d[t-1]-0.059[2.44]
d[t+2]-d[t]-0.020[0.71]
d[t+2]-d[t-1]-0.038[1.33]
Year FE YIndustry FE NObservations 633,147R2 1.19%
19 / 24
The Real Effects of Hedge Fund Activism Brav, Jiang and Kim (2012)

Overview Goals Data Estimation Evidence Conclusions
Evidence
Performance of plants sold post-activism:Step 2. Conditioning on plant sales
Dep. Variable Plant TFP
d[t-2]-0.046[0.63]
d[t-1]-0.156[2.29]
d[t]-0.202[2.63]
d[t+1]-0.149[1.74]
d[t+2]-0.034[0.43]
log(plant per seg’)-0.001[0.27]
log(plants per firm)0.057
[19.61]
Plant age (x100)-0.698[20.61]
Dep. Variable Plant TFP
d[t+1]-d[t-1]0.007[0.10]
d[t+2]-d[t]0.168[2.11]
d[t+2]-d[t-1]0.121[1.52]
Year FE YIndustry FE NObservations 632,802R2 1.19%
Now the event is the sale of a plant by a firm thatwas targeted by hedge fund activists anytime from tto t + 2.
Sold plants were under-performing at the time of thesale but improve two years later
20 / 24
The Real Effects of Hedge Fund Activism Brav, Jiang and Kim (2012)
Overview Goals Data Estimation Evidence Conclusions
Evidence
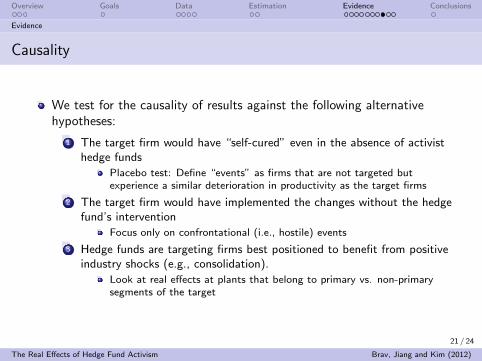
Causality
We test for the causality of results against the following alternativehypotheses:
1 The target firm would have “self-cured” even in the absence of activisthedge funds
Placebo test: Define “events” as firms that are not targeted butexperience a similar deterioration in productivity as the target firms
2 The target firm would have implemented the changes without the hedgefund’s intervention
Focus only on confrontational (i.e., hostile) events
3 Hedge funds are targeting firms best positioned to benefit from positiveindustry shocks (e.g., consolidation).
Look at real effects at plants that belong to primary vs. non-primarysegments of the target
21 / 24
The Real Effects of Hedge Fund Activism Brav, Jiang and Kim (2012)

Overview Goals Data Estimation Evidence Conclusions
Evidence
Intervention vs. a “stock picking” alternative
Regulatory requirement for active vs. passive stakes
13D (stock picking + potential intervention) vs. 13G (stock pickingonly)
Focus on switching from a form “G” to a form “D” by our hedgefunds
No additional information on stock picking at the switchNeed not switch unless the intervention is necessaryAny real effects post “D” should be attributed to the influence ofhedge funds rather than mere stock picking
Results: Performance improves significantly after the “G” to “D”switch
22 / 24
The Real Effects of Hedge Fund Activism Brav, Jiang and Kim (2012)

Overview Goals Data Estimation Evidence Conclusions
Evidence
Effects on labor: On-going work
Compared to their industry peers, after the hedge fund activism:1 Target firms reduce number of employees and hours per worker2 Labor productivity (output/total labor hour) increases, but wages
per hour increase much less
Currently investigating in more detail using Census Bureau’sworker-level LEHD data
23 / 24
The Real Effects of Hedge Fund Activism Brav, Jiang and Kim (2012)

Overview Goals Data Estimation Evidence Conclusions
Conclusions
Conclusions
Martin Lipton of Wachtell, Lipton, Rosen & Katz:
I think its a terrible thing for corporate America. I think what wereseeing is a replay of the attempt to drive American business toshort-term results instead of long-term values.”
This paper shows that hedge fund activists are neither “short-term focused” norpurely “financial-engineering oriented”
We believe that there is a real effect on the fundamentals of targeted companies
Efficient capital reallocation is a particularly important channel, favoringcompetitive industries
24 / 24
The Real Effects of Hedge Fund Activism Brav, Jiang and Kim (2012)