the radial metallicity gradient inthe galacticdisk
TRANSCRIPT

The radial metallicity gradient in the Galactic disk
Author: MaCarme Pujol Marın.Advisors: Francesca Figueras Sinol and Maria Monguio i Montells.
Facultat de Fısica, Universitat de Barcelona, Diagonal 645, 08028 Barcelona, Spain.
(Dated: June 16, 2014)
Abstract: The aim of this work is to estimate the radial metallicity gradient in the Galactic disktoward the anticenter direction. For that we use Stromgren photometric data which allow us tocompute individual physical parameters through empirical calibrations. We detect that metallicitycalibrations found in the literature present discontinuities between photometric regions. By this, inthe present work we focused in region 4, that is F0-G2 stars. Even thought we detect some criticalclassification errors when faint stars are treated, induced by its larger observational uncertainties.To account for that, here we propose to use additionally the infra-red 2MASS photometry to cleanthe sample. We confirm that the metallicity gradient exists and decreases as we move away from theGalactic center. Our slope (d[Fe/H]/dR = −0.16 ± 0.06 dex
kpc) is slightly larger than recent results
using APOGEE spectroscopic data.
I. INTRODUCTION
The Milky Way is an excellent framework that pro-vides the opportunity to measure large numbers of stel-lar abundances on a star-by-star basis. Observations ofchemical abundances and derivations of metallicity gra-dients are very important for the understanding of theevolution and chemical structure of the Galactic disk.
The Apache Point Observatory Galactic Evolution Ex-periment (APOGEE) of the Sloan Digital Sky Survey-III is a high resolution near-infrared spectroscopic studythat covers all the major components of the Galaxy. Re-cently Bovy et al. (2014)[1] with red-clump stars fromAPOGEE detected a quite steep metallicity gradient(d[Fe/H]/dR = −0.09 ± 0.01dex
kpc). Moreover, the work
of Hayden et al. (2014)[2] showed the existence of a neg-ative radial metallicity gradient as a function of Galacticdistance (d[M/H]/dR = −0.15± 0.01dex
kpc(9 < R < 11)).
On the other hand, Stinson et al. (2013)[3] analyzedthe structure and chemical enrichment using simulatedMilky Way-like galaxy. They found a correlation be-tween metallicity, Galactic distance and age: the old starshave low metallicities and are far from the galactic center,while young stars are a short distance. Then, the fractionof stars with low metallicity increases at the outer partsof the disk, explaining the observed metallicity gradient.
In the present work, we aim to estimate the metal-licity gradient through the Galactic anticenter direction.To achieve this, we use Stromgren photometric data fromMonguio et al. (2013)[4] obtained with the Wide FieldCamera at the Isaac Newton Telescope (Canary Islands).It is a photometric survey covering 16�o in the anticen-ter direction with 96980 stars. 80% of them have spec-tral types later than A3 and are of interest of our pur-pose. This catalog provides a large number of stars forwhich we can compute its physical parameters -includingmetallicity- from empirical calibrations. We test the con-sistency and validity of some empirical calibrations inmetallicity.
Hence, the present work is organized as follows: Inthe section II, we discuss the metallicity indicators inthe Stromgren photometry, the photometric classificationin regions and the empirical calibrations used. In thesection III, we analyze and select our working sample,avoiding possible biases. In the section IV, we discussthe results of the radial metallicity gradient.
II. STROMGREN PHOTOMETRIC SYSTEM
The Stromgren photometric system is widely used todeterminate physical parameters for individual stars. Itis an intermediate-band system designed to mesure theBalmer discontinuity and the blanketing with the use ofsix filters: u,v,b,y,βwide and βnarrow. With this filters wecan define several magnitudes and indexes:⋄ The apparent visual magnitude, V , measured with
the y filter.⋄ The (b− y) color index is used to determine effective
temperature and the interstellar reddening.⋄ The m1 = (v − b) − (b − y) index, is designed to
measure the blanketing in the 4100A with respect to agradient defined by the b and y regions. Some empiricalcalibrations relate the m1 parameter and the metallicity[Fe/H] abundances.⋄ The c1 = (u− v)− (v − b) index is designed to mea-
sure the Balmer discontinuity and measure temperature(intrinsic color) for B-type stars, and absolute magnitude(surface gravity) for A and F-type stars.⋄ The β = βnarrow−βwide index measures the strength
of theHβ line in a spectrum of the star. It is a reddening-free index, since both filters (wide and narrow) are cen-tered at the same wavelength. This parameter is corre-lated with the effective temperature, and it is unaffectedby blanketing.Crawford (1975)[5] defined the δm1 and δc1 indexes
(δm1 = m1(standard) −m1(star) and δc1 = c1(star) −c1(ZAMS)), where the values can be found in his table I.There are useful to take into account the chemical com-position and evolution. Also, the relations between color
The radial metallicity gradient in the Galactic disk MaCarme Pujol Marın
excesses allow us to define reddening free photometric in-dexes: [m1] = m1+0.33(b−y) and [c1] = c1−0.19(b−y).Note that observed indexes have the suffix 1 and the in-trinsic indexes have the suffix 0.
A. Classification into photometric regions
The empirical calibrations relate the photometric in-dexes with physical parameters (intrinsic colors, absolutemagnitude or metallicity). They are only valid for spe-cific regions of the HR diagram. Thus we need to classifythe stars in five photometric regions.
We use the Figueras et al. (1991)[6] criterion, thatuses a free photometric indexes to classify in early group(region 1: B0-B9. 2), intermediate group (region 2: A0-A3) and late group: (i) region 3: A3−F0; (ii) region 4:F0−G2; region 5: G2 >.
In our study we are interested in the late group, sincestars earlier than A3 the effects of variation in the metal-licity are not appreciably in the photometric indexes. Todistinguish between regions 3,4 and 5 we only use the βindex as a temperature indicator[5]: region 3 (β > 2.72),region 4 (2.58 < β < 2.72) and region 5 (β < 2.58).
B. Empirical metallicity calibrations
Empirical metallicity calibrations have been estab-lished comparing photometric data with abundance ob-tained from spectroscopic analyses. [Fe/H] is the ironabundance of the star relative to the Sun:
[Fe/H] = log10
(
NFe
NH
)
⋆
− log10
(
NFe
NH
)
⊙
The following calibrations are available from the liter-ature:⋄ Olsen (1984)[10] proposed a second-order relation
with the δm0(β) index and c0, valid for G0−K1 dwarfs(region 5).⋄ Nissen (1987)[9] relate the [Fe/H] with β and
δm0(b− y) indexes, valid for main sequence stars in therange 2.59 < β < 2.72 (region 4). This relation wasobtained using open clusters.⋄ Schuster and Nissen (1989)[8] proposed two different
relations, for F-type and for G-type stars.The F-starscovered the ranges: 0.22 ≤ (b− y)0 ≤ 0.38, 0.03 ≤ m0 ≤
0.21, 0.17 ≤ c0 ≤ 0.58. And for G-stars the calibrationrange was: 0.37 ≤ (b − y)0 ≤ 0.59, 0.03 ≤ m0 ≤ 0.57,0.10 ≤ c0 ≤ 0.47. Hence, this calibration is only validfor region 4. Their relation is quite complex (includinga logarithmic term) and uses m0 and (b − y)0 indexes.This calibrations has been obtained for high-velocity andmetal-poor stars.⋄ Berthet (1990)[11] proposed a very general quadratic
relation in terms of δm0(β) based on a sample of 164A − F main-sequence (MS) and giant stars. It is validfor δm0 ≥ −0.093.
⋄ Smalley (1993)[7]. It is a linear relation with onlythe δm0(β) index. It was obtained from 28 A and F -typestars, including several metal-rich Am-type stars. Thiscalibration is valid for A3−F0 stars with 0.72 < β < 2.88(region 3).
⋄ Haywood (2002)[13] defended that for F stars therewas a mismatch between the standard sequence of theHyades used by Schuster&Nissen and by Olsen in theirphotometric system. He proposed three different calibra-tions: 0.22 < (b− y)0 < 0.37, 0.37 < (b− y)0 < 0.47 and0.47 < (b− y)0 < 0.59.
⋄ Casagrande et al. (2011)[12] proposed a complexcalibration using m0, (b − y)0 and c0, valid for a largerange: 0.23 ≤ (b− y)0 ≤ 0.63, 0.05 ≤ m0 ≤ 0.68, 0.13 ≤c0 ≤ 0.60. Also, they proposed another calibration thatperforms significantly better for [Fe/H] <∼ −1.0, arguingthat Stromgren indexes lose sensitivity to low metallici-ties.
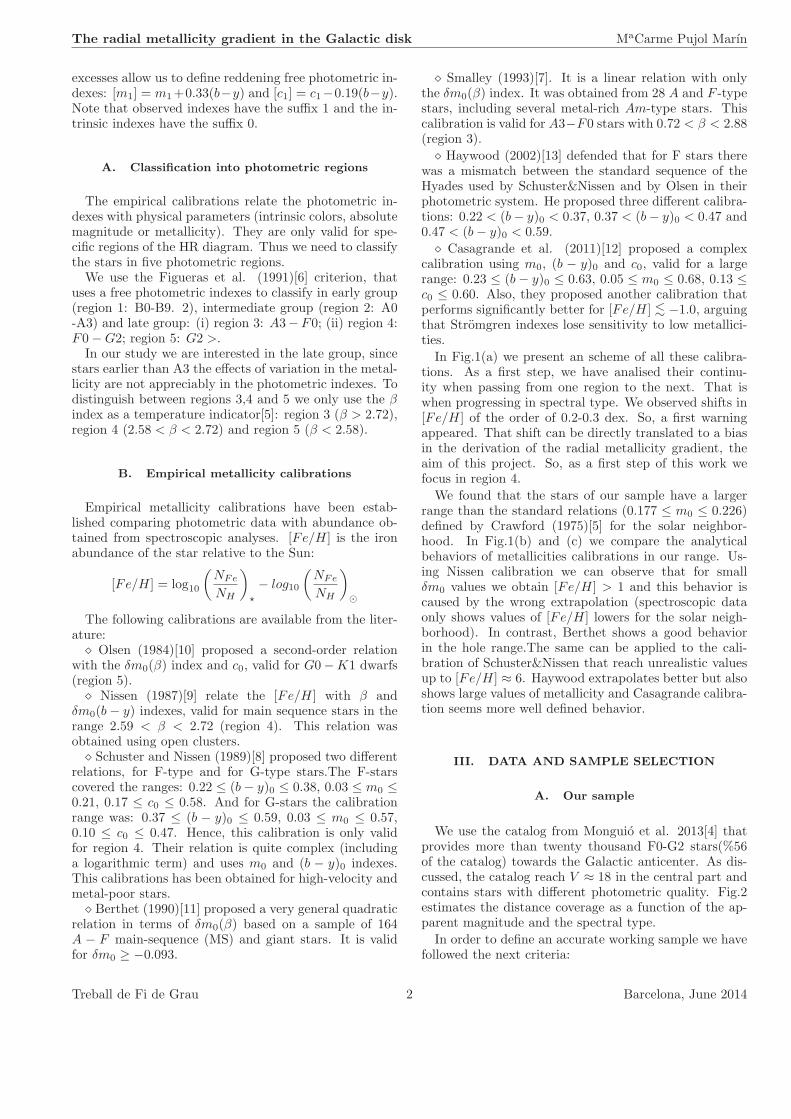
In Fig.1(a) we present an scheme of all these calibra-tions. As a first step, we have analised their continu-ity when passing from one region to the next. That iswhen progressing in spectral type. We observed shifts in[Fe/H] of the order of 0.2-0.3 dex. So, a first warningappeared. That shift can be directly translated to a biasin the derivation of the radial metallicity gradient, theaim of this project. So, as a first step of this work wefocus in region 4.
We found that the stars of our sample have a largerrange than the standard relations (0.177 ≤ m0 ≤ 0.226)defined by Crawford (1975)[5] for the solar neighbor-hood. In Fig.1(b) and (c) we compare the analyticalbehaviors of metallicities calibrations in our range. Us-ing Nissen calibration we can observe that for smallδm0 values we obtain [Fe/H] > 1 and this behavior iscaused by the wrong extrapolation (spectroscopic dataonly shows values of [Fe/H] lowers for the solar neigh-borhood). In contrast, Berthet shows a good behaviorin the hole range.The same can be applied to the cali-bration of Schuster&Nissen that reach unrealistic valuesup to [Fe/H] ≈ 6. Haywood extrapolates better but alsoshows large values of metallicity and Casagrande calibra-tion seems more well defined behavior.
III. DATA AND SAMPLE SELECTION
A. Our sample
We use the catalog from Monguio et al. 2013[4] thatprovides more than twenty thousand F0-G2 stars(%56of the catalog) towards the Galactic anticenter. As dis-cussed, the catalog reach V ≈ 18 in the central part andcontains stars with different photometric quality. Fig.2estimates the distance coverage as a function of the ap-parent magnitude and the spectral type.
In order to define an accurate working sample we havefollowed the next criteria:
Treball de Fi de Grau 2 Barcelona, June 2014

The radial metallicity gradient in the Galactic disk MaCarme Pujol Marın
FIG. 1: (a) A schematic table with a validity ranges for all calibrations. (b) Berthet (continuos line) versus Nissen (dashedline) depending on δm0 index. For Nissen we give the limit values of β for the region 4. (c) Comparison of theoretical behaviorof the different calibrations versus m0 index with a constant (b − y)0. In (i) Schuster and Nissen calibration for F-type stars,in (ii) Haywood 2002 in the first range (0.22 ≤ (b− y)0 ≤ 0.37) and in (iii) the relation of Casagrande 2011.
(1) To avoid potential giants we refuse stars withlogg < 3.5. Where g is the surface gravity.
(2) To avoid possible contamination from OB-typestars we discard all the stars with [m1] < 0.16.
(3) Some stars present a large absorption at a shortdistances. It is straightforward to see that it is incor-rect. The problem could be related to extremely largeobservational errors in (b − y), that cause large excesscolor values. For that, we refuse the stars that verifysimultaneously: (b− y) > 1.0 and β < 2.65.
FIG. 2: Estimate of apparent limit magnitude (V ) as functionof a distance for different absolute visual magnitude. We usean absorption of Av ≈ 1mag/kpc. The continuos black lineshows the Vlim ≈ 16.7 (limit for inner region) and the dashedline shows the Vlim ≈ 15.7 (limit for outer region).
In Fig.3(a) we present the m0 histogram. When work-ing with the full sample we observe an asymmetric dis-tribution, having many more stars with high m0 values(high [Fe/H] abundances). This result is inconsistentwith being F0−G2 (possible classification problem). Ob-servational errors in β may lead this miss classification.
We cross-matched our sample with the Two MicronAll-Sky Survey (2MASS, Cutri et al. (2003)[4] catalog)providing JHK photometry. Absorption in these bandshave been obtained through Av and Rieke and Lebofsky(1985)[17] relations. That allow us to compute intrinsic2MASS color indexes.
Fig.4 shows our F0-F9 V sample in the (J −K)0, (J −H)0 photometric diagram. We observe a lot of stars withcolor differences significantly larger than the tabulatedvalues. Two possible explanations are: (i) we have acontamination of stars from region 5 classified as region4 (β is overestimated) or (ii) we have underestimatedcolor excess E(b − y). A too large (b − y)0 coming of atoo small β.
To clean the sample, we define:
⋄ Sample A. Contains all stars after applying condi-tions (1)-(3).
⋄ Sample B. We only use stars with more than twoobservation and with V < 15.7.
⋄ Sample C. We reject stars with: 0.04 ≤ (J −H)0 ≤0.26 and 0.06 ≤ (J −K)0 ≤ 0.33.
We show in Fig. 3 m0 and β histograms for the sam-ples. For the sample C the m0 histogram is more sym-metrical and the β histogram shows a distribution morecentered in the Crawford range than A and B samples.
Treball de Fi de Grau 3 Barcelona, June 2014

The radial metallicity gradient in the Galactic disk MaCarme Pujol Marın
FIG. 3: Histograms of each sample for (a) metallicity indica-tor m0 and (b) β index. The dashed lines marks the edges ofthe standard relations[5].
FIG. 4: We show the intrinsic color difference (J−K)0 versus(J − H)0 for the three samples. The black points are thetabulated values for Wainscoat (1992)[15]. The text labelscorresponds to the spectral type of this points
.
B. The derivation of the radial metallicity gradient
In order to calculate the gradient we use medians,because they are less influenced by outliers stars andshow less dispersion in [Fe/H]. Other options have beentested, e.g. average discarding points greater than 3σand moving averages. But the first do not improve signif-icantly the results using averages and the second optionis greatly influenced by large distance points.And for more consistency, we use the Galactic he-
liocentric distance (R − R⊙). The galactocentric dis-tance is calculated for each of the stars as: R2 =R2
⊙ + (ρ · cos(b))2 − 2R⊙ρ cos(b) cos(l). Where ρ is theradial heliocentric distance, l and b are the galactic lon-gitude and latitude respectively.
IV. RESULTS AND DISCUSSION
First, we take a Casagrande calibration to comparethe behavior between the three samples, because are themore recent and extrapolate correctly (see section II. B).In Fig.5(a) we observe that [Fe/H] abundances decreaseas we move away from the Galactic Center (GC). Thevalues around 0.2−0.3 dex in the samples A and B can bea biased due to contamination of region 5 stars (> G2).Note that median metallicity is similar to the solar, in agood agreement with Bovy et al. (2014)[1].In Fig.5(b) we compare calibrations using the sam-
ple C. We observe that all the calibrations present thesame behavior but with a different zero point. The cal-ibration of Haywood do not improve the result fromSchuster&Nissen calibration. Both give unrealistic val-ues in short Galactic distances. In contrast, the Berthetand the Casagrande calibrations seem a well behavior.The differences with the type of stars used to build thecalibrations (e.g. main sequence, giants, dwarfs or highvelocity stars) can be related to their behavior differ-ences. And also, observational uncertainties can producediscrepancies between results. Note that every calibra-tion use different parameters and some of the relationsare very complex.The data can be fit by a single linear relation:
[Fe/H] = −0.16 ± 0.06dexkpc
(R − R⊙) + 0.06 ± 0.05 and
[Fe/H] = −0.19 ± 0.03dexkpc
(R − R⊙) + 0.16 ± 0.03 for
Casagrande and for Berthet, respectively. This slopesare larger compared to the result given by Bovy et al.(2014)[1]. On the one hand, we have larger observationalerrors and difficulties in the classification into regions.We reduce significantly the number of stars to solve theseproblems increasing the statistical errors. On the otherhand, the type of stars that we used to develop the studyare different: they used a red-clump stars, while we usemain sequence stars. We do not take into account the ageof the stars while Bovy used stars with intermediate-age(1− 5 Gyr old) that can be important since there was arelation between the metallicity and ages.
Treball de Fi de Grau 4 Barcelona, June 2014

The radial metallicity gradient in the Galactic disk MaCarme Pujol Marın
FIG. 5: We show [Fe/H] abundances versus the heliocentrical distance. We observe a different behavior (a) depending on thesample. (b) depending on the calibration. The continuos line corresponds to the Bovy et a.2014[1] result.
V. CONCLUSIONS AND NEXT STEPS
We have applied an empirical calibration method toestimate the radial metallicity gradient in the Galacticdisk using Stromgren photometry. This method needsa previous classification into regions. This has been achallenge due to the large observational uncertainties inour photometric indexes for faint stars. That had ledus to propose several strategies to clean the sample. Wealso compared different metallicity calibrations found inthe literature showing the biases they introduce in thederivation of the metallicity gradient. Finally, we con-trast our result with the work of Jovy et al. 2014[1]. Ourmain results are:⋄ There is no good continuity between regions when
deriving stellar metallicities.⋄ The calibrations of Nissen, Schuster&Nissen and
Haywood show unrealistic values of metallicity (analyti-cally and with our sample) in the edges of their intervalsdue to wrong extrapolation.⋄ The criteria of photometric classification into re-
gions for faint stars are not enough to discriminate be-tween region 4 (F0−G2) and 5 (> G2). We propose touse 2MASS photometry to refuse possible contaminationstars.
⋄ Once this new criteria is applied, we check that themetallicity in the first radial bins is similar to the solarmetallicity (±0.1 dex).
⋄We confirm that the radial gradient exist in the planeand decreases as we move away from the Galactic center.
⋄ Our slope −0.16 ± 0.06dexkpc
is larger than the recent
value of APOGEE.
The use of spectroscopic data may help us to calibratethe metallicity scale. The next step would be also to useregions 3 and 5 and find a more general relation valid forMS stars and introduce other type of stars as giants.
Let us hope that Gaia will provide us more accurateinformation to explain the structure, formation and evo-lution of our galaxy.
Acknowledgments
First and foremost, I would like to thank my advisors,Francesca Figueras and Maria Monguio for all their help,dedication and patience, always looking for alternativeswhen the results were not as expected. I have much tolearn from them. Also, thank my family and friends foralways supporting me all previous years. Finally, a spe-cial thanks to Alvaro for always being by my side.
[1] Bovy, Jo, et al. arXiv preprint:1405.1032 (2014).[2] Hayden, Michael R., et al. AJ 147.5 (2014): 116.[3] Stinson, G. S., et al. MNRAS 436.1 (2013): 625-634.[4] Monguio, M., F. Figueras, and P. Grosbol. VizieR Online
Data Catalog 354 (2012): 99078.[5] Crawford, D. L. AJ 80 (1975): 955-971.[6] Figueras, F., J. Torra, and C. Jordi. A&AS 87 (1991):
319-334.[7] Smalley, B. A&A 274 (1993): 391.[8] Schuster, W. J., and P. E. Nissen. A&A 221(1989):65-77.[9] Nissen, P. E. A&A 199 (1988): 146-160.
[10] Olsen, E. H. A&AS 57 (1984): 443-466.[11] Berthet, S. A&A 236 (1990): 440-448.[12] Casagrande, L., et al. arXiv preprint:1103.4651 (2011).[13] Haywood, M. MNRAS 337.1 (2002): 151-160.[14] 2MASS All-Sky Catalog of Point Sources (Cutri et al.
2003).[15] Wainscoat, Richard J., et al. A&AS 83 (1992): 111-146.[16] Mongui i Montells, Maria. PhD thesis. UB (2013).[17] Rieke, G. H., and M. J. Lebofsky. AJ 288(1985):618-621.
Treball de Fi de Grau 5 Barcelona, June 2014