the racial and ethnic identity of latin american …jag/pol596a/latin-americans-in-census...the...
TRANSCRIPT
The Racial and Ethnic Identity of Latin American Immigrants
in Census 2000
by
Jorge del Pinal Sharon Ennis
Population Division U.S. Census Bureau
For presentation at the Annual Meeting of the Population Association of America, Philadelphia, PA, March 31, - April 2, 2005
This report is released to inform interested parties of ongoing research and to encourage discussion of work in progress.
U S CENSUSBUREAU
INTRODUCTION
In 2000, over half of the total foreign-born population residing in the United States was from Latin
America and almost half identified as Hispanic (Malone et al., 2003).1 Much research has been
conducted to try to determine the meaning of race responses reported by Hispanics. In 2000,
42 percent of Hispanics reported only Some Other Race (SOR) in answer to the race question
(Grieco and Cassidy, 2001). It is evident that some Hispanics do not identify with the major race
categories. Hispanics’ views of race and ethnicity are rooted in Latin American culture (Office of
Management and Budget, 1997; Rodriguez, 2000). As the Interagency Committee for the Review
of the Racial and Ethnic Standards of the Office of Management and Budget noted, “Conceptions
of race in Latin America…are based more on ethnicity, national origin, and culture than
appearance” (Office of Management and Budget, 1997).
Based on data from the 1990 census, Rumbaut (1996:33) concluded “most new immigrants from
the Americas were self-reported as nonwhite” and “racially mixed.” Based on analysis of the
five-percent public use micro sample (PUMS) data from Census 2000, Tafoya (2004:7)
determined that foreign-born Latinos are more likely to identify as SOR than are natives (46 and
40 percent respectively), with the exception of Cuban-born respondents. Rumbaut is not alone in
his speculation of the meaning of SOR responses among Latinos (Arce et al., 1987; Rodriguez
1991). One reason many researchers assume some groups are racially mixed is that large
proportions of their race responses were classified as “Other Race” in census data collections.
However, most of the responses in the Other Race category were in fact countries of origin, and
very few were indicators of racial mixture. One explanation for national origin responses to the
race question is the presence of several nationality descriptors (e.g. Chinese, Filipino, Japanese,
Korean, Vietnamese, etc.) that may suggest to respondents that they should report their
nationality as well (del Pinal and Lapham, 1993; Lieberson and Waters, 1988; Tienda and Ortiz,
1986).
1 Latin America encompasses Central America (including Mexico), South America, and the Caribbean.
2

Rodriguez (2000:130-1) identifies three reasons why Hispanics identify as Some Other Race: 1)
they are using it as a way to indicate that they are “mixed-race”; 2) they misunderstood the
question of race; and 3) they have a different understanding of race and view it “as culture,
national origin, ethnicity, or nationality or a combination of these and skin color.” The first two
explanations fail to consider the validity of the race responses for Hispanics, so Rodriguez
(2000:131) favors the third explanation. Tafoya (2004:3) suggests that the choice of race by
Latinos in the United States is related to their sense of belonging rather than skin color.
Differences in socio-economic status and attitudes between native-born Hispanics who identify as
White and those who identify as Some Other Race “… suggests they experience racial identity as
a measure of belonging: Feeling white seems to be a reflection of success and a sense of
inclusion” (Tafoya, 2004:3). Similarly, as suggested by Portes, Zhou, Bankston, and Gibson
(cited by Bean, Stevens and Wierzbicki, 2003:107-8), Latino immigrants may have adopted a
path of “selective assimilation” or “accommodation without assimilation,” which may lead to more
flexibility in racial identification. Racial identification occurs at several levels: reactive, symbolic,
and selective. Reactive identification may likely result from repeated discrimination and
subsequent hardening of oppositional attitudes. Better socioeconomic prospects in the immigrant
community may lead to selective identification, while symbolic identification arises among those
who are already largely incorporated culturally and economically. Tafoya’s (2004) research
seems to support these hypotheses.
In order to avoid introducing interactions due to nativity into her analysis, Tafoya (2004) limited
her analysis to U.S.-born Latino householders. On the other hand, this paper analyzes the
responses to race and Hispanic-origin questions by Latin American foreign-born respondents
from all sample forms collected in Census 2000. Unlike other research, we have the sample size
needed to examine the reporting patterns by country of birth. Similarly, we were able to
disaggregate the Some Other Race responses into categories that reflect the country of birth,
general Hispanic responses, Mestizo or mixed-race responses, and other origins. We were
3

specifically interested in the respondents who did not answer the race and the Hispanic-origin
questions, or who answered them in an unexpected manner. We also examined the ethnic
origins of these respondents as reported in the ancestry question. In this study, we analyze the
foreign-born Latin American population, which includes respondents born in Central America,
South America, and the Caribbean. Not all places of birth are shown because some did not have
a sufficiently large sample.2 Suriname was combined with French Guiana because the number of
foreign-born was not sufficient to show both separately.
DATA SOURCES
During Census 2000, every person and housing unit in the U.S. was asked basic demographic
and housing questions (for example, race, age, and relationship to householder). A sample of
these people and housing units received the long form, which asked more detailed questions
about items such as income, occupation, and housing costs. The sampling unit for Census 2000
was the housing unit, including all occupants. The long form was distributed to about 1-in-6
housing units in the U.S. For people living in group quarters, the sampling unit was the person
and the sampling rate was 1-in-6. For more information on sample design, see Chapter 8
(Accuracy of the Data) of the 2000 Census of Population and Housing Technical Documentation
at www.census.gov/prod/cen2000/doc/sf3.pdf.
This study used Census 2000 long form (sample) data to examine how respondents born in Latin
America reported race, Hispanic origin, and ancestry. The foreign-born Latin American
population includes people born in Central America, South America, and the Caribbean who were
not citizens of the U.S. or who became U.S. citizens by naturalization.3 We included respondents
in this group only if they reported place of birth and citizenship data; allocated data were not
used. We also examined the responses of respondents from both Spanish- and non-Spanish-
2 Countries or places with too few observations include Anguilla, Aruba, British Virgin Islands, Cayman Islands, Guadalupe, Martinique, Montserrat, Netherland Antilles, St. Barthelemy, and Turks and Caicos. 3 Puerto Ricans are U.S. citizens at birth and are not considered foreign-born. Respondents born in Puerto Rico and living in the U.S. are included in this study only for comparison purposes.
4

speaking countries, because sometimes respondents from non-Spanish-speaking countries
identify as Hispanic and respondents from Spanish-speaking countries do not identify as
Hispanic. In the latter case, we were interested in the ancestry reported to try to determine the
ethnicity of the respondent.
RESULTS
Race Reporting in Census 2000
Table 1 shows the distribution of reported race in Census 2000 by the foreign-born
population from Central America. A relatively high proportion of respondents from the Spanish-
speaking countries either did not answer the race question (about 7 percent or more) or identified
in a way that left them classified as Some Other Race (about 23 percent or more).4 These
responses, in effect, do not correspond to any of the other Office of Management and Budget
(OMB) categories.5
Few Central American respondents selected two or more races. More than half of Costa
Ricans and Nicaraguans, while one-quarter of Panamanians reported themselves as White.6
About 40 percent of Panamanians reported themselves as Black, as did about seven percent of
Costa Ricans and over five percent of Hondurans. For Salvadorans, Guatemalans, and
Mexicans the modal reporting category was Some Other Race (SOR), while it was White for
Costa Ricans, Nicaraguans, and Hondurans. The modal category for Panamanians was Black,
and of all the Spanish-speaking Central Americans, Panamanians had a racial distribution most
similar to Belizeans, albeit with proportionately fewer Blacks and proportionately more Whites.7
4 In a later section, we examine what is being reported that becomes classified as Some Other Race. 5 The five Office of Management and Budget (OMB) race categories are: 1) White; 2) Black or African American; 3) American Indian or Alaska Native; 4) Asian; and 5) Native Hawaiian and Other Pacific Islander. See http://www.whitehouse.gov/omb/fedreg/1997standards.html for more information. 6 All comparisons made in this paper have been statistically tested and are significant at the 90-percent confidence level unless noted otherwise. 7 The difference between the proportions of Panamanians and Belizeans was statistically significant for the Some Other Race and Two or More Races categories.
5
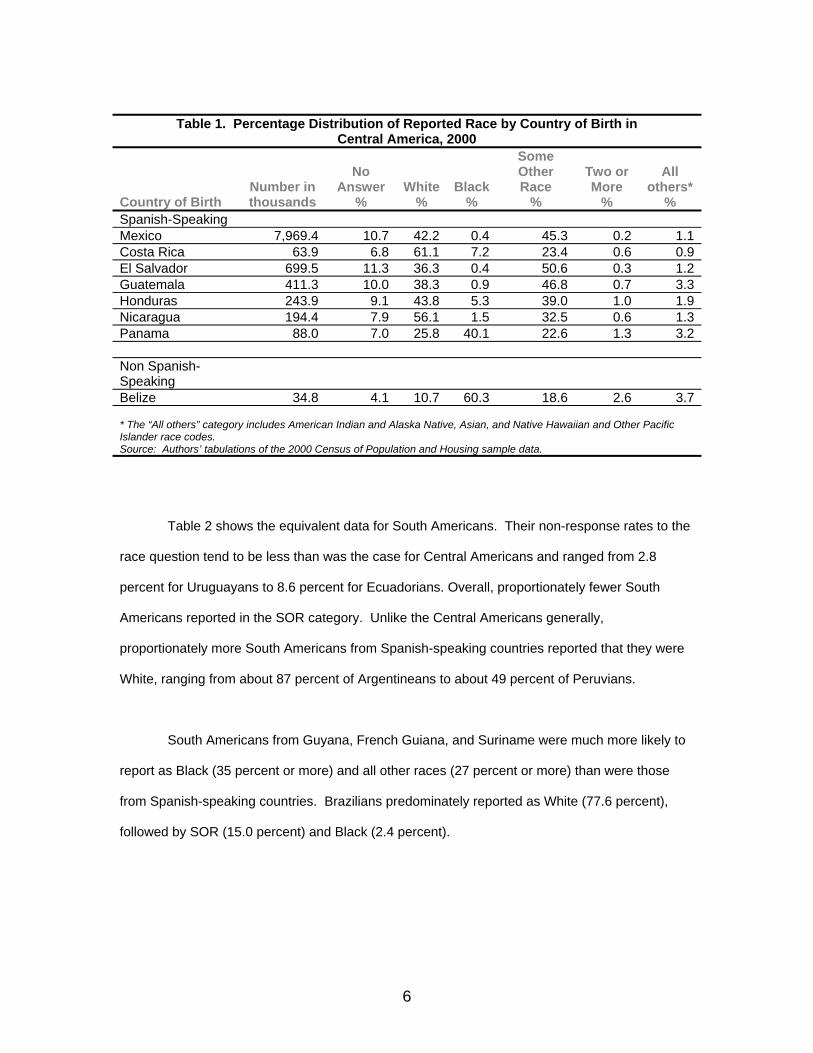
Table 1. Percentage Distribution of Reported Race by Country of Birth in
Central America, 2000
Country of Birth Number in thousands
No Answer
% White
% Black
%
Some Other Race
%
Two or More
%
All others*
% Spanish-Speaking Mexico 7,969.4 10.7 42.2 0.4 45.3 0.2 1.1Costa Rica 63.9 6.8 61.1 7.2 23.4 0.6 0.9El Salvador 699.5 11.3 36.3 0.4 50.6 0.3 1.2Guatemala 411.3 10.0 38.3 0.9 46.8 0.7 3.3Honduras 243.9 9.1 43.8 5.3 39.0 1.0 1.9Nicaragua 194.4 7.9 56.1 1.5 32.5 0.6 1.3Panama 88.0 7.0 25.8 40.1 22.6 1.3 3.2 Non Spanish-Speaking
Belize 34.8 4.1 10.7 60.3 18.6 2.6 3.7 * The “All others” category includes American Indian and Alaska Native, Asian, and Native Hawaiian and Other Pacific Islander race codes. Source: Authors’ tabulations of the 2000 Census of Population and Housing sample data.
Table 2 shows the equivalent data for South Americans. Their non-response rates to the
race question tend to be less than was the case for Central Americans and ranged from 2.8
percent for Uruguayans to 8.6 percent for Ecuadorians. Overall, proportionately fewer South
Americans reported in the SOR category. Unlike the Central Americans generally,
proportionately more South Americans from Spanish-speaking countries reported that they were
White, ranging from about 87 percent of Argentineans to about 49 percent of Peruvians.
South Americans from Guyana, French Guiana, and Suriname were much more likely to
report as Black (35 percent or more) and all other races (27 percent or more) than were those
from Spanish-speaking countries. Brazilians predominately reported as White (77.6 percent),
followed by SOR (15.0 percent) and Black (2.4 percent).
6
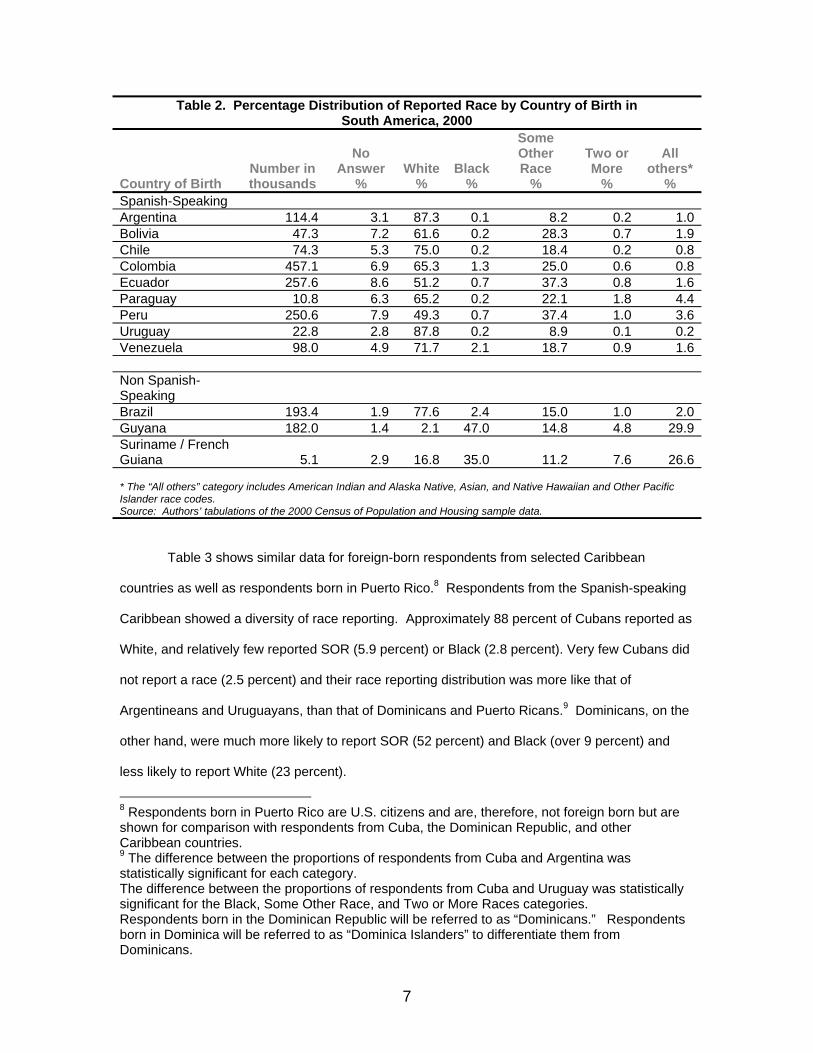
Table 2. Percentage Distribution of Reported Race by Country of Birth in South America, 2000
Country of Birth Number in thousands
No Answer
% White
% Black
%
Some Other Race
%
Two or More
%
All others*
% Spanish-Speaking Argentina 114.4 3.1 87.3 0.1 8.2 0.2 1.0Bolivia 47.3 7.2 61.6 0.2 28.3 0.7 1.9Chile 74.3 5.3 75.0 0.2 18.4 0.2 0.8Colombia 457.1 6.9 65.3 1.3 25.0 0.6 0.8Ecuador 257.6 8.6 51.2 0.7 37.3 0.8 1.6Paraguay 10.8 6.3 65.2 0.2 22.1 1.8 4.4Peru 250.6 7.9 49.3 0.7 37.4 1.0 3.6Uruguay 22.8 2.8 87.8 0.2 8.9 0.1 0.2Venezuela 98.0 4.9 71.7 2.1 18.7 0.9 1.6 Non Spanish-Speaking
Brazil 193.4 1.9 77.6 2.4 15.0 1.0 2.0Guyana 182.0 1.4 2.1 47.0 14.8 4.8 29.9Suriname / French Guiana
5.1
2.9
16.8
35.0
11.2
7.6
26.6
* The “All others” category includes American Indian and Alaska Native, Asian, and Native Hawaiian and Other Pacific Islander race codes. Source: Authors’ tabulations of the 2000 Census of Population and Housing sample data.
Table 3 shows similar data for foreign-born respondents from selected Caribbean
countries as well as respondents born in Puerto Rico.8 Respondents from the Spanish-speaking
Caribbean showed a diversity of race reporting. Approximately 88 percent of Cubans reported as
White, and relatively few reported SOR (5.9 percent) or Black (2.8 percent). Very few Cubans did
not report a race (2.5 percent) and their race reporting distribution was more like that of
Argentineans and Uruguayans, than that of Dominicans and Puerto Ricans.9 Dominicans, on the
other hand, were much more likely to report SOR (52 percent) and Black (over 9 percent) and
less likely to report White (23 percent).
8 Respondents born in Puerto Rico are U.S. citizens and are, therefore, not foreign born but are shown for comparison with respondents from Cuba, the Dominican Republic, and other Caribbean countries. 9 The difference between the proportions of respondents from Cuba and Argentina was statistically significant for each category. The difference between the proportions of respondents from Cuba and Uruguay was statistically significant for the Black, Some Other Race, and Two or More Races categories. Respondents born in the Dominican Republic will be referred to as “Dominicans.” Respondents born in Dominica will be referred to as “Dominica Islanders” to differentiate them from Dominicans.
7

A very high percentage of Dominicans did not report the standard OMB groups (52
percent reported as SOR and more than 12 percent did not report a race). In contrast,
respondents born in Puerto Rico (and living in the U.S.) were more likely not to answer the race
question (14.3 percent) or to report White (47.7 percent), and were less likely to report SOR (32.6
percent) or Black (3.6 percent), than were Dominicans. Interestingly, Christenson (2003) found
that over 80 percent of the residents of Puerto Rico reported as White, 8 percent as Black, and
about 5 percent failed to answer the race question in Census 2000 (del Pinal, 2004:37-38).10
Thus, the residents of Puerto Rico had a reporting pattern more like Cubans than Island-born
Puerto Ricans in the U.S.
Table 3 also shows that respondents from the non-Spanish-speaking Caribbean had
more complete reporting of race than those from Spanish-speaking origins. The preponderance
of the former reported Black (73 percent or more). With the exception of respondents from the
Bahamas, Dominica, and Trinidad & Tobago, 92 percent or more of respondents from the other
non-Spanish-speaking Caribbean countries reported Black. About 87 percent from the Bahamas
reported Black and nearly 9 percent reported White. Almost 6 percent of those from Trinidad &
Tobago reported two or more races and 11 percent reported all other races. About 9 percent of
Dominica Islanders reported White and almost 12 percent reported SOR.11
Respondents from Haiti, which shares the island of Hispaniola with the Dominican
Republic, had a very different reporting pattern than Dominicans.12 Haitians were much more
likely to answer the race question and were about ten times more likely to report as Black than
10 These percentages include imputed values for race for respondents that did not answer the race question in Puerto Rico. 11 It is possible that some respondents from the Dominican Republic were classified as Dominica Islanders and vice versa, because of the difficulty in interpreting write-in entries in place of birth and Hispanic origin. For example, a write-in of Dominican was interpreted as the Dominican Republic, but might have meant Dominica Island instead. A write-in of Dominica was interpreted as Dominica Island but could have meant Dominican Republic. 12 The difference between the proportions of Haitians and Dominicans reporting two or more races was not statistically significant.
8
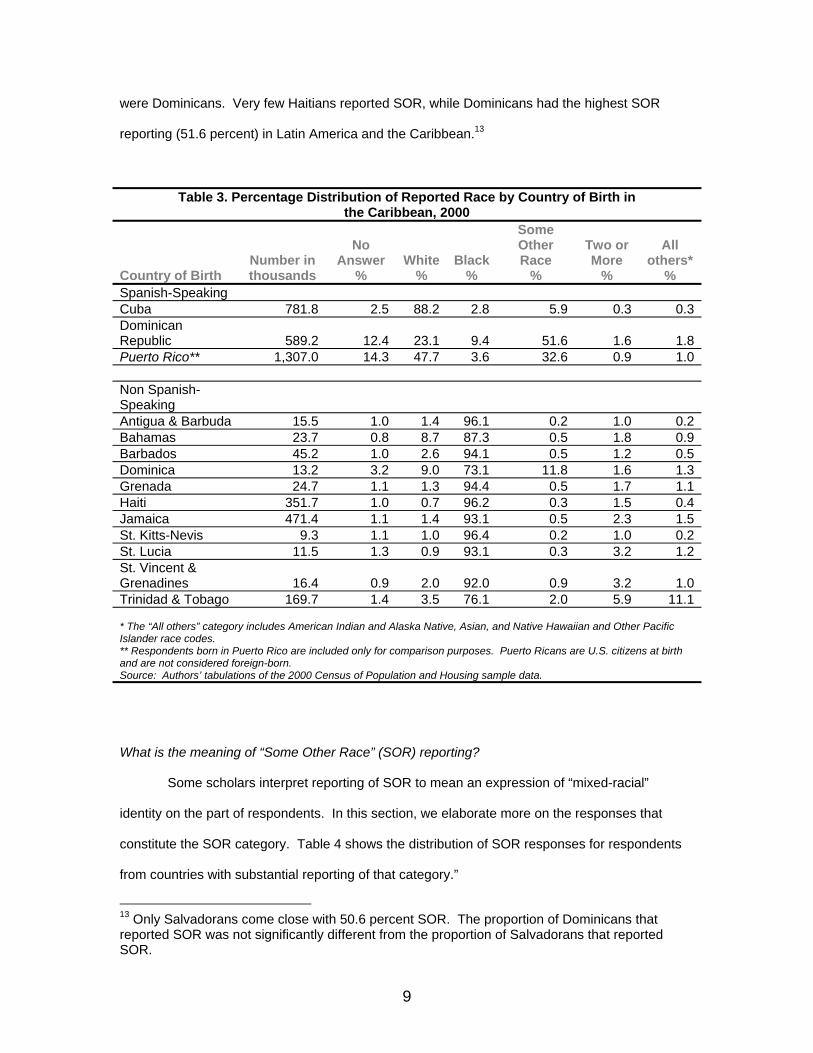
were Dominicans. Very few Haitians reported SOR, while Dominicans had the highest SOR
reporting (51.6 percent) in Latin America and the Caribbean.13
Table 3. Percentage Distribution of Reported Race by Country of Birth in the Caribbean, 2000
Country of Birth Number in thousands
No Answer
% White
% Black
%
Some Other Race
%
Two or More
%
All others*
% Spanish-Speaking Cuba 781.8 2.5 88.2 2.8 5.9 0.3 0.3Dominican Republic
589.2
12.4
23.1
9.4
51.6
1.6
1.8
Puerto Rico** 1,307.0 14.3 47.7 3.6 32.6 0.9 1.0 Non Spanish-Speaking
Antigua & Barbuda 15.5 1.0 1.4 96.1 0.2 1.0 0.2Bahamas 23.7 0.8 8.7 87.3 0.5 1.8 0.9Barbados 45.2 1.0 2.6 94.1 0.5 1.2 0.5Dominica 13.2 3.2 9.0 73.1 11.8 1.6 1.3Grenada 24.7 1.1 1.3 94.4 0.5 1.7 1.1Haiti 351.7 1.0 0.7 96.2 0.3 1.5 0.4Jamaica 471.4 1.1 1.4 93.1 0.5 2.3 1.5St. Kitts-Nevis 9.3 1.1 1.0 96.4 0.2 1.0 0.2St. Lucia 11.5 1.3 0.9 93.1 0.3 3.2 1.2St. Vincent & Grenadines
16.4
0.9
2.0
92.0
0.9
3.2
1.0
Trinidad & Tobago 169.7 1.4 3.5 76.1 2.0 5.9 11.1 * The “All others” category includes American Indian and Alaska Native, Asian, and Native Hawaiian and Other Pacific Islander race codes. ** Respondents born in Puerto Rico are included only for comparison purposes. Puerto Ricans are U.S. citizens at birth and are not considered foreign-born. Source: Authors’ tabulations of the 2000 Census of Population and Housing sample data.
What is the meaning of “Some Other Race” (SOR) reporting?
Some scholars interpret reporting of SOR to mean an expression of “mixed-racial”
identity on the part of respondents. In this section, we elaborate more on the responses that
constitute the SOR category. Table 4 shows the distribution of SOR responses for respondents
from countries with substantial reporting of that category.”
13 Only Salvadorans come close with 50.6 percent SOR. The proportion of Dominicans that reported SOR was not significantly different from the proportion of Salvadorans that reported SOR.
9

Table 4. Percentage Distribution of “Some Other Race” Response Type by
Country of Birth in Central America and the Caribbean, 2000
Country of Birth
Number in thousands
Checkbox%
Country%
Region%
General Hispanic
%
Mestizo or
Mixed-Race
%
All others*
% Mexico 3,612.4 0.7 56.6 5.7 33.7 1.8 1.5Costa Rica 14.9 1.2 32.4 14.1 48.3 1.3 2.6El Salvador 353.7 1.0 25.9 18.4 48.8 2.4 3.6Guatemala 192.4 1.1 29.9 17.9 45.6 2.2 3.3Honduras 95.0 1.1 27.9 14.2 48.7 4.9 3.3Nicaragua 63.2 0.8 25.1 17.2 49.2 4.1 3.6Panama 19.8 1.5 36.9 13.4 42.6 3.4 2.3 Cuba 46.1 1.1 37.8 6.7 45.0 7.5 1.9Dominican R. 303.9 1.0 31.9 10.7 45.6 4.2 6.6Puerto Rico** 425.5 1.1 48.1 6.1 42.2 1.0 1.5 Belize 6.5 1.3 52.5 9.0 21.9 9.4 5.9 * The “All others” category includes SOR codes that do not fit into the above categories. ** Respondents born in Puerto Rico are included only for comparison purposes. Puerto Ricans are U.S. citizens at birth and are not considered foreign-born. Source: Authors’ tabulations of the 2000 Census of Population and Housing sample data.
Looking first at respondents born in Mexico, over 3.6 million respondents gave an SOR
response. Of those, less than one percent (0.7) of Mexicans marked the SOR checkbox and did
not write in a response. Nearly 57 percent of Mexicans wrote in “Mexico” or “Mexican” as their
SOR response and about 6 percent wrote in a regional term such as “Central American” or “Latin
American.” About 34 percent of Mexicans who reported SOR described their race with a general
Hispanic response such as “Hispanic,” “Latino,” or “Spanish.” Less than 2 percent of Mexicans
described their SOR response as “Mestizo” or some other terms indicating a mixed-racial identity.
Compared to Mexicans, other Central Americans from Spanish-speaking countries were
less likely to report a country as their SOR response and more likely to report a region and a
general Hispanic term. Excluding Costa Ricans, respondents from Spanish-speaking Central
American countries were slightly more likely to report being Mestizo than respondents from
10
Mexico.14 Mexicans, while not significantly different from Costa Ricans or Panamanians, were
slightly less likely to report all other terms.15 Respondents born in Belize were more likely than
respondents from the other Central American and Caribbean countries, except Mexico, to report
a country (53 percent).16 Compared to other Central Americans, Belizeans were more likely to
report Mestizo (9 percent) and all other terms (6 percent).17 Nearly 22 percent of Belizeans
identified with general Hispanic terms. Cubans and Dominicans most identified with general
Hispanic responses, followed by country responses, while just the opposite was true for Puerto
Ricans. Cubans were more likely to identify as Mestizo (7.5 percent) than Dominicans and
Puerto Ricans.
Table 5 shows respondents from selected South American countries. The modal
response among respondents from Spanish-speaking South America was general Hispanic
followed by country and region. In Brazil and Guyana, country reports were about 75 percent or
more. About 5 percent of Brazilians used general Hispanic terms and very few (about 3 percent)
used Mestizo to describe themselves. More Guyanese described themselves as mixed (5
percent) than Brazilians and about 15 percent used other terms.
14 The proportion of Mexicans that reported being Mestizo was not significantly different from the proportion of Costa Ricans reporting the same. 15 The “All others” category includes SOR codes (Aryan, Cayenne, Brown, Indian, Multiple SOR) that do not fit into the checkbox, country, region, general Hispanic, and Mestizo categories. 16 The proportion of Belizeans that reported their country of birth as their SOR response was not significantly different from the proportions of Mexicans and Puerto Ricans that reported their country of birth. 17 The proportion of Belizeans that reported all other terms was not significantly different from the proportions of Costa Ricans, Salvadorans, Guatemalans, Hondurans, and Nicaraguans reporting the same.
11
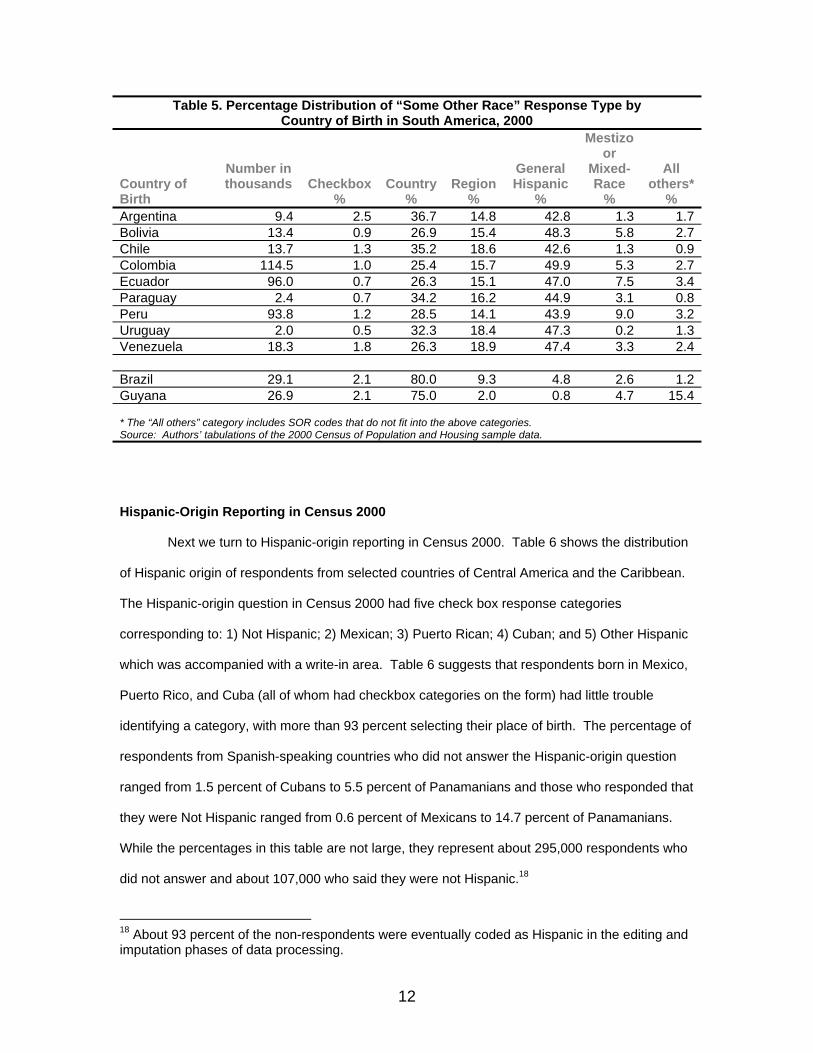
Table 5. Percentage Distribution of “Some Other Race” Response Type by Country of Birth in South America, 2000
Country of Birth
Number in thousands
Checkbox
% Country
% Region
%
General Hispanic
%
Mestizo or
Mixed-Race
%
All others*
% Argentina 9.4 2.5 36.7 14.8 42.8 1.3 1.7Bolivia 13.4 0.9 26.9 15.4 48.3 5.8 2.7Chile 13.7 1.3 35.2 18.6 42.6 1.3 0.9Colombia 114.5 1.0 25.4 15.7 49.9 5.3 2.7Ecuador 96.0 0.7 26.3 15.1 47.0 7.5 3.4Paraguay 2.4 0.7 34.2 16.2 44.9 3.1 0.8Peru 93.8 1.2 28.5 14.1 43.9 9.0 3.2Uruguay 2.0 0.5 32.3 18.4 47.3 0.2 1.3Venezuela 18.3 1.8 26.3 18.9 47.4 3.3 2.4 Brazil 29.1 2.1 80.0 9.3 4.8 2.6 1.2Guyana 26.9 2.1 75.0 2.0 0.8 4.7 15.4 * The “All others” category includes SOR codes that do not fit into the above categories. Source: Authors’ tabulations of the 2000 Census of Population and Housing sample data.
Hispanic-Origin Reporting in Census 2000
Next we turn to Hispanic-origin reporting in Census 2000. Table 6 shows the distribution
of Hispanic origin of respondents from selected countries of Central America and the Caribbean.
The Hispanic-origin question in Census 2000 had five check box response categories
corresponding to: 1) Not Hispanic; 2) Mexican; 3) Puerto Rican; 4) Cuban; and 5) Other Hispanic
which was accompanied with a write-in area. Table 6 suggests that respondents born in Mexico,
Puerto Rico, and Cuba (all of whom had checkbox categories on the form) had little trouble
identifying a category, with more than 93 percent selecting their place of birth. The percentage of
respondents from Spanish-speaking countries who did not answer the Hispanic-origin question
ranged from 1.5 percent of Cubans to 5.5 percent of Panamanians and those who responded that
they were Not Hispanic ranged from 0.6 percent of Mexicans to 14.7 percent of Panamanians.
While the percentages in this table are not large, they represent about 295,000 respondents who
did not answer and about 107,000 who said they were not Hispanic.18
18 About 93 percent of the non-respondents were eventually coded as Hispanic in the editing and imputation phases of data processing.
12

Table 6. Percentage Distribution of Hispanic Origin Responses by
Country of Birth in Central America and the Caribbean, 2000
Country of Birth
Number in thousands
No Answer
%
Not Hispanic
% Country
%
General Hispanic
%
All others*
% Mexico 7,969.4 2.5 0.6 93.2 3.6 0.1 Costa Rica 63.9 3.1 3.9 70.5 20.3 2.2 El Salvador 699.5 3.8 1.4 66.3 26.0 2.4 Guatemala 411.3 4.4 2.0 66.3 24.4 3.0 Honduras 243.9 4.2 2.5 66.1 24.9 2.3 Nicaragua 194.4 2.7 1.5 69.1 25.3 1.3 Panama 88.0 5.5 14.7 60.8 16.9 2.0 Cuba 781.8 1.5 0.6 97.1 0.4 0.3 Dominican R. 589.2 2.9 1.2 79.3 15.9 0.7 Puerto Rico** 1,307.0 1.9 2.5 93.7 1.0 1.0 Belize 34.8 7.4 61.7 16.6 12.3 2.1 * The “All others” category includes non-general Hispanic codes that are not the country of birth. ** Respondents born in Puerto Rico are included only for comparison purposes. Puerto Ricans are U.S. citizens at birth and are not considered foreign-born. Source: Authors’ tabulations of the 2000 Census of Population and Housing sample data.
Respondents from the Spanish-speaking countries who did not have checkbox
categories on the form still overwhelmingly wrote in a country origin (ranging from 61 percent of
Panamanians to 79 percent of Dominicans) but also had high proportions reporting generic
Hispanic responses (ranging from about 16 percent of Dominicans to about 26 percent of
Salvadorans). About 62 percent of Belizeans, who were not treated as Hispanics in the Census
tabulations, identified themselves as non-Hispanic. Another 17 percent identified “Belize” as their
Hispanic origin and an additional 12 percent provided general Hispanic identifiers. 19
Table 7 shows the distribution of Hispanic-origin responses of respondents born in South
America. As was the case for respondents born in Spanish-speaking Central America, most
respondents born in Spanish-speaking South America responded with their place of birth (ranging
from about 63 percent for Uruguayans to 74 percent for Colombians). Proportions of respondents
that used general Hispanic identifiers ranged from about 15 percent of Argentineans to 28 19 These respondents who identified “Belize” as their Hispanic origin were recoded as not Hispanic in the editing phase of data processing.
13

percent of Bolivians. The proportion that did not answer the Hispanic-origin question ranged from
about 2.3 percent of Colombians to about 4.2 percent of Paraguayans. The proportions
identifying as “not Hispanic” ranged from 1.5 percent of Ecuadorians to 14.9 percent of
Argentineans. The respondents from Argentina (14.9 percent), the southern cone countries
(Paraguayans 11.4 percent, Uruguayans 8.9 percent, and Chile 5.7 percent), and Venezuela (7.7
percent) had the highest proportions “not Hispanic”.20 Again these percentages are not large, but
they do represent about 39,000 respondents who did not answer and about 53,000 who said they
were not Hispanic.21
Table 7. Percentage Distribution of Hispanic Origin Responses by Country of Birth in South America, 2000
Country of Birth
Number in thousands
No Answer
%
Not Hispanic
% Country
%
General Hispanic
%
All others*
% Argentina 114.4 4.1 14.9 65.2 14.5 1.4 Bolivia 47.3 3.4 3.9 63.5 28.1 1.1 Chile 74.3 3.3 5.7 68.3 20.7 2.0 Colombia 457.1 2.3 1.7 74.3 20.7 0.9 Ecuador 257.6 3.1 1.5 70.0 24.3 1.2 Paraguay 10.8 4.2 11.4 58.2 24.5 1.6 Peru 250.6 3.3 2.9 69.4 23.5 0.9 Uruguay 22.8 3.5 8.9 63.3 22.5 1.8 Venezuela 98.0 2.8 7.7 69.4 17.9 2.2 Brazil 193.4 4.1 35.0 53.7 6.8 0.4 Guyana 182.0 5.1 94.1 0.0** 0.7 0.2 * The “All others” category includes non-general Hispanic codes that are not the country of birth. ** Respondents reporting Guyana as their Hispanic origin were recoded as not Hispanic in editing. Source: Authors’ tabulations of the 2000 Census of Population and Housing sample data.
Ancestry Reporting in Census 2000
Although the ancestry question in Census 2000 was a write-in question allowing multiple
responses, we coded up to two ancestry responses. Table 8 shows the distribution of the first
ancestry reported by the foreign-born population from Central America and the Caribbean, as well
20 The proportion of respondents born in Paraguay was not statistically different from the proportions of Argentineans and Uruguayans. The difference between the proportions of Venezuelans and Uruguayans was not statistically significant. 21 About 76 percent of the non-respondents were eventually coded as Hispanic in the editing and imputation phases of data processing.
14
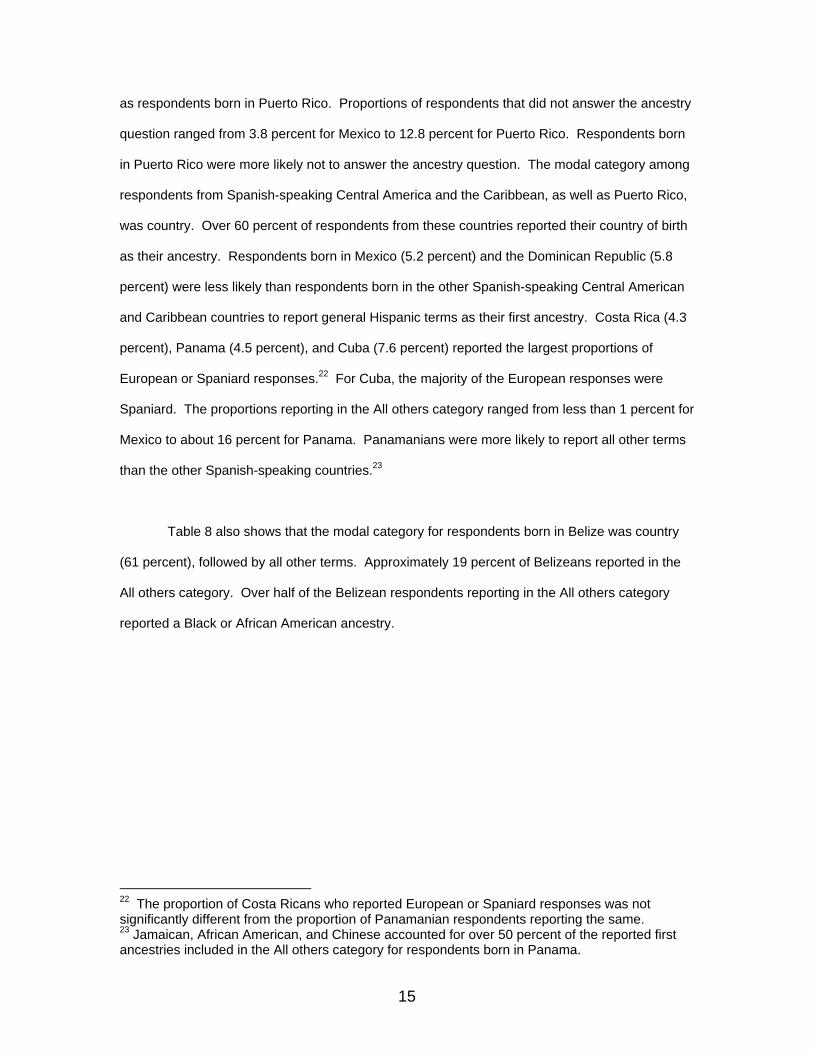
as respondents born in Puerto Rico. Proportions of respondents that did not answer the ancestry
question ranged from 3.8 percent for Mexico to 12.8 percent for Puerto Rico. Respondents born
in Puerto Rico were more likely not to answer the ancestry question. The modal category among
respondents from Spanish-speaking Central America and the Caribbean, as well as Puerto Rico,
was country. Over 60 percent of respondents from these countries reported their country of birth
as their ancestry. Respondents born in Mexico (5.2 percent) and the Dominican Republic (5.8
percent) were less likely than respondents born in the other Spanish-speaking Central American
and Caribbean countries to report general Hispanic terms as their first ancestry. Costa Rica (4.3
percent), Panama (4.5 percent), and Cuba (7.6 percent) reported the largest proportions of
European or Spaniard responses.22 For Cuba, the majority of the European responses were
Spaniard. The proportions reporting in the All others category ranged from less than 1 percent for
Mexico to about 16 percent for Panama. Panamanians were more likely to report all other terms
than the other Spanish-speaking countries.23
Table 8 also shows that the modal category for respondents born in Belize was country
(61 percent), followed by all other terms. Approximately 19 percent of Belizeans reported in the
All others category. Over half of the Belizean respondents reporting in the All others category
reported a Black or African American ancestry.
22 The proportion of Costa Ricans who reported European or Spaniard responses was not significantly different from the proportion of Panamanian respondents reporting the same. 23 Jamaican, African American, and Chinese accounted for over 50 percent of the reported first ancestries included in the All others category for respondents born in Panama.
15

Table 8. Percentage Distribution of First Ancestry Responses by Country of Birth in Central America and the Caribbean, 2000
Country of Birth
Number in thousands
No Answer
% Country
%
European or
Spaniard %
General Hispanic
%
All others*
% Mexico 7,969.4 3.8 90.4 0.4 5.2 0.3 Costa Rica 63.9 5.0 66.9 4.3 18.3 5.4 El Salvador 699.5 6.2 74.2 1.0 17.6 1.1 Guatemala 411.3 5.9 73.5 1.5 17.1 2.0 Honduras 243.9 6.6 72.1 1.7 17.2 2.4 Nicaragua 194.4 5.6 75.9 2.1 14.9 1.6 Panama 88.0 6.5 61.5 4.5 11.6 15.9 Cuba 781.8 7.4 72.9 7.6 10.7 1.3 Dominican R. 589.2 5.4 87.2 0.7 5.8 1.0 Puerto Rico** 1,307.0 12.8 71.2 2.9 10.7 2.4 Belize 34.8 7.6 60.8 3.8 8.7 19.1 * The “All others” category includes African, Asian, and North American countries, as well as Central American, South American, and Caribbean countries that are not the country of birth. ** Respondents born in Puerto Rico are included only for comparison purposes. Puerto Ricans are U.S. citizens at birth and are not considered foreign-born. Source: Authors’ tabulations of the 2000 Census of Population and Housing sample data.
Table 9 shows similar data for respondents born in selected South American countries.
With the exception of Argentina, country was the modal response category for respondents born
in the Spanish-speaking countries of South America. The modal category for Argentineans was
European and Spaniard. Respondents born in Argentina (38.2 percent) and Uruguay (40.8
percent), although not significantly different from each other, were less likely to report country of
birth as the first ancestry. Argentineans (42.7 percent) and Uruguayans (35.1 percent) were
more likely to report in the European or Spaniard category. Venezuela-born respondents were
more likely to report all other terms (8.2 percent).24
Approximately 63 percent of Brazilians reported their country of birth and 28 percent
reported in the European or Spaniard category. Respondents born in Guyana were more likely to
not answer the ancestry question (14.1 percent) than the other South Americans. The modal
24 Approximately 22 percent of the ancestries reported by Venezuelans in the All others category were countries in North Africa and Southwest Asia. Colombian and Cuban each accounted for about 15 percent of this category.
16
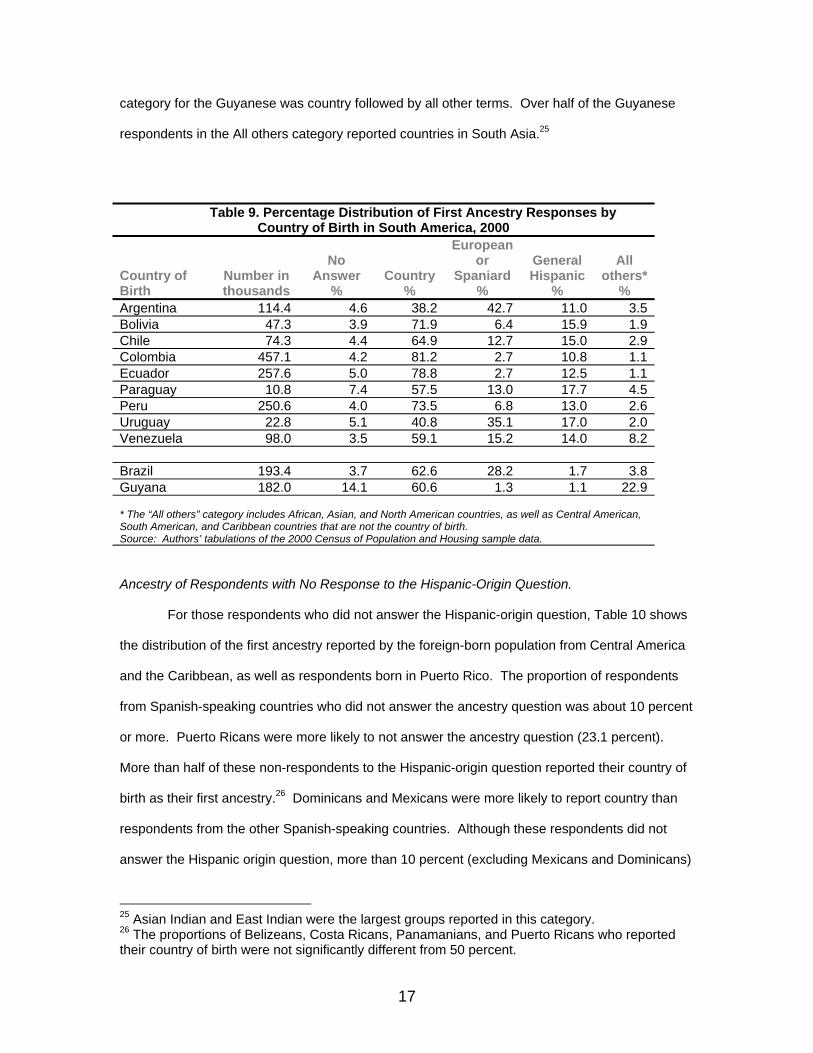
category for the Guyanese was country followed by all other terms. Over half of the Guyanese
respondents in the All others category reported countries in South Asia.25
Table 9. Percentage Distribution of First Ancestry Responses by
Country of Birth in South America, 2000
Country of Birth
Number in thousands
No Answer
% Country
%
European or
Spaniard %
General Hispanic
%
All others*
% Argentina 114.4 4.6 38.2 42.7 11.0 3.5 Bolivia 47.3 3.9 71.9 6.4 15.9 1.9 Chile 74.3 4.4 64.9 12.7 15.0 2.9 Colombia 457.1 4.2 81.2 2.7 10.8 1.1 Ecuador 257.6 5.0 78.8 2.7 12.5 1.1 Paraguay 10.8 7.4 57.5 13.0 17.7 4.5 Peru 250.6 4.0 73.5 6.8 13.0 2.6 Uruguay 22.8 5.1 40.8 35.1 17.0 2.0 Venezuela 98.0 3.5 59.1 15.2 14.0 8.2 Brazil 193.4 3.7 62.6 28.2 1.7 3.8 Guyana 182.0 14.1 60.6 1.3 1.1 22.9 * The “All others” category includes African, Asian, and North American countries, as well as Central American, South American, and Caribbean countries that are not the country of birth. Source: Authors’ tabulations of the 2000 Census of Population and Housing sample data. Ancestry of Respondents with No Response to the Hispanic-Origin Question.
For those respondents who did not answer the Hispanic-origin question, Table 10 shows
the distribution of the first ancestry reported by the foreign-born population from Central America
and the Caribbean, as well as respondents born in Puerto Rico. The proportion of respondents
from Spanish-speaking countries who did not answer the ancestry question was about 10 percent
or more. Puerto Ricans were more likely to not answer the ancestry question (23.1 percent).
More than half of these non-respondents to the Hispanic-origin question reported their country of
birth as their first ancestry.26 Dominicans and Mexicans were more likely to report country than
respondents from the other Spanish-speaking countries. Although these respondents did not
answer the Hispanic origin question, more than 10 percent (excluding Mexicans and Dominicans)
25 Asian Indian and East Indian were the largest groups reported in this category. 26 The proportions of Belizeans, Costa Ricans, Panamanians, and Puerto Ricans who reported their country of birth were not significantly different from 50 percent.
17

reported general Hispanic terms.27 Costa Ricans and Panamanians reported the largest
proportions of all other terms.28 About 11 percent of Cubans reported themselves as European or
Spaniard, as did about 6 percent of Costa Ricans.
The modal category for Belizeans who did not respond to the Hispanic-origin question
was country (52.3 percent). Approximately 15 percent of respondents from Belize reported a
general Hispanic term as their first ancestry. As with respondents from Costa Rica and Panama,
Belizeans reported a large proportion in the “All others” category.29
Table 10. Percentage Distribution of First Ancestry Responses by Country of Birth in Central America and the Caribbean, No Response to Hispanic Origin, 2000
Country of Birth
Number in thousands
No Answer
% Country
%
European or
Spaniard %
General Hispanic
%
All others*
% Mexico 198.0 9.9 82.3 0.8 6.4 0.6 Costa Rica 2.0 9.9 51.1 6.4 19.9 12.6 El Salvador 26.8 15.8 63.2 1.0 18.6 1.4 Guatemala 18.0 14.8 61.5 2.1 18.1 3.5 Honduras 10.2 16.7 58.5 1.8 16.5 6.6 Nicaragua 5.3 15.1 59.1 3.1 17.8 4.8 Panama 4.9 12.1 53.4 3.3 10.6 20.6 Cuba 12.1 17.1 55.9 11.3 12.5 3.2 Dominican R. 17.2 13.2 75.0 1.1 8.3 2.4 Puerto Rico** 24.6 23.1 51.4 3.3 13.4 8.8 Belize 2.6 13.8 52.3 4.7 14.9 14.5 * The “All others” category includes African, Asian, and North American countries, as well as Central American, South American, and Caribbean countries that are not the country of birth. ** Respondents born in Puerto Rico are included only for comparison purposes. Puerto Ricans are U.S. citizens at birth and are not considered foreign-born. Source: Authors’ tabulations of the 2000 Census of Population and Housing sample data.
27 The proportion of Panamanians who reported general Hispanic terms was not significantly different from 10 percent. 28 Approximately 40 percent of Costa Ricans and Panamanians reporting other terms reported Jamaican as their first ancestry. The proportion of Costa Ricans reporting all other terms was not significantly different from the proportions of Panamanians, Hondurans, Nicaraguans, or Puerto Ricans reporting the same. 29 The proportion of Belizeans reporting all other terms was not significantly different from the proportions of Costa Ricans, Panamanians, Hondurans, or Puerto Ricans reporting the same.
18

Table 11 shows the same data for respondents born in selected South American
countries. About 7 percent or more of respondents from South America did not answer the
ancestry question. The modal category for South Americans, except Argentineans and
Uruguayans, was country.
Table 11. Percentage Distribution of First Ancestry Responses by Country of Birth in South America, No Response to Hispanic Origin, 2000
Country of Birth
Number in thousands
No Answer
% Country
%
European or
Spaniard %
General Hispanic
%
All others*
% Argentina 4.7 9.0 28.5 48.7 10.2 3.7 Bolivia 1.6 16.6 58.0 9.6 12.4 3.4 Chile 2.5 8.6 52.8 18.5 13.6 6.5 Colombia 10.5 13.2 63.9 5.1 13.8 4.1 Ecuador 7.9 15.7 63.0 4.1 15.1 2.0 Paraguay 0.5 14.2 47.8 9.6 24.7 3.8 Peru 8.2 9.2 60.2 11.3 14.1 5.2 Uruguay 0.8 17.3 23.4 45.1 13.7 0.5 Venezuela 2.7 9.5 35.8 21.3 15.9 17.5 Brazil 8.0 6.5 50.7 34.2 3.5 5.0 Guyana 9.2 22.0 56.2 0.6 2.7 18.5 * The “All others” category includes African, Asian, and North American countries, as well as Central American, South American, and Caribbean countries that are not the country of birth. Source: Authors’ tabulations of the 2000 Census of Population and Housing sample data.
A high proportion of Argentineans (48.7 percent) and Uruguayans (45.1 percent) reported
European or Spaniard ancestry, with the majority of responses being European other than
Spaniard. Guyanese respondents were less likely to report a European or Spaniard first ancestry,
while respondents born in Argentina, Brazil, and Uruguay were more likely to report in the
European or Spaniard category.30 The proportion of respondents from the Spanish-speaking
countries of South America who reported general Hispanic terms was about 10 percent or more.
30 The proportion of Guyanese respondents who reported European or Spaniard ancestries was not significantly different from the Paraguayan respondents. The proportion of Uruguayans who reported European or Spaniard ancestries was not significantly different from the proportions of Argentineans and Brazilians.
19
Venezuelan (17.5 percent) and Guyanese (18.5 percent) respondents were more likely to report
in the All others category.31
Ancestry of Non-Hispanic Respondents.
For those respondents who reported being non-Hispanic, Table 12 shows the distribution
of the first ancestry reported by the foreign-born population from Central America and the
Caribbean, as well as respondents born in Puerto Rico. The proportion of respondents who did
not answer the ancestry question ranged from 6.6 percent for Belize to 23.4 percent for El
Salvador. In every country except Panama, Cuba, and Puerto Rico, the highest proportion of
non-Hispanic respondents reported in the country category. Mexicans (61.2 percent),
Dominicans (60.7 percent), and Belizeans (63.2 percent), while not significantly different from
each other, reported a country at a higher rate than other respondents from Central America and
the Caribbean.32 The modal category for Panamanians (42.6 percent) and Cubans (32.0 percent)
was All others.33 The proportion of Costa Ricans who reported in the All others category was
relatively high at 31.8 percent.34 Respondents born in Puerto Rico were much more likely to
report in the European or Spaniard category, with most of the ancestries reported being
European other than Spaniard. Although the respondents discussed here reported themselves
as non-Hispanic, the proportion that reported general Hispanic codes ranged from 2.6 percent for
Panamanians to 19.0 percent for Guatemalans.
31 The largest ancestry group that Venezuelans reported in the All others category was Cuban (22 percent), followed by other South American (21 percent) and North African and Southwest Asian ancestries (18 percent). East Indian, Asian Indian, and West Indian accounted for about 65 percent of the reported first ancestries included in the All others category for respondents born in Guyana. The proportion of Venezuelans that reported in the All others category was not significantly different from the proportions of Guyanese or Paraguayans reporting in that same category. 32 The proportion of Dominicans reporting their country of birth was not significantly different from the proportion of Salvadorans doing the same. 33 For Panamanians, African American or Black and Jamaican ancestries accounted for approximately 60 percent of the terms in the All others category. Of respondents born in Cuba reporting other terms, the majority reported Jamaican and Chinese ancestries. 34 Jamaican was the largest ancestry reported by Costa Ricans in the All others category.
20

Table 12. Percentage Distribution of First Ancestry Responses by Country of Birth in Central America and the Caribbean, Non-Hispanic Respondents, 2000
Country of Birth
Number in thousands
No Answer
% Country
%
European or
Spaniard %
General Hispanic
%
All others*
% Mexico 51.7 14.3 61.2 12.4 5.4 6.7 Costa Rica 2.5 8.3 34.3 15.3 10.3 31.8 El Salvador 10.1 23.4 51.7 3.4 18.4 3.2 Guatemala 8.2 16.9 44.9 6.4 19.0 12.8 Honduras 6.1 14.7 40.2 12.2 14.6 18.3 Nicaragua 2.9 14.9 46.0 9.0 13.2 16.9 Panama 12.9 9.2 34.6 11.0 2.6 42.6 Cuba 5.0 10.3 28.8 22.0 6.9 32.0 Dominican R. 7.2 12.0 60.7 4.8 7.3 15.2 Puerto Rico** 32.1 18.1 6.9 45.8 3.6 25.6 Belize 27.3 6.6 63.2 3.8 6.1 20.2 * The “All others” category includes African, Asian, and North American countries, as well as Central American, South American, and Caribbean countries that are not the country of birth. ** Respondents born in Puerto Rico are included only for comparison purposes. Puerto Ricans are U.S. citizens at birth and are not considered foreign-born. Source: Authors’ tabulations of the 2000 Census of Population and Housing sample data.
Table 13 shows the same data as Table 12 for respondents born in selected South
American countries. For non-Hispanic respondents from Spanish-speaking South American
countries, excluding Colombia and Ecuador, the modal category was European or Spaniard. For
Colombians and Ecuadorians, the modal category was country, followed by the European or
Spaniard category. Paraguayans (27.9 percent), Peruvians (27.8), and Venezuelans (28.4
percent) were more likely to report in the All others category.35 The proportion of non-Hispanic
respondents born in Ecuador were most likely to report general Hispanic terms (15.8 percent).36
35 Approximately 78 percent of Paraguayans who reported other terms reported Korean as their first ancestry. The largest ancestry groups reported by Peruvians in this category were Japanese (42 percent) and Chinese (35 percent). For Venezuelans, Chinese and Lebanese ancestries accounted for over 40 percent of the terms reported in the All others category. No significant difference existed between the proportions of respondents reporting in the All others category for the respondents born in Paraguay, Peru, and Venezuela. The proportion of respondents from Paraguay that reported in the All others category was not significantly different from the proportions of respondents from Bolivia or Chile. 36 The proportion of Ecuadorians reporting general Hispanic terms was not significantly different from the proportions of Bolivians, Columbians, and Peruvians reporting the same.
21
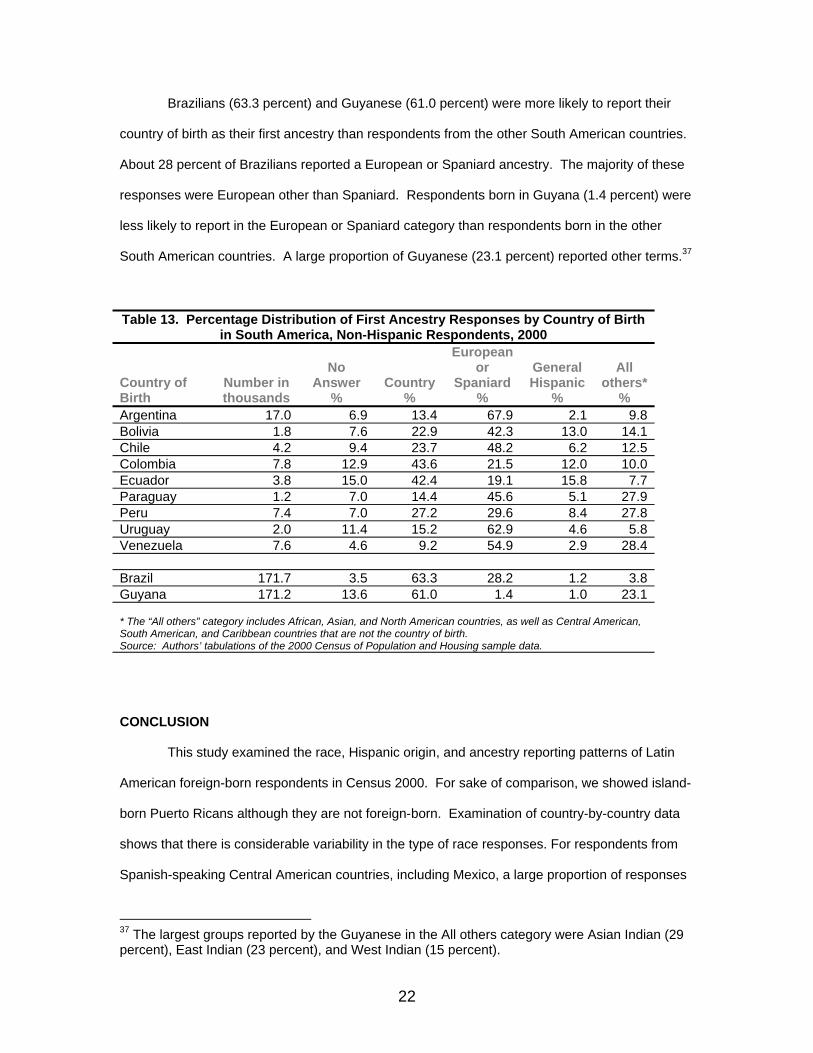
Brazilians (63.3 percent) and Guyanese (61.0 percent) were more likely to report their
country of birth as their first ancestry than respondents from the other South American countries.
About 28 percent of Brazilians reported a European or Spaniard ancestry. The majority of these
responses were European other than Spaniard. Respondents born in Guyana (1.4 percent) were
less likely to report in the European or Spaniard category than respondents born in the other
South American countries. A large proportion of Guyanese (23.1 percent) reported other terms.37
Table 13. Percentage Distribution of First Ancestry Responses by Country of Birth
in South America, Non-Hispanic Respondents, 2000
Country of Birth
Number in thousands
No Answer
% Country
%
European or
Spaniard %
General Hispanic
%
All others*
% Argentina 17.0 6.9 13.4 67.9 2.1 9.8 Bolivia 1.8 7.6 22.9 42.3 13.0 14.1 Chile 4.2 9.4 23.7 48.2 6.2 12.5 Colombia 7.8 12.9 43.6 21.5 12.0 10.0 Ecuador 3.8 15.0 42.4 19.1 15.8 7.7 Paraguay 1.2 7.0 14.4 45.6 5.1 27.9 Peru 7.4 7.0 27.2 29.6 8.4 27.8 Uruguay 2.0 11.4 15.2 62.9 4.6 5.8 Venezuela 7.6 4.6 9.2 54.9 2.9 28.4 Brazil 171.7 3.5 63.3 28.2 1.2 3.8 Guyana 171.2 13.6 61.0 1.4 1.0 23.1 * The “All others” category includes African, Asian, and North American countries, as well as Central American, South American, and Caribbean countries that are not the country of birth. Source: Authors’ tabulations of the 2000 Census of Population and Housing sample data. CONCLUSION
This study examined the race, Hispanic origin, and ancestry reporting patterns of Latin
American foreign-born respondents in Census 2000. For sake of comparison, we showed island-
born Puerto Ricans although they are not foreign-born. Examination of country-by-country data
shows that there is considerable variability in the type of race responses. For respondents from
Spanish-speaking Central American countries, including Mexico, a large proportion of responses
37 The largest groups reported by the Guyanese in the All others category were Asian Indian (29 percent), East Indian (23 percent), and West Indian (15 percent).
22
to the race question was either White or SOR. The majority of Costa Ricans and Nicaraguans
reported as White. On the other hand, only Salvadorans reported slightly more than 50 percent
SOR. The main reason our findings differ from those of other researchers is that we tabulated
imputed responses separately – the level of non-response to race ranges from about 7 to 11
percent.
Similarly, the modal category for respondents from Spanish-speaking South American
countries was White. Only Peru had fewer respondents reporting as White. Proportionately fewer
South Americans reported in the SOR category than Central Americans, and non-response to
race was also lower, ranging from about 3 to 9 percent. Among Spanish-speaking Caribbean
countries, the majority of respondents from Cuba was White and from the Dominican Republic
was SOR. About 12 percent of Dominicans did not respond to race, compared with less than 3
percent of Cubans. Respondents born in Puerto Rico had a high non-response rate (about 14
percent), and proportionately more reported as White than SOR.
For respondents from non-Spanish speaking countries, the modal category was Black,
with the exception of Brazil, where about 78 percent reported White and only about 2 percent
reported Black. Very few respondents from the non-Spanish-speaking Caribbean reported SOR.
Non-response was lower on average than was the case among Spanish-speaking countries. Few
respondents born in Latin America selected two or more races, but this seemed to occur more so
among respondents from Spanish-speaking countries. This finding runs contrary to the
expectation that “multiracial identifications” may be more likely among Latino immigrants (Bean,
Stevens and Wierzbicki, 2003:107).
Responses that constituted the SOR category for selected Central American, South
American, and Caribbean countries were disaggregated. Very few respondents reported Mestizo
or other mixed race terms, but a high proportion of Latin American-born respondents reported
their country of birth or reported a general Hispanic term. This finding tends to support the
Rodriguez (2000:131) hypothesis that Latinos view race as “culture, national origin, ethnicity, or
nationality or a combination of these.”
23

In answering the Hispanic-origin question, a large proportion of respondents born in
Spanish-speaking countries in Central America, South America, and the Caribbean responded
with their country of birth. In excess of 93 percent of respondents from Mexico, Cuba, and Puerto
Rico selected their place of birth. This is not surprising given that Mexican, Cuban, and Puerto
Rican were each checkbox responses on the questionnaire, while other groups had to write their
response on the questionnaire. It is less clear why the balance preferred not to answer the
Hispanic origin question (1.5 to 2.5 percent), selected general Hispanic terms (0.4 to 3.6 percent),
said they were not Hispanic (0.6 to 2.5 percent), or gave a different Hispanic ethnicity (0.1 to 1.0
percent). Substantial proportions of Latin Americans from Spanish-speaking countries did not
respond to Hispanic-origin question (1.5 to 5.5 percent) or reported that they were not Hispanic
(0.6 to 14.9 percent) – almost 15 percent of Panamanians and Argentineans reported that they
were not Hispanic. About 61 percent of Brazilians and about 31 percent of Belizeans reported
Hispanic although they are not officially considered Hispanic.38
Looking at the first ancestry response, the great majority of respondents selected their
country, with the exception of Argentina. Argentineans were a bit more likely to report Spaniard
or a European first ancestry. Examining the second ancestry reported did not change the results.
Among respondents who did not answer the Hispanic-origin question, the highest proportion
reported their country of birth as their first ancestry, with the exception of Argentineans and
Uruguayans. Respondents born in Argentina and Uruguay were more likely to report Spaniard or
a European ancestry. Among respondents born in Central America and the Caribbean who
reported that they were not Hispanic, the highest proportion of respondents reported their country
of birth, with the exception of Panamanians, Cubans, and Puerto Ricans. The majority of
Mexicans, Salvadorans, and Dominicans reported in the country category. For South America, a
plurality of Colombians and Ecuadorians reported country of birth. This suggests that
respondents who reported their country of birth probably did not identify with the terms in the 38 During the editing process of Census 2000, respondents who reported Brazil or Belize as the response to Hispanic origin were made not Hispanic.
24
question (i.e., “Spanish/Hispanic/Latino”) but did identify with their country of origin. The modal
category for Panamanians and Cubans was All others, and for respondents from the remaining
South American countries, it was European or Spaniard.39 The majority of Argentineans,
Uruguayans, and Venezuelans reported a European or Spaniard first ancestry. This suggests
that large proportions of these respondents identified with other ancestries, although many still
identified with their country of origin.
In sum, we found very little support for the notion that respondents born in Latin America
identify as multiracial or of mixed-race. Rather, the consistent theme is that they identify as
White, as their national origin, or generally as Hispanic or Latino in race. They identify primarily
with their national origin in the Hispanic-origin and ancestry questions. Small, but meaningful,
proportions of Latin Americans did not answer the Hispanic-origin question or reported as not
Hispanic. When we examined the ancestry reporting, we found that they still tended to report
their country of origin, or a general Hispanic response, or in some cases European and other
ancestries.
39 For Panamanians, African American or Black and Jamaican ancestries accounted for the majority of the terms reported in the “All others” category. Of respondents born in Cuba reporting other terms, the majority reported Jamaican and Chinese ancestries.
25
REFERENCES
Arce, Carlos H., Edward Murguía, and W. Parker Frisbie, 1987. “Phenotype and Life Chances among Chicanos,” Hispanic Journal of Behavioral Sciences, 9(1):19-32. Bean, Frank D, Gillian Stevens, and Susan Wierzbicki, 2003. “The New Immigrants and Theories of Incorporation,” pp.94-113, in Bean, Frank. D. and Gillian Stevens, America’s Newcomers and the Dynamics of Diversity. New York: Russell Sage Foundation. del Pinal, Jorge, and Susan J. Lapham, 1993. “Impact of Ethnic Data Needs in the United States,” in Statistics Canada and the U.S. Bureau of the Census, Challenges of Measuring an Ethnic World, Science, politics and reality, pp. 447-475. Washington DC: U.S. Government Printing Office. Grieco, Elizabeth M. and Rachel C. Cassidy, 2001. Overview of Race and Hispanic Origin: 2000. U.S. Census Bureau, Census 2000 Brief, C2KBR/01-1, March 2001. Kissam, Edward, Enrique Herrera, and Jorge M. Nakamoto, 1993, “Hispanic Response to Census Enumeration Forms and Procedures,” report to the Center for Survey Research Methods, U.S. Census Bureau. Lieberson, Stanley, and Mary Waters, 1988. From Many Strands: Ethnic and Racial Groups in Contemporary America. New York: Russell Sage Foundation. Malone, N., K.F. Baluja, J.M. Costanzo, and C.J. Davis (2003). The Foreign-Born Population: 2000. U.S. Census Bureau, Census 2000 Brief, C2KBR-34, December 2003. McKenny, Nampeo R., and Claudette E. Bennett, 1994. “Issues Regarding Data on Race and Ethnicity: The Census Bureau Experience,” Public Health Reports (1), pp. 16-25. Office of Management and Budget (1997). “Recommendations from the Interagency Committee for the Review of the Racial and Ethnic Standards to the Office of Management and Budget Concerning Changes to the Standards for the Classification of Federal Data on Race and Ethnicity.” Federal Register July 1997, Part II: 36873-36946. Rodríguez, Clara E., 2000. Changing Race: Latinos, the Census, and the History of Ethnicity in the United States. New York, New York: University Press. Rodríguez, Clara E., 1991. Puerto Ricans: Born in the U.S.A.. Boulder, CO: Westview Press. Rumbaut, Rubén G., 1996. “Origins and Destines: Immigration, Race, and Ethnicity in Contemporary America,” in Pedraza, Silvia, and Rubén G. Rumbaut, eds., Origins and Destinies: Immigration, Race, and Ethnicity in America, pp. 21-42. Belmont, CA: Wadsworth Publishing Company. Tafoya, Sonya, 2004. Shades of Belonging. Washington, DC: Pew Hispanic Center. Tienda, Marta, and Vilma Ortiz, 1986. “‘Hispanicity’ and the 1980 Census,” Social Science Quarterly 67(March):3-20.
26