the quest for permeability evaluation in wireline logging
TRANSCRIPT
1
The quest for permeability evaluation in wireline logging
Jean-Pierre DELHOMME
Schlumberger Water Services, Le Palatin 1 - 1, cours du Triangle, 92936 La Defense Cedex - France Note The author is indebted to the numerous Schlumberger geologists, petrophysicists and reservoir engineers who co-authored the articles published by Schlumberger on permeability since 1980. The present paper borrows ideas and even sentences, sometimes cited verbatim, from the 9 papers that are listed at the beginning of the bibliographical section. Nevertheless, rather than corporate views, this paper mainly reflects the author’s opinion. Abstract For decades, a constant objective of wireline logging has been to obtain a continuous permeability log. Except for a few attempts such as the search for an acoustic log response that could directly yield a permeability indicator, most of the initial efforts have been directed towards deriving permeability from the combination of porosity with some other log-derived property related to the type of pore geometry. In sandstones, excellent results have recently been obtained with nuclear magnetic resonance (NMR) logging that, by itself, provides information on both porosity and pore size distribution. In carbonates, the NMR approach sometimes breaks down but the information about carbonate rock facies carried by continuous electrical images of the borehole walls has permitted, coupled with conventional porosity logs, to generate continuous permeability indicators in complex carbonate formations. The challenge Since 1856 when Henri-Philibert-Gaspard Darcy first defined fluid conductivity of a porous material in his famous technical report known as the “Mémoire sur les fontaines publiques de la ville de Dijon”, permeability has become one of the most studied, yet stubbornly elusive, properties of rocks. For decades, hydrogeologists have been using pumping tests to measure permeability in aquifers, or rather to access an average permeability-thickness value, called transmissivity, masking permeability differences in different layers. Similarly, many well testing techniques were developed by the petroleum industry. Well testing rapidly became an oilfield standard because it was investigating the rock and fluid in situ, under actual reservoir flow conditions. However, none of the well testing methods, except a rather cumbersome and lengthy one called layer reservoir testing, are providing information about the variations of permeability versus depth. To achieve this goal, cores are often taken at different depths when drilling, and core samples are analyzed under controlled laboratory conditions to measure permeability. Coring and laboratory analyses are quite expensive procedures. Wells are therefore rarely cored continuously but, even when they are, core permeability data can be of questionable value when only 6-inch spaced core plugs are analyzed in heterogeneous rocks where permeability over just a few inches can vary by five orders of magnitude. The idea thus came to try and obtain a continuous permeability profile, using the same approach that had been successful in providing continuous profiles of porosity and fluid saturations in the formations crossed by oil and gas, and sometimes water, wells: wireline logging. First methods for deriving permeability from conventional wireline logs The first suggestion was to link conventional wireline log data, or log-derived rock properties such as porosity, with permeability. This idea is almost as old as wireline logging itself. Over the years, many transforms were proposed and, under certain conditions, they have been providing
2
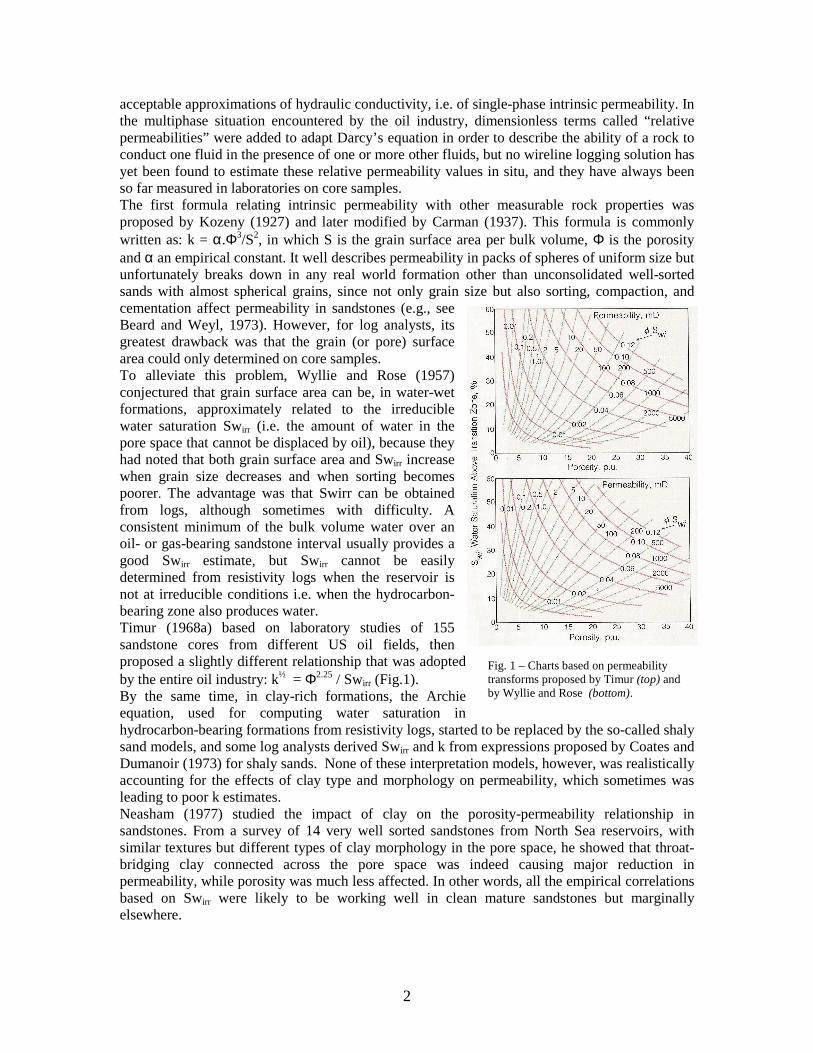
acceptable approximations of hydraulic conductivity, i.e. of single-phase intrinsic permeability. In the multiphase situation encountered by the oil industry, dimensionless terms called “relative permeabilities” were added to adapt Darcy’s equation in order to describe the ability of a rock to conduct one fluid in the presence of one or more other fluids, but no wireline logging solution has yet been found to estimate these relative permeability values in situ, and they have always been so far measured in laboratories on core samples. The first formula relating intrinsic permeability with other measurable rock properties was proposed by Kozeny (1927) and later modified by Carman (1937). This formula is commonly written as: k = α.Φ3/S2, in which S is the grain surface area per bulk volume, Φ is the porosity and α an empirical constant. It well describes permeability in packs of spheres of uniform size but unfortunately breaks down in any real world formation other than unconsolidated well-sorted sands with almost spherical grains, since not only grain size but also sorting, compaction, and cementation affect permeability in sandstones (e.g., see Beard and Weyl, 1973). However, for log analysts, its greatest drawback was that the grain (or pore) surface area could only determined on core samples. To alleviate this problem, Wyllie and Rose (1957) conjectured that grain surface area can be, in water-wet formations, approximately related to the irreducible water saturation Swirr (i.e. the amount of water in the pore space that cannot be displaced by oil), because they had noted that both grain surface area and Swirr increase when grain size decreases and when sorting becomes poorer. The advantage was that Swirr can be obtained from logs, although sometimes with difficulty. A consistent minimum of the bulk volume water over an oil- or gas-bearing sandstone interval usually provides a good Swirr estimate, but Swirr cannot be easily determined from resistivity logs when the reservoir is not at irreducible conditions i.e. when the hydrocarbon-bearing zone also produces water. Timur (1968a) based on laboratory studies of 155 sandstone cores from different US oil fields, then proposed a slightly different relationship that was adopted by the entire oil industry: k½ = Φ2.25 / Swirr (Fig.1). By the same time, in clay-rich formations, the Archie equation, used for computing water saturation in hydrocarbon-bearing formations from resistivity logs, started to be replaced by the so-called shaly sand models, and some log analysts derived Swirr and k from expressions proposed by Coates and Dumanoir (1973) for shaly sands. None of these interpretation models, however, was realistically accounting for the effects of clay type and morphology on permeability, which sometimes was leading to poor k estimates. Neasham (1977) studied the impact of clay on the porosity-permeability relationship in sandstones. From a survey of 14 very well sorted sandstones from North Sea reservoirs, with similar textures but different types of clay morphology in the pore space, he showed that throat-bridging clay connected across the pore space was indeed causing major reduction in permeability, while porosity was much less affected. In other words, all the empirical correlations based on Swirr were likely to be working well in clean mature sandstones but marginally elsewhere.
Fig. 1 – Charts based on permeability transforms proposed by Timur (top) and by Wyllie and Rose (bottom).
3
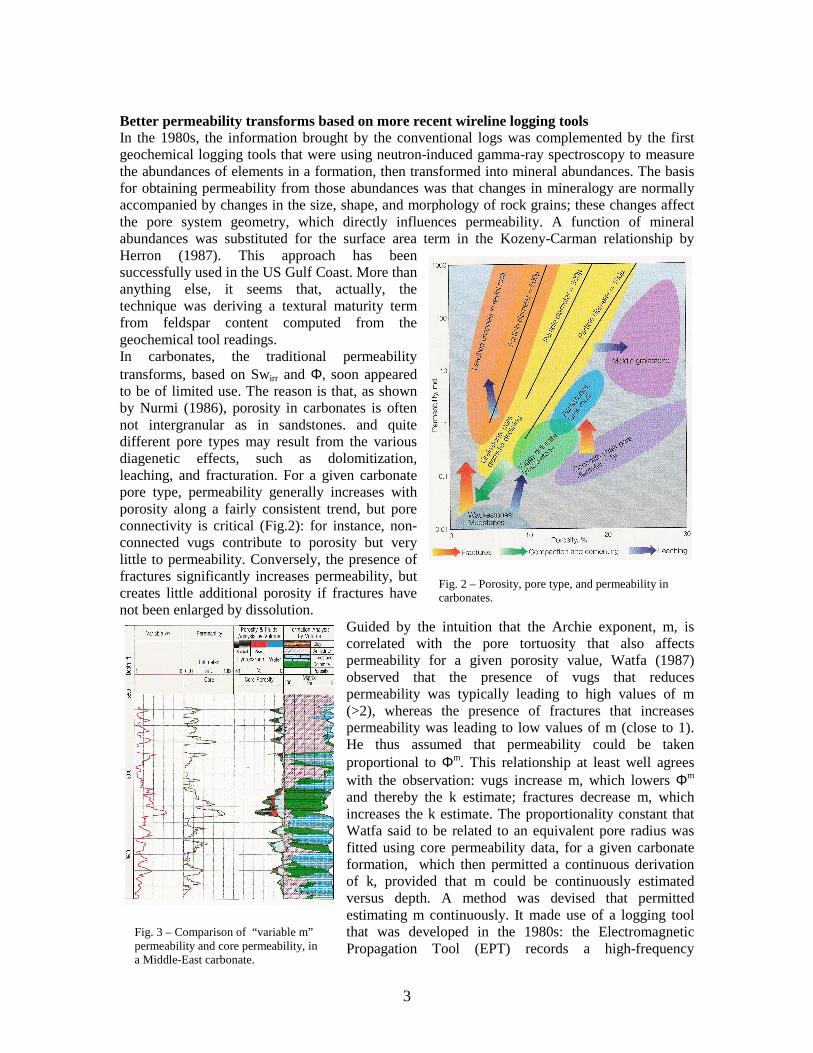
Better permeability transforms based on more recent wireline logging tools In the 1980s, the information brought by the conventional logs was complemented by the first geochemical logging tools that were using neutron-induced gamma-ray spectroscopy to measure the abundances of elements in a formation, then transformed into mineral abundances. The basis for obtaining permeability from those abundances was that changes in mineralogy are normally accompanied by changes in the size, shape, and morphology of rock grains; these changes affect the pore system geometry, which directly influences permeability. A function of mineral abundances was substituted for the surface area term in the Kozeny-Carman relationship by Herron (1987). This approach has been successfully used in the US Gulf Coast. More than anything else, it seems that, actually, the technique was deriving a textural maturity term from feldspar content computed from the geochemical tool readings. In carbonates, the traditional permeability transforms, based on Swirr and Φ, soon appeared to be of limited use. The reason is that, as shown by Nurmi (1986), porosity in carbonates is often not intergranular as in sandstones. and quite different pore types may result from the various diagenetic effects, such as dolomitization, leaching, and fracturation. For a given carbonate pore type, permeability generally increases with porosity along a fairly consistent trend, but pore connectivity is critical (Fig.2): for instance, non-connected vugs contribute to porosity but very little to permeability. Conversely, the presence of fractures significantly increases permeability, but creates little additional porosity if fractures have not been enlarged by dissolution.
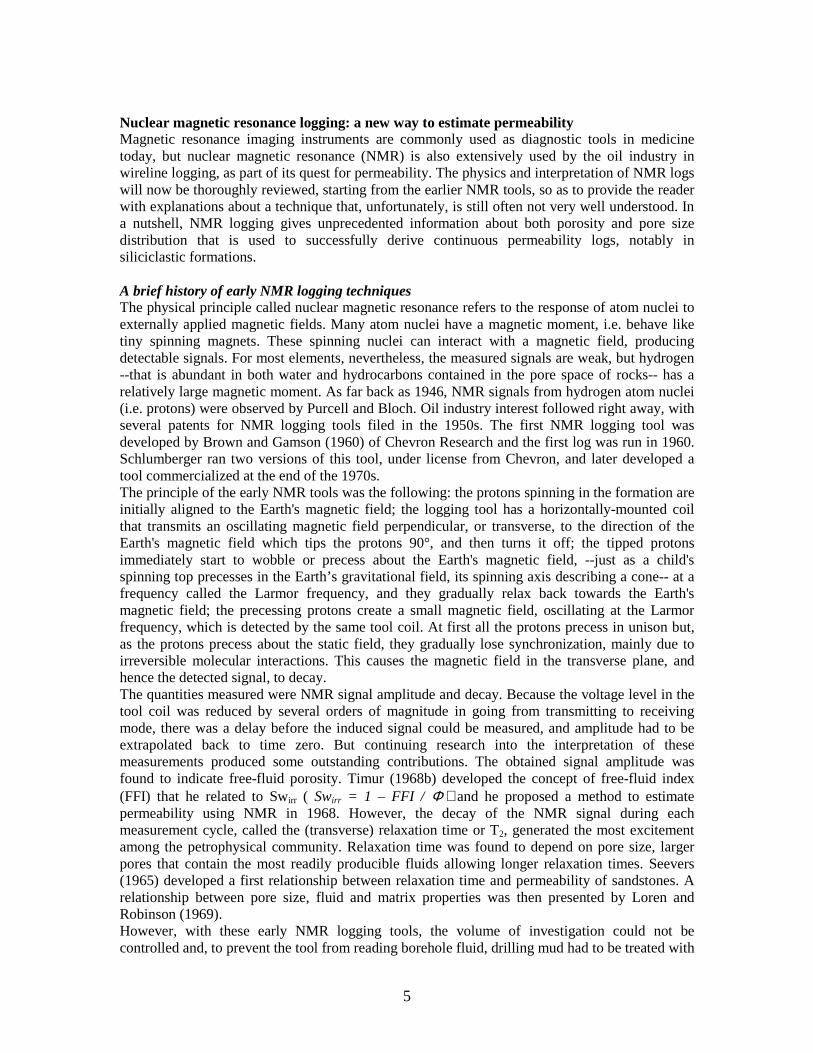
Guided by the intuition that the Archie exponent, m, is correlated with the pore tortuosity that also affects permeability for a given porosity value, Watfa (1987) observed that the presence of vugs that reduces permeability was typically leading to high values of m (>2), whereas the presence of fractures that increases permeability was leading to low values of m (close to 1). He thus assumed that permeability could be taken proportional to Φm. This relationship at least well agrees with the observation: vugs increase m, which lowers Φm and thereby the k estimate; fractures decrease m, which increases the k estimate. The proportionality constant that Watfa said to be related to an equivalent pore radius was fitted using core permeability data, for a given carbonate formation, which then permitted a continuous derivation of k, provided that m could be continuously estimated versus depth. A method was devised that permitted estimating m continuously. It made use of a logging tool that was developed in the 1980s: the Electromagnetic Propagation Tool (EPT) records a high-frequency
Fig. 2 – Porosity, pore type, and permeability in carbonates.
Fig. 3 – Comparison of “variable m” permeability and core permeability, in a Middle-East carbonate.

4
electromagnetic propagation travel time that responds to water-filled porosity but, contrary to resistivity measurements, does it without an exponent. As a consequence, combining this log with a resistivity log allows a continuous evaluation of m, after eliminating porosity. The method has been successfully used in the Middle-East (Fig.3). Correlation of permeability with acoustic logging measurements During the late 1970s, Lebreton has advocated for some years that a permeability index may be derived from a ratio of the absolute peak values of the three first half-cycles of the acoustic waveform recorded by a sonic logging tool. There was no convincing explanation why this ratio and permeability should be related. Improved acoustic coupling into fractures may have been causing the observation reported by Lebreton et al. (1978) since, right at a fracture, there is far better coupling between the borehole and the formation than elsewhere. Anyway, this triggered, in the 1980s and early 1990s, several attempts to correlate permeability with the Stoneley wave data recorded by sonic logging tools, such as the DSI (Dipole Shear Sonic Imager) tool. The DSI tool generates low-frequency tube waves –called Stoneley waves– that propagate up and down the borehole with a special monopole transmitter operating at frequencies of 600 Hz to 5 KHz. While these waves preserve most of their energy in the borehole, some energy is attenuated in front of permeable formations as the wave pressure pushes fluid from the borehole into the formation, similar to a quick small-scale pressure test. In so doing, this technique gains direct entry to permeability by physically moving fluid through the formation. The velocity of the wave is slowed down by an amount that can be related to the ratio of formation permeability to fluid velocity (Winkler et al., 1989). In the absence of mudcake, and knowing the acoustic velocity of the borehole fluid, the permeability can be estimated. A preferred method, based on energy and not velocity attenuation, establishes permeability from Stoneley waves without needing any further information (Cassel et al., 1994). Furthermore, rather than to measure direct Stoneley energy transmission between sonic tool transmitter and receiver, it measures the attenuation seen between two adjacent receivers, thus narrowing the field of investigation to the distance between these near and far receivers i.e. about 15 cm, which provides higher resolution. Excellent agreement has been observed in Middle-East carbonates between core measurements and such permeability indicators (Fig.4). However, it may be difficult to get quantitative permeability estimates in the presence of mudcake that interferes with the wave’s ability to move fluid into the formation. It remains that Stoneley wave interpretation has been instrumental in fractured formations. The way fractures affect Stoneley waves is different than for compressional and shear waves: acoustic energy is not lost through mode conversions but as a result of moving the fluid into the fracture, and Stoneley attenuation is therefore quite independent of the fracture dipping angle and mostly a function of fracture permeability. Stoneley waves have thus proven to be an excellent fracture indicator (e.g., see Hornby et al., 1987) in tight formations where finding open fractures is equivalent to finding permeable zones. Whereas all approaches based on Swirr were geared to oilfield conditions and hydrogeologists could not utilize them, the techniques based on geochemical, electromagnetic propagation, and sonic logging could very well be used in water wells. The same holds true for the techniques that are going to be described hereafter.
Fig. 4 – Comparison of core measurements and permeability indexes from Stoneley waves, in a Middle-East carbonate.
5
Nuclear magnetic resonance logging: a new way to estimate permeability Magnetic resonance imaging instruments are commonly used as diagnostic tools in medicine today, but nuclear magnetic resonance (NMR) is also extensively used by the oil industry in wireline logging, as part of its quest for permeability. The physics and interpretation of NMR logs will now be thoroughly reviewed, starting from the earlier NMR tools, so as to provide the reader with explanations about a technique that, unfortunately, is still often not very well understood. In a nutshell, NMR logging gives unprecedented information about both porosity and pore size distribution that is used to successfully derive continuous permeability logs, notably in siliciclastic formations. A brief history of early NMR logging techniques The physical principle called nuclear magnetic resonance refers to the response of atom nuclei to externally applied magnetic fields. Many atom nuclei have a magnetic moment, i.e. behave like tiny spinning magnets. These spinning nuclei can interact with a magnetic field, producing detectable signals. For most elements, nevertheless, the measured signals are weak, but hydrogen --that is abundant in both water and hydrocarbons contained in the pore space of rocks-- has a relatively large magnetic moment. As far back as 1946, NMR signals from hydrogen atom nuclei (i.e. protons) were observed by Purcell and Bloch. Oil industry interest followed right away, with several patents for NMR logging tools filed in the 1950s. The first NMR logging tool was developed by Brown and Gamson (1960) of Chevron Research and the first log was run in 1960. Schlumberger ran two versions of this tool, under license from Chevron, and later developed a tool commercialized at the end of the 1970s. The principle of the early NMR tools was the following: the protons spinning in the formation are initially aligned to the Earth's magnetic field; the logging tool has a horizontally-mounted coil that transmits an oscillating magnetic field perpendicular, or transverse, to the direction of the Earth's magnetic field which tips the protons 90°, and then turns it off; the tipped protons immediately start to wobble or precess about the Earth's magnetic field, --just as a child's spinning top precesses in the Earth’s gravitational field, its spinning axis describing a cone-- at a frequency called the Larmor frequency, and they gradually relax back towards the Earth's magnetic field; the precessing protons create a small magnetic field, oscillating at the Larmor frequency, which is detected by the same tool coil. At first all the protons precess in unison but, as the protons precess about the static field, they gradually lose synchronization, mainly due to irreversible molecular interactions. This causes the magnetic field in the transverse plane, and hence the detected signal, to decay. The quantities measured were NMR signal amplitude and decay. Because the voltage level in the tool coil was reduced by several orders of magnitude in going from transmitting to receiving mode, there was a delay before the induced signal could be measured, and amplitude had to be extrapolated back to time zero. But continuing research into the interpretation of these measurements produced some outstanding contributions. The obtained signal amplitude was found to indicate free-fluid porosity. Timur (1968b) developed the concept of free-fluid index (FFI) that he related to Swirr ( Swirr = 1 – FFI / Φ ) and he proposed a method to estimate permeability using NMR in 1968. However, the decay of the NMR signal during each measurement cycle, called the (transverse) relaxation time or T2, generated the most excitement among the petrophysical community. Relaxation time was found to depend on pore size, larger pores that contain the most readily producible fluids allowing longer relaxation times. Seevers (1965) developed a first relationship between relaxation time and permeability of sandstones. A relationship between pore size, fluid and matrix properties was then presented by Loren and Robinson (1969). However, with these early NMR logging tools, the volume of investigation could not be controlled and, to prevent the tool from reading borehole fluid, drilling mud had to be treated with
6
a magnetite sIurry before logging, in order to reduce the borehole signal to below measurement threshold. This time consuming treatment was not very popular with drillers and hindered the acceptance of NMR logging. The 1970s and 1980s saw continuation of this work on NMR logging by many oil companies or oilfied service companies (e.g., see Kenyon et al., 1986), in parallel with laboratory NMR techniques developed to characterize core samples. To make the logging technique more widely acceptable meant a radical design change to use permanent magnets instead of the Earth's magnetic field for aligning protons, and to profit from advances in pulsed NMR technology commonly used in the laboratory. The more recent generations of NMR logging tools The use of powerful permanent magnets, applied to the formation as the logging tool moves up the borehole, permits that the position of the measurement volume can be controlled by tool design, thus eliminating the need for borehole mud doping. The use of a pulse sequence helps compensate for some reversible dephasing effects caused by the inhomogeneity of the static magnetic field. When this field is not perfectly homogeneous, the protons precess at slightly different Larmor frequencies, causing a decay that is not a property of the formation. The protons can be rephased when pulses that tip them 180° are transmitted. Pulses are applied repeatedly in an evenly spaced train. Each time the protons rephase, they generate a signal, called a spin echo. This configuration was proposed by Jackson (1980 & 1984) who filed his patent in 1978 and the first experimental pulsed logging tools were eventually developed in the late 1980s. The MRIL (Magnetic Resonance Imager) tool built in 1990 by NUMAR --now a subsidiary of Halliburton-- was the first commercial pulsed NMR tool. It incorporates a long permanent magnet to create a static lateral field in the formation. The tool is run centralized in the borehole, and the measurement volume consists of a thin concentric cylindrical shell with a length of 61 cm along hole and a depth of investigation varying with the borehole diameter (about 7.5 cm for a 10 in. or 25 cm hole). A side-looking configuration invented by Schlumberger (Kleinberg et al., 1992) was the basis for the CMR (Combinable Magnetic Resonance) tool commercialized in 1995. It is run pressed against the borehole wall by a bowspring. A short directional antenna sandwiched between a pair of permanent magnets focuses the measurement on a zone located 2.8 cm inside the formation, with a length along hole of only 15 cm providing high vertical resolution. By design, the area between the CMR tool skid and the measurement volume does not contribute to the NMR signal. This provides immunity to the effects of mudcake and hole rugosity. The two permanent magnets generate a focused static magnetic field which is about 1000 times stronger than the Earth's magnetic field, i.e. of about 550 gauss in the measurement region. The measurement sequence starts with a wait time of about 1.3 sec to allow for complete polarization of the hydrogen protons in the formation along the length of the skid. Then the antenna typically transmits a train of several hundred magnetic pulses into the formation. The entire pulse sequence, a 90° pulse of 4 gauss switched on for 16 µsec oscillating at the Larmor frequency followed by a long series of 180° pulses, is called a CPMG sequence after its inventors: Carr, and Purcell (1954) and Melboom and Gill (1958). The antenna also acts as a receiver and records each spin echo amplitude. The Larmor frequency for hydrogen nuclei in a field of 550 gauss is about 2.3 MHz. The echo spacing is 320 µsec for the CMR tool. T2 distribution is derived from the decaying spin echo curve. In the latest Schlumberger tool, the MRX (Magnetic Resonance eXpert) tool, the number of echoes and their spacing are programmable, among other novel features, so as to adapt to conditions where it is needed to measure long T2 values (e.g., see Freedman, 2006). A deeper insight into the interpretation of NMR logs Molecules in fluids are in constant Brownian motion. Besides the relaxation by molecular diffusion in magnetic field gradients that the CPMG pulse sequence is compensating for, there
7
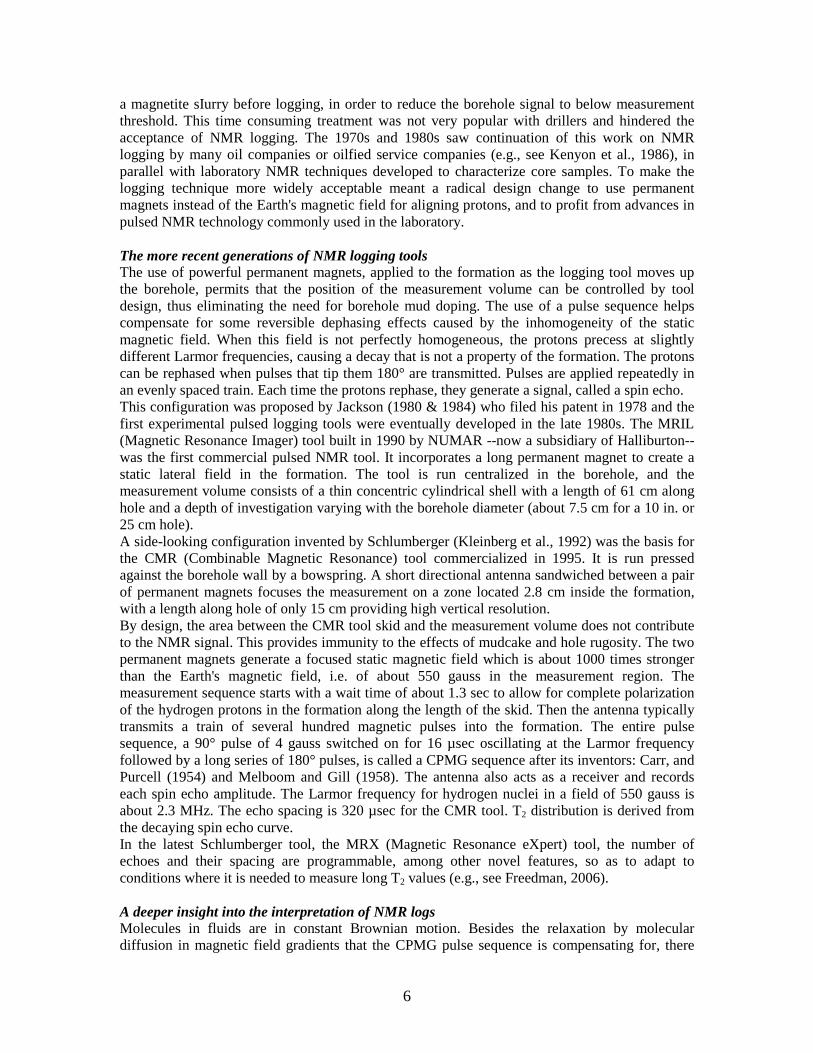
exist two main NMR relaxation mechanisms, i.e. bulk fluid relaxation and grain surface relaxation. Both mechanisms result from molecular interactions and create the irreversible dephasing that can be observed by means of the decaying amplitude of spin echoes. The bulk relaxation is caused by the magnetic interactions between neighboring precessing protons in the fluid itself, while the grain surface relaxation is caused by the probability for a precessing proton moving about pore space of colliding with a grain surface. Bulk fluid relaxation can often be neglected but can be important when water is in very large pores, which may be the case in vuggy carbonates, and when, therefore, hydrogen protons rarely contact a surface. Water in a test tube has a long T2 relaxation time of 3700 msec at 40°C, a value that may be approached in a rock with very large vugs. Bulk relaxation also matters when non-movable hydrocarbon is present in the measurement region: the nonwetting phase does not contact the pore surface, and so it cannot be relaxed by the surface relaxation mechanism; in addition, increasing fluid viscosity shortens bulk relaxation times. Grain surface relaxation is, by far, the most important process affecting relaxation times. Because of complex atomic-level electromagnetic field interactions at the grain surface, there is a high probability -characterized by a parameter called the surface relaxivity, ρ2- that the proton in the fluid will relax when it encounters a grain surface. For a given grain type, e.g. in sandstones, the speed of relaxation depends on how frequently protons can collide with the surface, and this depends on the surface-to-volume ratio (s/v) and thereby on pore size. For example, relaxation times for a sandstone typically range from 10 msec for small pores to 500 msec for large pores. Collisions are less frequent in large pores that have a small s/v and relaxation times are, therefore, relatively long. Conversely, small pores have a large s/v and short relaxation times. For a single pore, nuclear spin magnetization decays exponentially, and the signal amplitude decays with time constant T2 = (ρ2.(s/v))-1. Rocks have a distribution of pore sizes, each with its own value of s/v. The NMR signal is the sum of the signals coming from all the pores located in the measurement volume. The initial NMR signal amplitude is thus proportional to porosity; its overall decay is the sum of the individual decays, which reflects pore size distribution. Separating out ranges of T2 values by a mathematical inversion process produces the T2 distribution curve. The area under the curve represents the porosity and the curve shape the distribution of pore sizes. This inversion process normally requires stacking, in order to improve the signal-to-noise ratio, which slightly degrades the vertical resolution. From NMR-derived porosity and pore size distribution to permeability Traditionally, the total porosity seen in formations is subdivided into three components: free-fluid porosity, capillary-bound water, and clay-bound water. NMR free-fluid porosity is determined by applying a cutoff, of generally 33 msec for sandstones, to the T2 distribution curve. The area underneath the curve above the cutoff gives free-fluid porosity (Fig.5). As NMR tool technology has improved over the last decade with shorter echo spacing (today, for example, the CMR-200 and CMR-Plus tools can measure T2 down to the 0.3-msec range), the fast decaying clay-bound water signal with T2 values below 3 msec can also now be measured and distinguished from capillary-bound water. NMR permeability is derived from empirical relationships that were developed from brine permeability measurements and NMR
Fig. 5 – T2 distributions for two sandstones with same porosity but different permeabilities and pore sizes (the yellow area corresponds to free-fluid porosity).
8
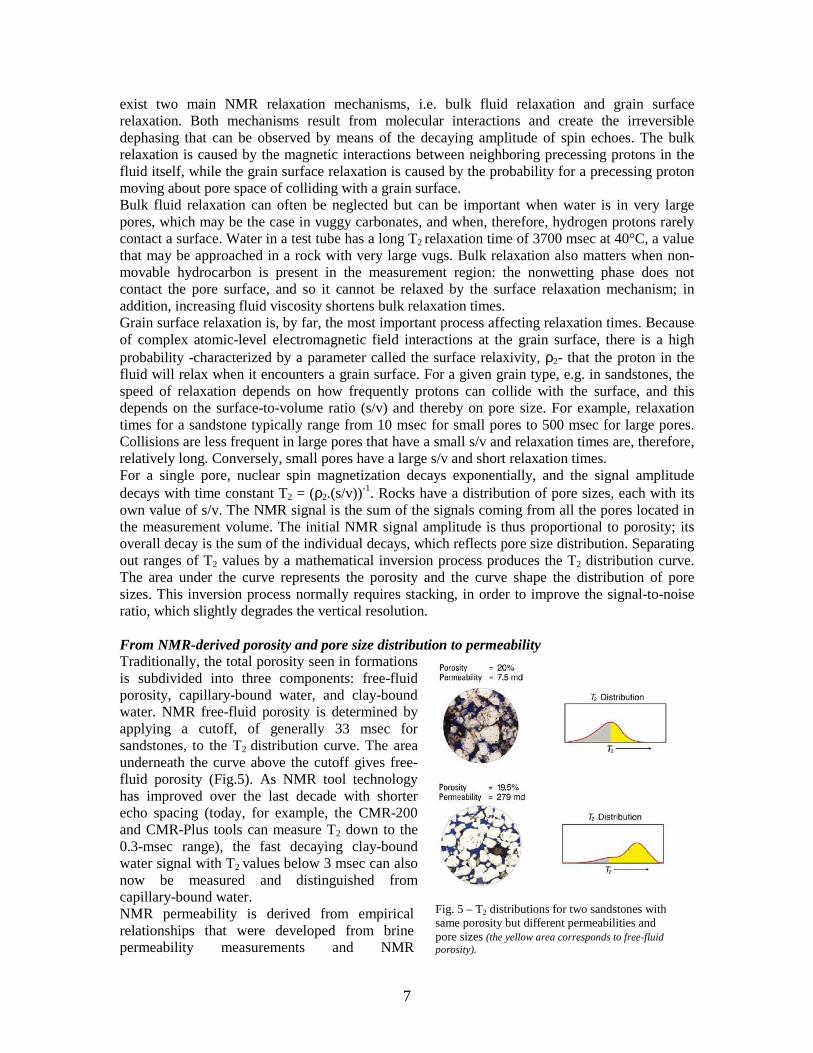
measurements concurrently made in the laboratory on hundreds of different core samples. The two widely applied permeability transforms are the Timur-Coates and the Schlumberger-Doll Research (SDR) equations. While the Timur-Coates transform contains the total porosity and the ratio of the free-fluid volume to the bound-fluid volume, the SDR transform is based on the NMR porosity and the logarithmic mean of T2 : kNMR = C (ΦNMR)
4 (T2, log)2 where kNMR is the estimated
permeability, ΦNMR is CMR total porosity, T2,log is the logarithmic mean of the T2 distribution, and C is a constant depending upon the formation, e.g. 4 for sandstones and 0.1 for carbonates. In Fig.6, CMR porosity shows a good match with core porosity measurements and, after fine-tuning of constant C, CMR permeability overlays core permeability points over the whole interval. Notably, over the zone with little porosity variation and where permeability varies from 0.07 md to 10 md, CMR permeability values compares well to that of core measurements. The value of C used for this well was applied to subsequent CMR logs in the same formation, enabling the oil company to reduce coring costs.
It has also been observed that the sum of all spin-echo amplitudes is proportional to the product of porosity and average T2, and correlates well with permeability. This alternative yields better results in high noise environments and can be interpreted without stacking, which leads to a new NMR permeability indicator (Sezginer, 1999) with higher vertical resolution (typically 20 cm). Some specific interpretation issues related to NMR logs in carbonates The interpretation model assuming that, in water-saturated reservoir rocks, the T2 and pore-size distributions are directly related well explains why NMR T2 curves are successfully used to characterize sandstones containing mixed pore-size distributions. However, there is some concern within the oil industry that NMR does not work as well in carbonate reservoirs. First, NMR responses in carbonates differ from those in sandstones: all pore surfaces are not equally effective in relaxing hydrogen nuclei and carbonates are about three times less efficient in relaxing the nuclear magnetism than sandstones. For carbonates, relaxation times therefore tend to be three times longer and a 100 msec cutoff was proposed for free-fluid porosity. This cutoff value has often to be locally adapted. For instance, in the Thamama formations of Abu Dhabi, permeable grainstones could be distinguished from lower permeability packstones and mudstones with a 225 msec cutoff. But, while carbonate formations contain mixed pore-size distributions, e.g., intergranular porosity and vugs, NMR logging data in these formations nevertheless frequently yield unimodal T2 distributions, which often results in inconsistent T2 cutoff values to distinguish bound and free fluids, and leads to unreliable permeability predictions. Developments in NMR research (Ramakhrisna, 1999) have now explained why the conventional approach breaks down in grain-supported carbonates which have dual pore systems. The breakdown is due to diffusion of spinning protons between the micro- and macropores. If the surface relaxivity is small enough, protons originally in the micropores can diffuse into the macropores before their nuclear spins relax; the decay of these spins then proceeds much more
Fig. 6 – Comparison of CMR porosity and CMR permeability with core measurements.

9
slowly. Conversely, spinning protons originally in the macropores can penetrate into the micropores where they encounter more surface interactions, speeding up their decay. Diffusion therefore causes the area under the short T2 peak -the porosity fraction associated with micropores- to decrease; at the same time, the position of the higher T2 peak shifts towards
shorter times. Acting together, these two effects tend to merge the two peaks and produce a unimodal T2 distribution that bears little resemblance to the bimodal distribution one would expect from a dual-porosity system. In chalk formations with a single pore system, NMR logging performs very well, as demonstrated by an example from the Ekofisk formation in the North Sea (Fig.7). While it is widely believed that chalk formations are homogeneous, borehole electrical images have revealed thin laminations. In the image, light yellow indicates electrically resistive low-porosity chalk and dark brown more conductive higher porosity chalk. While the standard CMR
permeability transform show little evidence of these laminations, the high-resolution permeability indicator log shows permeability variations that are consistent with the laminations seen in the images.
Borehole image analysis: a way to access permeability through rock facies typing In carbonates with complex pore structure and sometimes difficult NMR interpretation, a saving grace for permeability logging (Akbar et al., 1995 & 2000) has been the development, in the late 1980s, of high-resolution borehole imaging tools, such as the FMI (Fullbore formation Micro Imager) tool which provides a picture of most of the borehole wall with 192 small current-emitting electrodes mounted on four pads and four flaps pressed against the formation. As the tool is pulled up the hole, a measurement is made every 2.5 mm and the small electrodes also have an effective horizontal spacing of 2.5 mm. Borehole orientation, tool azimuthal orientation, and borehole diameter are all recorded, allowing the 3-dimensional positioning of every measurement. Small scale conductivity variations in the electrical images (Fig.8) permit to identify the presence of macro or vuggy porosity in carbonates and to recognize the facies …and permeability in carbonates is predominantly a function of the facies (or rock type). While pores in clastic rocks are located between grains and uniformly distributed throughout the rock, in carbonates the diagenesis can significantly modify pore space and permeability because those rocks are highly susceptible to dissolution: grains can be dissolved to form new pore space, shells can be dissolved creating moldic porosity, dissolution along fractures or cracks can create large vugs or even caves; depositional bedding is rarely preserved; also, whereas clastic diagenesis normally does not involve a change
Fig. 7 – Comparison of CMRPlus high-resolution permeability with FMI borehole electrical images
Fig. 8 – Mottled fabric of a Middle-East carbonate rock shown by a FMI image (dark = pores, light = grains and matrix).
10
in mineralogy, in carbonates a diagenetic process i.e. the replacement of calcium carbonate by magnesium carbonate, called dolomitization, can significantly improve the permeability. A trend in FMI interpretation in the early 1990s has been towards automated quantitative image analysis (Delhomme, 1992), and an innovative method for characterizing rock type and
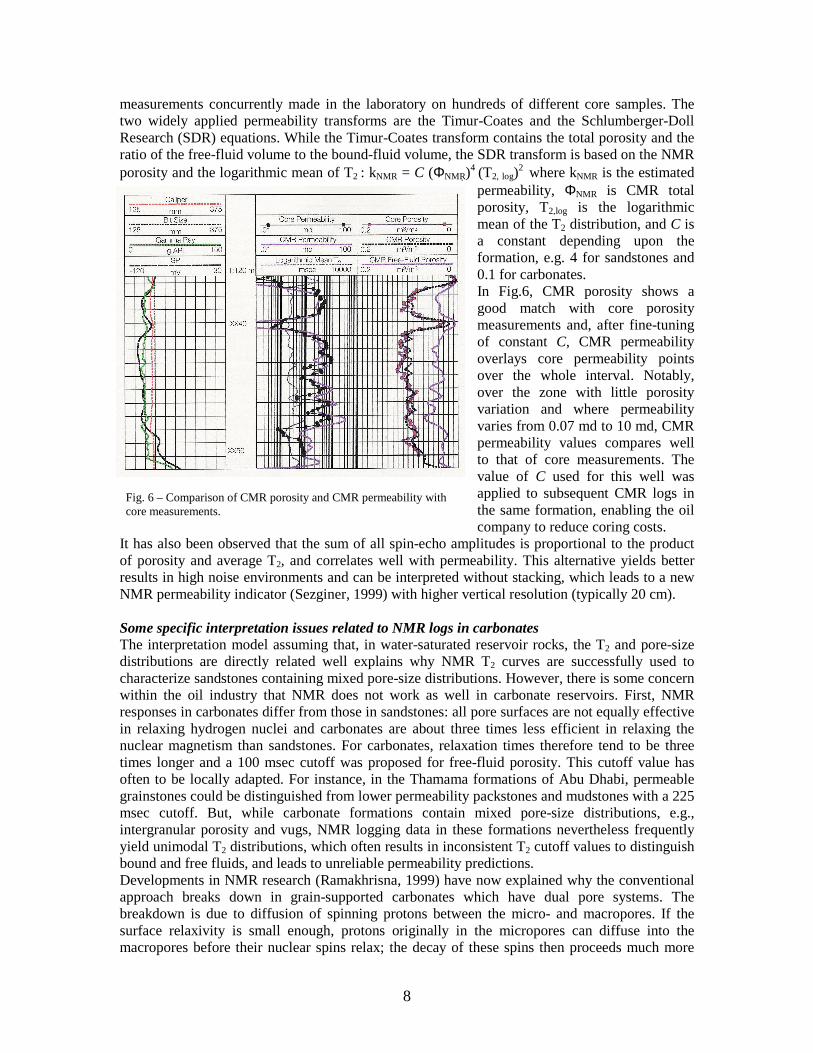
permeability was later developed. First the textural variations in the borehole electrical images are captured: the types, sizes, and densities of both conductive and resistive features are determined, conductive paths between large conductive features (usually cracks or fractures connecting large vugs) are identified. This information about the internal organization of the rock is summarized as “textural” logs that are then combined with conventional logs such as gamma ray, neutron, and density providing information about porosity and lithology. This is achieved by means of an artificial neural network (ANN) software that produces a continuous identification of the rock types (carbonate facies). Once the rock type is identified, a porosity-permeability transform could be specified, at each depth, to estimate permeability, as suggested in Fig.2. However, it has been found simpler, and more efficient, to use the ANN software for producing directly a continuous quantitative permeability estimate. The ANNs for both rock type and permeability determination are trained on cored intervals, from the same well or from a nearby well. This approach has proved to be so powerful that it has been successfully retrofitted to be applied to old wells where only high-resolution dipmeter (e.g. SHDT) data, and not images, had been acquired. Fig. 9 displays results obtained in that way from an Abu Dhabi well. Photographs in the composite plot show blown-up pictures of 3 distinct rock types. Note the more precise log-derived rock type zonation, and the good agreement of log-derived permeability estimates with core permeability data.
Figure 9 – Rock type zonation and continuous permeability indicator derives from high-resolution dipmeter data combined with conventional porosity and lithology logs.

11
What about permeability anisotropy ? In the past years, reservoir engineers have increasingly paid attention to permeability anisotropy. With more and more highly deviated and horizontal wells in the oil and gas fields, vertical permeability may be the most important reservoir parameter because it affects production -the larger the vertical anisotropy, the higher the productivity index-, injection performance, or gas and water coning. Vertical permeability is routinely determined from cores, but the problem with anisotropy is that it varies with scale: permeability barriers anticipated from core plug data may have, or lack, lateral extension and influence, or not, the flow patterns at a larger scale. Vertical interference testing with the Modular formation Dynamics Tester (MDT) tool (Pop, 1993) is more a wireline-conveyed technique than a true logging one, but it provides this type of information. Horizontal anisotropy is also a major concern in oil and gas fields. A horizontal well drilled normal to the direction of larger horizontal permeability will be a much better producer, or injector, than one drilled parallel to it. Wireline logging measurements in a pilot vertical well provides valuable information for horizontal well design. Shear sonic logging may, for instance, be used to identify the maximum and minimum stress directions that usually coincide with the maximum and minimum horizontal permeability directions: natural (micro)fractures aligned with the maximum stress direction open up in the direction normal to it, but stress anisotropy may also cause minor permeability anisotropies in the absence of fractures, by distorting the pore space. Hydrogeologists may soon be facing the same situation than reservoir engineers if horizontal wells start to be drilled for aquifer storage and recovery or to mitigate saltwater intrusion in coastal aquifers. References Articles published in the Oilfield Review and other Schlumberger reviews since 1980: - Akbar M. et al., 1995, “Classic Interpretation Problems: Evaluating Carbonates”, Oilfield Review,
vol.7, no.1, pp.38-57. - Akbar M. et al., 2000, “A Snapshot of Carbonate Reservoir Evaluation”, Oilfield Review, vol.12, no.4,
pp.20-41. - Allen D. et al., 1988, “Probing for Permeability: An Introduction to Measurements”, The Technical
Review, vol.36, no.1, pp.6-20. - Allen D. et al., 2000, “Trends in NMR Logging”, Oilfield Review, vol.12, no.3, pp.2-19. - Ayan C. et al., 1994, “Measuring Permeability Anisotropy: The Latest Approach”, Oilfield Review,
vol.6, no.4, pp.24-35. - Kenyon W. et al., 1994, “Nuclear Magnetic Resonance Imaging: Technology for the 21st Century”,
Oilfield Review, vol.7, no.3, pp.19-33. - Mathieu G. et al., 1985, “Applying Sonic Data: Fracture Detection”, The Technical Review, vol.33,
no.1, pp.69-79. - Nurmi R., 1984, “Permeability in Sandstones”, The Technical Review, vol.32, no.1, pp.4-10. - Nurmi R., 1986, “Carbonate Close Up”, Middle East Well Evaluation Review, No.1, pp.22-35. Other articles on permeability and logging: - Beard D.C. and P.K. Weyl, 1973, “Influence of Texture on Porosity and Permeability of
Unconsolidated Sands”, AAPG Bulletin, vol.57, pp.349-369. - Brown R.J.S. and B.W. Gamson, 1960, “Nuclear Magnetism Logging”, Journal of Petroleum
Technology, vol.12, pp.199-207. - Carman P.C., 1937, Fluid Flow Through Granular Beds”, Transactions of the Institution of Chemical
Engineers, vol.15, pp.150-166.

12
- Carr H.Y. and E.M. Purcell, 1954, “Effects of Diffusion on Free Precession in Nuclear Magnetic Resonance Experiments”, Physical Review, vol.94, no.3, pp.630-638.
- Cassel B. et al., 1994, “Permeability Prediction Based on Anelastic Attenuation Using Dipole Shear and Low Frequency Monopole Sources in a Carbonate Reservoir in Saudi Arabia”, paper presented at the GEO-94 Middle-East Geosciences Conference, Bahrain.
- Coates G.R. and J.L. Dumanoir, 1973, “A New Approach to Improved Log-Derived Permeability”, Transactions of the SPWLA 14th Annual Logging Symposium, Lafayette, USA, paper R.
- Delhomme J.P., 1992, “A Quantitative Characterization of Formation Heterogeneities Based on Borehole Image Analysis”, Transactions of the SPWLA 33rd Annual Logging Symposium, Oklahoma City, USA, paper T.
- Freedman R., 2006, “Advances in NMR Logging”, paper SPE 89177. - Herron M.M., 1987, “Estimating the Intrinsic Permeability of Clastic Sediments from Geochemical
Data”, Transactions of the SPWLA 28th Annual Logging Symposium, London, UK, paper HH. - Hornby B.E. et al., 1987, “Fracture Evaluation from the Borehole Stoneley Wave”, Expanded abstracts
of the SEG 57th Annual International Meeting, New Orleans, USA, pp.688-691. - Jackson J.A., 1984, “Nuclear Magnetic Resonance Well Logging”, The Log Analyst, vol.25, p.16-30. - Jackson J.A. and R.K. Cooper, 1980, “Magnetic Resonance Apparatus”, US Patent #4,350,995. - Kenyon W.E. et al., 1986, “Compact and Consistent Representation of Rock NMR Data for
Permeability Estimation”, paper SPE 15643. - Kleinberg R.L. et al., 1992, “Novel NMR Apparatus for Investigating an External Sample”, Journal of
Magnetic Resonance, vol.97, no.3, pp.466-485. - Lebreton F. et al., 1978, “Logging Tests in Porous Medium to Evaluate the Influence of their
Permeability on Acoustic Waveforms”, Transactions of the SPWLA 19th Annual Logging Symposium, El Paso, USA, paper Q.
- Loren J.D. and J.D. Robinson, 1969, “Relations between Pore Size, Fluid and Matrix Properties, and NML Measurements”, paper SPE 2529.
- Meiboom S. and D. Gill, 1958, “Modified Spin-Echo Method for Measuring Nuclear Relaxation Times”, The Review of Physical Instruments, vol.29, no.8, pp.688-691.
- Neasham J.W., 1977, “The Morphology of Dispersed Clay in Sandstone Reservoirs and its Effects on Sandstone Shaliness, Pore Space, and Fluid Flow Properties”, paper SPE 6858.
- Pop J.J. et al., 1993, “Vertical Interference Testing with a Wireline-Conveyed Straddle-Packer Tool”, paper SPE 26481.
- Ramakhrisna T.S. et al., 1999, “Forward Models for Nuclear Magnetic Resonance in Carbonate Rocks”, The Log Analyst, vol.40, no.4, pp.260-270.
- Seevers D.O., 1966, “A Nuclear Magnetic Method for Determining the Permeability of Sandstones”, Transactions of the SPWLA 7th Annual Logging Symposium, Tulsa, USA, paper ???.
- Sezginer A. et al., 1999, “An NMR High-Resolution Permeability Indicator”, Transactions of the SPWLA 40th Annual Logging Symposium, Oslo, Norway, paper NNN.
- Timur A., 1968, “An Investigation of Permeability, Porosity, and Residual Water Saturation Relationships”, Transactions of the SPWLA 9th Annual Logging Symposium, New Orleans, USA, paper J.
- Timur A., 1968, “Effective Porosity and Permeability of Sandstones Investigated Through Nuclear Magnetic Resonance Principles”, Transactions of the SPWLA 9th Annual Logging Symposium, New Orleans, USA, paper K.
- Watfa M. and F.Z. Youssef, 1987, “An Improved Technique for Estimating Permeability in Carbonates”, paper SPE 15732.
- Wyllie M.R.J. and W.D. Rose, 1950, “Some Theoretical Considerations Related to the Quantitative Evaluation of the Physical Characteristics of Reservoir Rocks from Electrical Log Data”, Petroleum Transactions of AIME, vol.189, pp.105-118.
- Winkler K.W. et al., 1989, “Permeability and Borehole Stoneley Waves: Comparison Between Experiment and Theory”, Geophysics, vol.54, pp.66-75.