the quarterly journal of economics 2011 dittmar 1133 72
TRANSCRIPT

INFORMATION TECHNOLOGY AND ECONOMIC CHANGE:THE IMPACT OF THE PRINTING PRESS∗
JEREMIAH E. DITTMAR
The printing press was the great innovation in early modern informationtechnology, but economists have found no macroeconomic evidence of its impact.This articleexploits city-level data. Between1500 and1600, Europeancities whereprinting presses were established in the 1400s grew 60% faster than otherwisesimilar cities. Cities that adopted printing in the 1400s had no prior advantage,andtheassociationbetweenadoptionandsubsequent growthwas not duetoprint-ers choosing auspicious locations. These findings are supported by regressionsthat exploit distance from Mainz, Germany—the birthplace of printing—as aninstrument for adoption. JEL Codes: N13, N33, N93, O11, O18, O33.
I. INTRODUCTION
The movable type printing press was the great innovation inearlymoderninformationtechnology. Thefirst printingpress wasestablished in Mainz, Germany, between 1446 and 1450. Overthe next 50 years the technology diffused across Europe. Between1450 and 1500, the price of books fell by two-thirds, transformingthe ways ideas were disseminated and the conditions of intellec-tual work. Historians suggest the printing press was one of themost revolutionary inventions in human history.1
Economists have found no evidence of the technology’simpact in measures of aggregate productivity or per capitaincome—much as, until the mid-1990s, they found no evidenceof productivity gains associatedwith computer-basedinformationtechnologies. A conventional explanation is that the economiceffects of the printing press were limited: whatever the advances,they occurred in a very small sector marked by modest price
∗I thank Barry Eichengreen, Chad Jones, Christina Romer, Brad DeLong,Peggy Anderson, Suresh Naidu, Davide Cantoni, Tien-Ann Shih, Robert Barro,GregClark, seminarparticipants at Berkeley, Stanford, Harvard, Yale, American,Northwestern, George Washington, the NBER Summer Institute, George Mason,andanonymous referees for their comments. Financial support from the EconomicHistoryAssociationandtheNational ScienceFoundation(SES #1023380) is grate-fully acknowledged. The errors are mine. Financial support from the EconomicHistory Association and the National Science Foundation (SES # 1023380) isgratefully acknowledged.
1. For instance Roberts (1996), Braudel (1979), andGilmore (1952). On pricessee Zanden (2009) and Clark (2004).
c© The Author(s) 2011. Published by Oxford University Press, on behalf of President andFellows of Harvard College. All rights reserved. For Permissions, please email: [email protected] Quarterly Journal of Economics (2011) 126, 1133–1172. doi:10.1093/qje/qjr035.
1133
at London School of econom
ics on January 24, 2012http://qje.oxfordjournals.org/
Dow
nloaded from

1134 QUARTERLY JOURNAL OF ECONOMICS
elasticities.2 However, that argument makes noattempt togaugethe positive externalities historians argue were associated withthe diffusion of printing. Historical research suggests that printmedia transformed the ways ideas were disseminated, promotedthe accumulation of human capital, and played a key role inthe evolution of business practices (Febvre and Martin 1958;Eisenstein 1979; Hoock 2008).
This article examines these spillovers by exploiting new, city-level data on the adoption of the movable type printing press infifteenth-century Europe. It uses city-level data to examine twoprincipal questions: Was the new printing technology associatedwith city growth? And, if so, how large was the association?To explore these questions, this article compares cities whereprinters established presses with similar cities where they didnot. The article uses ordinary least squares (OLS) estimatorsto document the magnitude and the timing of the associationbetween printing and city growth. It then employs historicalevidence and instrumental variable techniques to identify theimpact of printing on city growth.
The instrumental variable (IV) analysis is motivated by his-torical evidence. Johannes Gutenberg established the first print-ingpress inMainzaround1450.3 At that timeonlyasmallnumberof men in Mainz knewthe secrets behindthe technology. Between1450 and 1500, the technology diffused in “concentric circles”(Barbier 2006) as printers set out to establish presses in othercities. Distance from Mainz was strongly and significantly asso-ciated with early adoption of the printing press, but not with citygrowth before the diffusion of the printing press or with other in-dependent determinants of city growth. The geographicpattern oftechnologydiffusionthus allows us toidentifyexogenous variationinadoption. InstrumentingforadoptionwithdistancefromMainz,I find very large and significant estimates of the relationshipbetween the adoption of the printing press and city growth.
The printing press fostered knowledge and skills that werevaluable in commerce. Print media played a key role in the devel-opmentofnumeracy, theemergenceofbusinesseducation, andtheadoption of innovations in bookkeeping and accounting. With ac-cess to cheap waterborne transport, port cities were positioned to
2. Clark (2001) argues that the macroeconomic impact was “unmeasurablysmall” for these reasons.
3. For details of Gutenberg’s innovation and competing attempts to deviseprint media see Section V.D.
at London School of econom
ics on January 24, 2012http://qje.oxfordjournals.org/
Dow
nloaded from

IT AND ECONOMIC CHANGE 1135
profit from innovations in commercial practice. In the data, I findthat printing delivered special benefits to port cities—beyond theadvantages associated with printing or with port location alone.
These findings add a new dimension to arguments stressingthe role of cities as sites where information was exchanged, ideaswere produced, and the business practices and social groups thatdrove the rise of European capitalism developed.
II. LITERATURE
Among economic historians, there is some difference of opin-ion about the extent towhich the movable type printing press wasa revolutionary innovation. Mokyr (2005) notes that innovationdepends on the cost of accessing existing knowledge, and thatthe printing press was one of the most important access cost–reducing inventions in history. Jones (1981) also argues that“western progress owed much to the superior means of storingand disseminating information.” Baten and van Zanden (2008)find a significant association between simulated national-levelwages and observed differences in aggregate book production inEuropean history.4 However, Clark (2001) finds no evidence ofaggregate productivity growth associated with the diffusion ofmovable type printing. Mokyr (2005) similarly argues that theaggregate effects were small.
Social historians have hailed the movable type printing pressas a revolutionary innovation. Braudel (1979a) identifies printingas one of three great technological revolutions observed 1400–1800 (alongside advances in artillery and navigation). Gilmore(1952) states that printingdrove“themost radical transformationin the conditions of intellectual life in the history of westerncivilization.” Eisenstein (1979) argues that printing created revo-lutionary new possibilities for “combinatory intellectual activity.”Roberts (1996) suggests the outcome was one “dwarfing in scaleanything which had occurred since the invention of writing.”
Macroeconomicresearch identifies the central role ideas playin technological change and growth (Romer 1990; Lucas 2009;Jones and Romer 2010). Economists observe that technological
4. Baten and van Zanden (2008) draw simulated country-level real wagesfrom Allen (2003). This paper takes the city as the unit of analysis. Withineconomies, there was significant variation in printing and growth across cities.Observed data on economic outcomes is also available at the city level. Moreover,contemporary national boundaries didnot define the historiceconomies of Europe.
at London School of econom
ics on January 24, 2012http://qje.oxfordjournals.org/
Dow
nloaded from

1136 QUARTERLY JOURNAL OF ECONOMICS
change is driven by sharing and recombining ideas (Romer 1990;Mokyr 1995; Weitzman 1998). These findings indicate that majorchanges intheways ideas canbestoredandtransmittedmayhavefar-reaching consequences.
Printing was an urban technology. The market for printmedia was overwhelmingly urban. Motivated by these facts, thisarticle takes cities as the units of analysis.
Europeancities playedacentral roleintheemergenceofmod-ern, idea-based capitalist economic growth. Urban life generatedsocial contacts that fostered the circulation of information andinnovation (Bairoch 1988). Cities were also seedbeds of capitalistbusiness practices. Braudel (1979a) observes that historically,“Capitalism and towns were the same things.”5 Historians andeconomists have observed that city sizes were historically im-portant indicators of economic prosperity; that broad-based citygrowth was associated with macroeconomic growth; and thatcities produced the economic ideas and social groups that trans-formed the European economy.6 These facts support the use ofcity growth as an indicator of economic vitality.
III. THE MECHANISM
This section describes how the adoption of printing technol-ogy impacted city growth in early modern Europe. The key pointis that cities that adopted print media benefited from localizedspillovers in human capital accumulation, technological change,and forward and backward linkages. These spillovers contributedto city growth by exerting an upward pressure on the returns tolabor, making cities culturally dynamic and attracting migrants.They were localized by high transport costs associated with in-tercity trade and because the printing press fostered importantface-to-face interactions.7
Historically, urban death rates exceeded urban birth ratesand migration drove city growth. Cities drew migrants to the
5. Historical research has qualified this generalization (e.g. Scott 2002) butconfirms the importance of cities. For discussion see Dittmar (2010).
6. Acemoglu, Johnson, and Robinson (2005), DeLong and Shleifer (1993),Bairoch (1988), and Braudel (1979a, 1979c).
7. This article stresses the effects of print media on the development ofeconomically useful skills and knowledge. The interplay between printing andreligion is discussed in Section V.F. The historic association between printingand city growth is consistent with Glaeser and Saiz’s (2003) finding that humancapital predicts population and productivity growth at the city level in our day.
at London School of econom
ics on January 24, 2012http://qje.oxfordjournals.org/
Dow
nloaded from

IT AND ECONOMIC CHANGE 1137
extent that they offered relatively high wages, cultural ameni-ties, and economic opportunities.8 In the pre-industrial era,commerce was a more important source of urban wealth andincome than tradable industrial production.9 As a result, migra-tion and city growth were typically contingent on commercialsuccess.10
Print media played a key role in the acquisition and devel-opment of skills that were valuable to merchants.11 The abilityto calculate interest rates, profit shares, and exchange rates wasassociated with high returns for merchants engaged in large-scale and long-distance trade. Starting in the 1480s, Europeanpresses produced a stream of “commercial arithmetics.” Commer-cial arithmetics were the first printedmathematics textbooks andwere designed for students preparing for careers in business.12
They transmitted commercial know-how and quantitative skillsby working students through problems concerned with determin-ing payments for goods, currency conversions, interest payments,andprofit shares. Thefirst knownprintedmathematics text is theTreviso Arithmetic (1478). It begins:
I have often been asked by certain youths. . . who lookforward to mercantile pursuits, to put into writing thefundamental principles of arithmetic. . . Here begin-neth a Practica, very helpful toall whohave todowiththat commercial art. (Reproduced in Swetz 1987)
Gaspar Nicolas, author of the first Portuguese arithmetic(1519), similarlyexplained: “I amprintingthis arithmeticbecauseit is a thing so necessary in Portugal for transactions with themerchants of India, Persia, Ethiopia, and other places” (quoted inSwetz 1987).
8. Onmigrationandhistorical demographysee Woods (2003), deVries (1984),and Bairoch (1988).
9. See inter alia Nicholas (2003) and Braudel (1966).10. Political capitals were exceptions to this rule.11. A large share of print media was religious and less likely to gener-
ate positive spillovers. However, the availability of affordable religious andhumanist works promoted literacy and, increasingly, norms favoring the ex-change of ideas. Literacy is discussed later. Section V.F. discusses printing andreligion.
12. They were employed in urban schools and by private teachers teachingcommercial arithmetic. The schools teaching commercial arithmetic operatedparallel to universities, which did not provide business-oriented preparation. SeeRey (2006), Speisser (2003), Swetz (1987), and Goldthwaite (1972).
at London School of econom
ics on January 24, 2012http://qje.oxfordjournals.org/
Dow
nloaded from

1138 QUARTERLY JOURNAL OF ECONOMICS
Hundreds of commercial arithmetics wereprinted1480–1550 (seeFigure I below).
Print media were also associated with the development ofcutting-edge business practice. Social scientists have identifieddouble-entry bookkeeping as an important technological innova-tion since the early twentieth century, when Weber (1927) andSombart (1957) argued that it played a key role in the emer-genceofrational, optimizingbusiness practice. Thefirst publisheddescription of double-entry bookkeeping appeared in 1494 (LucaPacioli’s Summa). Printed merchants’ manuals then dissemi-nated the key ideas. Generally, merchants’ manuals combinedinstruction in accounting and arithmetic with non-quantitativeguidance on business practice (Goldthwaite 1972; Hoock 2008). Asubset contained tables that simplified the calculation of intereston loans, tariffs, and transport costs. Hoock (2008) observes that,“In some ways, [these handbooks] present the same characteris-tics as the modern pocket calculator with integrated routines.”Figure I documents that hundreds of different merchants’ manu-als wereprinted1480–1550. It shows that growthinthenumberofmerchants’ manuals printed declined from high initial rates and
FIGURE I
Cumulative Output of Merchants’ Manuals in Europe
Cumulativeoutput (editions) of printedmerchants’ manuals inEurope, includ-ing commercial arithmetics, treatises on bookkeeping, guides to commercial lawand business practice. Data from Hoock and Jeannin (1991, 2001, 2007).
at London School of econom
ics on January 24, 2012http://qje.oxfordjournals.org/
Dow
nloaded from

IT AND ECONOMIC CHANGE 1139
by the late 1500s stabilized at a constant rate (approximately 1%per year).
The observation that print media fostered the developmentof business practices employed in long distance trade raises aquestion: Did printing deliver special benefits to geographic loca-tions that were propitious for commerce? Historically, transportover land was relatively expensive. Cities with access to cheap,waterborne transport were positioned to realize high returns toinnovations incommerce. SectionV.B. documents that thegrowthadvantageenjoyedbycities that adoptedprintinginthelate1400swas largely driven by the growth of ports with printing presses—beyond advantages associated with the printing press or withbeing a port alone.
The availability of inexpensive texts was a key prerequisitefor the spread of literacy in Renaissance Europe (Grendler 1990).School books generated high returns for Renaissance printers(Bolgar 1962; Nicholas 2003; Fussel 2005). Schooling in lan-guages became part of a progression in which pupils went from“arts to marts.” Cities began to run schools for children who werenot going to learn Latin—using printed grammar school texts.In the fifteenth century, it became expected that the childrenof the bourgeoisie would attend school (Bolgar 1962). But printmedia also promoted opportunities for the less privileged to ob-tain education and raise their incomes. Brady (2009) observesthat no document better captures the new opportunities thanThomas Platter’s (1499–1582) autobiography(Platter1839). Afterwandering penniless across Europe, Platter began his formalschooling at age 18. Having learned Latin, Platter took a job asa rope maker in Zurich to support his book-buying and readinghabit, taught himself Hebrew and Greek, and rose to become awealthy school master, professor, and printer.
Beyond literacy, print media fostered the development ofnew, bourgeois competences and the “social ascent of new pro-fessionals” (Scott 2002).13 The urban middle classes were theprincipal purchasers of books. Printing spread to meet, “demandfor books among the merchants, substantial artisans, lawyers,goverment officials, doctors, and teachers who lived and workedin towns. . . men who needed to read, write, and calculate in
13. Mokyr (2005) defines competence as extending beyond the ability to read,interpret, and execute the instructions of a technique to include supplementaltacit knowledge. Nicholas (2003) and Eisenstein (1979) observe that print mediatransformed urban culture.
at London School of econom
ics on January 24, 2012http://qje.oxfordjournals.org/
Dow
nloaded from

1140 QUARTERLY JOURNAL OF ECONOMICS
order to manage their businesses and conduct civic affairs” (Rice1994). The new technology underpinned an emerging culture ofinformationexchangeandthedevelopment of anurban, bourgeoispublic sphere (Smith 1984; Long 1991; Zaret 2000).
The role of print media in the diffusion of industrial inno-vations was probably more limited. Historically the diffusion ofindustrial technology was heavily dependent on the movementof skilled workers (Cipolla 1972). This is consistent with theemphasis this article places on localized spillovers from printmedia and the pattern of technology diffusion described shortly.Significantly, theknowledgerequiredtosuccessfullycast movabletype remained quasi-proprietary for nearly one century afterGutenberg’s innovation: Biringuccio’s Pirotechnia (1540) providesthe earliest known published blueprint.
Cities with printing presses derived benefits from the tech-nology that others did not. The costs of information and humancapital accumulation were significantly lower in cities with print-ingpresses. Inpart, theseadvantages wereduetotransport costs.
Print media were costly totransport because they were heavyand fragile commodities, sensitive to damp (Febvre and Martin1958; Barbier 2006). The trade in hardboundbooks was relativelyextensive but still significantly limited. Outside printing cities,information on the range of available print media was incompleteand many books were not offered for sale. Flood (1998) observes,“Outside the towns where books were printedor which were maincenters of the burgeoning book trade the public were dependenton what itinerant traders offered them and on word of mouth.”14
Booklets and ephemera termed “city printing” (l’imprimerie deville) accounted for a large share of production and were evenless widelytraded.15 Transport costs inearlymodernEuropeweresufficiently high that print media often spreadthrough reprintingrather than intercity trade.16 Books were often shipped unbound
14. Contemporary accounts confirm that access to print media was limitedoutside printing centers. Platter (1839) described the constraints on his educationin the early 1500s: “In the school at St. Elizabeth, indeed, nine Bachelors ofArts read lectures at the same hour, and in the same room. . . neither had anyone printed books. . . What was read had first to be dictated, then pointed andconstructed, and at last explained; so that the Bacchants had to carry away thickbooks of notes when they went home.”
15. See Nieto (2003), Edwards (1995), Eisenstein (1979), and Section V forfurther discussion.
16. Edwards (1995) observes: “If, for example, there was an interest in Stras-bourg for a work first published in Wittenberg, it was more common for a printer
at London School of econom
ics on January 24, 2012http://qje.oxfordjournals.org/
Dow
nloaded from

IT AND ECONOMIC CHANGE 1141
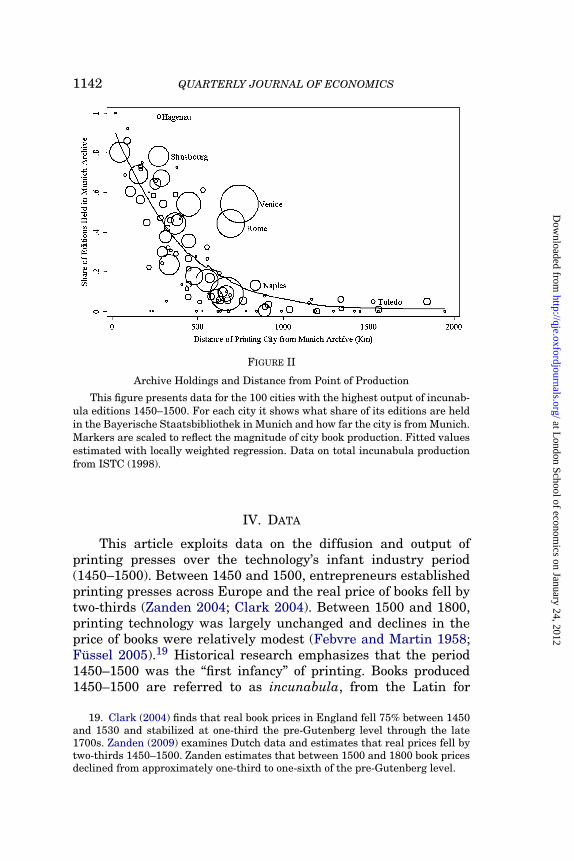
and in very small lots—a few copies of a few texts (Febvre andMartin 1958). Contracts between printers in Lyons and Poitiersfrom the late 1500s indicate that the allowance for transport costsassociated with a journey of approximately 360 km raised thesale price of transported books by 20% (Febvre and Martin 1958).Records from the archives of the Ruiz merchant family indicatethat insurance and transport costs for a shipment of 21 booksfrom Lyon to Medina del Campo (280 km as the crow flies) wereequivalent to 30 days’ wages for a skilled craftsman (Febvre andMartin 1958). Archival holdings provide additional evidence onthe limits on the trade in print media. The Bayerische Staats-bibliothek in Munich houses the largest and most comprehensivehistoric collection of books printed 1450–1500. Figure II showsthat the proportion of the editions produced in a given city andheld in the Munich archives declines sharply (and nonlinearly) inthe distance between the printing city and the archive.17
Printing cities also enjoyed benefits due to agglomerationeconomies. The printing press produced new face-to-face inter-actions in addition to books and pamphlets. Printers’ workshopsbrought scholars, merchants, craftsmen, and mechanics togetherfor the first time in a commercial environment, eroding a pre-existing “town and gown” divide (Eisenstein 1979). Bookshopsand the houses of printers became meeting places and temporaryresidences for intellectuals. Print technology alsoproduced, in theprinter-scholar, “a ‘new man’. . . adept in handling machines andmarketing products even while editing texts, founding learnedso-cieties, promoting artists andauthors, [and] advancing newformsof data collection”(Eisenstein 1979). Historical research indicatesthat these activities made printing cities attractive cultural andeconomiclocations. Cities that were early adopters of the printingpress attracted booksellers, universities, and students. Adoptionof theprintingpress alsofosteredbackwardlinkages: theprintingpress attracted paper mills, illuminators, and translators.18
in Strasbourg toreprint the work than it was for the printer in Wittenberg toshipa large number of copies [500 kilometers] to Strasbourg.”
17. Language barriers do not explain this phenomenon: 72% of books printed1450–1500 were printed in Latin and the pattern holds when the sample isrestricted to Latin editions. That an unusually high proportion of books printedVeniceandRomewas heldinforeigncollections is explainedbythefact that Venicewas the commercial hub and leading printing center of Europe 1450–1500 andRome occupied a unique position as the seat of Roman Catholicism.
18. See Febvre and Martin (1958), Barbier (2006), Varry (2002), Fau et al.(2003), and Eisenstein (1979).
at London School of econom
ics on January 24, 2012http://qje.oxfordjournals.org/
Dow
nloaded from
1142 QUARTERLY JOURNAL OF ECONOMICS
FIGURE II
Archive Holdings and Distance from Point of Production
This figure presents data for the 100 cities with the highest output of incunab-ula editions 1450–1500. For each city it shows what share of its editions are heldin the Bayerische Staatsbibliothek in Munich andhowfar the city is from Munich.Markers are scaled to reflect the magnitude of city book production. Fitted valuesestimated with locally weighted regression. Data on total incunabula productionfrom ISTC (1998).
IV. DATA
This article exploits data on the diffusion and output ofprinting presses over the technology’s infant industry period(1450–1500). Between 1450 and 1500, entrepreneurs establishedprinting presses across Europe and the real price of books fell bytwo-thirds (Zanden 2004; Clark 2004). Between 1500 and 1800,printing technology was largely unchanged and declines in theprice of books were relatively modest (Febvre and Martin 1958;Fussel 2005).19 Historical research emphasizes that the period1450–1500 was the “first infancy” of printing. Books produced1450–1500 are referred to as incunabula, from the Latin for
19. Clark (2004) finds that real book prices in England fell 75% between 1450and 1530 and stabilized at one-third the pre-Gutenberg level through the late1700s. Zanden (2009) examines Dutch data and estimates that real prices fell bytwo-thirds 1450–1500. Zanden estimates that between 1500 and 1800 book pricesdeclined from approximately one-third to one-sixth of the pre-Gutenberg level.
at London School of econom
ics on January 24, 2012http://qje.oxfordjournals.org/
Dow
nloaded from

IT AND ECONOMIC CHANGE 1143
“cradle” or “infancy” (Febvre and Martin 1958; Clair 1976;Glomski 2001; Barbier 2006). Over the infant industry periodsupply-side constraints limited technology diffusion. As will bediscussed, by the early to mid-1500s these constraints were re-laxed.
I construct data onthelocationandoutput of printingpressesover the infant industry period from three principal sources. Thefirst source is the Incunabula Short Title Catalogue (ISTC 1998)maintained by the British Library. The ISTC (1998) “recordsnearly every [incunabulum] printed from movable type before1501.”The ISTC (1998) records 27,873 printedbooks. Each recordincludes the title, publication date, and location of publication.The ISTC catalogs fifteenth-century editions printed in 196 his-toric cities.20 The second source is Febvre and Martin’s (1958)L’Apparition du Livre, which documents 181 historic cities thatadopted the printing press 1450–1500. The third source is Clair’s(1976) A History of European Printing, which documents theestablishment of printingpresses in188 historiccities 1450–1500.As shown in Table I, the historical sources identify 205 uniquecities that adopted the printing press 1450–1500.21
Data on the locations and populations of Europe’s historiccities are from Bairoch, Batou, andChevre (1988). Theirapproachis to identify the set of cities that ever reached 5,000 inhabitantsbetween 1000 and 1800 and then search for population data forthese cities in all periods. The data record (in thousands) the pop-ulations of urban agglomerations, not simply populations withinadministratively defined boundaries.22 These data—henceforththe “Bairoch data”—are recorded every 100 years up to 1700,and then every 50 years to 1850. The data set contains a total of2,204 historicEuropeancities. Populations areobservedevery100
20. Of the 27,873 records, 1,352 are either undated or are associated withdates outside 1450–1500 and 738 indicate only a regional location or possible citylocations.
21. This figure comprises the 196 cities from the ISTC, four additional printingcities identified by Febvre and Martin, four identified by Clair, and one identifiedby Clair and Febvre and Martin. While presses operated in these nine additionalcities, since we have no record of incunabula produced at these locations, they arenot recorded in ISTC (1998). Results are not contingent on the inclusion of thesecities.
22. Bairoch, Batou, and Chevre (1988) include populations of “the ‘fauborgs’,the ‘suburbs’, ‘communes’, ‘hamlets’, ‘quarters’, etc. that are directly adjacent” tohistoric city centers. Bairoch, Batou, and Chevre draw data from urban censuses,tax records, archaelogical work, as well as other primary and secondary sources.These data are examined in greater detail in Dittmar (2010).
at London School of econom
ics on January 24, 2012http://qje.oxfordjournals.org/
Dow
nloaded from

1144 QUARTERLY JOURNAL OF ECONOMICS
TABLE I
THE DIFFUSION OF THE PRINTING PRESS 1450–1500
(1) (2) (3) (4)Cities Adopting Total Number of Share
20th-Century Polity Printing Press Historic Cities Adopting (%)
Austria 1 17 6Belgium 9 72 13Czechoslovakia 5 36 14Denmark 2 10 20England 3 165 2France 39 341 11Germany 40 245 16Hungary 1 47 2Italy 56 406 14Netherlands 11 60 18Poland 3 55 5Portugal 6 53 11Spain 24 265 9Sweden 1 20 5Switzerland 4 19 21Total 205 1,811 11
Notes. See text for the sources identifying printing cities. Data on total cities represent the historicalcities identified in Bairoch, Batou, and Chevre (1988).
years 1300–1800 for a balanced panel of 202 cities.23 The leadingalternate source of data on historic city populations is the panelin de Vries (1984). This article analyzes the Bairoch data becausethe de Vries (1984) data are restricted to 1500–1800 and coveronly cities that reached a population of 10,000.24
The econometric work that follows also exploits a newdatabase on the historical characteristics of European cities,including which cities were located on navigable rivers, sea ports,and the sites of Roman settlement; which were political or reli-gious centers; and measures of economic institutions. These dataare described in the Data Appendix.
23. ISTC (1998), Clair (1976), and Febvre and Martin (1958) identify printingpresses at some locations that do not appear in the Bairoch city data. Thesewere overwhelmingly nonurban religious establishments (principally monaster-ies). Other “missing” print centers were adjacent to cities that did have pressesand represent a sort of duplication. Westminster with its proximity to the cityof London is an example. In keeping with the economic understanding of urbanagglomeration, and the construction of the Bairoch data, this article treats pro-duction of print media at Westminster as London output.
24. Dittmar (2010) analyzes and compares these data in greater detail.
at London School of econom
ics on January 24, 2012http://qje.oxfordjournals.org/
Dow
nloaded from

IT AND ECONOMIC CHANGE 1145
V. EMPIRICS
V.A. Overview
Per capita income data are not available at the city leveland the existing data on urban wages are confined to a smallnumber of cities.25 However, the consensus in the literature onurbanization in Europe is that population size was an indicatorof the overall vitality and well-being of cities in early modern Eu-rope.26 Moreover, city growth may reflect technological progress.In modern economies with mobile labor, high-productivity citiesare likely to draw migrants (Glaeser, Scheinkman, and Shleifer1995). In a Malthusian economic regime, or one with Lewis-styleunlimited supplies of surplus labor in agriculture, technologicalchange in the urban sector will also show up in city growth. Forthese reasons, this article focuses on the relationshipbetween theadoption of print technologies and city growth.
Because data on the number of presses in operation are onlyavailable for a small subset cities, and because the availablemeasures of output are coarse, I focus on adoption. Data on theproduction of incunabula editions provide valuable but imperfectmeasures of production. Pamphlets, booklets, andotherephemeraconstituted a large, unmeasured share of output. The produc-tion of ephemera was less concentrated than the production ofexpensive books and the intercity trade in ephemeral forms ofprint media was relatively limited: historians designate theseephemeral media as “cityprinting”(l’imprimeriedeville).27 Thesemedia playedanimportant role inthedevelopment of literacyandprint culture that measures of book production may not capture.These facts support an emphasis on the printing press itself.
V.B. Comparison of Average Outcomes
This section compares the population growth of cities thatwere early adopters of print technology with the growth ofcities that were not. It documents that cites in which printing
25. Allen (2007) compiles data on real wages in 20 cities. These extend to theearly 1400s for only eight cities, all of which adopted printing 1450–1500. Similarcoverage is available in the data collected by the Global Price and Income HistoryGroup (UC Davis) and the International Institute for Social History.
26. See Acemoglu, Johnson, andRobinson (2005), Bairoch (1988), and de Vries(1984).
27. See Nieto (2003), Flood (1998), Edwards (1995), Eisenstein (1979), Febvreand Martin (1958), and Barbier (2006).
at London School of econom
ics on January 24, 2012http://qje.oxfordjournals.org/
Dow
nloaded from

1146 QUARTERLY JOURNAL OF ECONOMICS
presses were established in the late 1400s grewrelatively quickly1500–1600.28
Table II compares, by country, the growth 1500–1600 ofcities that were early adopters with the growth of cities thatwere not. It includes all cities for which population data areavailable. It shows that on average, cities that adopted the pressin the late 1400s grew 20 percentage points more than nonprint-ing cities 1500–1600. Table II also shows that the cities thatadopted were unusually large: 30% of cities with population dataadopted, but adopting cities accounted for 58% of total urbanpopulation in 1500. Moreover, the Netherlands stand out as aneconomy in which printing press cities grew relatively slowly1500–1600. Table III shows that the print cities’ growth advan-tage declined to a modest 7 percentage points 1500–1800. It alsoshows that in Germany print cities grew relatively slowly overlong periods.29
For Germany the slow growth of print cities in the 1600swas associated with military conflict (the Thirty Years War,1618–1648) in which flourishing cities were depopulated. In theNetherlands, the slow growth of print cities 1500–1800 is en-tirely accounted for by slow growth before 1700. The Netherlandswere the site of military conflict through much of the sixteenthcentury and from 1621, following the expiration of the TwelveYears Truce.30 These wars were confessional conflicts betweenCatholic and Protestant forces. Since print media were criticalfor the diffusion of the Reformation (Edwards 1995; Gilmont1998), these wars cannot be viewedsimply as “exogenous shocks.”As discussed in Section V.F., the positive economic impactsof the printing press may have been offset the adverse conse-quences of the religious diversity and conflict it was used topromote.
28. It is natural to wonder whether the printing press impacted incomes atthe city level. The data on wages are limited to a small number of cities almostall of which adopted the press 1450–1500. The Online Appendix documents thatskill premia (the ratio of skilled wages to unskilled wages) increased after theestablishment of printing presses and discusses the increases in urban wagesobserved 1500–1600.
29. Theslowgrowthof formerCzechprint cities is duetoPrague’s demographicdecline, whichwas associatedwiththereimpositionofserfdomandthecityceasingto be a political capital.
30. Leiden was notable as the city in which the Elsevier publishing house wasbased. In 1572, Leiden was besieged by Spanish (Catholic) forces and lost a thirdof its population.
at London School of econom
ics on January 24, 2012http://qje.oxfordjournals.org/
Dow
nloaded from

IT AND ECONOMIC CHANGE 1147
TA
BL
EII
PR
INT
TE
CH
NO
LO
GY
AN
DL
OG
CIT
YG
RO
WT
H15
00–1
600
Pre
ssA
dop
ted
1450
–150
0P
ress
Not
Ad
opte
d14
50–1
500
(1)
(2)
(3)
(4)
(5)
(6)
(7)
(8)
No.
Urb
anW
eigh
ted
No.
Urb
anW
eigh
ted
Pri
nt
Cit
y20
th-C
entu
ryof
Pop
.A
vera
geof
Pop
.A
vera
geG
row
thP
olit
yC
itie
s15
00G
row
thC
itie
s15
00G
row
thA
dva
nta
ge
Au
stri
a1
200.
927
43−
0.03
0.95
Bel
giu
m8
202
−0.
0815
136
−0.
270.
19C
zech
oslo
vak
ia2
850.
236
250.
25−
0.02
Den
mar
k1
101.
391
30.
510.
88E
ngl
and
255
1.16
3816
60.
210.
95F
ran
ce21
662
0.20
2834
70.
040.
16G
erm
any
2736
00.
1653
318
0.12
0.04
Ital
y34
1,11
90.
2662
442
0.24
0.02
Net
her
lan
ds
910
40.
3417
119
0.53
−0.
19P
olan
d3
770.
6014
960.
080.
52P
ortu
gal
487
0.56
319
0.04
0.52
Sp
ain
1935
90.
3755
554
−0.
150.
51S
wed
en1
70.
2517
270.
060.
20S
wit
zerl
and
327
0.25
38
0.00
0.25
Tot
als
135
3,17
40.
2731
92,
303
0.07
0.20
Not
es.U
rban
pop
ula
tion
sar
egi
ven
inth
ousa
nd
s.A
tth
eco
un
try
leve
l,w
eigh
ted
aver
age
grow
th(c
olu
mn
s4
and
7)is
calc
ula
ted
usi
ng
city
pop
ula
tion
sin
1500
asth
ew
eigh
tson
log
city
grow
th.
At
the
city
leve
l,lo
ggr
owth
1500
–160
0isln(
PO
P16
00P
OP
1500
),
wh
ere
PO
Pt
isci
typ
opu
lati
onin
year
t.T
he
pri
nt
grow
thad
van
tage
(col
um
n8)
isth
ed
iffe
ren
cebe
twee
n
aver
age
grow
thfo
rad
opti
ng
and
non
adop
tin
gci
ties
(col
um
n4−
colu
mn
7).A
cros
sal
lco
un
trie
s,to
tal
wei
ghte
dav
erag
egr
owth
isca
lcu
late
du
sin
gu
rban
pop
ula
tion
sin
1500
asth
ew
eigh
ts.H
un
gary
isom
itte
dbe
cau
seB
ud
aw
asth
elo
ne
Hu
nga
rian
pri
nt
city
and
the
Bai
roch
dat
ad
on
otre
cord
Bu
da’
sp
opu
lati
onin
1600
.
at London School of econom
ics on January 24, 2012http://qje.oxfordjournals.org/
Dow
nloaded from

1148 QUARTERLY JOURNAL OF ECONOMICS
TABLE III
PRINT TECHNOLOGY AND LOG CITY GROWTH 1500–1800
Press Adopted 1450–1500 Press Not Adopted 1450–1500
(1) (2) (3) (4) (5) (6) (7) (8)No. Urban Weighted No. Urban Weighted PrintCity
20th-Century of Pop. Average of Pop. Average GrowthPolity Cities 1500 Growth Cities 1500 Growth Advantage
Austria 1 20 2.51 7 43 0.09 2.42Belgium 8 202 0.32 25 174 0.05 0.27Czechoslovakia 4 109 −0.05 7 29 0.87 −0.92Denmark 1 10 2.31 1 3 −0.41 2.72England 3 60 2.48 52 213 1.19 1.29France 26 700 0.44 48 440 0.44 −0.01Germany 30 374 0.26 79 387 0.44 −0.18Hungary 1 12 0.73 4 29 1.15 −0.41Italy 34 1, 119 0.38 67 463 0.37 0.01Netherlands 11 118 0.32 22 142 0.72 −0.40Poland 3 77 0.39 15 100 −0.02 0.41Portugal 4 87 1.05 21 114 0.26 0.79Spain 19 359 0.30 56 556 −0.07 0.37Sweden 1 7 2.38 17 27 0.67 1.72Switzerland 3 27 0.60 8 26 0.51 0.09
Totals 149 3,281 0.43 429 2,746 0.36 0.07
Notes. Urbanpopulations aregiveninthousands. At thecountrylevel, weightedaveragegrowth(columns4 and 7) is calculated using city populations in 1500 as the weights on log city growth. At the city level, log
growth 1500–1600 is ln(
POP1800POP1500
), where POPt is city population in year t. The print growth advantage
(column 8) is the difference between average growth for adopting and nonadopting cities (column 4 − column7). Across all countries, total weighted average growth is calculated using urban populations in 1500 as theweights.
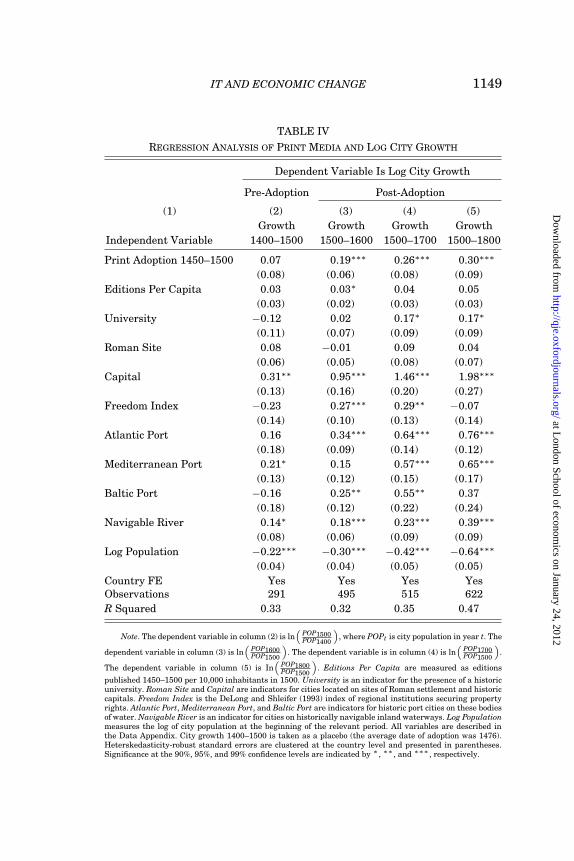
V.C. Regression Analysis
Table IV presents regression estimates that examine log citygrowth over 100-, 200-, and 300-year periods. These estimatesshow that cities that adopted the printing press in the late 1400sgrewnofaster than othercities 1400–1500, but enjoyedvery largeand significant growth advantages after 1500. The estimates con-trol for the geographic, institutional, and cultural growth factorsidentifiedin the economichistory, urban economics, andeconomicgeography literatures as determining urban growth: populationsize; the historicpresence of political and educational institutions(political capitals and historic universities); the nature of eco-nomic institutions securing protection against expropriation; andadvantages associated with locations at sea ports, navigablerivers, and sites where Roman settlements were established(Hohenberg and Lees 1985; DeLong and Shleifer 1993; Acemoglu,
at London School of econom
ics on January 24, 2012http://qje.oxfordjournals.org/
Dow
nloaded from
IT AND ECONOMIC CHANGE 1149
TABLE IV
REGRESSION ANALYSIS OF PRINT MEDIA AND LOG CITY GROWTH
Dependent Variable Is Log City Growth
Pre-Adoption Post-Adoption
(1) (2) (3) (4) (5)Growth Growth Growth Growth
Independent Variable 1400–1500 1500–1600 1500–1700 1500–1800
Print Adoption 1450–1500 0.07 0.19∗∗∗ 0.26∗∗∗ 0.30∗∗∗
(0.08) (0.06) (0.08) (0.09)Editions Per Capita 0.03 0.03∗ 0.04 0.05
(0.03) (0.02) (0.03) (0.03)University −0.12 0.02 0.17∗ 0.17∗
(0.11) (0.07) (0.09) (0.09)Roman Site 0.08 −0.01 0.09 0.04
(0.06) (0.05) (0.08) (0.07)Capital 0.31∗∗ 0.95∗∗∗ 1.46∗∗∗ 1.98∗∗∗
(0.13) (0.16) (0.20) (0.27)Freedom Index −0.23 0.27∗∗∗ 0.29∗∗ −0.07
(0.14) (0.10) (0.13) (0.14)Atlantic Port 0.16 0.34∗∗∗ 0.64∗∗∗ 0.76∗∗∗
(0.18) (0.09) (0.14) (0.12)Mediterranean Port 0.21∗ 0.15 0.57∗∗∗ 0.65∗∗∗
(0.13) (0.12) (0.15) (0.17)Baltic Port −0.16 0.25∗∗ 0.55∗∗ 0.37
(0.18) (0.12) (0.22) (0.24)Navigable River 0.14∗ 0.18∗∗∗ 0.23∗∗∗ 0.39∗∗∗
(0.08) (0.06) (0.09) (0.09)Log Population −0.22∗∗∗ −0.30∗∗∗ −0.42∗∗∗ −0.64∗∗∗
(0.04) (0.04) (0.05) (0.05)Country FE Yes Yes Yes YesObservations 291 495 515 622R Squared 0.33 0.32 0.35 0.47
Note. The dependent variable in column (2) is ln(
POP1500POP1400
), where POPt is city population in year t. The
dependent variable in column (3) is ln(
POP1600POP1500
). The dependent variable is in column (4) is ln
(POP1700POP1500
).
The dependent variable in column (5) is In(
POP1800POP1500
). Editions Per Capita are measured as editions
published 1450–1500 per 10,000 inhabitants in 1500. University is an indicator for the presence of a historicuniversity. Roman Site and Capital are indicators for cities located on sites of Roman settlement and historiccapitals. Freedom Index is the DeLong and Shleifer (1993) index of regional institutions securing propertyrights. Atlantic Port, Mediterranean Port, and Baltic Port are indicators for historicport cities on these bodiesof water. Navigable River is an indicator for cities on historically navigable inlandwaterways. Log Populationmeasures the log of city population at the beginning of the relevant period. All variables are described inthe Data Appendix. City growth 1400–1500 is taken as a placebo (the average date of adoption was 1476).Heterskedasticity-robust standard errors are clustered at the country level and presented in parentheses.Significance at the 90%, 95%, and 99% confidence levels are indicated by ∗, ∗∗ , and ∗∗∗ , respectively.
at London School of econom
ics on January 24, 2012http://qje.oxfordjournals.org/
Dow
nloaded from

1150 QUARTERLY JOURNAL OF ECONOMICS
Johnson, andRobinson 2005).31 On average European cities grewby 0.27 log points 1500–1600. Table IV shows print cities grewanadditional 0.19 log points over this period. This estimate impliesthat printingaccountedfor18% ofcitygrowth1500–1600.32 Inthebalanced panel, the print effect is stronger (0.3 log points) 1500–1600 and the association between books per capita and growthvanishes. This suggests that city printing (pamphlets, price lists,and other nonbook materials) and the subject matter of printmedia were important (see the Online Appendix). The resultsalso hold when we exclude the cities of Eastern Europe that wereexposed to the institutions of the second serfdom post-1500.33
These results are supported by generalized difference-in-differences regression estimates that test whether and whencities that adopted printing in the late 1400s began to grow rel-atively quickly. The generalized difference-in-differences set-upestimates the association between city growth andthe interactionbetween print status and time in the balanced panel of citieswith populations observed every 100 years 1300–1800. The basicreduced-form model is:
(1) Yi,t = θi + δt +1700∑
t=1300
αtDtTi + X ′i,tγ + εi,t.
Here Yi,t is log city growth for city i in time t, the θi’s arecity fixed effects, the δt’s time fixed effects, Dt is an indicatorvariable for each time period, Ti is an indicator variable capturingwhether city i was an early adopter of print technology, Xi,t is avector of covariates, and εi,t is the error term. The coefficient ofinterest is αt, which captures the growth advantage print citiesenjoyed in each time period t. Covariates Xi,t include controlsfor universities, political capitals, and country fixed effects; in-teractions between indicators for Atlantic ports and time fixedeffects; indicators for Mediterranean ports and time fixed effects;
31. Results are robust to controls for Protestantism. For discussion of religionsee Section V.F.
32. This calculation relies on the point estimate of 0.19, the fact that printingpresses were established in 135 of the 495 cities in Table IV, and the assumptionthat the establishment of presses in printing cities did not depress the growthof cities without presses. Evidence for this assumption is discussed below and inthe Online Appendix. The fact that the estimated print effect does not fall whencontrols are added may appear puzzling. The explanation is that printers tendedto go to larger cities and big cities typically grew slowly. This nonrandom growthdynamic is analyzed in Dittmar (2010).
33. On the impact of the “second serfdom” see Dittmar (2010).
at London School of econom
ics on January 24, 2012http://qje.oxfordjournals.org/
Dow
nloaded from

IT AND ECONOMIC CHANGE 1151
interactions between country and year indicators; and betweenlog population and year indicators to control for the negativeassociation between intial city size and city growth identified inDittmar (2010).
Table V documents that the cities that adopted the printingpress inthelate1400s hadnopriorgrowthadvantagebut a highlysignificant advantage of over 30 percentage points after 1500. Itshows that althoughprint cities enjoyedgrowthadvantages 1600–1700 and 1700–1800, the estimates do not cross the conventionalthresholds for statistical significance in the complete sample. InTable V, the line “Print × Yr1400” presents the estimate of therelative growth advantage print cities enjoyed 1400–1500, theline “Print × Yr1500” presents the estimated print city growthadvantage 1500–1600, and so on.
Table V shows that the print effect is not driven by theparticular region in which cities were located, but was driven bythe growth advantages enjoyed by ports that adopted printing.34
Column (6) shows that when the sample is restricted to portcities, cities that adoptedprinting in the late 1400s hadextremelylargesubsequent growthadvantages. It alsoshows that—oncetheinteraction between printing and ports is considered—Atlanticports enjoyed no systematic advantages over non-Atlantic ports.Column (7) shows that among cities that were not ports, earlyadoption of the printing press was associated with a modest andstatistically insignificant growth advantage. Interestingly, portswere less likely to get the printing press than other cities. Inthe balanced sample, printing presses were established by 1500in 43% of nonport cities and 36% of sea ports. Controlling forcity size, the presence of universities, country fixed effects, andmeasures of institutional quality, there is a significant negativeassociation between ports and the adoption of the printing press1450–1500.35
V.D. Technology Adoption
The printing press was not randomly assigned to cities. Thissection describes how the technology was brought to and adoptedby the cities of Europe. It documents that the quasi-proprietary
34. The results are not driven by a “London effect.” Excluding English citiesdoes not change the results. The results are similarly robust to controlling forProtestantism. On religion, see Section V.F.
35. For this analysis, see the Online Appendix.
at London School of econom
ics on January 24, 2012http://qje.oxfordjournals.org/
Dow
nloaded from

1152 QUARTERLY JOURNAL OF ECONOMICS
TABLE V
LOG CITY GROWTH: THE TIMING OF THE PRINT ADVANTAGE
(1) (2) (3) (4) (5) (6) (7)All Cities Exclude Exclude Exclude If Only Only CitiesBalanced German Italian & East of Port Without
Variable Sample Cities Dutch Cities Elbe River Cities Ports
Print× Yr1400 0.09 0.10 0.09 0.11 0.27 −0.04(0.16) (0.18) (0.20) (0.17) (0.38) (0.16)
Print× Yr1500 0.34∗∗ 0.39∗∗ 0.41∗∗ 0.34∗∗ 1.39∗∗∗ 0.10(0.15) (0.17) (0.18) (0.16) (0.42) (0.15)
Print× Yr1600 0.13 0.22 0.08 0.16 0.73∗∗ −0.01(0.16) (0.17) (0.20) (0.16) (0.34) (0.17)
Print× Yr1700 0.19 0.25 0.16 0.22 0.84∗∗ 0.00(0.14) (0.16) (0.17) (0.14) (0.42) (0.15)
Atlantic× Yr1400 0.12 0.27 0.13 0.12 −0.32 —(0.31) (0.33) (0.37) (0.31) (0.52) —
Atlantic× Yr1500 0.43∗ 0.55∗∗ 0.38 0.44∗ −0.24 —(0.25) (0.28) (0.28) (0.25) (0.52) —
Atlantic× Yr1600 0.42∗ 0.49∗ 0.33 0.45∗∗ 0.47 —(0.22) (0.25) (0.24) (0.22) (0.38) —
Atlantic× Yr1700 0.60∗∗∗ 0.73∗∗∗ 0.64∗∗∗ 0.62∗∗∗ 0.32 —(0.19) (0.20) (0.21) (0.19) (0.38) —
R squared 0.55 0.57 0.58 0.54 0.77 0.53Observations 1,010 875 710 850 225 785
Adopting Cities 83 71 53 78 16 67Nonadopting Cities 119 104 89 92 29 90
Note. This table presents estimates of Equation (1) using the balanced panel of cities with population
data observed every 100 years 1300–1800. The dependent variable is log population growth: ln(
POPt+100POPt
),
where POPt is city population in year t and t = 1300, . . . , 1700. Print is an indicator variable for citiesthat adopted the printing press 1450–1500. The variables Yr1400,. . . , Yr1700 are indicators for 100-yearperiods starting 1400, . . . , 1700. Atlantic is an indicator variable for cities that were historic ports onthe Atlantic Ocean. Regressions control for city, country, and year fixed effects; country cross year fixedeffects; Mediterranean port cross-year fixed effects; and log population. See Data Appendix for details onthe construction of the control variables. Heterskedasticity-robust standard errors clustered by city are inparentheses. Significance at the 90%, 95%, and 99% confidence levels are indicated by ∗, ∗∗ , and ∗∗∗ ,respectively.
nature of the technology limited diffusion on the supply sideand how distance from Mainz was an important determinant ofadoption 1450–1500.36
The movable type printing press was developed by JohannesGutenberg in Mainz around 1450. In subsequent decades en-trepreneurial printers spread the technology to other European
36. Section V.E. documents the negative relationship between adoption anddistance within economies. It shows that distance from Mainz is a strong in-strument for adoption and yields large, significant estimates of the technology’simpact. For analysis of factors associated with adoption see also the OnlineAppendix.
at London School of econom
ics on January 24, 2012http://qje.oxfordjournals.org/
Dow
nloaded from
IT AND ECONOMIC CHANGE 1153
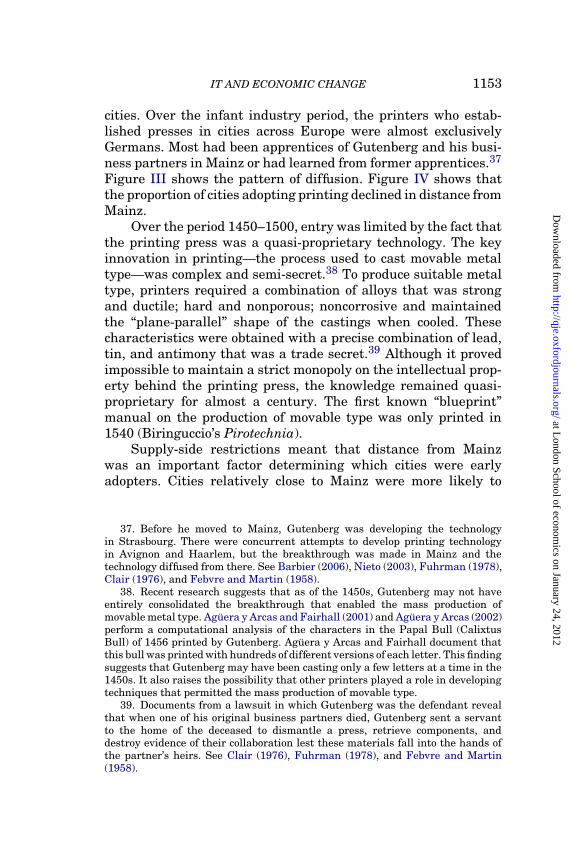
cities. Over the infant industry period, the printers who estab-lished presses in cities across Europe were almost exclusivelyGermans. Most had been apprentices of Gutenberg and his busi-ness partners in Mainz or hadlearnedfrom former apprentices.37
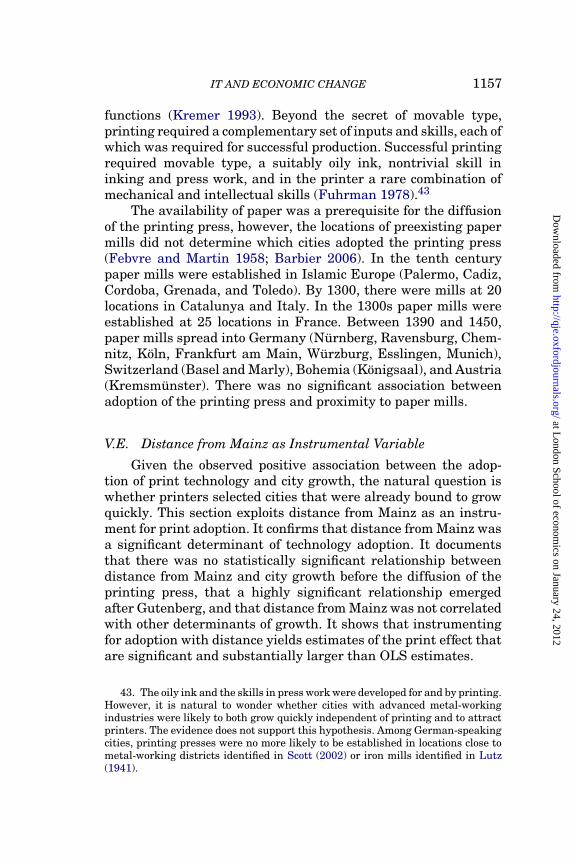
Figure III shows the pattern of diffusion. Figure IV shows thattheproportionofcities adoptingprintingdeclinedindistancefromMainz.
Over the period1450–1500, entry was limitedby the fact thatthe printing press was a quasi-proprietary technology. The keyinnovation in printing—the process used to cast movable metaltype—was complex and semi-secret.38 To produce suitable metaltype, printers required a combination of alloys that was strongand ductile; hard and nonporous; noncorrosive and maintainedthe “plane-parallel” shape of the castings when cooled. Thesecharacteristics were obtained with a precise combination of lead,tin, and antimony that was a trade secret.39 Although it provedimpossible tomaintain a strict monopoly on the intellectual prop-erty behind the printing press, the knowledge remained quasi-proprietary for almost a century. The first known “blueprint”manual on the production of movable type was only printed in1540 (Biringuccio’s Pirotechnia).
Supply-side restrictions meant that distance from Mainzwas an important factor determining which cities were earlyadopters. Cities relatively close to Mainz were more likely to
37. Before he moved to Mainz, Gutenberg was developing the technologyin Strasbourg. There were concurrent attempts to develop printing technologyin Avignon and Haarlem, but the breakthrough was made in Mainz and thetechnology diffused from there. See Barbier (2006), Nieto(2003), Fuhrman (1978),Clair (1976), and Febvre and Martin (1958).
38. Recent research suggests that as of the 1450s, Gutenberg may not haveentirely consolidated the breakthrough that enabled the mass production ofmovablemetal type. Aguera yArcas andFairhall (2001) andAguera yArcas (2002)perform a computational analysis of the characters in the Papal Bull (CalixtusBull) of 1456 printed by Gutenberg. Aguera y Arcas and Fairhall document thatthis bull was printedwithhundreds ofdifferent versions ofeachletter. This findingsuggests that Gutenberg may have been casting only a few letters at a time in the1450s. It also raises the possibility that other printers played a role in developingtechniques that permitted the mass production of movable type.
39. Documents from a lawsuit in which Gutenberg was the defendant revealthat when one of his original business partners died, Gutenberg sent a servantto the home of the deceased to dismantle a press, retrieve components, anddestroy evidence of their collaboration lest these materials fall into the hands ofthe partner’s heirs. See Clair (1976), Fuhrman (1978), and Febvre and Martin(1958).
at London School of econom
ics on January 24, 2012http://qje.oxfordjournals.org/
Dow
nloaded from

1154 QUARTERLY JOURNAL OF ECONOMICS
FIGURE III
The Diffusion of the Movable Type Printing Press
receive the technology other things equal (Barbier 2006). As Nieto(2003) notes, faced with high travel costs and the uncertaintiesassociated with the matching process, printers who establisheda profitable press in a given city had few incentives to leave.
at London School of econom
ics on January 24, 2012http://qje.oxfordjournals.org/
Dow
nloaded from

IT AND ECONOMIC CHANGE 1155
FIGURE IV
Distance from Mainz and Adoption of the Printing Press, 1450–1500
This figuredocuments therelationshipbetweendistancefromMainz, Germanyand the proportion of historic cities that adopted the printing press 1450–1500.Historic cities are those identified in Bairoch, Batou, and Chevre (1988).
Consistent with these observations, 40 of Europe’s 100 largestcities did not have printing presses in 1500.
Regulatory barriers to diffusion and entry were minimal.Printing with movable type was a newoccupation and fell outsideexisting guild regulations. Fussel (2005) observes that over theinfant industry period the business was “free to develop withoutregulation by governments, princely houses or the Church, nor isthere any evidence that any restrictions were imposed by guilds.”Barbier (2006), Nicholas (2003), Brady (2009), and Neddermeyer(1997) confirm that entry was free and unregulated.
Incontrast, financial barriers toentrywerenotable. Forthoseunable to manufacture movable type, the cost of a complete setof equipment was equivalent to the wages a craftsman wouldearn over a period of 4 to 10 years.40 In addition, paper wasexpensive, printers realized returns on print runs only over time,
40. Data from bequests show that the equipment required to establish a presscost 250–600 livres in the early 1500s (Gilmont 1998; Febvre and Martin 1958).A livre was worth 18.7 g of silver 1500–1550. The average wage earned by acraftsman in Paris was 4.4 g of silver per day 1500–1550 (the average wage across18 cities was 4.7 g—see Allen 2007).
at London School of econom
ics on January 24, 2012http://qje.oxfordjournals.org/
Dow
nloaded from

1156 QUARTERLY JOURNAL OF ECONOMICS
and successful printing required a minimum efficient scale. As aresult, printers typically required financial backing.41
Originating in Mainz, the technology diffused through asearch process. The process was shaped by demand-side fun-damentals but had an important random component. Printerssought two things: a backer to finance an establishment and atown with sufficiently large and stable demand for print me-dia (Febvre and Martin 1958). Cities with universities, or withsovereignpolitical andlegal institutions, typicallyprovidedstablemarkets. However, historians observe that the entrepreneurs’information was incomplete and that random and accidental fac-tors shaped the process through which they settled on locations.Clair (1976) observes that a notable fraction of the early printersbecame “nomads, trusting to luck to find a backer who would en-able them tosettle and establish themselves.” Febvre and Martin(1958) identify the idiosyncratic interest of particular capitalists,patrons, and religious institutions had in making texts availableas the dominant factor in the diffusion process.42 Gilmont (1998)observes that technology diffusion was, “guided more by chancethanbyanyassessment ofprofitablecenters”inwhichtoestablishpresses and that a set of early print centers maintained firstmover advantages in subsequent centuries (Gilmont 1992).
The pattern of diffusion was shaped by the fact that print-ing exhibited characteristics associated with o-ring production
41. The main source of commercial credit 1450–1500 was the urban merchantclass (Wright 1996). Over this period, only a handful of cities had organizedexchanges and formal banking systems were only incipient. Many cities withsignificant merchant interests did not adopt printing 1450–1500. Sea port citieswere commercial and financial centers. In the balanced sample, printing presseswere established in 36% of port cities and in 43% of nonport cities. Important seaports that did not get the printing press include Bari, Bordeaux, Bremen, Dor-drecht, Dublin, Konigsberg (Kaliningrad), Livorno, Malaga, Marseilles, Salerno,Santander, Salonika, andToulon. As documentedintheOnlineAppendixseaportswereless likelythanothercities toget printingpresses 1450–1500 evencontrollingfor distance from Mainz. But many inland cities that were important industrialand financial centers also did not get printing presses 1450–1500 (e.g., Mechelen,Arras, and Lille). These facts suggest that unobserved city characteristics associ-ated with technology adoption and subsequent growth are unlikely to explain theestimatedprintingeffect. Tofurtheraddress concerns about missingdeterminantsof technology adoption andcity growth, Section V.E. exploits distance from Mainzas an instrument for adoption.
42. Printers were invited to Rome, Chartres, Erfurt, and Florence. The firstpress in Paris was not a business venture but a project initiated by two professorsat the Sorbonne. Some years later, workers from this press set up the firstcommercial establishment in Paris. See Clair (1976).
at London School of econom
ics on January 24, 2012http://qje.oxfordjournals.org/
Dow
nloaded from
IT AND ECONOMIC CHANGE 1157
functions (Kremer 1993). Beyond the secret of movable type,printingrequiredacomplementaryset of inputs andskills, eachofwhich was required for successful production. Successful printingrequired movable type, a suitably oily ink, nontrivial skill ininking and press work, and in the printer a rare combination ofmechanical and intellectual skills (Fuhrman 1978).43
The availability of paper was a prerequisite for the diffusionof the printing press, however, the locations of preexisting papermills did not determine which cities adopted the printing press(Febvre and Martin 1958; Barbier 2006). In the tenth centurypaper mills were established in Islamic Europe (Palermo, Cadiz,Cordoba, Grenada, and Toledo). By 1300, there were mills at 20locations in Catalunya and Italy. In the 1300s paper mills wereestablished at 25 locations in France. Between 1390 and 1450,paper mills spread into Germany (Nurnberg, Ravensburg, Chem-nitz, Koln, Frankfurt am Main, Wurzburg, Esslingen, Munich),Switzerland(Basel andMarly), Bohemia (Konigsaal), andAustria(Kremsmunster). There was no significant association betweenadoption of the printing press and proximity to paper mills.
V.E. Distance from Mainz as Instrumental Variable
Given the observed positive association between the adop-tion of print technology and city growth, the natural question iswhether printers selected cities that were already bound to growquickly. This section exploits distance from Mainz as an instru-ment for print adoption. It confirms that distance from Mainz wasa significant determinant of technology adoption. It documentsthat there was no statistically significant relationship betweendistance from Mainz and city growth before the diffusion of theprinting press, that a highly significant relationship emergedafter Gutenberg, andthat distance from Mainz was not correlatedwith other determinants of growth. It shows that instrumentingfor adoption with distance yields estimates of the print effect thatare significant and substantially larger than OLS estimates.
43. Theoilyinkandtheskills inpress workweredevelopedforandbyprinting.However, it is natural to wonder whether cities with advanced metal-workingindustries were likely to both grow quickly independent of printing and to attractprinters. The evidence does not support this hypothesis. Among German-speakingcities, printing presses were no more likely to be established in locations close tometal-working districts identified in Scott (2002) or iron mills identified in Lutz(1941).
at London School of econom
ics on January 24, 2012http://qje.oxfordjournals.org/
Dow
nloaded from

1158 QUARTERLY JOURNAL OF ECONOMICS
TABLE VI
DISTANCE FROM MAINZ AND ECONOMIC OUTCOMES BEFORE AND AFTERGUTENBERG
(1) (2) (3) (4) (5)Log Growth University Log Size Log Growth
Regression Model 1400–1500 in 1450 in 1500 1500–1600
Log Distance to Mainz −0.05 0.00 −0.11 −0.03∗∗∗
(0.04) (0.01) (0.08) (0.01)Observations 269 410 410 410R Squared 0.23 0.12 0.31 0.22
Note. The dependent variable in column (2) is log city growth 1400–1500: ln(
POP1500POP1400
). The dependent
variable in column (3) is an indicator variable recording the presence of a historic university in 1450. Thedependent variable in column (4) is log city population in 1500: ln (POP1500). The dependent variable
in column (5) is log city growth 1500–1600: ln(
POP1600POP1500
). Controls include city latitude, longitude, the
interaction between latitude and longitude; the DeLong-Shleifer index of institutions; indicators for seaports, navigable rivers, capitals, and cities on Roman sites; and log city population. (Log population is not acontrol for the regression reported in column 4.) Sample restricted tobalanced panel of cities with populationobserved 1500–1800 in economies with at least one print city. Heteroskedasticity-robust standard errorsclustered by country in parentheses. Significance at the 99% confidence level is indicated by ∗∗∗ .
Between 1450 and1460 only a small number of men in Mainzknew the secrets of printing. Barbier (2006) observes that in sub-sequent decades thetechnologydiffusedin“concentriccircles”(seealso Febvre and Martin 1958; Nieto 2003). This section exploitsdistance from Mainz as an instrument to capture variation inadoption that was exogenous to the underlying determinants ofcity growth.
Ideally, we would employ a measure of economic distancethat capturedtravel times, travel costs, andtradeflows. However,data on travel times and intercity trade is exceedingly limitedand fragmentary (Braudel 1966). For this reason, I employ greatcircle (“as the crow flies”) distance as an instrument. Becausegreat circle distance is not perfectly correlated with unobservedeconomic distance, we expect to find attenuated estimates of theassociation between distance from Mainz and adoption.
Table VI shows that highly significant relationship betweendistance from Mainz and growth emerged after Gutenberg’s in-novation (1500–1600), but that no significant relationship be-tween growth and distance is observed before the diffusion ofprinting (1400–1500).44 It also documents that cities that wereclose to Mainz not significantly larger or smaller than others
44. An earlier version of this paper reported results from a specification withcountry fixed effects which found that cities farther from Mainz in fact grewrelatively quickly 1400–1500, although this estimate was also not statisticallysignificant.
at London School of econom
ics on January 24, 2012http://qje.oxfordjournals.org/
Dow
nloaded from

IT AND ECONOMIC CHANGE 1159
TABLE VII
INSTRUMENTAL VARIABLE ANALYSIS OF PRINTING AND LOG CITY GROWTH
(1) (2) (3)1st Stage 2nd Stage
Adopt Print City GrowthRegression Model 1450–1500 1500–1600
Log Distance to Mainz −0.06∗∗∗
(0.01)Adopt Print 1450–1500 0.58∗∗
(0.29)Observations 410 410R squared 0.34 0.15F Statistic (IV) 20.74∗∗∗ 82.07∗∗∗
Note. The dependent variable in the first stage is an indicator variable that takes the value of 1 for citiesthat adopted the printing press 1450–1500. The dependent variable in the second stage is log population
growth: ln(
POP1600POP1500
). Distance from Mainz in log kilometers is the instrumental variable for print adoption
1450–1500. Regressions control for: log city population in 1500, port location, navigable rivers, location onRoman sites, political capitals, city latitude, city longitude, the interaction between latitude and longitude,and the DeLong–Shleifer freedom index of regional institutions. The Data Appendix provides detaileddescriptions of these variables. Sample restricted to balanced panel of cities with population observed1500–1800 in economies with at least one print city. Heteroskedasticity-robust standard errors clustered bycountry in parentheses. Significance at the 90%, 95%, and 99% confidence levels are indicated by ∗ , ∗∗ , and∗∗∗.
were no more likely to have housed universities on the eve ofGutenberg’s innovation. These results indicate that the diffusionof the printing press from Mainz provides a plausible means toobtain variation in adoption that is exogenous to preexisting eco-nomicandeducational determinants ofcitygrowth. Theestimatescontrol for ports, navigable rivers, Roman sites, capitals, longi-tude, latitude, the interaction between longitude andlatitude, theDeLong–Shleifer index of institutions, and log city population inthe previous period.
Table VII reports the IV estimates of the impact of earlyprint adoption on city growth. The first-stage results documentthat distance from Mainz is a strong instrument. There was avery significant negative association between distance and adop-tion, and the F statistics for the IV are highly significant: theycross the rule-of-thumb threshold of 10 and the weak instrumentthresholds calculated by Stock and Yogo (2002). The second-stageresults show that the IV estimate of the impact of adoption oncity growth is a significant 0.58 log points for 1500–1600 or,equivalently, 78 percentage points.45
45. A model with country fixed effects yields slightly larger estimates of theeffect of adopting printing 1450–1500 on city population growth 1500–1600.
at London School of econom
ics on January 24, 2012http://qje.oxfordjournals.org/
Dow
nloaded from

1160 QUARTERLY JOURNAL OF ECONOMICS
TABLE VIII
PLACEBO TEST OF INSTRUMENTAL VARIABLE IDENTIFICATION
(1) (2) (3)IV Employs Distance From IV Estimate of Print Effect IV Estimate t Statistic
Mainz 0.58 2.03∗∗
Amsterdam −3.00 0.95London 1.20 0.34Paris −14.25 0.12Venice 0.08 0.55Wittenberg 2.21 0.64
Note. The dependent variable is log population growth 1500–1600: ln(
POP1600POP1500
). All regressions have
the controls noted in Table VII. The sample is restricted to balanced panel of cities with population observed1500–1800. The t statistics are heteroskedasticity robust and clustered by country. Significance at the 95%confidence level is indicated by ∗∗.
Table VIII provides a falsification test of the IV estimates.It compares the estimate obtained using distance from Mainz asthe IV with results obtained using distance from other importantcities: Amsterdam, London, Paris, Venice, and Wittenberg. Theseother cities are placebos. Wittenberg is included because it hasbeen identified as the location from which Protestant ideas dif-fused, because Protestantism may have been a demandshifter forliteracy, and because Becker and Woessmann (2009) argue thatdistance from Wittenberg may identify exogenous variation inProtestantism (the next section examines the interplay betweenreligion and printing in greater detail). Only in the case of Mainzdoes distance pick up a significant print effect on subsequentcity growth. This evidence supports the singular importance ofdistance from Mainz.
The magnitude of the IV estimate is remarkable. For 1500–1600, the IV estimate (αIV = 0.58) is more than twice the size ofthe OLS estimate and implies that printing accounted for 68% oftotal city growth.46 There are several possible explanations forthis result.
First, theOLS estimatemaybeattenuatedbyproxymeasure-ment error. What mattered for city growth was not the physicalpresence of a printing press but its contribution to human capital
46. In the unbalanced sample examined in Table IV, αOLS = 0.19 for 1500–1600. In the balanced panel examined in the Online Appendix, αOLS = 0.29 for1500–1600. The IV point estimate implies that printing accounted for 68% of totalcity growth under the assumption that the establishment of printing presses insome cities did not depress growth in cities without presses. See above and OnlineAppendix for supporting evidence.
at London School of econom
ics on January 24, 2012http://qje.oxfordjournals.org/
Dow
nloaded from

IT AND ECONOMIC CHANGE 1161
accumulation and intellectual exchange. An indicator variablecapturing whether a given city was an early adopter of theprinting press is a coarse proxy for these nuanced aspects ofsocial life. It is likely that cities closer to Mainz were able todevelop richer print cultures over the early modern period. In theOLS regressions, a binaryindicatorproxies forunmeasured“printculture.” It follows that αOLS may be attenuated by a species ofmeasurement errorandthat IV regressionmaypickupa“cleaner”measure of the impact of printing.47
Second, we cannot rule out a priori the possibility that theIV estimate is biased upward by differences implicit in the IVscheme. It is possible that there was underlying heterogeneityin the returns to technology adoption and that the IV approachrecovers returns for a subset of cities likely to have high returns.For this to be the case, on average the cities likely to benefit mostfrom the new technology would have to be the ones located closeto Mainz. A plausible case could be made that this was the casefor Italy. By the middle 1400s, cities in northern Italy arguablyenjoyed institutional advantages over the southern Italian citiesexposed tothe institutions of the kingdoms of Naples and Sicily—andwere closer toMainz. However, when one excludes the Italiancities from the sample, one still gets large IV estimates: a printeffect of over 0.67 log points for 1500–1600 that is significant atthe 95% level.
V.F. Printing and Religion
Print media played a critical role in the diffusion of theProtestant Reformation 1517–1648.48 Historians argue thatthe diffusion of the Reformation would not have been possiblewithout the printing press (Brady 2009). However, religious sen-timent also fostered demand for print media, notably throughProtestant calls for laypersons toread the Bible. Recent economicresearch examines whether Protestantism was associated withvariations in economic outcomes (Becker and Woessmann 2009;
47. One could imagine that distance from Mainz also captures adoption after1500. The evidence does not support this hypothesis. As shown in the next section,cities close toMainz were nomore likely than others toadopt printing 1500–1600.Over this period, supply-side restrictions on diffusion were relaxed.
48. The Evangelical media campaign criticizing CatholicChurch practices wasthe first major attempt to employ the printing press to shape a mass movement.Pamphlets published in the vernacular made Martin Luther the first best-sellingauthor. See Edwards (1995) and Gilmont (1998).
at London School of econom
ics on January 24, 2012http://qje.oxfordjournals.org/
Dow
nloaded from

1162 QUARTERLY JOURNAL OF ECONOMICS
Cantoni 2009). This section examines the interplay between reli-gion and printing.
Becker and Woessmann (2009) argue that Protestantismshifted the demand for literacy and impacted economic outcomesthrough a human capital channel. Becker and Woessmann usedistancetoMartinLuther’s baseinWittenbergas anIV toidentifyexogenous variation in Protestantism within historic Prussia.49
Given the associations Becker and Woessmann find betweenProtestantism, literacy, and prosperity, it is natural to wonderwhether the print effects estimated in this article embody aProtestant demand shift for print media. It is also natural towonder how the IV identification strategy in this article relatesto the IV strategy in Becker and Woessmann (2009).
The historical chronology is important for an understand-ing of these IV strategies. This article examines the impact ofprinting presses established 1450–1500. Martin Luther’s calls forthe reform of the Church first appeared in Wittenberg in 1517.Wittenberg was not a particularly important city before 1517, anddistance from Wittenberg was not associated with the drivers ofgrowth prior to 1517 (Becker and Woessmann 2009).
Consistent with this sequence of events, the baselineinstrumental variable estimate of the print effect reported inTable VII is robust to the inclusion of distance to Wittenberg asan additional control variable. In Table IX, column (2) documentsthat the magnitude and significance of the relationship betweendistance to Mainz and adoption of the printing press is thesame when we control for distance to Wittenberg as in the thebaseline estimate presented in Table VII (this relationship isthe first stage in the IV regression, βFS = −0.06). Column (3)similarly documents that the relationship between distance toMainz and city growth 1500–1600 is the same when we controlfor distance to Wittenberg as in the baseline estimate presentedin Table VI (this is the reduced form, βRF = −0.03). Columns (4)and (5) show that among German-speaking cities there was alsono significant relationship between distance to Wittenberg andthe establishment of printing presses 1450–1500 or betweendistance to Wittenberg and city growth 1500–1600.50 Theseresults are consistent with Cantoni’s (2009) finding that there
49. Wittenbergis 370 kmnortheast of Mainz. ProximitytoWittenbergpredictsProtestantism.
50. The German-speaking cities comprise cities in Germany, Austria, andparts of Alsace, Poland, Switzerland, and Bohemia.
at London School of econom
ics on January 24, 2012http://qje.oxfordjournals.org/
Dow
nloaded from

IT AND ECONOMIC CHANGE 1163
TABLE IX
DISTANCE TO MAINZ (GUTENBERG) AND WITTENBERG (LUTHER)
All Cities German-Speaking Cities
(1) (2) (3) (4) (5)Adopt Print Log Growth Adopt Print Log Growth
Regression Model 1450–1500 1500–1600 1450–1500 1500–1600
Log Distance to Mainz −0.06∗∗∗ −0.03∗∗ −0.04∗∗∗ −0.03∗∗∗
(0.01) (0.01) (0.01) (0.00)Log Distance to Wittenberg 0.03 −0.03 −0.05 0.10
(0.02) (0.02) (0.04) (0.07)Observations 410 410 85 85R squared 0.34 0.22 0.41 0.29
Note. The dependent variable in columns (2) and (4) is an indicator variable that records whether aprinting press was established in a given city 1450–1500. The dependent variable in columns (3) and (5) is
log city growth 1500–1600: ln(
POP1600POP1500
). Controls and t statistics are as in Table VII. European sample
restricted tobalanced panel of cities with population observed 1500–1800. German sample restricted tocitieswith population observed 1500 and 1600. Heterskedasticity-robust standard errors clustered by country inparentheses. Significance at the 95%, and 99% confidence levels are indicated by ∗∗ and ∗∗∗.
was no positive association between Protestantism and citypopulations among German cities 1300–1800.
The data also provide only qualified support for the hypoth-esis that Protestantism was a positive demand shifter for theprinting press. Table X exploits data on printing presses foundedin German-speaking cities after Luther disseminated his famous95 theses in 1517. Columns (2) and (4) show that there is noclear evidence that German-speaking cities close to Wittenbergwere more likely to adopt the printing press after 1517.51 Theweakness of these estimates does not, however, rule out a Protes-tant demand shift for print media from existing printing presses.Columns (2) and (4) also show that distance from Mainz was nolonger negatively associated with the adoption of the printingpress 1517–1600. Over this period, the first blueprints describinghow to create movable type were printed, and the technologyceased to be a trade secret controlled by printers emanating fromMainz. Columns (3) and(5) showthat theproximitytoWittenbergwas not associated with city growth 1600–1700. In fact, citiesfarther from Wittenberg grew relatively quickly. However, thestandard errors on the estimates are large and the association isnot statistically significant.
51. In fact, examining cities in the unbalanced panel. I find that distance fromWittenberg was positively associated with adoption of the printing press 1517–1600 (Table X, column (4)).
at London School of econom
ics on January 24, 2012http://qje.oxfordjournals.org/
Dow
nloaded from

1164 QUARTERLY JOURNAL OF ECONOMICS
TABLE X
PROTESTANTISM AS DEMAND SHIFTER FOR PRINT MEDIA IN GERMANY
Cities from Cities fromBalanced Panel Unbalanced Panel
(1) (2) (3) (4) (5)Adopt Print Log Growth Adopt Print Log Growth
Regression Model 1517–1600 1600–1700 1517–1600 1600–1700
Log Distance to Mainz 0.33∗∗∗
−0.05∗∗∗ 0.16∗ −0.05∗∗∗
(0.07) (0.01) (0.08) (0.01)Log Distance to Wittenberg −0.08 0.04 0.02∗∗∗ 0.06
(0.05) (0.05) (0.00) (0.05)Observations 54 86 106 87R Squared 0.28 0.33 0.18 0.33
Note. The dependent variable in columns (2) and (4) is an indicator variable that records whether aprinting press was established in a given city 1517–1600. The estimates in these columns examine citieswithout printing presses in 1517. The dependent variable in columns (3) and (5) is log city growth 1600–1700:
ln(
POP1700POP1600
). The balancedsample comprises German-speaking cities with population observed1500–1800.
The unbalanced sample comprises cities with population observed in 1500. Controls and t statistics as inTable VII. Significance at the 90%, 95%, and 99% confidence levels are indicated by ∗ , ∗∗ , and ∗∗∗ . Dataon post-1517 presses from Reske (2007). Among German cities adopting the press 1517–1700, the meanadoption year was 1591.
Two related facts may explain why Protestantism mayhave been associated with a demand shift for print media,but Protestant cities did not grow quickly 1600–1700. First,presses in Protestant cities concentratedon producing agitationalpamphlets and religious propaganda (Febvre and Martin 1958)without immediate economic spillovers. Second, while a Protes-tant demand shift could be expected to show up in city growth1600–1700, the Thirty Years War (1618–1648) led to massivedisruptions in economic activity and demographic shocks thathit Protestant cities harder than Catholic cities (Cantoni 2009).During the war, the output of German printing presses declinedby roughly 80% (Febvre and Martin 1958). Moreover, war-relateddemographicdeclines werepronouncedinnortheasternGermany,running as high as 30% of the population (Scott 2002). The ThirtyYears War was a religious conflict and appears to have offset anyprinting-related advantage among Germany’s Protestant cities.This suggests that the economic impact of information tech-nologies may operate through their effects on the transmissionof economically useful ideas and the evolution of beliefs andideologies.
at London School of econom
ics on January 24, 2012http://qje.oxfordjournals.org/
Dow
nloaded from

IT AND ECONOMIC CHANGE 1165
VI. CONCLUSION
Economists have found no evidence that the printingpress was associated with increases in productivity at themacroeconomic level. Some have concluded that the economicimpact of the printing press was limited. This article exploitscity-level data on the diffusion and adoption of the printingpress to examine the technology’s impact from a new perspective.The estimates presented here show that cities that adopted theprinting press in the late 1400s enjoyed no growth advantagesprior to adoption, but grew at least 20 percentage points—and asmuch as 78 percentage points—more than similar cities that didnot over the period 1500–1600. These estimates imply that theimpact of printing accounted for at least 18% and as much as 68%of European city growth between 1500 and 1600.
Between1500 and1800, Europeancities wereseedbeds of theideas, activities, and social groups that launched modern, capital-ist economic growth. The findings herein suggest that movabletype print technologies had very substantial effects in Europeaneconomic history through their impact on cities.
DATA APPENDIX
Data on city populations. City populations are from Bairoch,Batou, and Chevre (1988) and de Vries (1984). City loca-tions are from Bairoch, Batou, and Chevre (1988) and http://www.gpsvisualizer.com/.
Data on print media. The locations of printing presses es-tablished 1450–1500 are from Febvre and Martin (1958), Clair(1976), andISTC (1998). Dataonthenumberofeditions publishedin each city 1450–1500 are from ISTC (1998). Data on printingpresses establishedafter1500 inGerman-speakingcities arefromReske (2007). Data for the Bayerische Staatsbibliothek are onlineat http://mdzx.bib-bvb.de/bsbink/treff2feld.html (accessed March2009). The Bayerische Staatsbibliothek holds historical collec-tions acquired by Duke Albrecht V. In 1558, Albrecht acquiredthe private library of Johann Widmannstetter. In 1571, Albrechtalsopurchasedthe private library of international banker JohannFugger. Additional acquisitions were made as German monaster-ies were dissolved in the 1802–1803 period. Data on merchants’manuals are from Hoock and Jeannin (1991, 2001, 2007).
Control variables. The data sources for the control variablesare as follows.
at London School of econom
ics on January 24, 2012http://qje.oxfordjournals.org/
Dow
nloaded from

1166 QUARTERLY JOURNAL OF ECONOMICS
University is an indicator variable taking the value 1 in agiven period if a university was present in a given city at thebeginning of that period. For instance, the University of Ferrara(Italy) was founded in 1391. For Ferrara, University = 0 in 1300and University = 1 in 1400. Data on the historical location ofuniversities are from Darby (1970) and Jedin, Latourette, andMartin (1970).
Roman Site is an indicator variable taking the value of 1 forcities located on the sites of Roman settlements. Data on Romansettlements arefrom Stillwell, MacDonald, andMcAllister (1976).
Port is an indicator variable taking the value 1 for cities lo-catedonhistoricsea oroceanports. Data onthehistorical locationof ports are from Acemoglu, Johnson, and Robinson (2005), sup-plemented by data in Magosci (1993) and Stillwell, MacDonald,and McAllister (1976), and the sources cited in Dittmar (2010).The data in this article supplements Acemoglu, Johnson, andRobinson (2005) by coding for cities that were historically portson the Baltic(e.g., St. Petersburg, Gdansk, Kaliningrad, Szczezin,Rostock, and Lubeck) and Mediterranean and Black Sea portsomitted in Acemoglu, Johnson, and Robinson (2005): Durres,Fano, Gaeta, Iraklion, Kerch, Korinthos, Malaga, Pozzuoli, Tra-pani, and Vlora. Similarly, the coding here reflects the fact thatRota and Sanlucar de Barrameda had Atlantic ports.
Atlantic Port, Mediterranean Port, and Baltic Port are indica-tors taking the value of 1 for cities with ports on these bodies ofwater. Black Sea ports are classed as Mediterranean.
Navigable River is anindicatorvariabletakingthevalue1 forcities locatedon historically navigable inlandwaterways. Data onnavigable rivers are drawn from Magosci (1993), Pounds (1979,1990), Livet (2003), Cook and Stevenson (1978), Graham (1979),Stillwell, MacDonald, and McAllister (1976), and de Vries, Janand van der Woude (1997). The coding captures the principalhistoricallynavigablewaterways anddoes not class as “navigable”waterways that required substantial improvements and becamenavigableonlyovertheearlymodernera. Somecities onnavigablerivers were also sea or ocean ports.
Freedom Index is the DeLong and Shleifer (1993) indexof regional institutions. DeLong and Shleifer class institutionsas either promoting relatively unrestrained and autocratic rule(prince, index value 0) or as securing relative freedom (free, indexvalue 1). The DeLong–Shleifer coding is here extended to Polandand the Ottoman Europe, neither of which meet the criteria for
at London School of econom
ics on January 24, 2012http://qje.oxfordjournals.org/
Dow
nloaded from

IT AND ECONOMIC CHANGE 1167
classification as free between 1300 and 1850 (this is confirmed byDeLong).
Capital is an indicator variable taking the value 1 for citiesthat were historically national capitals. For instance, Madrid wasnot a capital through 1500 (Phillip II moved the court to Madridand made it his capital only in 1561). Similarly, Berlin is takenas a capital from 1700 (Berlin became the capital of Prussiain 1701). Likewise, Krakow was Poland’s capital through 1596,when Sigismund III moved the capital of the Polish-LithuanianCommonwealth to Warsaw. In contrast, London and Paris werecapitals in all periods examined in the econometric analysis.
Executive Constraint is the historical coding of the Polity-IVindexofconstraints onarbitraryexecutiveauthority. Thedataarefrom Acemoglu, Johnson, and Robinson (2002, 2005).
Table A.1 provides summary statistics for these variables forall cities and for the balanced panel of cities with population dataobserved every 100 years 1300–1800.
APPENDIX TABLE A.1SUMMARY STATISTICS
Unbalanced Panel Balanced Panel
(1) (2) (3) (4) (5)Variable Mean s.d. Mean s.d.
Adopt Print 1450–1500 0.09 0.29 0.41 0.49Editions Per Capita 11.59 121.90 102.41 377.19Roman Site 0.15 0.36 0.41 0.49Atlantic Port 0.05 0.22 0.11 0.31Mediterranean Port 0.03 0.18 0.09 0.29Baltic Port 0.00 0.07 0.03 0.17Navigable River 0.06 0.24 0.25 0.44Distance to Amsterdam 983.53 590.26 778.81 470.92Distance to London 1, 101.86 653.11 879.86 560.77Distance to Mainz 1, 192.21 711.41 989.34 577.05Distance to Paris 1, 045.17 668.84 849.23 505.06Distance to Venice 1, 011.99 531.73 856.86 433.06Distance to Wittenberg 1, 093.61 564.61 912.31 487.20Population 1300 11.84 16.47 18.53 22.77Population 1400 11.97 21.00 18.83 27.10Population 1500 10.73 15.83 19.92 24.20Population 1600 11.60 20.91 27.39 38.58Population 1700 10.56 28.49 32.78 62.16Population 1800 12.02 31.10 44.92 89.98Ln Population Growth 1300–1400 −0.04 0.63 0.01 0.57Ln Population Growth 1400–1500 0.18 0.53 0.13 0.55Ln Population Growth 1500–1600 0.27 0.53 0.26 0.55
at London School of econom
ics on January 24, 2012http://qje.oxfordjournals.org/
Dow
nloaded from

1168 QUARTERLY JOURNAL OF ECONOMICS
APPENDIX TABLE A.1(CONTINUED)
Unbalanced Panel Balanced Panel
(1) (2) (3) (4) (5)Variable Mean s.d. Mean s.d.
Ln Population Growth 1600–1700 0.00 0.61 0.06 0.57Ln Population Growth 1700–1800 0.56 0.66 0.31 0.50Capital 1300 0.01 0.10 0.02 0.16Capital 1400 0.02 0.12 0.02 0.16Capital 1500 0.01 0.09 0.02 0.16Capital 1600 0.01 0.09 0.02 0.16Capital 1700 0.01 0.08 0.03 0.17Capital 1800 0.00 0.06 0.02 0.16University 1300 0.04 0.19 0.06 0.25University 1400 0.07 0.25 0.12 0.32University 1500 0.10 0.30 0.18 0.39University 1600 0.09 0.29 0.24 0.43University 1700 0.08 0.27 0.26 0.44University 1800 0.06 0.24 0.29 0.45Freedom Index 1300 0.41 0.49 0.47 0.50Freedom Index 1400 0.42 0.49 0.47 0.50Freedom Index 1500 0.17 0.38 0.21 0.41Freedom Index 1600 0.11 0.31 0.21 0.41Freedom Index 1700 0.17 0.37 0.15 0.36Freedom Index 1800 0.11 0.31 0.15 0.36
Note. The balanced panel comprises 202 cities with populations observed every 100 years 1300–1800.The unbalanced panel comprises 498 cities with population observed in 1300, 400 cities in 1400, 631 cities in1500, 897 cities in 1600, 1,169 cities in 1700, and 2,113 cities in 1800. For time-invariant city characteristics,summary statistics for the unbalanced panel are calculated over 2,202 cities. City populations are inthousands. Distances are in kilometers. Editions per capita measures editions published 1450–1500 per10,000 inhabitants in 1500.
AMERICAN UNIVERSITY
SUPPLEMENTARY MATERIAL
An Online Appendix for this article can be found at QJEonline (qje.oxfordjournals.org).
REFERENCES
Acemoglu, Daron, Simon Johnson, and James Robinson, “The Rise of Europe:Atlantic Trade, Institutional Change and Economic Growth,” American Eco-nomic Review, 95 (2005), 546–579.
, “The Rise of Europe,” NBER Working Paper 9378 (2002).Aguera y Arcas, Blaise, “Computational Analytical Bibliography,” Paper pre-
sented at Bibliopolis Conference The future history of the book, The
at London School of econom
ics on January 24, 2012http://qje.oxfordjournals.org/
Dow
nloaded from

IT AND ECONOMIC CHANGE 1169
Hague (Netherlands), Koninklijke Bibliotheek (2002). Available online athttp://bibliopoliscongres2002.kb.nl/aguera.html.
Aguera y Arcas, Blaise, and Adrienne Fairhall, “Archaeology of Type: PrintingTechnology Co-evolved with the Written Representation of Language,” Na-ture, 411 (2001), 997.
Allen, Robert, “Progress and Poverty in Early Modern Europe,” Economic HistoryReview, 56 (2003), 403–443.
, Wages, Prices & Living Standards: The World-HistoricalPerspective (2007). Available online at http://www.economics.ox.ac.uk/Members/robert.allen/WagesPrices.htm.
Bairoch, Paul, Cities and Economic Development (Chicago: University of ChicagoPress, 1988).
Bairoch, Paul, JeanBatouandPierreChevre, La Population Des Villes Europeenes(Geneva: Librarie Droz, 1988).
Barbier, Frederic, L’Europe De Gutenberg: Le Livre et L’Invention de la ModerniteOccidentale (Paris: Belin, 2006).
Baten, Jorg, and Jan Luiten van Zanden, “Book Production and the Onsetof Modern Economic Growth,” Journal of Economic Growth, 13 (2008),217–235.
Becker, Sascha O., and Ludger Woessmann, “Was Weber Wrong? A Human Capi-tal Theory of Protestant Economic History,” Quarterly Journal of Economics,124 (2009), 531–596.
Bolgar, R. R., “Education and Learning,” in The New Cambridge Modern History,Vol III: the Counter-Reformation and the Price Revoltion 1559–1610, ed. R.Wernham (Cambridge: Cambridge University Press, 1962).
Brady, Thomas A., German Histories in the Age of Reformations, 1400–1650(Cambridge: Cambridge University Press, 2009).
Braudel, Fernand, La Mediterranee et le Monde Mediterraneen A L’Epoque DePhillippe II, vol. 1 (Paris: Armand Colin, 1966).
, Civilisation, Economie et Capitalisme, vols. 1–3 (Paris: Armand Colin,1979a, 1979b, 1979c).
Cantoni, Davide, “The Economic Effects of the Protestant Reformation: Testingthe Weber Hypothesis in the German Lands,” Harvard University WorkingPaper (2009).
Cipolla, Carlo, “TheDiffusionofInnovationinEarlyModernEurope,”ComparativeStudies in Society and History, 14 (1972), 46–52.
Clair, Colin, A History of European Printing (London: Academic, 1976).Clark, Gregory, “The Secret History of the Industrial Revolution,” Working Paper,
UC Davis (2001)., “Lifestyles of the Rich and Famous: Living Costs of the Rich ver-
sus the Poor in England, 1209–1869,” Paper presented in conference, To-wards a global history of prices and wages (2004). Available online athttp://www.iisg.nl/hpw/papers/clark.pdf.
Cook, Chris, and John Stevenson, Longman Atlas of Modern British History(London: Longman, 1978).
Darby, H. C., ed., The New Cambridge Modern History, vol. 14 (Cambridge:Cambridge University Press, 1970).
de Vries, Jan, and A. M. van der Woude, The First Modern Economy: Success,Failure, and Perseverence of the Dutch Economy, 1500–1815 (Cambridge:Cambridge University Press, 1997).
deVries, Jan, European Urbanization 1500–1800 (Cambridge: HarvardUniversityPress, 1984).
DeLong, J. Bradford, and Andrei Shleifer, “Princes and Merchants: City Growthbefore the Industrial Revolution,” Journal of Law and Economics, 36 (1993),671–702.
Dittmar, Jeremiah E., “Cities, Markets, and Growth: The Emergence of Zipf’sLaw,” Working Paper (2010). Online at http://www.jeremiahdittmar.com.
Edwards, Mark U., Printing, Propaganda, and Martin Luther (Berkeley: Univer-sity of California Press, 1995).
Eisenstein, Elizabeth L., The Printing Press as an Agent of Change: Communi-cations and Cultural Transformations in Early-Modern Europe (Cambridge:Cambridge University Press, 1979).
at London School of econom
ics on January 24, 2012http://qje.oxfordjournals.org/
Dow
nloaded from
1170 QUARTERLY JOURNAL OF ECONOMICS
Fau, Guillaume, Sarah Saksik, Marie Smouts, and Sylvie Tisserand,“L’Imprimerie a Lyon au XVe siecle: un etat des lieux,” Revue Francaised’Histoire du Livre, 118–121 (2003), 191–276.
Febvre, Lucien, and Henri-Jean Martin, L’Apparition du Livre (Paris: AlbinMichel, 1958).
Flood, John, “The Book in Reformation Germany,” in The Reformation and theBook, ed. Jean-Francois Gilmont (Aldershot: Ashgate, 1998).
Fuhrman, Otto W., “The Invention of Printing,” in History of Books and Printing,ed. P. Winckler (Englewood: IHS, 1978).
Fussel, Stephan, Gutenberg and the Impact of Printing (Aldershot: Ashgate,2005).
Gilmont, Jean-Francois, “Les Centres de la Production Imprimee,” in Produzione eCommercio della Cart e del Libro, Secc. XIII–XVII, ed. Simonetta Cavaciocchi(Firenze: Le Monnier, 1992).
, “Printing at the Dawn of the Sixteenth Century,” in The Reformation andthe Book, ed. Jean-Francois Gilmont (Aldershot: Ashgate, 1998).
Gilmore, Myron P., The World of Humanism, 1453–1517 (New York: Harper,1952).
Glaeser, Edward, andAlbert Saiz, “TheSkilledCity,”NBERWorkingPaper10191(2003).
Glaeser, Edward, Jose Scheinkman, and Andrei Shleifer, “Growth in aCross-Section of Cities,” Journal of Monetary Economics, 36 (1995),117–143.
Glomski, Jacqueline, “Incunabula Typographiae: Seventeenth Century Views onEarly Printing,” Library Transactions of the Bibliographical Society, 7 (2001),336–348.
Goldthwaite, Richard A., “Schools and Teachers of Commercial Arithmetic inRenaissance Florence,” Journal of European Economic History, 1 (1972), 418–433.
Graham, Brian, “The Evolution of Urbanization in Medieval Ireland,” Journal ofHistorical Geography, 5 (1979), 111–125.
Grendler, Paul F., “Schooling in Western Europe,” Renaissance Quarterly, 45(1990), 775–787.
Hohenberg, Paul M., and Lynn H. Lees, The Making of Urban Europe, 1000–1950(Cambridge: Harvard University Press, 1985).
Hoock, Jochen, “Professional Ethics and Commercial Rationality at the Beginningof the Modern Era,” in The Self-Perception of Early Modern Capitalists, ed.Margaret C. Jacob and Catherine Secretan (New York: Palgrave Macmillan,2008).
Hoock, Jochen, and Pierre Jeannin, Ars Mercatoria: Handbucher und Traktatefur den Gebrauch des Kaufmanns: 1470–1820: Eine Analytische Bibliographie(Band I–III) (Paderborn: Schoningh, 1991, 2001, 2007).
ISTC, Incunabula Short Title Catalogue (London: British Library, 1998).Jedin, Hubert, Keneth S. Latourette and Jochen Martin, Atlas Zur Kirchen-
Geschichte (Freiburg: Herder, 1970).Jones, Charles I., andPaul M. Romer, “NewKaldorFacts: Ideas, Institutions, Pop-
ulation, and Human Capital,” American Economic Journal: Macroeconomics,2 (2010), 224–245.
Jones, Eric L., The European Miracle: Environments, Economics, and Geopoliticsin the History of Europe and Asia (Cambridge: Cambridge University Press,1981).
Kremer, Michael R., “The O-Ring Theory of Economic Development,” The Quar-terly Journal of Economics, 108 (1993), 551–575.
Livet, Georges (2003), Histoire des routes et des transports en Europe: Deschemins de Saint-Jacques a l’age d’or des diligences, Strasbourg; PressesUniversitaires de Strasbourg.
Long, Pamela O., “The Openness of Knowledge: An Ideal and Its Context in 16th-Century Writings on Mining and Metallurgy,” Technology and Culture, 32(1991), 318–355.
Lucas, Robert E., “Ideas and Economic Growth,” Economica, 76 (2009), 1–19.
at London School of econom
ics on January 24, 2012http://qje.oxfordjournals.org/
Dow
nloaded from

IT AND ECONOMIC CHANGE 1171
Lutz, J., “Die Ehemaligen Eisenhammer und Huttenweke,” Mitteilungen ausForstwirtschaft und Forstwissenschaft, 3 (1941), 277–294.
Magosci, Paul R., Historical Atlas of East Central Europe (Seattle: University ofWashington Press, 1993).
Mokyr, Joel, “Long-Term Economic Growth and the History of Technology,” inThe Handbook of Economic Growth, vol. 1B, ed. P. Aghion et al. (Amsterdam:Elsevier, 2005).
—— , “Urbanization, Technological Progress, and Economic History,” in UrbanAgglomeration and Economic Growth, ed. Herbert Giersch (Berlin: Springer,1995).
Neddermeyer, Uwe, “Why Were There No Riots of the Scribes?” Gazette du livremedieval, 31 (1997), 1–8.
Nicholas, David, Urban Europe, 1100–1700 (London: Palgrave Macmillan, 2003).Nieto, Philippe, “Geographie des Impressions Europeenes au XVe Siecle,” Revue
Francaise d’Histoire du Livre, 118–121 (2003), 125–173.Platter, Thomas, The Autobiography of Thomas Platter: A Schoolmaster of the
Sixteenth Century (London: Wertheim, 1839).Pounds, Norman (1990), An Historical Geography of Europe, Cambridge:
Cambridge University Press.Pounds, Norman (1979), An Historical Geography of Europe, 1500–1840,
Cambridge: Cambridge University Press.Reske, Christophe, Die Buchdrucker des 16. und 17. Jahrhunderts im deutschen
Sprachgebiet (Weisbaden: Harrassowitz Verlag, 2007).Rey, Javier D., “Reading Luca Pacioli’s Summa in Catalonia,” Historia Mathemat-
ica, 33 (2006), 43–62.Rice, Eugene F., The Foundations of Early Modern Europe (New York: Norton,
1994).Roberts, John M., A History of Europe (London: Penguin, 1996).Romer, Paul M., “Endogenous Technological Change,” Journal of Political Econ-
omy, 98 (1990), S71–S102.Scott, Tom, Society and Economy in Germany 1300–1600 (New York: Palgrave,
2002).Smith, Woodruff D., “The Function of Commercial Centers in the Modern-
ization of European Capitalism: Amsterdam as an Information Exchangein the Seventeenth Century,” Journal of Economic History, 44 (1984),985–1005.
Sombart, Werner, “Medieval and Modern Commercial Enterprise,” in Enterpriseand Secular Change, ed. F. Lane (Homewood, IL: Irwin, 1957).
Speisser, Maryvonne, “Les manuels d’arithmetique pour les marchands dans laFrance du XVe siecle,” Bulletin de l’APMEP, 444 (2003), 32–50.
Stillwell, Richard, William L. MacDonald, and Marian H. McAllister, eds., Prince-ton Encyclopedia of Classical Sites (Princeton: Princeton University Press,1976).
Stock, James H., and Motohiro Yogo, “Testing for Weak Instruments in Linear IVRegression,” NBER Technical Working Paper 284 (2002).
Swetz, Frank J., Capitalism and Arithmetic: The New Math of the 15th Century(La Salle, IL: Open Court, 1987).
Varry, D., “Lyons’ Printers and Booksellers from the Fifteenth to the NineteenthCentury,” in Printed Matters: Printing, Publishing and Urban Culture inEurope in the Modern Period, ed. Malcolm Gee and Tom Kirk (Farnham:Ashgate, 2002).
Weber, Max, General Economic History (NewBrunswick: Transaction, 1927 [1981reprint]).
Weitzman, Martin L., “Recombinant Growth,” Quarterly Journal of Economics,113 (1998), 331–360.
Woods, Robert, “Rural-Urban Mortality Differentials: An Unresolved Debate,”Population and Development Review, 29 (2003), 29–46.
Wright, William, “TheNatureof EarlyCapitalism,”in Germany: A New Social andEconomic History, 1450–1630, ed. Bob Scribner (London: Arnold, 1996).
Zanden, Jan Luiten van, The Long Road to the Industrial Revolution: TheEuropean Economy in a Global Perspective, 1000–1800 (Leiden: Brill, 2009).
at London School of econom
ics on January 24, 2012http://qje.oxfordjournals.org/
Dow
nloaded from

1172 QUARTERLY JOURNAL OF ECONOMICS
——, “Common Workmen, Philosophers and the Birth of the EuropeanKnowledge Economy,” Paper for Global Economic History Network con-ference, Useful Knowledge (2004). Online at www.iisg.nl/research/jvz-knowledge economy.pdf.
Zaret, David, Origins of Democratic Culture: Printing, Petitions, and the PublicSphere in Early-modern England (Princeton: Princeton University Press,2000).
at London School of econom
ics on January 24, 2012http://qje.oxfordjournals.org/
Dow
nloaded from